")
Back to Journals » International Journal of General Medicine » Volume 14
Factors Influencing Renal Parenchymal Stiffiness in Patients with Diabetic Nephropathy
Authors Fang JX, Chen XY, Yang QM, Xue MH
Received 16 March 2021
Accepted for publication 29 April 2021
Published 18 May 2021 Volume 2021:14 Pages 1911—1917
DOI https://doi.org/10.2147/IJGM.S311420
Checked for plagiarism Yes
Review by Single anonymous peer review
Peer reviewer comments 2
Editor who approved publication: Dr Scott Fraser
Jian-Xiu Fang, Xiao-Yan Chen, Qing-Mei Yang, Meng-Hua Xue
Department of Ultrasound, Shanxi Bethune Hospital, Shanxi Academy of Medical Sciences, Taiyuan, 030032, People’s Republic of China
Correspondence: Jian-Xiu Fang
Department of Ultrasound, Shanxi Bethune Hospital, Shanxi Academy of Medical Sciences, No. 99 Longcheng Street, Xiaodian District, Taiyuan, Shanxi Province, 030032, People’s Republic of China
Tel/ Fax +86 139 34534690
Email [email protected]
Objective: Glomerulosclerosis and tubulointerstitial fibrosis are associated with lower renal parenchymal resilience. The purpose of this study is to determine the factors influencing renal resilience in patients with diabetic nephropathy (DN).
Methods: We recruited 56 healthy volunteers and 187 patients with DN. All the participants were evaluated using shear-wave elastography (SWE), and the size of their kidneys and Young’s modulus values for the parenchyma were recorded. A total of 187 patients with DN are allocated to three groups according to their urinary albumin-to-creatinine ratio: normoalbuminuric (< 30 mg/g creatinine), microalbuminuric (30– 300 mg/g), and macroalbuminuric (≥ 300 mg/g) groups. Renal resilience is compared between the stages of diabetic nephropathy and the healthy control group, and the factors affecting the stiffiness of the renal parenchyma in DN are analyzed.
Results: The renal parenchyma is harder in participants with DN than in healthy participants (P < 0.001), and the stiffiness increases with the progression of the disease (P < 0.001). Multivariate logistic regression analysis shows that disease stage (β = 0.789, P < 0.001), duration of diabetes (β = 0.028, P < 0.001), and serum creatinine (SCr) concentration (β = 0.001, p < 0.001) influence the stiffiness of the renal parenchyma.
Conclusion: We show that SWE can be used to measure changes in the stiffiness of the renal parenchyma in patients with DN. Furthermore, Young’s modulus of the renal parenchyma is related to the duration of diabetes, urinary albumin excretion, and SCr concentration. Thus, SWE can be used to objectively and non-invasively stage DN.
Keywords: diabetic nephropathy, shear-wave elastography, Young’s modulus, parenchymal stiffiness
Introduction
Kidney disease is a major complication in patients with long-term type 2 diabetes mellitus (DM). Early kidney damage in diabetic nephropathy (DN) can be controlled or even reversed; however, renal function is seriously impaired once it develops into advanced DN and currently has no effective treatment.1 The amount of urinary albumin/protein and estimated glomerular filtration rate (or serum creatinine) is the gold-standard method for diagnosing and staging DN.2,3 However, because these parameters are affected by many factors and cannot be widely used for the early diagnosis of DN, there is a need for identifying a safe, simple, non-invasive, accurate, and reproducible method for the early diagnosis of DN.
Shear-wave elastography (SWE) recently became an established and non-invasive technique for measuring tissue stiffiness. The method is approved by the Food and Drug Administration for the assessment of liver disease and has high sensitivity and specificity for the differentiation between normal and cirrhotic livers.4 Furthermore, recent studies showed that this technique can also be used to evaluate renal fibrosis and to stage chronic nephropathy.5–8 In the present study, the SWE technique was used to assess changes in renal stiffiness in patients with different stages of DN. The relationships between renal parenchymal stiffiness and SCr, BUN, glycosylated hemoglobin, and the duration of diabetes were also assessed.
Materials and Methods
Research Objective
Patients who were diagnosed with type 2 DM at Shanxi Bethune Hospital (China) between July 2017 and December 2019 were recruited. The inclusion criteria were as follows: DN had been diagnosed by a nephrologist based on retinal changes and other diagnostic indicators.9,10 The exclusion criteria were as follows: (1) the presence of another primary kidney disease; (2) pregnancy or lactation; (3) the presence of severe psychiatric disease; (4) the presence of a malignant tumor that could not be cured or required chemotherapy or radiation therapy; (5) the presence of coronary artery disease or a history of myocardial infarction, significant cardiac valvular disease, respiratory or heart failure, or renal arterial stenosis. According to their urinary albumin-to-creatinine ratio (ACR), the participants were allocated into three groups: a normoalbuminuric group (Mogensen I or II, ACR <30 mg/g), a microalbuminuric group (Mogensen III, ACR 30–300 mg/g), and a macroalbuminuric group (Mogensen IV or V, ACR ≥300 mg/g). This study followed the recommendations set out in the ethical principles published in the Declaration of Helsinki, developed by the World Medical Association (WMA).
The study was conducted in accordance with the Declaration of Helsinki (as was revised in 2013). The study was approved by Ethics Committee of the Shanxi Bethune Hospital. Informed consent was explained in detail to patients, who were enrolled only after providing written consent for doing so.
Clinical Data Recording
The detailed medical histories of all the participants were collected, and their age, sex, blood pressure, and duration of diabetes were recorded.
Laboratory Measurements
After fasting for 12 h, fasting venous blood samples were obtained for the measurement of SCr, BUN, and glycosylated hemoglobin A1c (HbA1c). We calculated the estimated glomerular filtration rate (eGFR) using the Modification of Diet in Renal Disease formula (eGFR (mL/(min*1.73m2))=175×(Scr)^-1.154×(age)^-0.203×(0.742 for female)).
Shear-Wave Elastography
Shear-wave elastography was performed using a curved 2–5 MHz broadband transducer and a two-port Aixplorer ultrasound system (Supersonic Imagine, Paris, France). Images were obtained after a minimum of 6 h of fasting and at least 20 min of rest. Renal ultrasonography (USG) was performed in the right lateral decubitus position. The least possible compression was applied to the probe during USG. The probe was placed in a stable position, and the participants were asked to hold their breath for a few seconds to minimize kidney movement with respiration. Measurements were made after the selection of a region of interest (ROI) in renal cortical areas that lacked vessels or cysts on conventional renal USG images (Figure 1). The main axis of the ROI was adjusted to be parallel to the axis of a renal pyramid (vertical to the kidney surface). The ROI target distance was a maximum of 8 cm and it was 1 cm square in size. Eight-to-twelve measurements were made per participant and a median SWE value was recorded as Young’s modulus (YM) value in kPa (Figure 1).
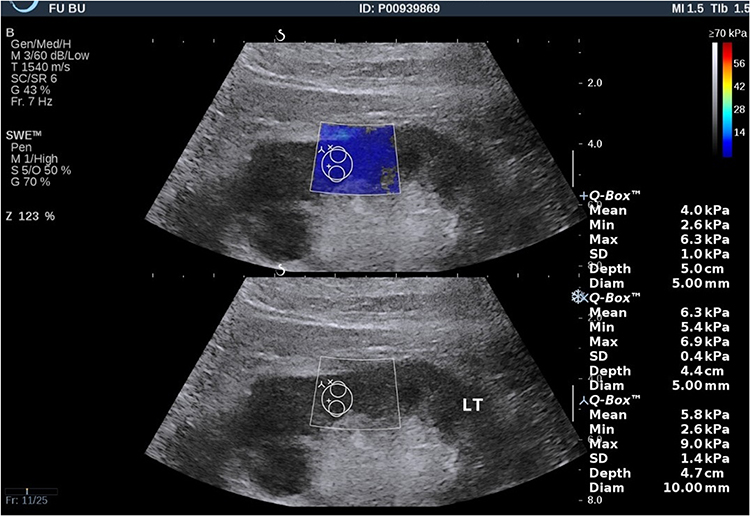 |
Figure 1 Estimation of Young’s modulus using shear-wave elastography in a kidney. The region of interest box was placed in the mid portion of the right renal cortex. On the right is the normal shear-wave velocity, measured in real time the maximum elastic value (Emax), average elastic value (Emean), minimum elastic value (Emin). |
The YM values were calculated using Aixplorer software under the assumption that the target tissue would be at body temperature, and using the formula E = ρ × c2, where E is tissue resilience in kPa, ρ is tissue density in kg/m3, and c is the shear-wave velocity in m/s.11 The participants were evaluated by conventional and SWE examinations by a single radiologist who had more than five years’ experience of SWE studies and had conducted at least 500 SWE procedures annually. Each USG examination lasted approximately 25–30 min. In this way, we obtained the maximum elastic value (Emax), mean elastic value, and minimum elastic value of the kidney.
Statistical Analysis
All analyses were performed using the SPSS Statistics 22.0 software package (IBM Corp., Armonk, NY, USA). The distributions of continuous variables were evaluated for normality using the Kolmogorov–Smirnov test. Continuous variables are presented as mean ± standard deviation. The independent samples t-test was used to compare the differences between two groups and a one-way analysis of variance was used to compare the differences between multiple groups. Multiple linear regression was used to identify the factors influencing renal parenchymal stiffiness. Statistical significance was defined as P < 0.05.
Results
Differences in the Clinical and Laboratory Parameters Among the Four Groups
One-way ANOVA was used to compare the general data between the control group and diabetic nephropathy group. The results showed that there were no significant differences in age and BMI between the two groups (P >0.05). Other general information indicators showed statistically significant differences between groups, and further comparison of differences between groups by LSD-t test showed that HbA1c indicators showed an increasing trend among groups, with statistically significant differences among all groups (P <0.05).
Sex, age, and body mass index did not significantly differ between the normoalbuminuric, microalbuminuric, macroalbuminuric, and control groups (P > 0.05). The HbA1c and the duration of diabetes tended to increase with the degree of albuminemia, and there were significant differences among the groups in this regard (P < 0.05). The SCr concentration in the macroalbuminuric group was significantly higher than that in the other groups (P < 0.05) but there were no significant differences in this regard among the other groups (P > 0.05). The BUN and ACR values in the microalbuminuric and macroalbuminuric groups were significantly higher than in the control and normoalbuminuric groups, and there was a significant difference between the microalbuminuric and macroalbuminuric groups (P < 0.05). There was a significant difference in eGFR between the normoalbuminuric group and the other groups (P < 0.05) (Table 1).
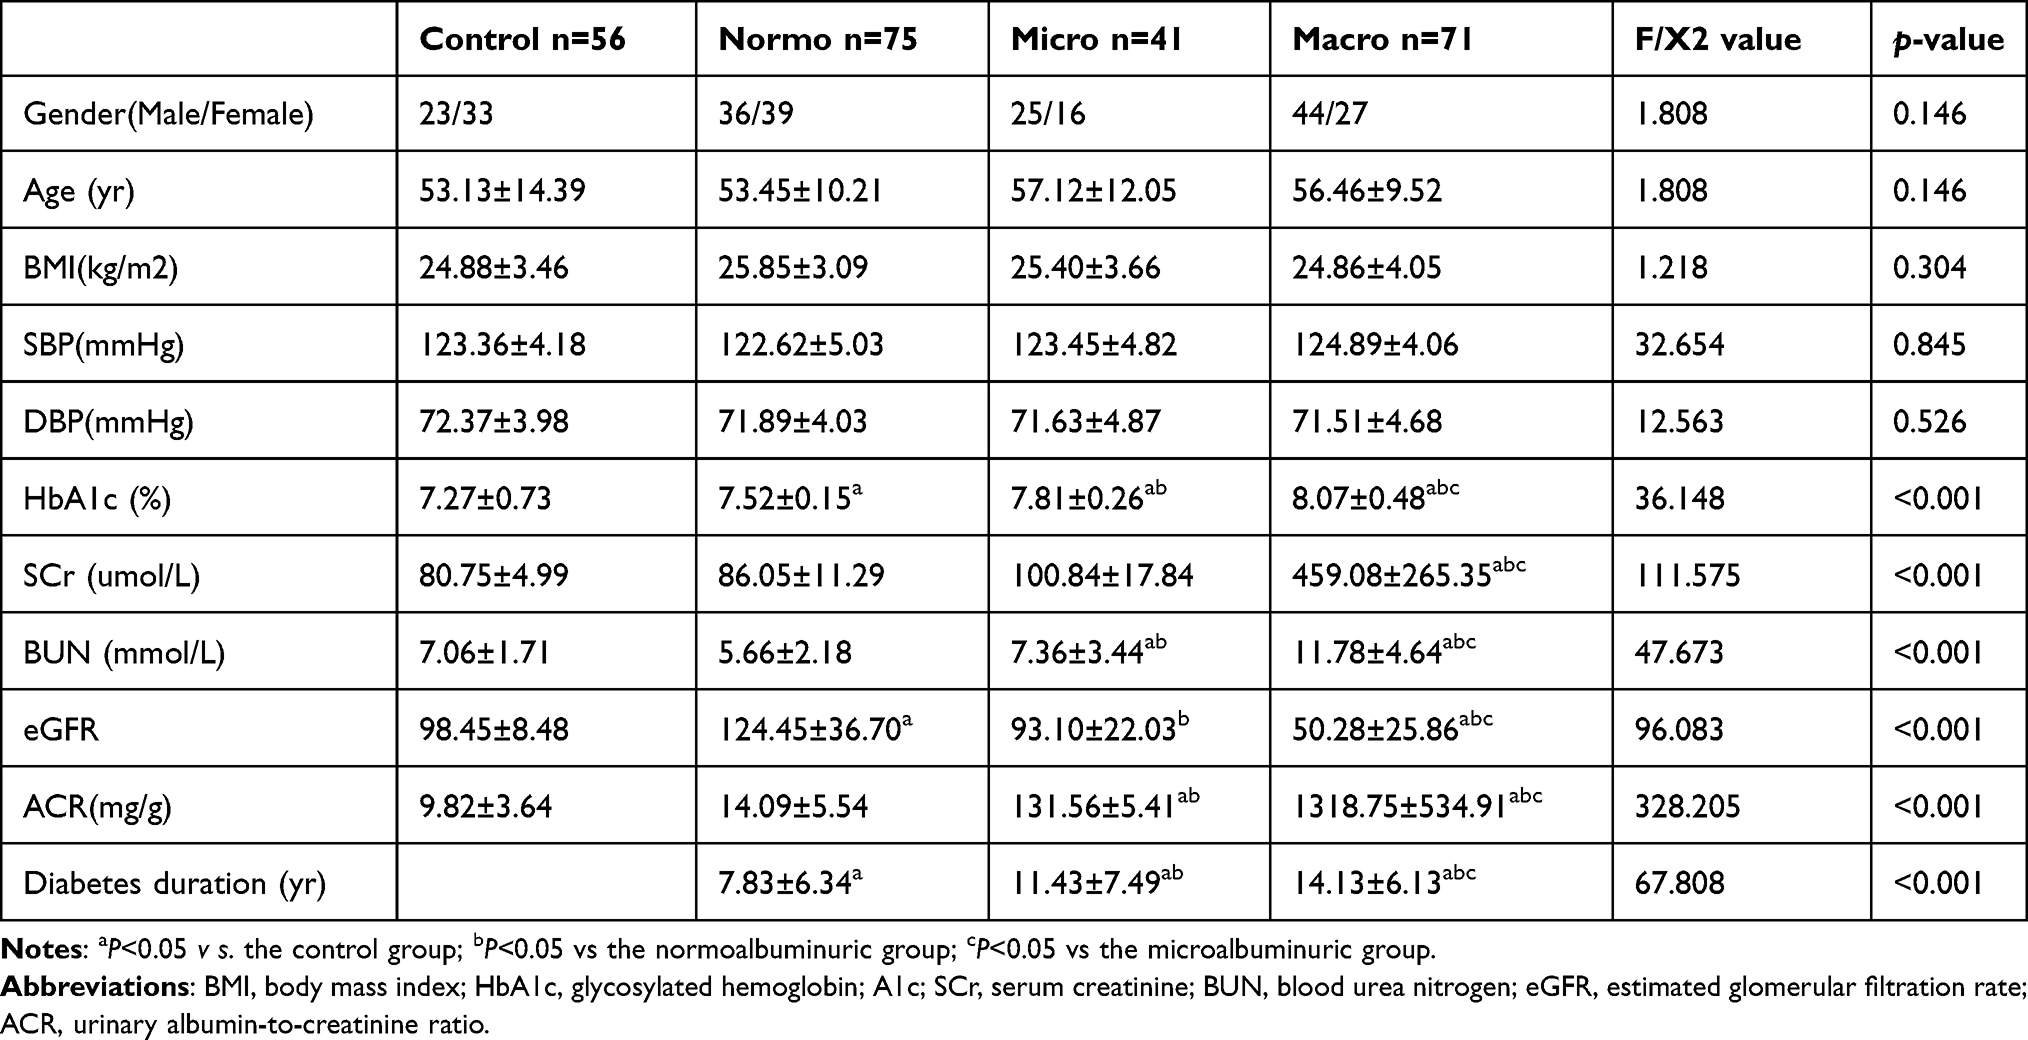 |
Table 1 Clinical and Laboratory Parameters in the Diabetic Nephropathy and Control Groups |
Renal Stiffiness in Control Participants and Those with Diabetic Nephropathy
One-way ANOVA was used to compare the renal parenchymal elasticity parameters between the control group and diabetic nephropathy group, and further LSD-T multiple test was conducted. The results showed that: The YM values were successfully acquired for all the participants. These values were higher in the DN groups than in the control group but there was no significant difference between the normoalbuminuric and control groups (P > 0.05). The YM value was significantly higher in the microalbuminuric and macroalbuminuric groups than in the control group (P < 0.05). The YM value of the middle parenchyma of the left kidney in the macroalbuminuric group was higher than in the other three groups (P < 0.05). Comparisons between pairs of subgroups showed that as renal function decreased, the YM value increased significantly (Tables 2 and 3).
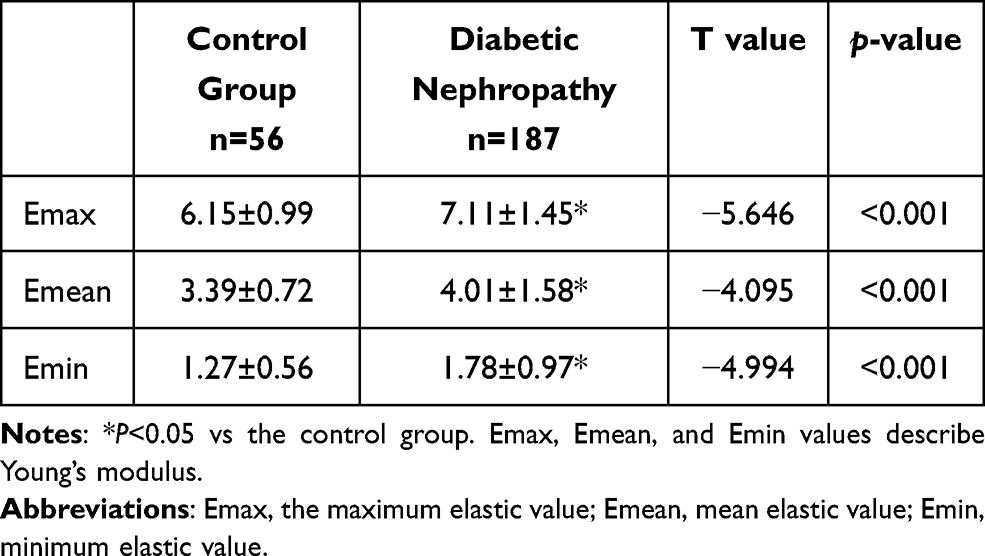 |
Table 2 Renal Hardness in Control Participants and Those with Diabetic Nephropathy |
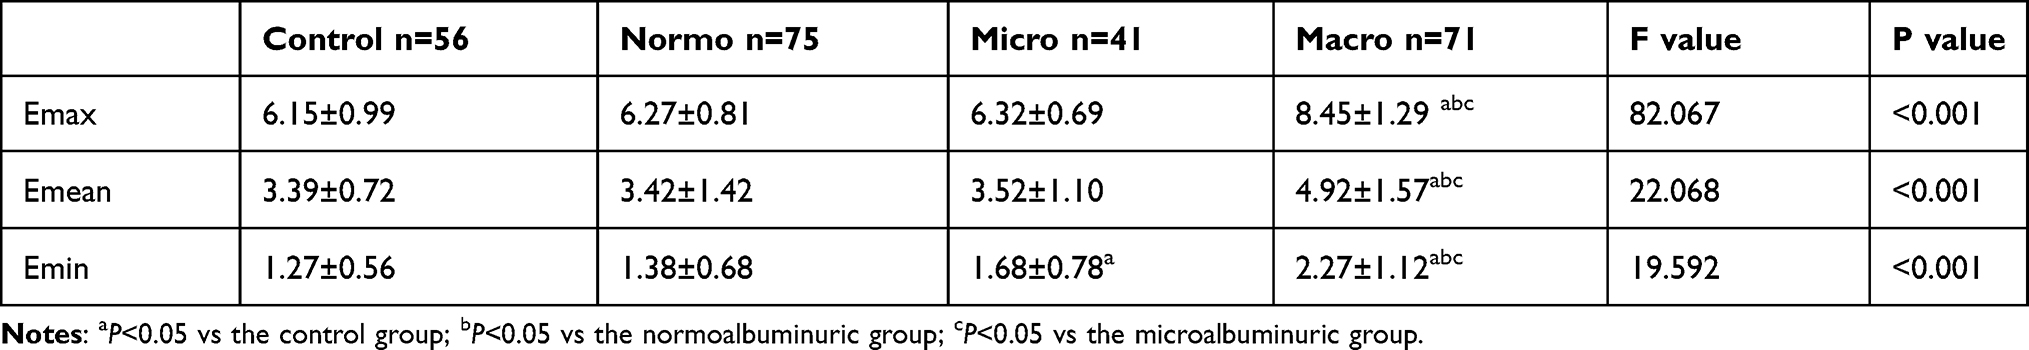 |
Table 3 Renal Parenchymal Hardness in the Groups of Participants |
Multivariable Linear Regression Analysis
We analyzed the factors that may potentially affect renal parenchymal stiffiness using multiple stepwise linear regression. The potentially confounding factors included in the analysis were the duration of diabetes, disease stage, BUN, HbA1c, eGFR, and SCr. We found that the duration of diabetes (β = 0.028, P < 0.001), disease stage (β = 0.798, P < 0.001), and SCr (β = 0.001, P < 0.001) were independently associated with renal parenchymal Emax (Table 4).
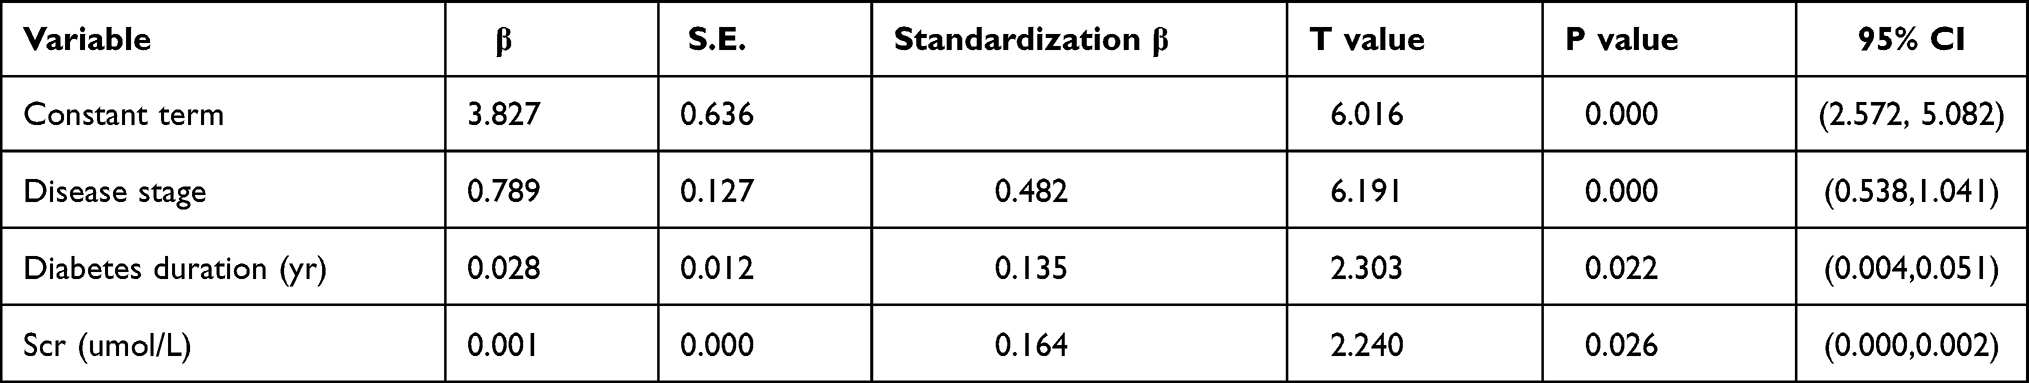 |
Table 4 Multivariable Linear Regression Analysis Data |
Discussion
Diabetic nephropathy is one of the most significant complications of diabetes and is directly related to disease progression.12 The early diagnosis of nephropathy is important to achieve a good prognosis for patients with diabetes. Clinically, DN is characterized by a progressive increase in albuminuria, a decrease in GFR, an increase in blood pressure, and a higher risk of renal failure. In addition, advanced DN is characterized by morphological changes in the kidney including varying degrees of fibrosis.13,14 For decades, the assessment of kidney disease has been based on a variety of methods including ultrasonography, computed tomography, magnetic resonance imaging, and biochemical analyses. However, although the stage of DN can be evaluated using routine biochemical tests, such as urinary protein and SCr concentrations, the assessment of the grade of renal fibrosis requires a renal biopsy, which is an invasive and expensive procedure that carries some risk and is not routinely performed.15–17 In contrast, SWE uses focused acoustic pulses to produce microscopic tissue displacement, which induces perpendicular shear waves that are tracked as they progress through tissue. Harder tissue is associated with higher shear-wave velocities. Estimates of tissue using YM, which is measured in kilopascals [kPa], can be derived from shear-wave velocity; in this instance, higher values correspond to a higher degree of fibrosis.18,19 Thus, SWE represents a simple tool for the assessment of the severity of chronic morphological changes based on cortical stiffiness measurements.
It has been reported that the renal pathology of patients with DN (glomerular basement membrane thickening, mesangial hyperplasia, glomerulosclerosis, tubular atrophy, and interstitial fibrosis) is progressive.20 The results of the present study show that compared with healthy people, the stiffiness of the renal parenchyma is higher in patients with DN, and the YM of the renal parenchyma increases with the disease stage. After DN develops, the glomeruli appear to harden, the renal tubules atrophy, and the basement membranes thicken, causing interstitial fibrosis. Together, these changes lead to fibrosis of the renal parenchyma and a further increase in stiffiness.21 It was previously reported that the YM value of the renal parenchyma in patients with chronic kidney disease is higher than in healthy people. According to Weitzel et al,22 the renal elastic modulus of patients who have undergone renal transplantation is three times higher than that of normal people, which is consistent with the results of the present study and relates to the increase in renal parenchymal stiffiness caused by renal tubular atrophy and interstitial fibrosis. Thus, renal parenchymal stiffiness can be used as a surrogate index for defining the DN stage.
In the current study, we showed that the YM value of the renal parenchyma increases gradually with the disease stage. Studies of rats and rabbits have shown direct correlations between renal cortical stiffiness and both renal fibrotic changes and a decline in renal function.23,24 In studies on transplanted kidneys, higher renal stiffiness was detected in cases of transplant rejection and in patients whose renal function rapidly deteriorated.25–35 The Mogensen stages of DN are associated with the following pathologies: stage I, acute glomerular hyperfiltration with no significant renal pathology; stage II, a slight thickening of the glomerular basement membrane; stage III, glomerular basement membrane thickening and mesangial widening; stages IV and V, glomerular lesions, particularly glomerulosclerosis, tubular atrophy, and interstitial fibrosis. Moon et al24 found that the elastic modulus of renal tissue, measured using SWE, positively correlated with the degree of renal fibrosis. At each stage of the progression of chronic kidney disease, the renal pathological changes worsen, and the stiffiness of the renal tissue increases. Therefore, SWE can be used as a simple, non-invasive, and practical technique for the quantitative evaluation of the degree of renal damage in patients with DN and help to better track its progression.
Existing studies revealed close correlations between cortical stiffiness and BUN, SCr, eGFR, urinary ACR, and urinary albumin concentration in patients with DN.36,37 The present study’s results are consistent with these findings. The longer the disease has been present, the higher the likelihood of the kidney showing microvascular changes and the more likely it is to develop DN. Additionally, the development of nephropathy in patients with long-term DM leads to harder parenchyma.38
In summary, SWE is an ultrasonic diagnostic technique that can be used in the study of DN. It provides an objective assessment of renal resilience or stiffiness; furthermore, renal resilience measured using SWE correlates well with the DN stage, to a degree that it can be used to predict the progression of renal dysfunction. Timely and accurate diagnosis of renal damage in patients with DN is very important for effectively controlling the progression of the disease.
The present study had significant limitations. First, the number of patients enrolled was small; therefore, future studies with larger participant samples are required. Second, the ROI size could not be reduced to permit the sampling of smaller renal volumes; therefore, this approach is not suitable for patients with a thin renal parenchyma layer. Third, we used the ACR reference standard to estimate the severity of chronic kidney disease (CKD); no biopsies were obtained for histological assessment because CKD is not a clinical indication for renal biopsy. This lack of histological assessment will be addressed in the next phase of our studies. Finally, we did not measure renal blood flow or the resistance index, which may have contributed to renal resilience in the participants.
In conclusion, the results of the present study show that SWE can be used to measure the renal parenchymal stiffiness of patients with DN and that YM values of the renal parenchyma are related to the duration of diabetes, urinary albumin excretion, and SCr concentration. Thus, SWE can be used to objectively and non-invasively stage DN in patients.
Acknowledgments
We are particularly grateful to all the people who have given us help on our article.
Disclosure
The authors report no conflicts of interest in this work.
References
1. Tain YL, Hsu CN. Developmental origins of chronic kidney disease: should we focus on early life? Int J Mol Sci. 2017;18(2):381. doi:10.3390/ijms18020381
2. Chen C, Wang C, Hu C, et al. Normoalbuminuric diabetic kidney disease. Front Med. 2017;11(3):310–318. doi:10.1007/s11684-017-0542-7
3. Futrakul N, Futrakul P. Biomarker for early renal microvascular and diabetic kidney diseases. Ren Fail. 2017;39(1):505–511. doi:10.1080/0886022X.2017.1323647
4. Chen S, Sanchez W, Callstrom MR, et al. Assessment of liver viscoresilience by using shear waves induced by ultrasound radiation force. Radiology. 2013;266(3):964–970. doi:10.1148/radiol.12120837
5. Ganau S, Andreu FJ, Escribano F, et al. Shear-wave elastography and immunohistochemical profiles in invasive breast cancer: evaluation of maximum and mean resilience values. Eur J Radiol. 2015;84(4):617–622. doi:10.1016/j.ejrad.2014.12.020
6. Veyrieres JB, Albarel F, Lombard JV, et al. A threshold value in Shear Wave elastography to rule out malignant thyroid nodules: a reality? Eur J Radiol. 2012;81(12):3965–3972. doi:10.1016/j.ejrad.2012.09.002
7. Rago T, Vitti P. Diagnostic role of ultrasound and elastosonography in nodular goiter. Best Pract Res Clin Endocrinol Metab. 2014;28(4):519–529. doi:10.1016/j.beem.2014.02.003
8. Jerums G, Panagiotopoulos S, Premaratne E, MacIsaac RJ. Integrating albuminuria and GFR in the assessment of diabetic nephropathy. Nat Rev Nephrol. 2009;5(7):397–406. doi:10.1038/nrneph.2009.91
9. American Diabetes Association. Standards of medical care in diabetes–2013. Diabetes Care. 2013;36 Suppl 1(Suppl 1):S11–S66. doi:10.2337/dc13-S011
10. Mogensen CE. Microalbuminuria, blood pressure and diabetic renal disease: origin and development of ideas. Diabetologia. 1999;42(3):263–285. doi:10.1007/s001250051151
11. Ferraioli G, Tinelli C, Dal Bello B, et al. Accuracy of real-time shear wave elastography for assessing liver fibrosis in chronic hepatitis C: a pilot study. Hepatology. 2012;56(6):2125–2133. doi:10.1002/hep.25936
12. Hovind P, Tarnow L, Rossing P, et al. Predictors for the development of microalbuminuria and macroalbuminuria in patients with type 1 diabetes: inception cohort study. BMJ. 2004;328(7448):1105. doi:10.1136/bmj.38070.450891.FE
13. KDOQI. KDOQI clinical practice guidelines and clinical practice recommendations for diabetes and chronic kidney disease. Am J Kidney Dis. 2007;49(2 Suppl 2):S12–S154. doi:10.1053/j.ajkd.2006.12.005
14. Gross JL, de Azevedo MJ, Silveiro SP, Canani LH, Caramori ML, Zelmanovitz T. Diabetic nephropathy: diagnosis, prevention, and treatment. Diabetes Care. 2005;28(1):164–176. doi:10.2337/diacare.28.1.164
15. Korbet SM. Percutaneous renal biopsy. Semin Nephrol. 2002;22(3):254–267. doi:10.1053/snep.2002.31713
16. Christensen J, Lindequist S, Knudsen DU, Pedersen RS. Ultrasound-guided renal biopsy with biopsy gun technique–efficacy and complications. Acta Radiol. 1995;36(3):276–279. doi:10.1177/028418519503600313
17. Chesney DS, Brouhard BH, Cunningham RJ. Safety and cost effectiveness of pediatric percutaneous renal biopsy. Pediatr Nephrol. 1996;10(4):493–495. doi:10.1007/s004670050146
18. Urban MW, Chen S, Fatemi MA. Review of Shearwave Dispersion Ultrasound Vibrometry (SDUV) and its applications. Curr Med Imaging Rev. 2012;8(1):27–36. doi:10.2174/157340512799220625
19. Kotlyar DS, Blonski W, Rustgi VK. Noninvasive monitoring of hepatitis C fibrosis progression. Clin Liver Dis. 2008;12(3):557–vi ii. doi:10.1016/j.cld.2008.03.006
20. Tervaert TW, Mooyaart AL, Amann K, et al. Pathologic classification of diabetic nephropathy. J Am Soc Nephrol. 2010;21(4):556–563. doi:10.1681/ASN.2010010010
21. Goya C, Kilinc F, Hamidi C, et al. Acoustic radiation force impulse imaging for evaluation of renal parenchyma resilience in diabetic nephropathy. AJR Am J Roentgenol. 2015;204(2):324–329. doi:10.2214/AJR.14.12493
22. Weitzel WF, Kim K, Rubin JM, Xie H, O’Donnell M. Renal advances in ultrasound resilience imaging: measuring the compliance of arteries and kidneys in end-stage renal disease. Blood Purif. 2005;23(1):10–17. doi:10.1159/000082005
23. Derieppe M, Delmas Y, Gennisson JL, et al. Detection of intrarenal microstructural changes with supersonic shear wave elastography in rats. Eur Radiol. 2012;22(1):243–250. doi:10.1007/s00330-011-2229-9
24. Moon SK, Kim SY, Cho JY, Kim SH. Quantification of kidney fibrosis using ultrasonic shear wave elastography: experimental study with a rabbit model. J Ultrasound Med. 2015;34(5):869–877.
25. Sommerer C, Scharf M, Seitz C, et al. Assessment of renal allograft fibrosis by transient elastography. Transpl Int. 2013;26(5):545–551. doi:10.1111/tri.12073
26. Arndt R, Schmidt S, Loddenkemper C, et al. Noninvasive evaluation of renal allograft fibrosis by transient elastography–a pilot study. Transpl Int. 2010;23(9):871–877. doi:10.1111/j.1432-2277.2010.01057.x
27. Lee J, Oh YT, Joo DJ, et al. Acoustic radiation force impulse measurement in renal transplantation: a prospective, longitudinal study with protocol biopsies. Medicine (Baltimore). 2015;94(39):e1590. doi:10.1097/MD.0000000000001590
28. Nakao T, Ushigome H, Nakamura T, et al. Evaluation of renal allograft fibrosis by transient elastography (Fibro Scan). Transplant Proc. 2015;47(3):640–643. doi:10.1016/j.transproceed.2014.12.034
29. Orlacchio A, Chegai F, Del Giudice C, et al. Kidney transplant: usefulness of real-time elastography (RTE) in the diagnosis of graft interstitial fibrosis. Ultrasound Med Biol. 2014;40(11):2564–2572. doi:10.1016/j.ultrasmedbio.2014.06.002
30. Gao J, Rubin JM. Ultrasound strain zero-crossing resilience measurement in assessment of renal allograft cortical stiffiness: a preliminary observation. Ultrasound Med Biol. 2014;40(9):2048–2057. doi:10.1016/j.ultrasmedbio.2014.04.002
31. Lukenda V, Mikolasevic I, Racki S, Jelic I, Stimac D, Orlic L. Transient elastography: a new noninvasive diagnostic tool for assessment of chronic allograft nephropathy. Int Urol Nephrol. 2014;46(7):1435–1440. doi:10.1007/s11255-014-0697-y
32. He WY, Jin YJ, Wang WP, Li CL, Ji ZB, Yang C. Tissue resilience quantification by acoustic radiation force impulse for the assessment of renal allograft function. Ultrasound Med Biol. 2014;40(2):322–329. doi:10.1016/j.ultrasmedbio.2013.10.003
33. Gao J, Min R, Hamilton J, et al. Corticomedullary strain ratio: a quantitative marker for assessment of renal allograft cortical fibrosis. J Ultrasound Med. 2013;32(10):1769–1775. doi:10.7863/ultra.32.10.1769
34. Kahn J, Slowinski T, Thomas A, Filimonow S, Fischer T. TSI ultrasound elastography for the diagnosis of chronic allograft nephropathy in kidney transplanted patients. J Ultrason. 2013;13(54):253–262. doi:10.15557/JoU.2013.0027
35. Gao J, Weitzel W, Rubin JM, et al. Renal transplant resilience ultrasound imaging: correlation between normalized strain and renal cortical fibrosis. Ultrasound Med Biol. 2013;39(9):1536–1542. doi:10.1016/j.ultrasmedbio.2013.04.007
36. Hassan K, Loberant N, Abbas N, Fadi H, Shadia H, Khazim K. Shear wave elastography imaging for assessing the chronic pathologic changes in advanced diabetic kidney disease. Ther Clin Risk Manag. 2016;12:1615–1622. doi:10.2147/TCRM.S118465
37. Yu N, Zhang Y, Xu Y. Value of virtual touch tissue quantification in stages of diabetic kidney disease. J Ultrasound Med. 2014;33(5):787–792. doi:10.7863/ultra.33.5.787
38. Shahbazian H, Rezaii I. Diabetic kidney disease; review of the current knowledge. J Renal Inj Prev. 2013;2(2):73–80. doi:10.12861/jrip.2013.24
 © 2021 The Author(s). This work is published and licensed by Dove Medical Press Limited. The full terms of this license are available at https://www.dovepress.com/terms.php and incorporate the Creative Commons Attribution - Non Commercial (unported, v3.0) License.
By accessing the work you hereby accept the Terms. Non-commercial uses of the work are permitted without any further permission from Dove Medical Press Limited, provided the work is properly attributed. For permission for commercial use of this work, please see paragraphs 4.2 and 5 of our Terms.
© 2021 The Author(s). This work is published and licensed by Dove Medical Press Limited. The full terms of this license are available at https://www.dovepress.com/terms.php and incorporate the Creative Commons Attribution - Non Commercial (unported, v3.0) License.
By accessing the work you hereby accept the Terms. Non-commercial uses of the work are permitted without any further permission from Dove Medical Press Limited, provided the work is properly attributed. For permission for commercial use of this work, please see paragraphs 4.2 and 5 of our Terms.