")
Back to Journals » International Journal of Chronic Obstructive Pulmonary Disease » Volume 16
Factors for the Variability of Three Acceptable Maximal Expiratory Flow–Volume Curves in Chronic Obstructive Pulmonary Disease
Authors Yamamoto M , Konno S, Makita H, Nitta K, Shimizu K, Suzuki M , Nishida M , Sugita J , Teshima T, Nishimura M
Received 2 October 2020
Accepted for publication 30 December 2020
Published 24 February 2021 Volume 2021:16 Pages 415—422
DOI https://doi.org/10.2147/COPD.S285086
Checked for plagiarism Yes
Review by Single anonymous peer review
Peer reviewer comments 2
Editor who approved publication: Dr Richard Russell
Masafumi Yamamoto,1 Satoshi Konno,2 Hironi Makita,2,3 Katsuaki Nitta,4 Kaoruko Shimizu,2 Masaru Suzuki,2 Mutsumi Nishida,1 Junichi Sugita,1 Takanori Teshima,1 Masaharu Nishimura2,3
1Division of Laboratory and Transfusion Medicine, Hokkaido University Hospital, Sapporo, Hokkaido, Japan; 2Department of Respiratory Medicine, Faculty of Medicine and Graduate School of Medicine, Hokkaido University, Sapporo, Hokkaido, Japan; 3Hokkaido Institute of Respiratory Diseases, Sapporo, Hokkaido, Japan; 4Makita Hospital, Sapporo, Hokkaido, Japan
Correspondence: Masaharu Nishimura
Department of Respiratory Medicine, Faculty of Medicine and Graduate School of Medicine, Hokkaido University, N-15 W-7, Kita-Ku, Sapporo, 060-8638, Japan
Tel +81-11-706-5911
Fax +81-11-706-7899
Email [email protected]
Background: Generally, the maximal expiratory flow–volume (MEFV) curve must be measured for the diagnosis and staging of chronic obstructive pulmonary disease (COPD). As this test is effort dependent, international guidelines recommend that three acceptable trials are required for each test. However, no study has examined the magnitude and factors for the variability in parameters among three acceptable trials.
Methods: We evaluated the intra-individual variations in several parameters among three acceptable MEFV curves obtained at one-time point in patients with COPD (n = 28, stage 1; n = 36, stage 2; n = 21, stages 3– 4). Next, the factors for such variations were examined using forced expiratory volume in 1 second (FEV1) and forced vital capacity (FVC).
Results: The averages of coefficient of variation (CV) for FEV1 and FVC were 2.0% (range: 1.0– 3.0%) and 1.6% (0.9– 2.2%), respectively. Both parameters were significantly better than peak expiratory flow rate, forced expiratory flow at 50% of expired FVC, and forced expiratory flow at 75% of expired FVC (CVs: 5.0– 6.9%). A higher spirometric stage was significantly associated with higher CVs for FVC and FEV1, and older age was significantly correlated with a higher variation in FEV1 alone. Furthermore, a significantly inverse association was observed between emphysema severity, and the CVs for FEV1, but not that for FVC, regardless of spirometric stage.
Conclusion: Both FVC and FEV1 are highly reproducible; nevertheless, older age, lower FEV1 at baseline, and non-emphysema phenotype are factors for a higher variability in FEV1 in patients with COPD.
Keywords: chronic obstructive pulmonary disease, coefficient of variation, flow–volume curve, forced expiratory volume in 1 second, variability
Introduction
Chronic obstructive pulmonary disease (COPD) is characterized by persistent airflow limitation that is not completely reversible.1,2 Generally, the assessment of airflow limitation is based on spirometric testing with maximal expiratory flow–volume (MEFV) curve. Forced expiratory volume in 1 second (FEV1), forced expiratory volume (FVC), and FEV1/FVC, all of which are derived from the MEFV curve, are the most important variables in the diagnosis and staging of COPD. However, the test has some inherent challenges. That is, it requires cooperation and maximal effort from participants. The American Thoracic Society (ATS)/European Respiratory Society (ERS) Task Force (TF)3 and the Japanese Respiratory Society (JRS)4 established the guidelines on spirometry. These recommendations show that to appropriately collect data, at least three acceptable MEFV trials are required for each test.
Several classical studies5–13 have evaluated between-day variability, within-day variability, and serial-measurement variability in parameters derived from MEFV curves in patients with COPD and healthy participants. There is a consensus that forced vital capacity (FVC) and forced expiratory volume in 1 second (FEV1) are highly reproducible within an acceptable range. However, to the best of our knowledge, no study has examined the magnitude of variability and the factors for such variability in these parameters among three acceptable MEFV curves in patients with COPD. We believe that this study can provide important information that can be used when interpreting spirometric data, particularly when assessing longitudinal changes and/or the effects of pharmacological intervention on pulmonary function.
Materials and Methods
Participants
The spirometric data of patients with COPD were obtained from the Hokkaido COPD cohort study, which has been described in detail in our previous studies.14,15 The diagnosis of COPD was based on the Global Initiative for Chronic Obstructive Lung Disease (GOLD) guidelines. Importantly, we excluded participants with asthma, which was diagnosed clinically by respiratory physicians.
Of 300 participants with COPD who were initially recruited for the original cohort, we attempted to analyze 143 who underwent pulmonary function tests (PFTs) at Hokkaido University Hospital to prevent any influence on the variability of MEFV curve due to the different quality of the machines used and/or the different skills of technicians in other hospitals. In the original cohort, participants with clinically stable condition underwent PFTs at 6-month intervals. In this study, we used data collected on visit 7 from 2006 to 2008 because three acceptable MEFV curves were obtained. This was based on the official announcement regarding the recommended spirometry by the JRS4 in 2004 and the ATS/ERS3 in 2005. Until then, we had not defined the acceptability of the three MEFV curves using a strict method. That is, we did not stick with a time-to-PEF that is <120 ms.16
Eventually, 85 participants were assessed in this study. We selected the best curve from three acceptable ones for later analysis. The ethics committee of Hokkaido University School of Medicine approved the whole study protocol (approval number: 02–001), which was in accordance with the amended Declaration of Helsinki.
Symptoms of Chronic Bronchitis
Data on disease history, smoking history and other information were collected by well-trained clinical research coordinators. Chronic cough and sputum expectoration were considered when participants claimed that they present with these symptoms on most days for >3 months/year and for >2 consecutive years. To prevent bias caused by the patients’ reports the presence of chronic sputum was defined as a sputum volume >10 mL/day.17,18 The participants were classified into three groups according to the severity of wheezing within the last 6 months before the examination day: group A: none (n = 52); B: only 2–3 days/month (n = 23); and C: few days/weeks to almost every day (n = 10).
Pulmonary Function Tests
The MEFV curves were obtained using a rolling-seal spirometer (CHESTAC-33; Chest M.I., Inc., Tokyo, Japan). The PFTs were conducted in accordance with the 2004 JRS standards.4 The accuracy of the spirometer was assessed daily using a 3-liter calibration syringe. Testing was allowed on a given spirometer if the measured volume errors were <3%. Two well-trained technicians performed the PFT. FVC, FEV1, peak expiratory flow rate (PEF), forced expiratory flow at 50% of expired FVC (FEF50), and forced expiratory flow at 75% of expired FVC (FEF75) were obtained using the MEFV curves. The MEFV curves were considered acceptable if all peak expiratory flow values were within 10% of the maximum observed and if there was a rapid start, absence of major flow fluctuations, and adequate expiration time. Furthermore, the reproducibility was considered acceptable when the differences between the best and the second-best MEFV curve for both FVC and FEV1 were <200 mL. In brief, three acceptable and two reproducible maneuvers were required in up to 8 forced trials.4 The predicted values were calculated according to the JRS equations.19 The diffusing capacity of the lungs for carbon monoxide (DLCO) was also measured using the single-breath method. Moreover, DLCO and Krogh’s constant for CO (KCO) (DLCO/alveolar volume [VA]), both of which were adjusted for hemoglobin levels, were calculated. The percent predicted values were obtained using the Burrows equation.20 All PFTs were performed between 9 AM and 12 PM to prevent any circadian variations. To assess reversibility in airflow limitation, the MEFV curves were measured again after the patient inhaled 0.4 mg of salbutamol. Prior to all PFTs, the participants were instructed to withdraw from using short-acting bronchodilators, long-acting β2 agonists or sustained-release theophylline, and long-acting anticholinergic inhalers within 12, 24, and 48 h, respectively, prior to testing.
Computed Tomography Scan Data Acquisition and Analysis
Computed tomography (CT) scan was performed using a multidetector-row spiral CT scanner with 64 detector arrays (Aquilion Multi, TSX-101A/6A; Toshiba Medical Systems, Gunma, Japan). Data were acquired with the following parameters: 120 kVp; 300 mA; 64 detector × 0.5-mm collimation; slice thickness, 0.5 mm; 0.5 s/rotation; and helical pitch, 41. The whole lung was scanned while the patient was holding his or her breath during deep inspiration while in supine position. On the examination day, the patients were instructed to take their medications as usual. Data were transferred to a workstation and then reconstructed into three-dimensional images. The detailed process of CT scan data acquisition and reconstruction has been described previously.21 The severity of emphysema was scored according to the percentage of low attenuation volume (%LAV), which was automatically assessed using our original proprietary software.
Blood Samples
To measure eosinophil count and immunoglobulin (Ig) E levels, blood samples were collected from all participants on the same day.
Statistical Analysis
To evaluate the variability of three acceptable MEFV curves, we calculated the coefficient of variations (CVs) for those parameters derived from the MEFV curve. To identify factors that might influence the variability in FVC and FEV1, we examined the demographic characteristics of the participants (sex, age, BMI, and smoking status), clinical symptoms (chronic cough, chronic sputum, and frequency of wheezing), some PFT parameters (baseline %FEV1, reversibility of airflow limitation, and %KCO), blood markers (serum total IgE and eosinophil levels), and emphysema score (%LAV). Based on the GOLD definition, the reversibility of airflow limitation was considered positive when the post-bronchodilator increase in FEV1 was >200 mL and 12% compared with the baseline. In almost all analyses, we used the pre-bronchodilator data alone as baseline data except when analyzing changes in CVs after inhaling salbutamol.
Data were expressed as mean and standard error when normally distributed and as median and interquartile range (IQR) when skewed. CV data were logistically transformed when considered appropriate. When all three data were equal (CV = 0), a log CV of 0.31 was used for later analysis because it was considered appropriate. The following variables were examined using the Pearson γ for continuous variables, unpaired t-test, or Kruskal–Wallis test for categorical variables.
To evaluate the differences in CV value for FVC or FEV1 in the strata of COPD stage or age, we used the Kruskal–Wallis test, followed by the Mann–Whitney U-test, for comparison among multiple groups.
A multiple, stepwise analysis was performed to identify the factors that significantly influenced the variability in FEV1 and FVC. All statistical analyses were two-sided and p values <0.05 were considered statistically significant. All analyses were performed using the Statistical Package for the Social Sciences software version 22 (SPSS Inc., Chicago, IL).
Results
The characteristics of the participants (n = 85) are shown in Table 1. Figure 1 shows the comparison of CVs for the five parameters derived from the MEFV curves. The median (interquartile range) CVs for FVC and FEV1 were as 1.6% (range: 0.9–2.2%) and 2.0% (range: 1.0–3.0%). These values were significantly lower than those for PEF, FEF50, and FEF75 (5.0% [3.3–6.8], 5.6% [3.9–8.4], and 6.9% [5.1–10.8], p < 0.0001)
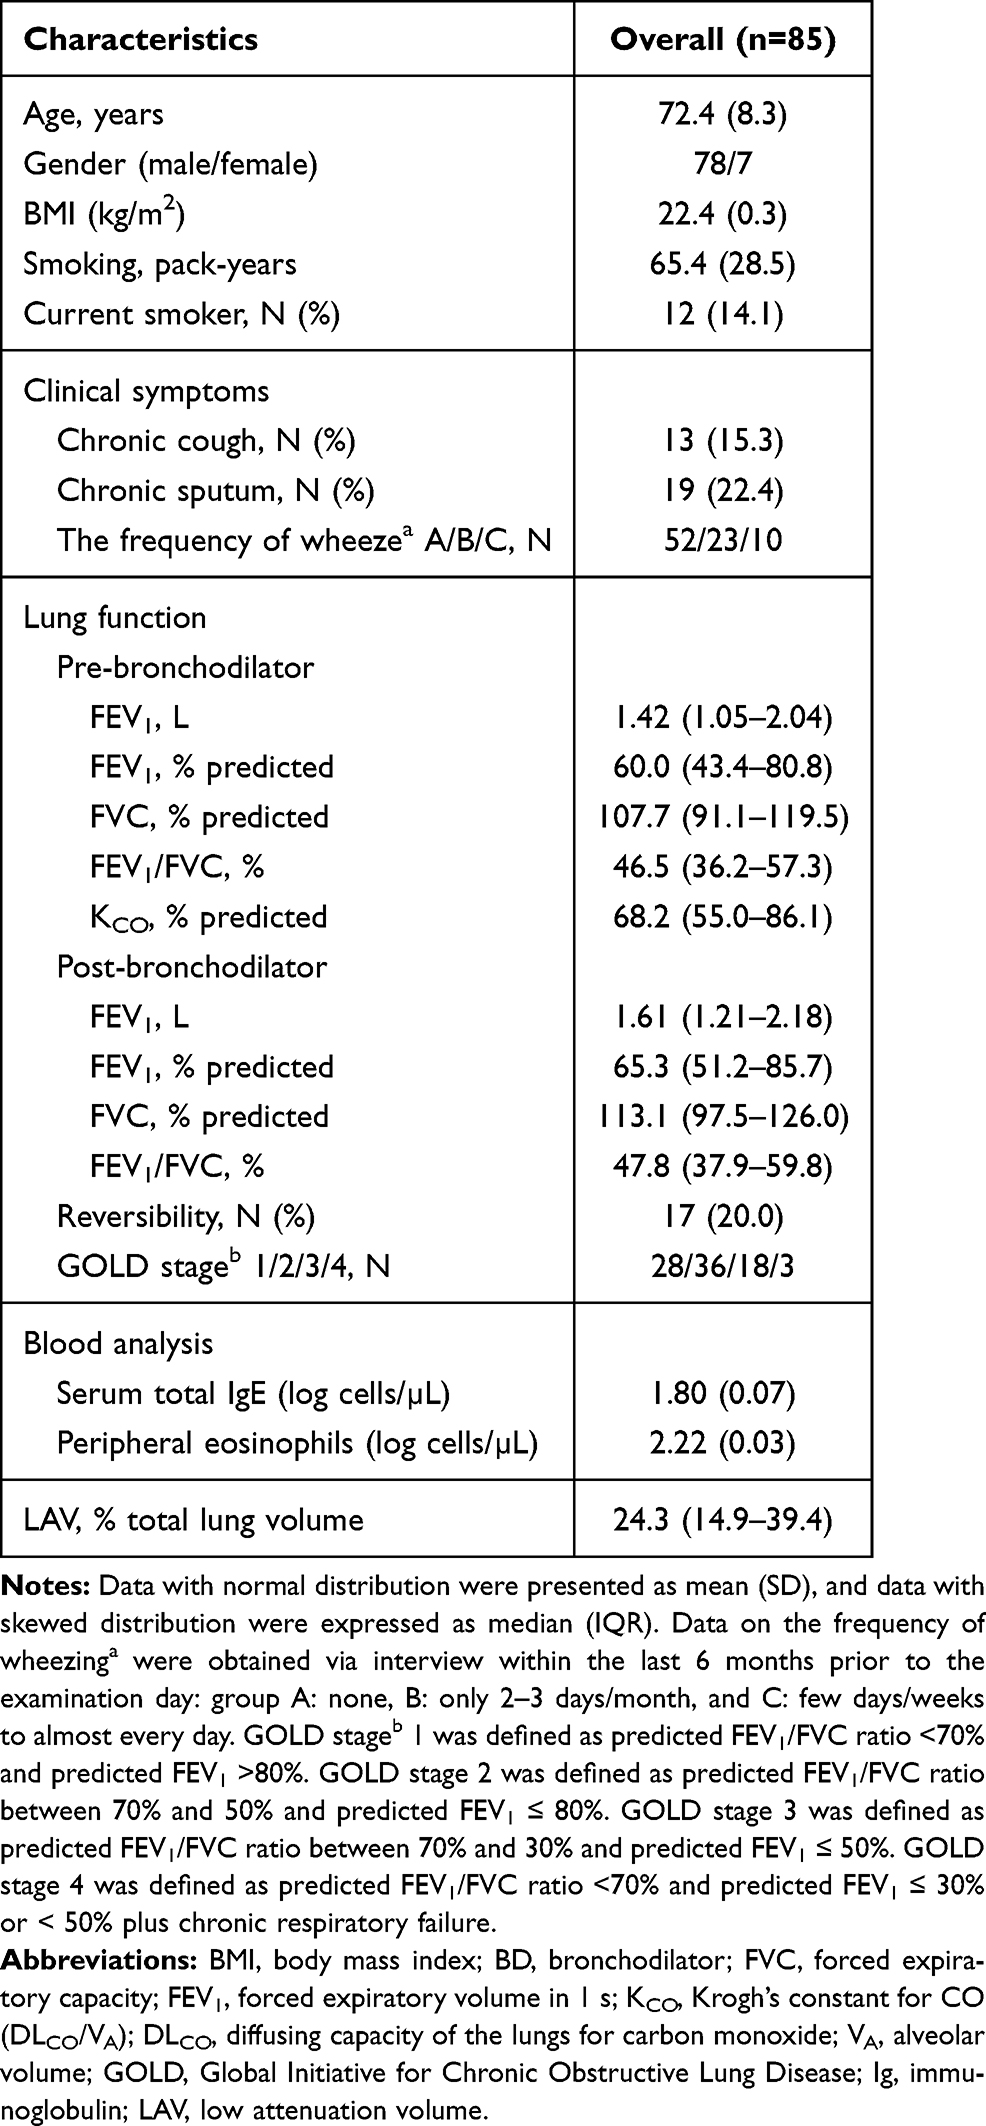 |
Table 1 Characteristics of the Participants |
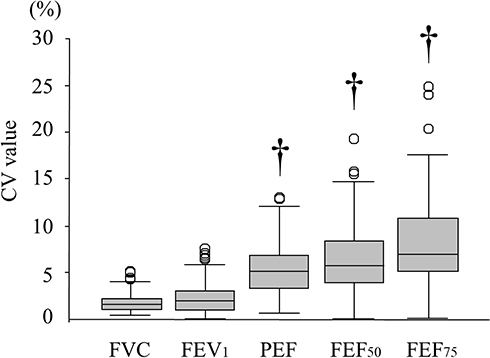 |
Figure 1 Differences in coefficient of variations (CVs) for the parameters of flow–volume curves in 85 participants with COPD. Based on the three best maneuvers, the median (IRQ) CV for FVC (1.6% [range: 0.9–2.2%] or FEV1 (2.0% [range: 1.0–3.0%], p < 0.0001) were significantly lower than the PEF, FEF50, and FEF75 (5.0% [range: 3.3–6.8%), p < 0.0001; 5.6% (range: 3.9–8.4%), p < 0.0001; and 6.9% (range: 5.1–10.8), p < 0.0001, respectively). This result indicated that FVC or FEV1 had consistent values in spirometry even in participants with COPD. Data were presented as median (IRQ) (†p < 0.0001). |
Next, we evaluated factors that could influence the variability in FEV1 and FVC. A univariate analysis showed that old age, presence of wheezing, baseline %FEV1, and high airway reversibility were significantly associated with higher CVs for FEV1. Meanwhile, older age and lower %FEV1 at baseline alone were associated with higher CVs for FVC (Table 2). Based on the effect of age or baseline %FEV1 according to the categorized data, participants aged over 81 years were found to have a significantly higher variability in FEV1. Moreover, patients with stage 3 or 4 COPD had a significantly higher variability in both FVC and FEV1 than those with mild- or moderate-stage disease (Figure 2). We further compared the serial data of means at the first to the third acceptable attempt, using the categorizing data based on age, in an attempt to find a fatigue effect particularly in the elderly and/or a training effect in any age groups. In participants over 81 years old, the mean value (±SD) for FEV1 at first, second and third attempts were 1.12 ± 0.51L, 1.13 ± 0.50 and 1.13 ± 0.47, respectively, while 1.88 ± 0.89L, 1.85 ± 0.91 and 1.88 ± 0.91 in the youngest age group whose age below 60 years old. There were no trends of either increase or decrease among three consecutive attempts in participants of the other two age groups (data not shown).
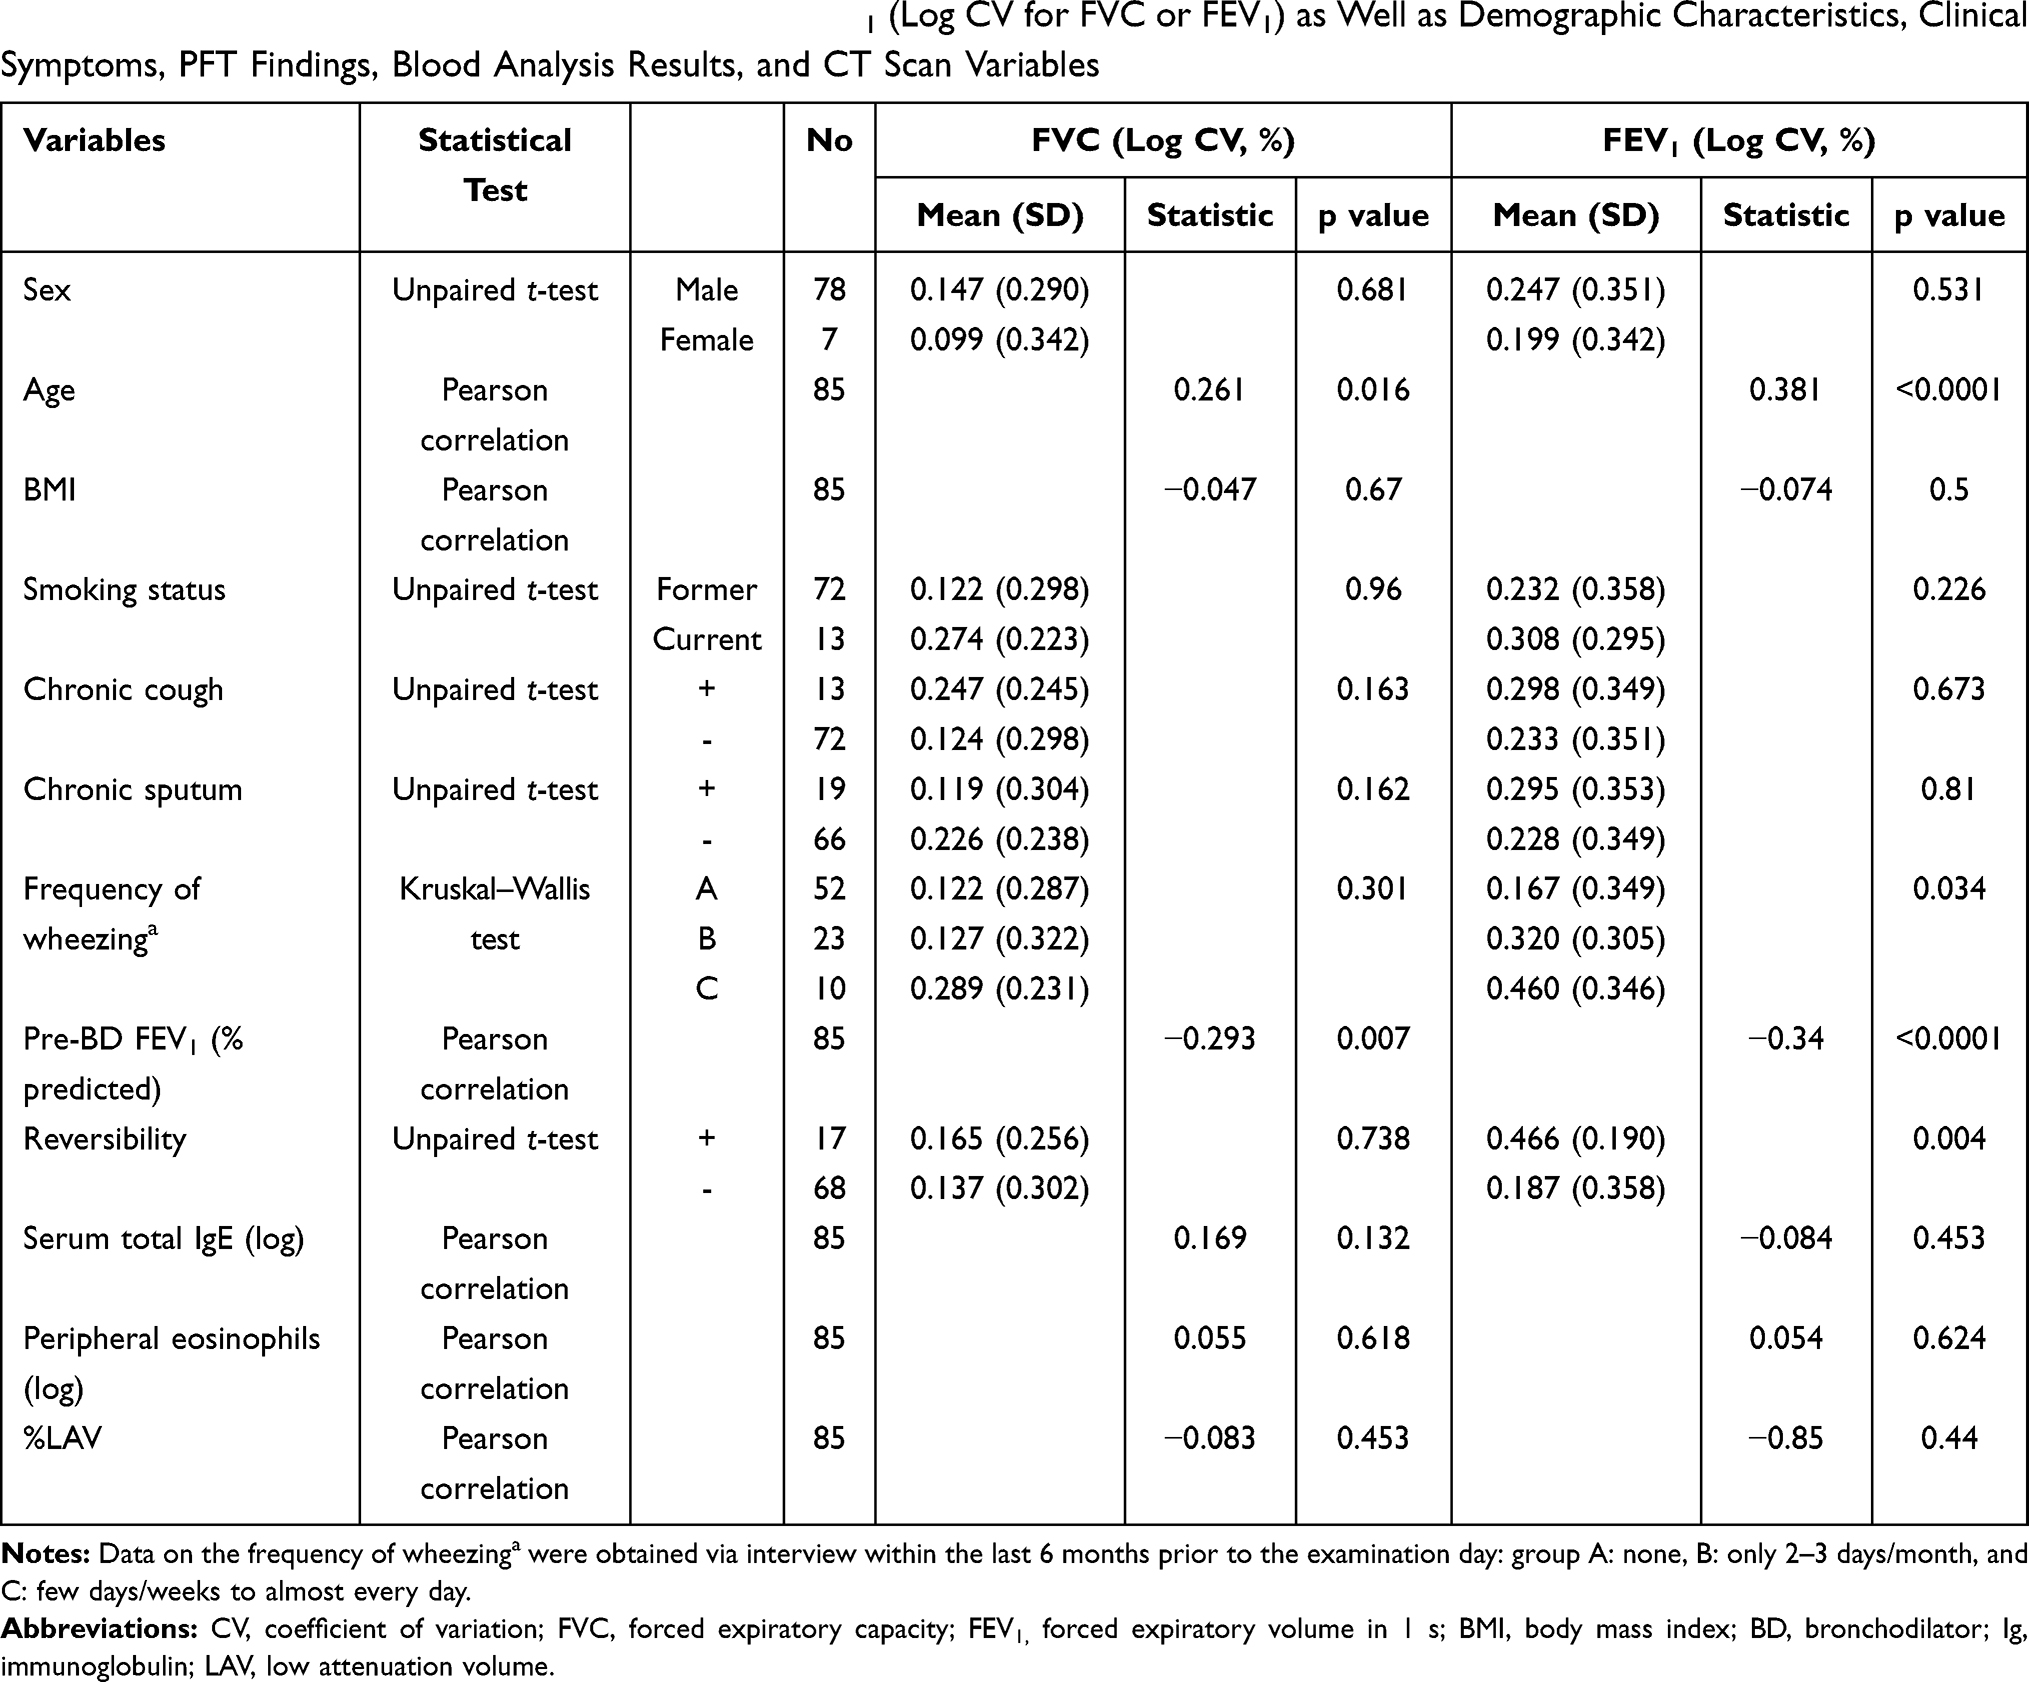 |
Table 2 Relationships Between Variability in FVC or FEV1 (Log CV for FVC or FEV1) as Well as Demographic Characteristics, Clinical Symptoms, PFT Findings, Blood Analysis Results, and CT Scan Variables |
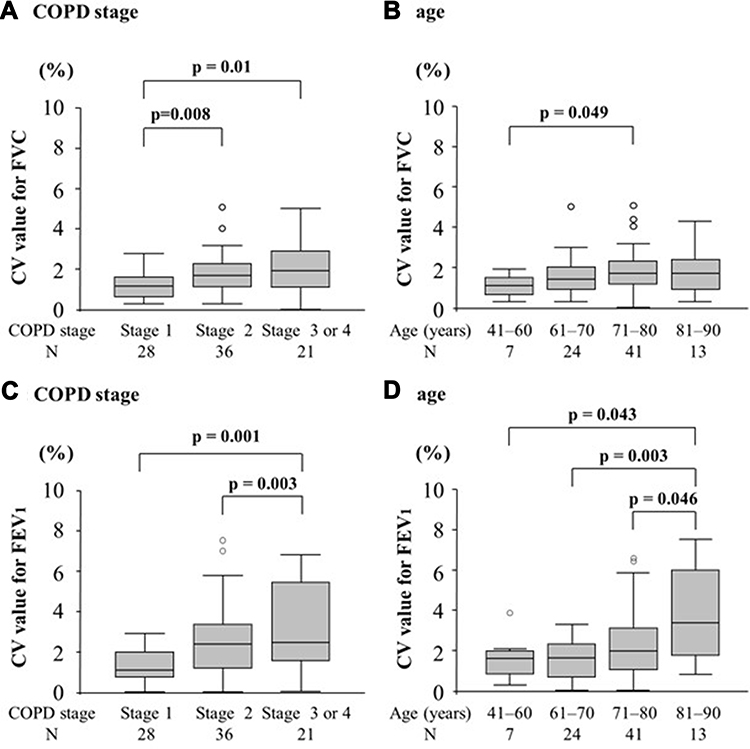 |
Figure 2 Differences in CVs for FVC or FEV1 according to COPD stage based on the GOLD criteria and age. (A) The median CV for FVC in stage 3 or 4 COPD (1.9% [range: 1.2–2.8%]) significantly varied compared with that in stage 1 COPD (1.2% [range: 0.7–1.6%], p = 0.01). In addition, stage 2 COPD (1.7% [range:1.2–2.3%]) significantly varied compared with stage 1 COPD (p = 0.008). (B) The median CV for FVC in the oldest group (aged 71–80 years; 1.7% [range: 0.9–2.3%]) significantly varied compared with the youngest group (1.1% [range: 0.6–1.5%], p = 0.049). (C) The median CV for FEV1 in stage 3 or 4 COPD (2.5% [range:1.7–5.4%]) significantly varied compared with that in stage 1 COPD (1.1% [range: 0.8–2.0%], p = 0.001) and stage 2 COPD (2.4% [range: 1.2–3.4%], p = 0.003). (D) The median CV for FEV1 in the oldest group (aged 81–90 years; 1.8% [range:1.8–6.0%]) significantly varied compared with the other groups (1.6% [range: 0.9–2.0%], p = 0.043; 1.6% [range: 0.8–2.3%], p = 0.003; and 2.0% [range: 1.1–3.1%], p = 0.046). Data were presented as median (IRQ). |
To assess the independent factors for the variability in FVC and FEV1, a stepwise analysis was performed using data on demographic characteristics, clinical symptoms, PFT results, blood marker levels, and emphysema severity. This analysis revealed that older age, lower %FEV1 at baseline, and lower emphysema score were independently correlated with higher CVs for FEV1 (p = 0.008, 0.001, and 0.006, respectively). By contrast, baseline %FEV1 alone was significantly associated with CVs for FVC (p = 0.005) (Table 3).
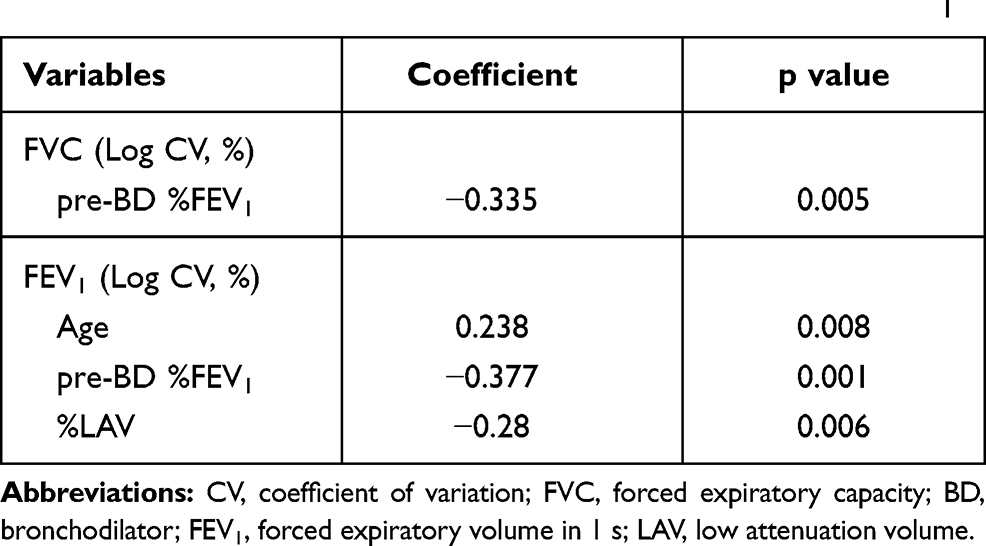 |
Table 3 Results of the Stepwise Analysis on the Correlation Coefficient for the Intra-Individual Variability in FVC and FEV1 |
The minimal clinically important difference (MCID) value for FEV1 in COPD, which is a clinically relevant value in data interpretation, was considered with respect to the data in this study. Hence, the difference between the highest and lowest value among the three acceptable MEFVs in FVC and FEV1 was assessed. The average for the variability in FEV1 was 56.9 ± 35.2mL. Table 4 shows the percentage of participants with a difference >100mL according to spirometric stage, which is the MCID for FEV1.22
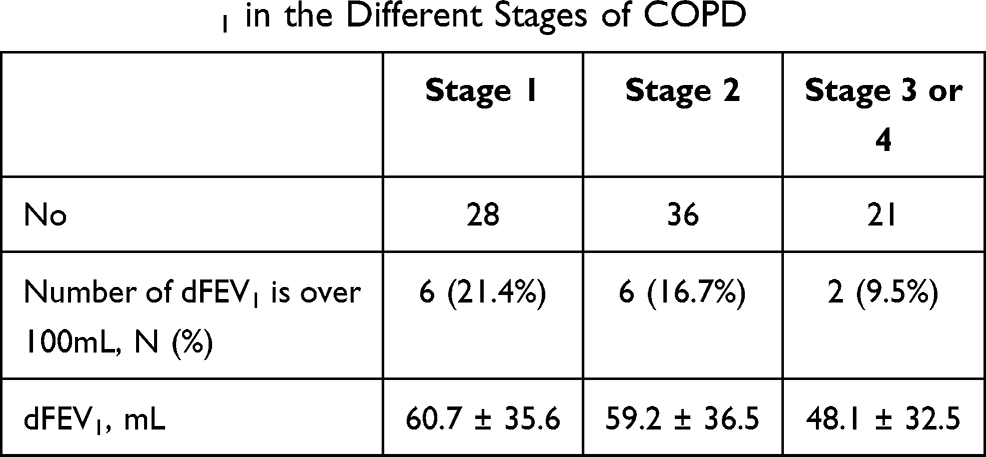 |
Table 4 dFEV1 in the Different Stages of COPD |
Discussion
FEV1, FVC, and FEV1/FVC, all of which were derived from the MEFV curve, are vital pulmonary function parameters for the diagnosis and staging of COPD. Moreover, they play an important role in the assessment of the natural history of a disease and the efficacy of pharmacotherapy. The MEFV curve is completely dependent on a participant’s cooperation and maximal effort. The results obtained via one-time measurement must be cautiously interpreted. Thus, the international guidelines recommend that at least three acceptable trials are required for clinical research settings.
This study showed that the median (interquartile range) of coefficient of variation (CV) for FEV1 and FVC were 2.0% (range: 1.0–3.0%) and 1.6% (range: 0.9–2.2%), respectively. These values were significantly better than PEF, FEF50, and FEF75 (range: 5.0–6.9%). The COPD spirometric stage was significantly associated with higher CVs in FVC and FEV1, and older age was significantly correlated with a higher variation in FEV1 alone. Furthermore, a significant inverse association was observed between emphysema severity and the CVs for FEV1, but not that for FVC, regardless of spirometric stage.
One may speculate that age effect on a high variation in FEV1 is due to weaker expiratory muscles, in other words, a fatigue effect. However, we did not notice any significant differences from the first to the third attempt in the three acceptable trials even of the elderly group. As the age effect was significant only on FEV1, but not FVC, it may indicate that the higher variability in FEV1 is due to the instability of airways in older patients with COPD. By comparing serial three attempts as mean data of FEV1 and FVC, we did not find any significant training effect in any age groups. In terms of long-term training effects, we further examined with data at the first visit, which had been obtained 3 years before, in the same 85 subjects. The average CV value for FEV1 was 2.2 ±1.7%, which was exactly the same as 2.2 ±1.8% in the current study.
Several studies have evaluated short-term variability,13 between-day variability,5,7,9 within-day variability,5,10 and even serial-measurement variability5,6,8,9,11,12 in healthy participants and those with asthma or COPD. However, the results were remarkably different from those in the current study. Data from previous studies were not subject to the current criteria of the ATS/ERS in which three acceptable curves are required to collect data ideally. Airway stability can vary even within a day in COPD and asthma, and the magnitude of variability among the three acceptable MEFV curves obtained via one-time measurement is not similar to that of within-day variability. Although several classical studies have examined the serial-measurement variability, they were calculated in simple repeated trials on healthy volunteers at a specific time.
A study examined short-term variability for COPD for six times at an interval of 2–3 weeks. Results showed that the CVs were 11.1% (range: 4.3–25.9%) for FVC and 14.8% (range: 4.8–50%) for FEV1.13 In another study that assessed between-day variability for COPD, the CV was 11.66% for FEV1.5 Even in healthy participants, the between-day variability, and serial-measurement variability were about 3.0% for FVC and 2.3–3.0% for FEV1. All these values were significantly higher than those in our COPD population.5,7,8,10,11
FEV1 and FVC had good reproducibility. However, some factors were associated with higher variability. Stanescu et al examined the serial-measurement variability in the indices of flow–volume curves in patients with COPD.6 However, their report focused only on PEF, FEF50, and FEF75, not on FVC and FEV1. Moreover, there were no significant differences in variability in those parameters between patients and healthy controls.
Notably, in this study, a lower %LAV, independent of baseline %FEV1, was associated with a lower reproducibility of FEV1. Chronic airflow limitation, which is a characteristic of COPD, is caused by a combination of small airway disease and loss of elastic recoil due to emphysema. Thus, the data in the current study may suggest that small airway pathology itself is more responsible for greater variability in FEV1 compared with emphysema, when patients with COPD have equal levels of airflow limitation. Another potential explanation might be presence of mucus plug in the airways and instability of airway tonus in the proximal airways in non-emphysema phenotype.
The MCID is an important concept when evaluating longitudinal changes in FEV1 and/or the effects of pharmacotherapy in COPD. In cases of COPD, the MCID for FEV1 was 100 mL.22 In this study, the difference between the maximal and minimal FEV1 values even among the three acceptable trials was more than this threshold in 14.1% of the participants. This result was observed regardless of spirometric stage. This should be kept in mind when interpreting spirometric data in participants with COPD.
This study had some limitations. First, we exclusively chose participants who underwent spirometry at our hospital, and the tests were conducted by well-trained technicians. Thus, the data in this study could not be universally extrapolated. Second, the sample size was not large enough and moreover not determined based on power calculation. However, to the best of our knowledge, this is the first study that examined the variability of spirometric data derived from three acceptable MEFV curves at one time.
In conclusion, both FVC and FEV1 values derived from three acceptable MEFV curves are highly reproducible in patients with COPD. Nevertheless, old age and low FEV1 at baseline, particularly in patients with non-emphysema phenotype, are factors for high variability in FEV1. Furthermore, the variability in FEV1 even in one test may be greater than the MCID in some subjects.
Abbreviation
GOLD, the Global Initiative for Chronic Obstructive Lung Disease; COPD, chronic obstructive pulmonary disease; CV, coefficient of variation; PEF, peak expiratory flow rate; FEF50, forced expiratory flow at 50% of expired FVC; FEF75, forced expiratory flow at 75% of expired FVC; FVC, forced vital capacity; FEV1, forced expiratory volume in 1 second; LAV, low attenuation volume.
Statement of Ethics
The ethics committee of Hokkaido University School of Medicine approved the study protocol (approval number: 02-001), and a written informed consent was obtained from all participants.
Author Contributions
All authors made a significant contribution to the work reported, whether that is in the conception, study design, execution, acquisition of data, analysis and interpretation, or in all these areas; took part in drafting, revising or critically reviewing the article; gave final approval of the version to be published; have agreed on the journal to which the article has been submitted; and agree to be accountable for all aspects of the work.
Role of Sponsors
This study was supported by a scientific research grant to the Hokkaido COPD Cohort Study from the Ministry of Education, Science, Culture and Sports of Japan (17390239 and 21390253 to M. Nishimura), Nippon Boehringer Ingelheim (Tokyo, Japan), Pfizer Inc. (Tokyo, Japan).
Disclosure
MN have received grants from Nippon Boehringer Ingelheim Co., Ltd. and Pfizer Japan Inc, during the conduct of the study. A part of this fund was spent for this study. The authors report no other conflicts of interest in this work.
References
1. Global Initiative for Chronic Obstructive Lung Disease. Global strategy for the diagnosis, management, and prevention of chronic obstructive pulmonary disease; updated 2019. Available from: http://www.goldcopd.org/.
2. Fukuchi Y, Nishimura M, Ichinose M, et al. COPD in Japan: the Nippon COPD Epidemiology study. Respirology. 2004;9:458–465. doi:10.1111/j.1440-1843.2004.00637.x
3. Miller J, Hankinson V, Brusasco, et al. Standardisation of spirometry. Eur Respir J. 2005;26:319–338. doi:10.1183/09031936.05.00034805
4. Japanese Respiratory Society. Guideline of respiratory function tests—spirometry, flow-volume curve, diffusing capacity of the lung (in Japanese). Tokyo: Japanese Respiratory Society, 2004. Japanese.
5. Gimeno F, van der Weele LT, Koeter GH, et al. Variability of forced oscillation (Siemens Siregnost FD 5) measurements of total respiratory resistance in patients and healthy subjects. Ann Allergy. 1993;71:56–60.
6. Stanescu D, Veriter C, Van Leemputten R, et al. Constancy of effort and variability of maximal expiratory flow rates. Chest. 1979;76:59–63. doi:10.1378/chest.76.1.59
7. Macdonald JB, Cole TJ, Seaton A, et al. Forced expiratory time–its reliability as a lung function test. Thorax. 1975;30:554–559. doi:10.1136/thx.30.5.554
8. Cochrane GM, Prieto F, Clark TJ. Intrasubject variability of maximal expiratory flow volume curve. Thorax. 1977;32:171–176. doi:10.1136/thx.32.2.171
9. Yoshimizu N. Factors influencing the variability of the forced expiratory curve and the flow volume curve in healthy male adults. J Yonago Med Ass. 1991;42:172–183.
10. McCarthy DS, Craig DB, Cherniack RM. Intraindividual variability in maximal expiratory flow-volume and closing volume in asymptomatic subjects. Am Rev Respir Dis. 1975;112:407–411. doi:10.1164/arrd.1975.112.3.407
11. Lebecque P, Desmond K, Swartebroeckx Y, et al. Measurement of respiratory system resistance by forced oscillation in normal children: a comparison with spirometric values. Pediatr Pulmonol. 1991;10:117–122. doi:10.1002/ppul.1950100214
12. Timonen KL, Randell JT, Salonen RO, et al. Short-term variations in oscillatory and spirometric lung function indices among school children. Eur Respir J. 1997;10:82–87. doi:10.1183/09031936.97.10010082
13. Mungall IP, Hainsworth R. Assessment of respiratory function in patients with chronic obstructive airways disease. Thorax. 1979;34:254–258. doi:10.1136/thx.34.2.254
14. Makita H, Nasuhara Y, Nagai K, et al. Characterisation of phenotypes based on severity of emphysema in chronic obstructive pulmonary disease. Thorax. 2007;11:932–937. doi:10.1136/thx.2006.072777
15. Nishimura M, Makita H, Nagai K, et al. Annual change in pulmonary function and clinical phenotype in chronic obstructive pulmonary disease. Am J Respir Crit Care Med. 2012;185:44–52. doi:10.1164/rccm.201106-0992OC
16. American Thoracic Society. Standardization of Spirometry, 1994 Update. Am J Respir Crit Care Med. 1995;152:1107–1136. doi:10.1164/ajrccm.152.3.7663792
17. Ciba Guest Symposium Report. Terminology, definitions, and classification of chronic pulmonary emphysema and related condition. Thorax. 1959;14(4):286–299.
18. Braman SS. Chronic cough due to chronic bronchitis: ACCP evidence-based clinical practice guidelines. Chest. 2006;129(104):S–115S.
19. Sasaki E, Nakamura M, Kida K, et al. Reference values for spirogram and blood gas analysis in Japanese non-smoking healthy adults. J Jpn Respir Soc. 2001;39:383–399.
20. Burrows JE, Kasik AH, Niden, et al. Clinical usefulness of the single breath pulmonary diffusing capacity test. Am Rev Resp Dis. 1961;84:789–806. doi:10.1164/arrd.1961.84.6.789
21. Nishimura M. Application of three-dimensional airway algorithms in a clinical study. Proc Am Thorac Soc. 2008;5:910–914. doi:10.1513/pats.200809-109QC
22. Paul W, Jones KM, Beeh KR, et al. Minimal clinically important differences in pharmacological trials. Am J Respir Crit Care Med. 2014;189:250–255. doi:10.1164/rccm.201310-1863PP
 © 2021 The Author(s). This work is published and licensed by Dove Medical Press Limited. The full terms of this license are available at https://www.dovepress.com/terms.php and incorporate the Creative Commons Attribution - Non Commercial (unported, v3.0) License.
By accessing the work you hereby accept the Terms. Non-commercial uses of the work are permitted without any further permission from Dove Medical Press Limited, provided the work is properly attributed. For permission for commercial use of this work, please see paragraphs 4.2 and 5 of our Terms.
© 2021 The Author(s). This work is published and licensed by Dove Medical Press Limited. The full terms of this license are available at https://www.dovepress.com/terms.php and incorporate the Creative Commons Attribution - Non Commercial (unported, v3.0) License.
By accessing the work you hereby accept the Terms. Non-commercial uses of the work are permitted without any further permission from Dove Medical Press Limited, provided the work is properly attributed. For permission for commercial use of this work, please see paragraphs 4.2 and 5 of our Terms.