")
Back to Journals » International Journal of Women's Health » Volume 14
Factors Associated with Hemoglobin A1c Level Among Women Without Prior Diabetes Diagnosis in Rural Areas of Central South China: A Cross-Sectional Study
Authors Jiang Y , Jiang S, Long Q, Yang J, Chen JL, Guo J
Received 11 February 2022
Accepted for publication 24 May 2022
Published 7 June 2022 Volume 2022:14 Pages 741—755
DOI https://doi.org/10.2147/IJWH.S362143
Checked for plagiarism Yes
Review by Single anonymous peer review
Peer reviewer comments 2
Editor who approved publication: Professor Elie Al-Chaer
Yuanyuan Jiang,1 Shan Jiang,1,2 Qing Long,1 Jundi Yang,1,3 Jyu-Lin Chen,4 Jia Guo1
1Xiangya School of Nursing, Central South University, Changsha, Hunan Province, People’s Republic of China; 2Zhongda Hospital Affiliated to Southeast University, Nanjing, Jiangsu, People’s Republic of China; 3School of Nursing, The University of Hong Kong, Hong Kong, People’s Republic of China; 4School of Nursing, University of California San Francisco, San Francisco, CA, USA
Correspondence: Jia Guo, Tel +86 13875947418, Email [email protected]
Background: Women in rural areas of China face the unique risk of developing diabetes, but data on the glycemic status among women without prior diabetes diagnosis in rural areas are lacking which may limit the decision-making for diabetes screening or prevention. This study was aimed to describe the glycemic status of women determined by hemoglobin A1c (HbA1c) and explore its associating factors.
Methods: A cross-sectional survey was conducted among women without prior diabetes diagnosis from two counties of rural areas in Central South China from July to October 2018. On the basis of the life course framework, data on socio-demographic, environmental health, genetic, biological (blood pressure, weight and height, lipids), psychosocial, and healthy behavioral factors were collected on site either through questionnaires or field measurements. The questionnaires included social-demographic sheet, Perceived Stress Scale, Self-efficacy scales for health-related diet and exercise behaviors, and Chinese Diabetes Risk Questionnaire. Generalized linear model analysis was performed to determine the associating factors of glycemic status, which was measured by HbA1c level.
Results: A total of 647 women were included in the study. The median age of women was 51.00 years (range 35– 65 years). The median HbA1c level was 5.1% (interquartile range 4.6%-5.5%, range 4– 13.6%), and 8.7% (n=56) of women were identified as elevated glycemic status (HbA1c> 6%). Environmental health factors (eg, living in less-developed county [β=0.206, p=0.027]), biological factors (eg, higher body mass index [β=0.201, p=0.036], higher total cholesterol [β=0.097, p=0.040], history of gestational diabetes mellitus [β=0.722, p< 0.001]), and psychosocial factors (eg, higher perceived stress [β=0.247, p=0.002]) were associated with higher HbA1c level.
Conclusion: This study reported 8.7% of elevated glycemic status among women without prior diabetes diagnosis in rural Hunan Province, China. After a comprehensive investigation based on a theoretical framework, living in a less-developed county of rural areas, having larger body mass index, higher total cholesterol, higher perceived stress, and a gestational diabetes mellitus history were identified as associating factors of higher HbA1c level. Professional support regarding weight control, blood lipid control, stress management, and the prevention of gestational diabetes mellitus should be recommended among this population, especially for women from less-developed counties.
Keywords: women, rural areas, glycemic status, hemoglobin A1c, associating factors, survey
Background
In 2019, a total of 231.9 million (50.1%) adults with diabetes remain undiagnosed worldwide.1 Hemoglobin A1c (HbA1c) reflects the average plasma glucose over the previous 2–3 months,2 and it can be used as a screening tool for glycemic status in epidemiological surveys or population screenings.3 In clinical practice, the Chinese Diabetes Society and American Diabetes Association approved assay of HbA1c as one of the tests for diabetes screening under rigorous quality control standards,3,4 such as standardizing HbA1c assays.4,5 According to the National Institute for Health and Care Excellence (NICE) guidelines6 and Guidelines for the Prevention and Treatment of Type 2 Diabetes in China,3 the normal reference range of HbA1c in China is 4–6%, and HbA1c>6% is identified as elevated glycemic status (≥6.5% is diagnosed as diabetes mellitus). The increasing prevalence of elevated glycemic status is a prominent threat to public health, and it places a heavy burden on health-care costs around the world.7 Thus, determining the associating factors of glycemic status is necessary to facilitate decision-making for diabetes screening or prevention.
Several associating factors of glycemic status have been proposed in clinical guidelines worldwide, including older age, obesity, family history of diabetes, history of gestational diabetes mellitus (GDM), hypertension, antihypertensive therapy, dyslipidemia, physical inactivity, and passive smoking.3,4,8–10 The association between glycemic status and other unhealthy behaviors, such as low consumption of vegetables and fruits, is partially understood. The consumption of vegetables and fruits is related to better glycemic status among women in the US11 and China.12 However, a meta-analysis has shown that fruit intake has no significant effects in improving glycemic status.13
Evidence shows that reproductive characteristics (females only), such as history of fetal macrosomia and multiple parities and menopausal status, are associated with glycemic status among women.14–19 In Japan, women with a history of fetal macrosomia were found to be 1.4 times more likely to develop elevated glycemic status.14 Women with GDM history are also associated with a higher risk of developing elevated glycemic status (relative risk of 9.51) compared with those with normal glycemic status during pregnancy.15 However, conflicting findings are found across studies investigating the association of history of multiple parities and menopause status with glycemic status. For example, the number of parities was reported to be associated with elevated glycemic status in Japan,16 whereas a prospective study in China failed to show that two parities increased the risk of developing elevated glycemic status compared with one parity.17 Menopause is associated with decreased insulin sensitivity and glucose tolerance,18 which may increase the risk of developing elevated glycemic status among postmenopausal women versus premenopausal women in China.19 However, whether menopausal status independent of age is associated with glycemic status remains controversial.18 Taken together, more studies are needed to explore whether these reproductive characteristics are associated with glycemic status among women.
In addition to reproductive characteristics, several psychosocial factors are associated with glycemic status among women, such as perceived stress and general self-efficacy.20–24 Higher perceived stress is linked to elevated glycemic status among women in Australia20 and China.21 A high level of general self-efficacy is considered to be a protective factor of glycemic status.22 People with higher self-efficacy are more likely to cope with perceived stress, thereby reducing the association of perceived stress with glycemic status.23,24 However, whether these psychosocial factors are still associated with glycemic status when genetic and biological factors are taken into account needs to be explored.
Globally, the estimated number of undiagnosed diabetes cases in China (65 million) was the largest in 2019.7 Around 323 million women (49.7% of 650 million) live in rural areas in China;25 however, data on glycemic status among women without prior diabetes diagnosis in rural areas are lacking. In developing countries, people living in rural areas usually have limited access to high- quality health services, have lower educational levels and family income, and are unemployed,26,27 which have been identified as associating factors of higher HbA1c level in the US and Australia.28,29 We did not find any studies that comprehensively explored the associating factors of glycemic status among women without prior diabetes diagnosis on the basis of a theoretical framework. The life course framework has been commonly used to guide the exploration of associating factors for noninfectious chronic diseases.30 This framework focuses on factors shaping health in different stages of life, including contextual factors affecting health and well-being (environmental health, psychosocial, and healthy behavioral factors) and constitutional and biological factors (genetics and biological factors).30 This study was aimed to describe glycemic status determined by HbA1c among women without prior diabetes diagnosis in rural areas and explore its associating factors on the basis of the life course framework.
Methods
Study Design and Setting
This study was a sub-study of a cross-sectional survey aimed to describe the levels and risk factors for overweight/general obesity and abdominal obesity for rural women in China.31 To represent women from areas with different economic status and lifestyles, participants from You County (GDP 2156.23 million US dollars, less developed) and Changsha County (GDP 4957.64 million US dollars, developed) were recruited.32 The study was conducted in the largest general hospital and maternal and child hospital of the two counties in Hunan Province, located in Central South China. Participants were recruited when they underwent female cancer (cervical cancer and breast cancer) or cardiovascular disease screening provided for the general population (which was sponsored by the government). The study protocol was approved by the Ethics Committee of Xiangya School of Nursing, Central South University (No. 2018028).
Participants
The eligibility criteria of participants were as follows: 35–65 years old, without previous diagnosis of type 2 or type 1 diabetes, and interest in participating in the study. Women who were pregnant and had a history of psychiatric disorders or impaired communication were excluded from the study.
A total of 28 independent variables were selected in the study on the basis of the life course framework and literature. According to previous literature, the sample size should be at least 20 times the number of predictors to make the linear model stable.33 Thus, 560 women should be included. According to a similar study among the Chinese community population,34 we expected that 20% of the participants might not complete the survey; therefore, the sample size was increased to 700.
Measures
Glycemic Status
It was identified by HbA1c with the National Glycohemoglobin Standardization Program (NGSP) value. We used the method that has been traceable to the Diabetes Control and Complications Trial (DCCT) reference assay. In our study, HbA1c was measured by fluorescent affinity immunochromatography using a high-performance liquid chromatography analyzer (Wondfo FS-201, Guangzhou, China), which was certified by NGSP and the International Federation of Clinical Chemistry (IFCC). The sensibility and the inter-assay coefficient of variation are ±0.3% and<3.5%.5 According to the NICE guideline and the Guidelines for the Prevention and Treatment of Type 2 Diabetes in China, the normal reference range of standard HbA1c assay is 4%–6%, and participants with HbA1c>6% were identified as elevated glycemic status.3,6
Socio-Demographic, Environmental Health, and Genetic Factors
The socio-demographic (eg, age, occupation status, educational level, family monthly income, marital status, parents’ ethnicity, and medical insurance), environmental health (eg, living places), and genetic (family history of diabetes) factors were investigated by a researcher-designed survey.
Biological Factors
Anthropometric data of height, weight, and waist circumference (WC) were measured according to the guidelines for prevention and control of overweight and obesity in Chinese adults.35 Height was measured to the nearest 0.1 cm using a stadiometer (Seca 206, Germany), with participants in the upright position. Weight was measured to the nearest 0.1 kg using a digital lithium weighing scale (Tanita BC-718, Japan). At the end of normal expiration, WC was measured to the nearest 0.1 cm using an inelastic anthropometric tape at the midpoint between the costal margin and iliac crest, with the participants in the standing position. Body mass index (BMI) was calculated as weight in kilograms divided by the square of height in meters, and it was divided into two categories: normal (≤23.9 kg/m2) and overweight or obese (≥24.0 kg/m2); WC was classified into two categories: normal (<80 cm) and abdominal obese (≥80 cm).35 Systolic blood pressure (SBP) and diastolic blood pressure (DBP) were measured using an electronic sphygmomanometer (Omron HEM-7136, Japan) according to the standard method recommended by the guideline.36 The participants were advised to rest for 5 min before the measurement and sat with their arms supported at the heart level during measurement.
Lipid metabolism was evaluated using blood total cholesterol (Tch), high-density lipoprotein (HDL), and triglyceride (TG). We collected fasting blood samples using a gel and clot activator tube for lipid measurement. Tch, TG, and HDL were measured by CHOD-PAP enzyme assay, GPO-PAP method, and direct clearance methods, respectively. These lipid indicators were measured using a fast-automatic biochemical analyzer (Kehua ZY-1200, Shanghai, China).
Glycemic-status-related health history (history of hypertension and taking antihypertensive drugs) was measured using two items in the Chinese Diabetes Risk Questionnaire,37 which was developed by Robinson38 and was revised and translated into Chinese.37 The scale was designed to measure the risk of developing diabetes in 10 years. The test–retest reliability of the Chinese version of the scale was 0.988. Reproductive characteristics (eg, history of fetal macrosomia, GDM history, parity, and menopausal status) were investigated by the self-reported items in the researcher-designed survey.
Psychosocial and Healthy Behavioral Factors
Perceived stress was measured by the Perceived Stress Scale, developed by Cohen, Kamarck, and Mermelstein39 and revised and translated into Chinese.40 The scale was designed to measure the degree to which situations in one’s life were appraised as stressful. This scale consists of 14 items with a total score ranging from 0 to 56, and higher scores indicate more stress. The cut-off point of the scale for high level of stress was 26. The Cronbach’s α of this scale was good with a coefficient of 0.78.40 In this sample, the Cronbach’s α was 0.716.
The confidence of one’s ability to engage in physical activity and diet for at least six months was measured by Self-efficacy scales for health-related diet and exercise behaviors, which was developed by Sallis et al,41 modified by Quinonez et al,42 and revised and translated into Chinese.43 This scale has four items with a total score ranging from 0 to 16 for each scale, and higher scores indicate higher levels of self-efficacy. The Cronbach’s α of the Chinese version of the scales was 0.855 for physical activity and 0.906 for diet.43 The Cronbach’s α in this study was 0.946 and 0.921.
Glycemic-status-related healthy behavior (doing physical activity at least 30 min each day and eating five servings of vegetables or fruits a day) was also measured using two items of the aforementioned Chinese Diabetes Risk Questionnaire. Passive smoking was measured by asking the following question: “Do you live/work with people who smoke regularly? (yes or no)”.44
Data Collection
We collected the data from July to October 2018. Trained research assistants introduced the study (the purpose, benefits, and risks of the study) to the women while waiting for the aforementioned free screening. If the women agreed to participate, then they were asked to fill out the self-administered questionnaires. The research assistants were available to answer questions and check the questionnaires to avoid unintentionally missing items or pages. Anthropometric measurements (height, weight, WC, SBP, and DBP) and blood drawing (lipid metabolism and glycemic status) were performed by registered nurses on site before women received the free screening.
Data Analysis
All data were double-entered and checked for accuracy using EpiData 3.0 software (The EpiData Association, Odense, Denmark). Statistical analysis was performed using SPSS (version 25.0; SPSS Inc., Chicago, IL). Missing data (no more than 5%) for each variable were replaced by mean or mode substitution depending on the distribution. Normality distribution of HbA1c level and other continuous variables was checked by the Shapiro–Wilk test. Means ± standard deviations (SD) were used if data were normally distributed, and medians and interquartile range (IQR) were used if data showed skewed distribution. The data exhibited skewed distribution, and normal distribution was not found. Categorical variables were expressed as frequencies and percentages. Continuous variables were normalized by Z-score transformation. The Mann–Whitney test was conducted to examine the difference in socio-demographic factors between participants who participated in and withdrew from the study. Spearman linear correlation analysis was used to explore the correlation between the dependent variable and continuous independent variables.
Potential associations between the dependent variable (HbA1c as both continuous and categorical variables [HbA1c>6% or not]) and independent variables (socio-demographic, environmental health, genetic, biological, psychosocial, and healthy behavioral factors) were determined using the Mann–Whitney test and chi-square tests. Generalized linear model (GLM) analysis was used to explore the associating factors of HbA1c level (GLM can be used to analyze data from various non-normal distributions).45 We also ran the entered logistic regression models with HbA1c as a categorical variable (HbA1c>6%). On the basis of literature, socio-demographic, environmental health, genetic, biological, psychological, and healthy behavioral factors were included in these two models. We set the statistical significance level at p < 0.05.
Results
A total of 717 eligible women were invited to take part in the study, and 700 women agreed to participate. However, because of personal and family matters, 53 (7.6%) women withdrew from the study without completing anthropometric measurements, blood drawing, or questionnaires. Finally, 647 (90.2%) women completed the study, achieving the required sample size for analysis (N=560). No significant difference in socio-demographic factors (age and living places) was observed between participants who participated in and withdrew from the study (p>0.05). A post -hoc power analysis was conducted using G*Power software version 3.1.46 The sample size of 647 provided power of 0.98 in the model with 25 predictors on HbA1c (effect size f 2= 0.0642) for a test of the null hypothesis of a zero coefficient with alpha = 0.05. Effect size f 2 was calculated as follows: Effect size f 2 =R2/(1−R2).47 The median HbA1c level was 5.1% (IQR 4.60%–5.50%, range 4.00–13.60%), and 8.7% (n=56) of women were identified as elevated glycemic status. The details are shown in Tables 1 and 2.
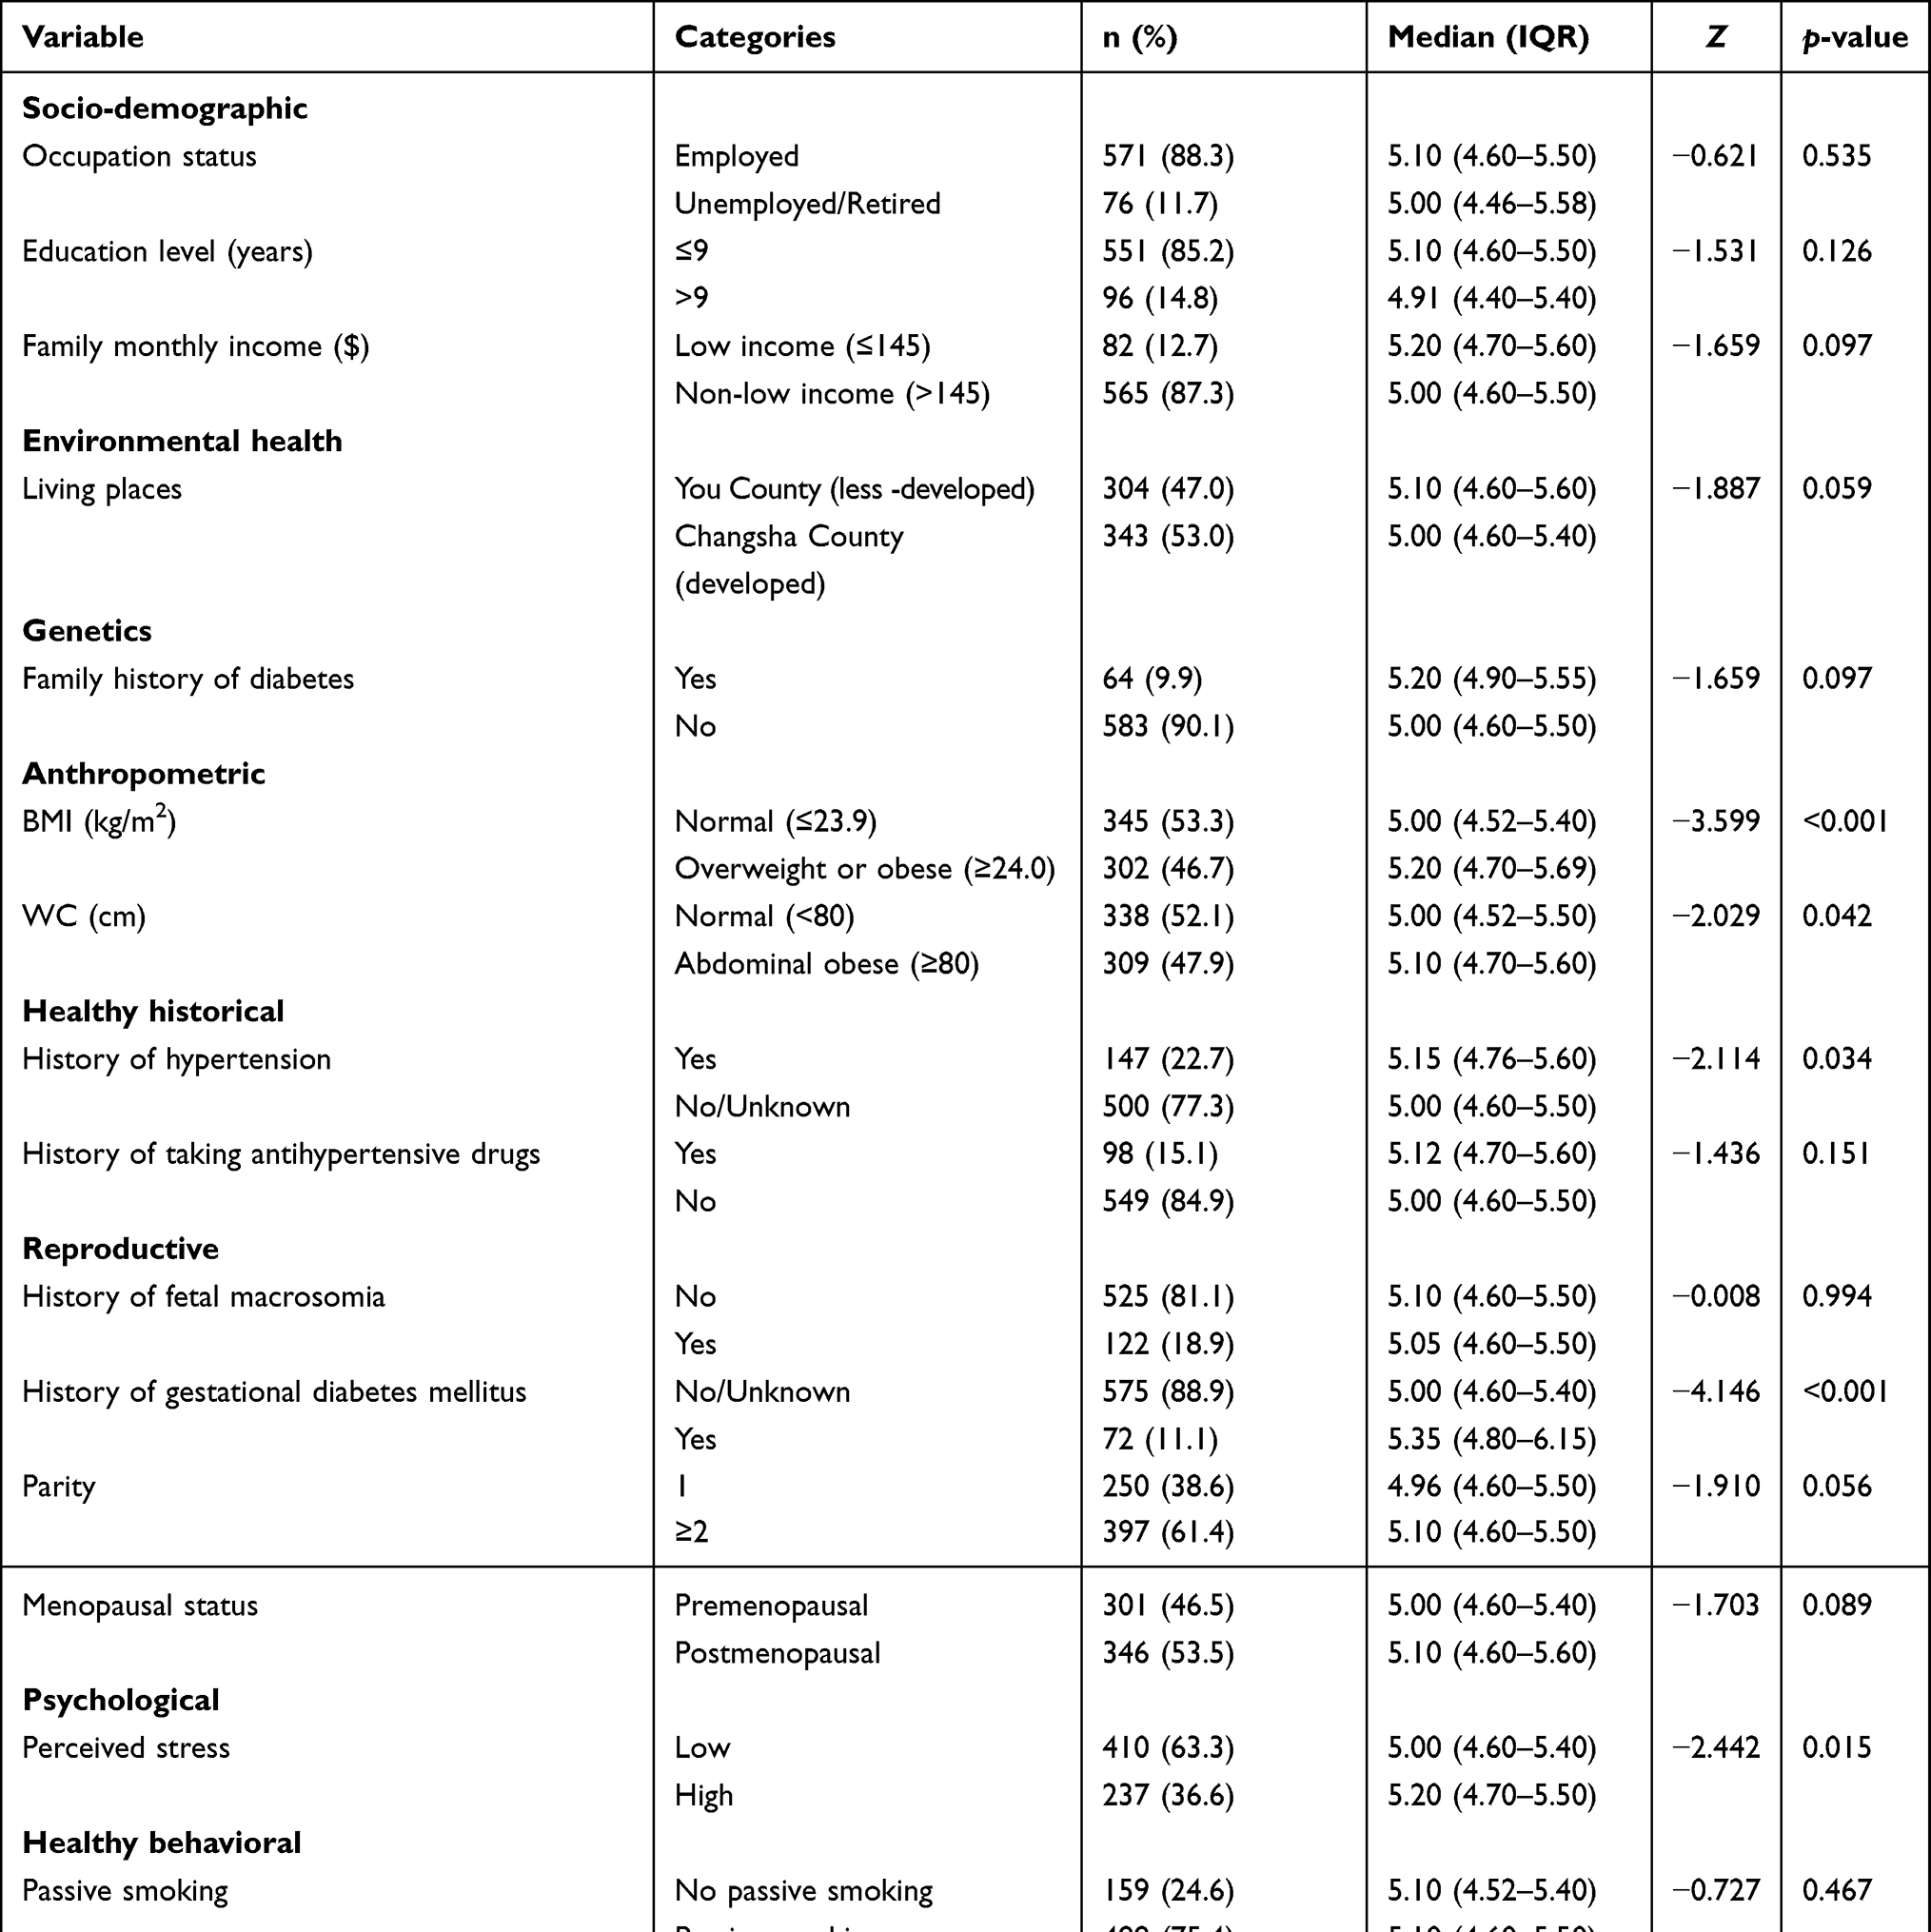 |
Table 1 Descriptive Analyses of the Characteristics and HbA1c Level by Characteristics in Participants (n=647) |
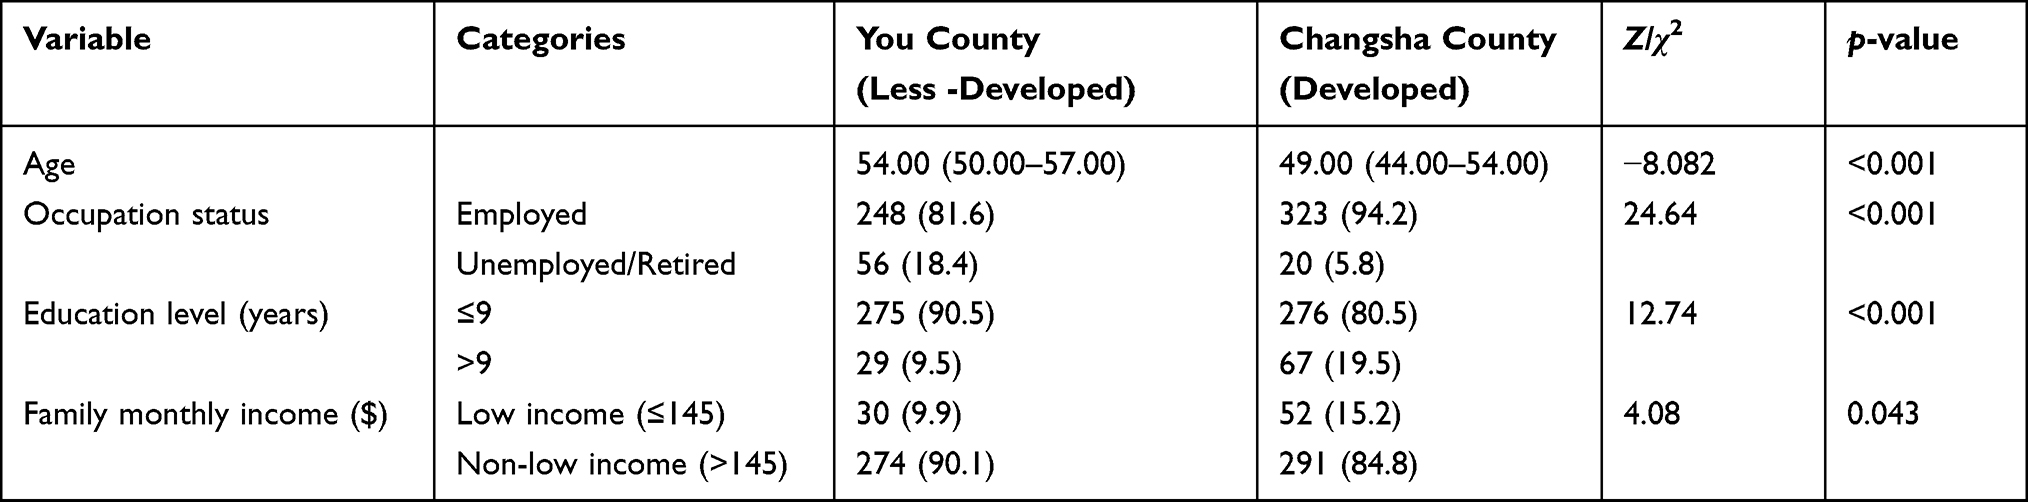 |
Table 2 Characteristics of Participants in You County and Changsha County (n=647) |
Socio-Demographic, Environmental Health, and Genetic Factors
The median age of women was 49.00 years (IQR 44.00–54.00) in Changsha County and 54.00 years (IQR 50.00–57.00) in You County. Among them, 11.7% (n=76) were unemployed or retired: 5.8% in Changsha County and 18.4% in You County. Approximately 85.2% (n=551) had an education level of less than nine years: 80.5% in Changsha County and 90.5% in You County. About 12.7% (n=82) had family monthly income less than 145 dollars, which was considered living at the extreme poverty level according to the Chinese Development Research Center of the State Council.48 About 15.2% and 9.9% of the women had family monthly income less than 145 dollars in Changsha County and You County, respectively. The majority of women were married (97.5%) and Han in ethnicity (98.8%), and most of them had medical insurance (99.2%). Regarding environmental health factors, 53% (n=343) of women were from Changsha County (a more developed area compared with You County). With regard to genetic factors, most of the women (90.1%) had no family history of diabetes.
Biological Factors
With regard to anthropometric measurements, almost half of the women (46.7%) were overweight or obese (BMI≥24.0 kg/m2), and 47.9% (n=309) were abdominal obese (WC≥80 cm); the median SBP and DBP were 128.00 mmHg (IQR 117.00–140.00) and 80.00 mmHg (IQR 74.00–90.00), respectively. In terms of lipid metabolism, the median Tch, HDL, and TG were 5.15 mmol/L (IQR 4.53–5.89), 1.19 mmol/L (IQR 1.02–1.39), and 1.39 mmol/L (IQR 1.00–1.97), respectively.
Regarding the glycemic-status-related health history, 22.7% (n=147) and 15.1% (n=98) of the women reported a history of hypertension and taking antihypertensive drugs, respectively. With regard to reproductive characteristics, approximately one-tenth (11.1%) of women had GDM history, 18.9% (n=122) had a history of fetal macrosomia, 61.4% (n=397) had two and more parities, and 46.5% (n=301) were premenopausal.
Psychosocial Factors and Healthy Behavior
More than one-third of women (36.6%) reported high perceived stress. The median scores of the self-efficacy of physical activity and diet were 8.00 (IQR 4.00–11.00) and 10.00 (IQR 8.00–12.00), respectively. Among them, 78.5% (n=508) reported physical activity less than 30 min each day, 47.9% (n=310) ate less than five servings of vegetables or fruits a day, and 75.4% (n=488) were exposed to passive smoking.
Univariate Analysis and Bivariate Analysis of HbA1c Level
In univariate analysis, women who were older, likely to live in less-developed county (You County), or who with higher BMI, larger WC, higher SBP, higher DBP, higher Tch, higher TG, history of hypertension, history of taking antihypertensive drugs, GDM history, postmenopausal status, or higher perceived stress had higher HbA1c levels (p<0.05). No significant difference was observed between HbA1c level and healthy behavioral factors (doing physical activity at least 30 min each day, eating five servings of vegetables or fruits a day, and no passive smoking; p>0.05). The results are shown in Tables 1 and 3.
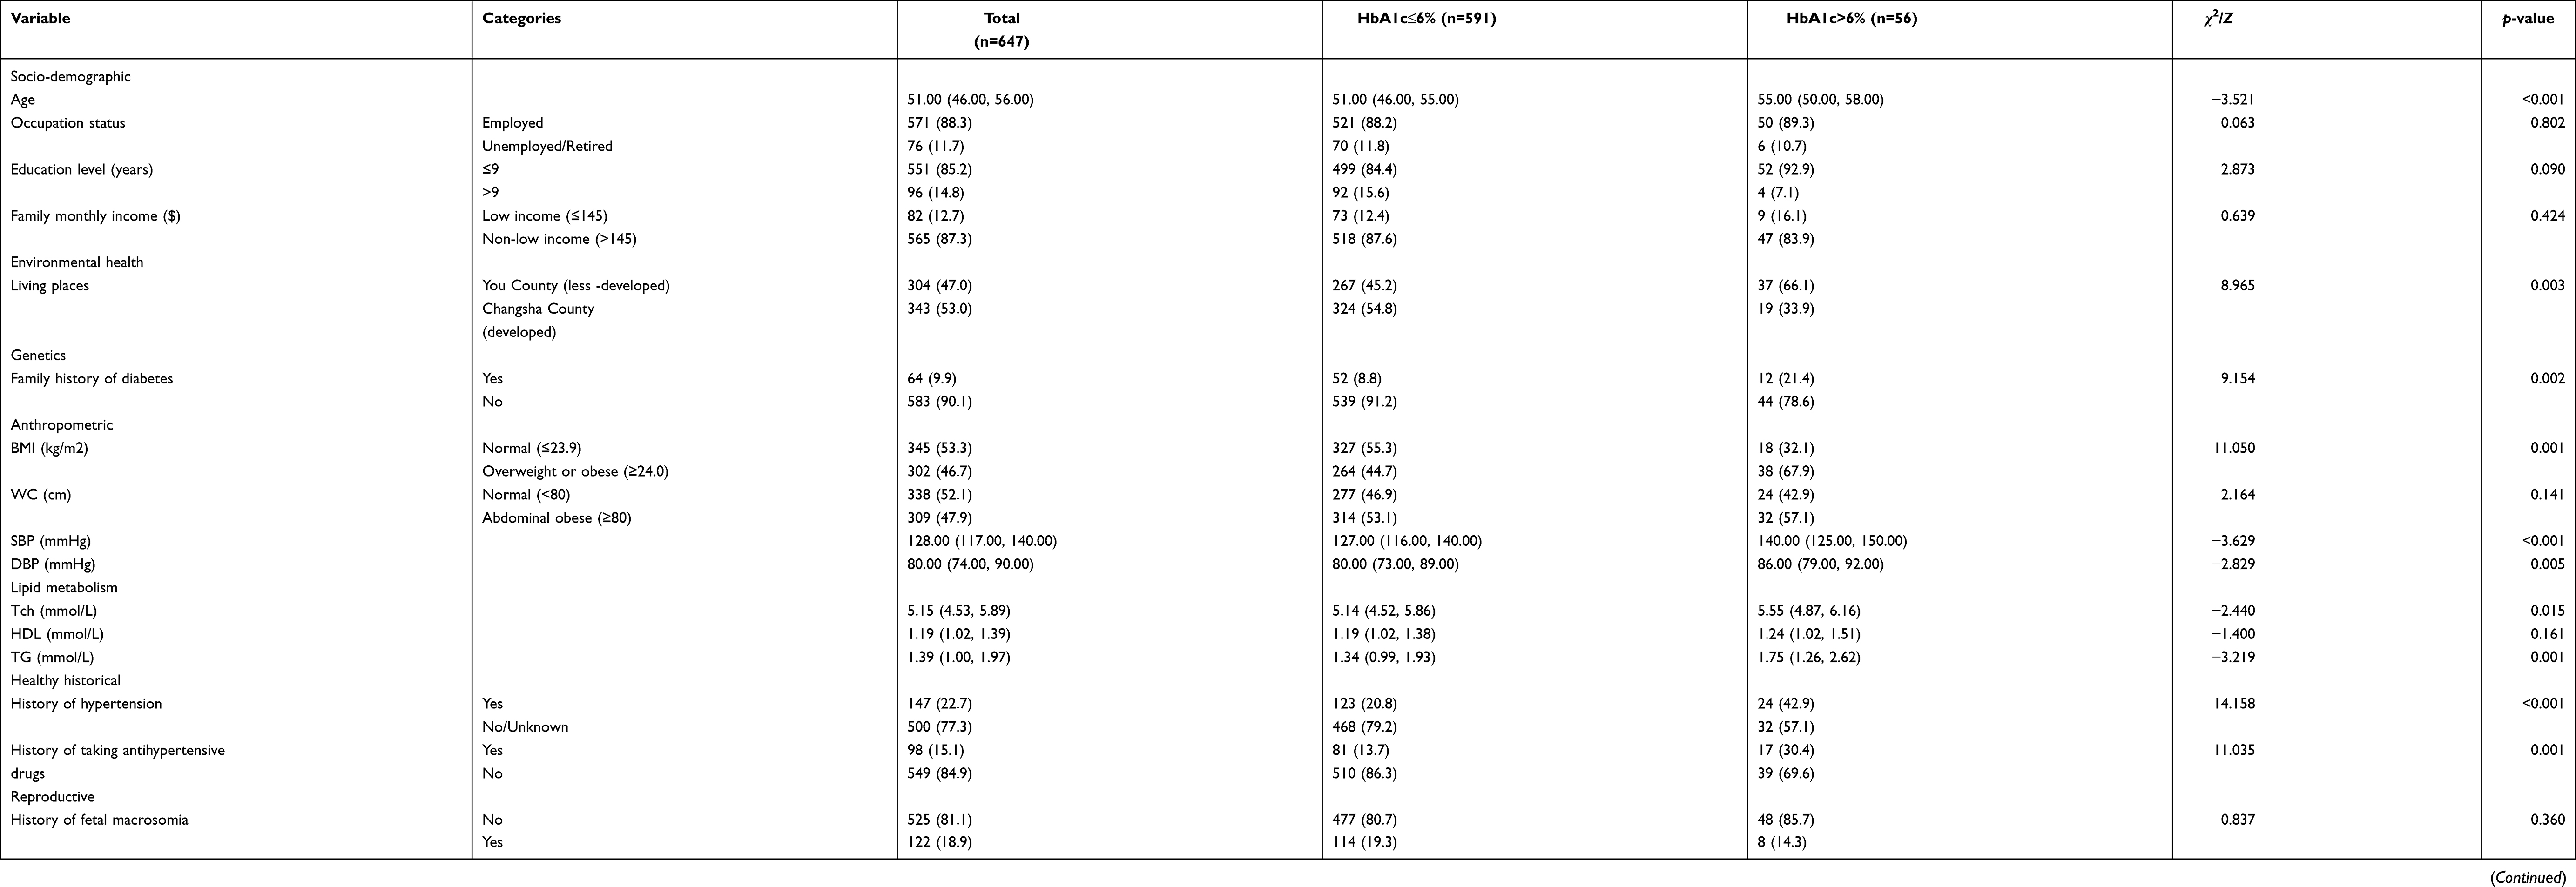 |
Table 3 Differences Among the Characteristics According to HbA1c>6% or Not in Participants (n=647) |
In bivariate analysis, higher SBP (r=0.100, p<0.05) was related to elevated HbA1c level. No significant correlations were observed between HbA1c level and Tch (r=0.0.064, p>0.05), HDL (r=−0.006, p>0.05), TG (r=0.064, p>0.05), DBP (r=0.062, p>0.05), self-efficacy of physical activity (r=−0.042, p>0.05), or self-efficacy of diet (r=−0.020, p>0.05). The results are shown in Table 4.
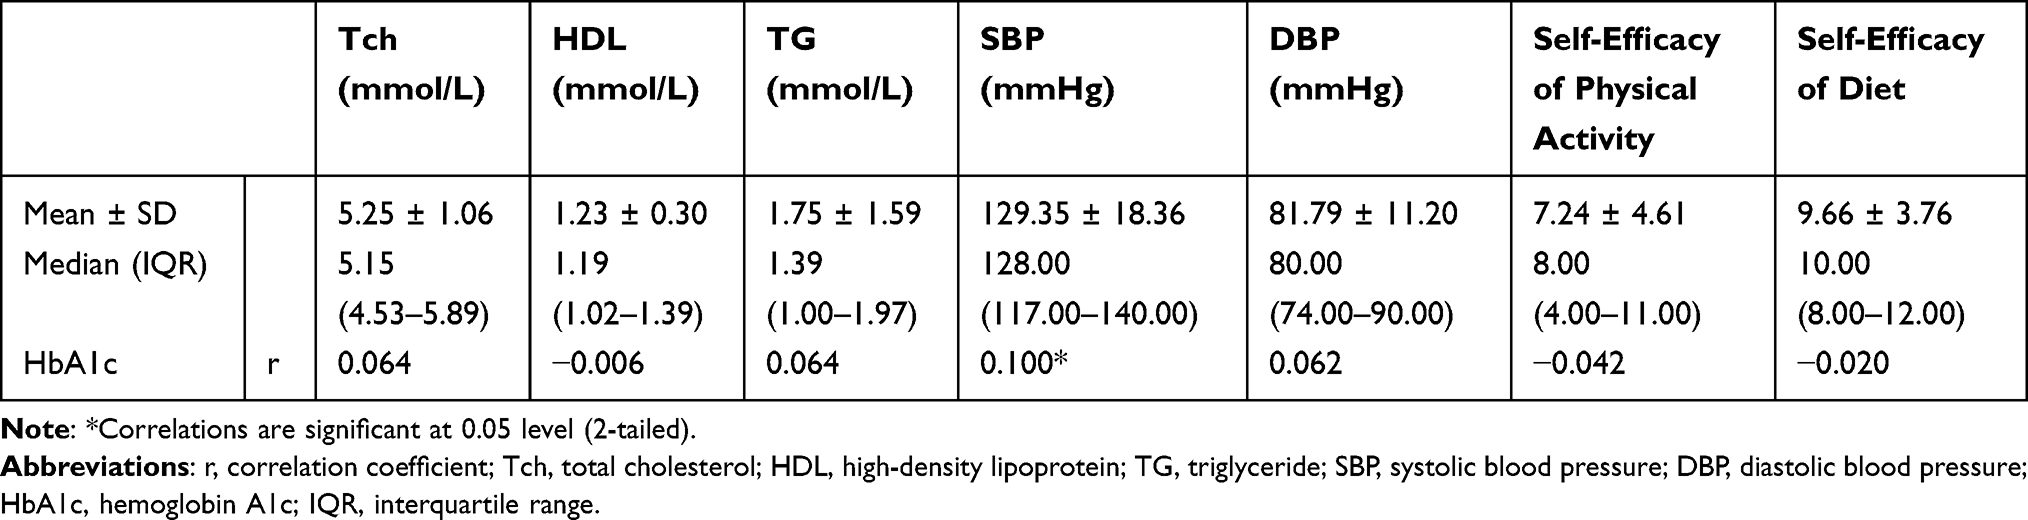 |
Table 4 Bivariate Analysis of HbA1c Level (n=647) |
Multivariate Analysis for Factors Associated with HbA1c Level Among Participants
According to the GLM, less-developed county (β=0.206, p=0.027), higher BMI (β=0.201, p=0.036), higher Tch (β=0.097, p=0.040), GDM history (β=0.722, p<0.001), and higher perceived stress (β=0.247, p=0.002) were associated with higher HbA1c level. The results are shown in Table 5. We also ran models with HbA1c as a categorical variable, and the results were similar to those of GLM (less-developed county [OR=2.317, p=0.024], GDM history [OR=5.341, p<0.001], and higher perceived stress [OR=1.894, p=0.042] were associated with elevated HbA1c level).
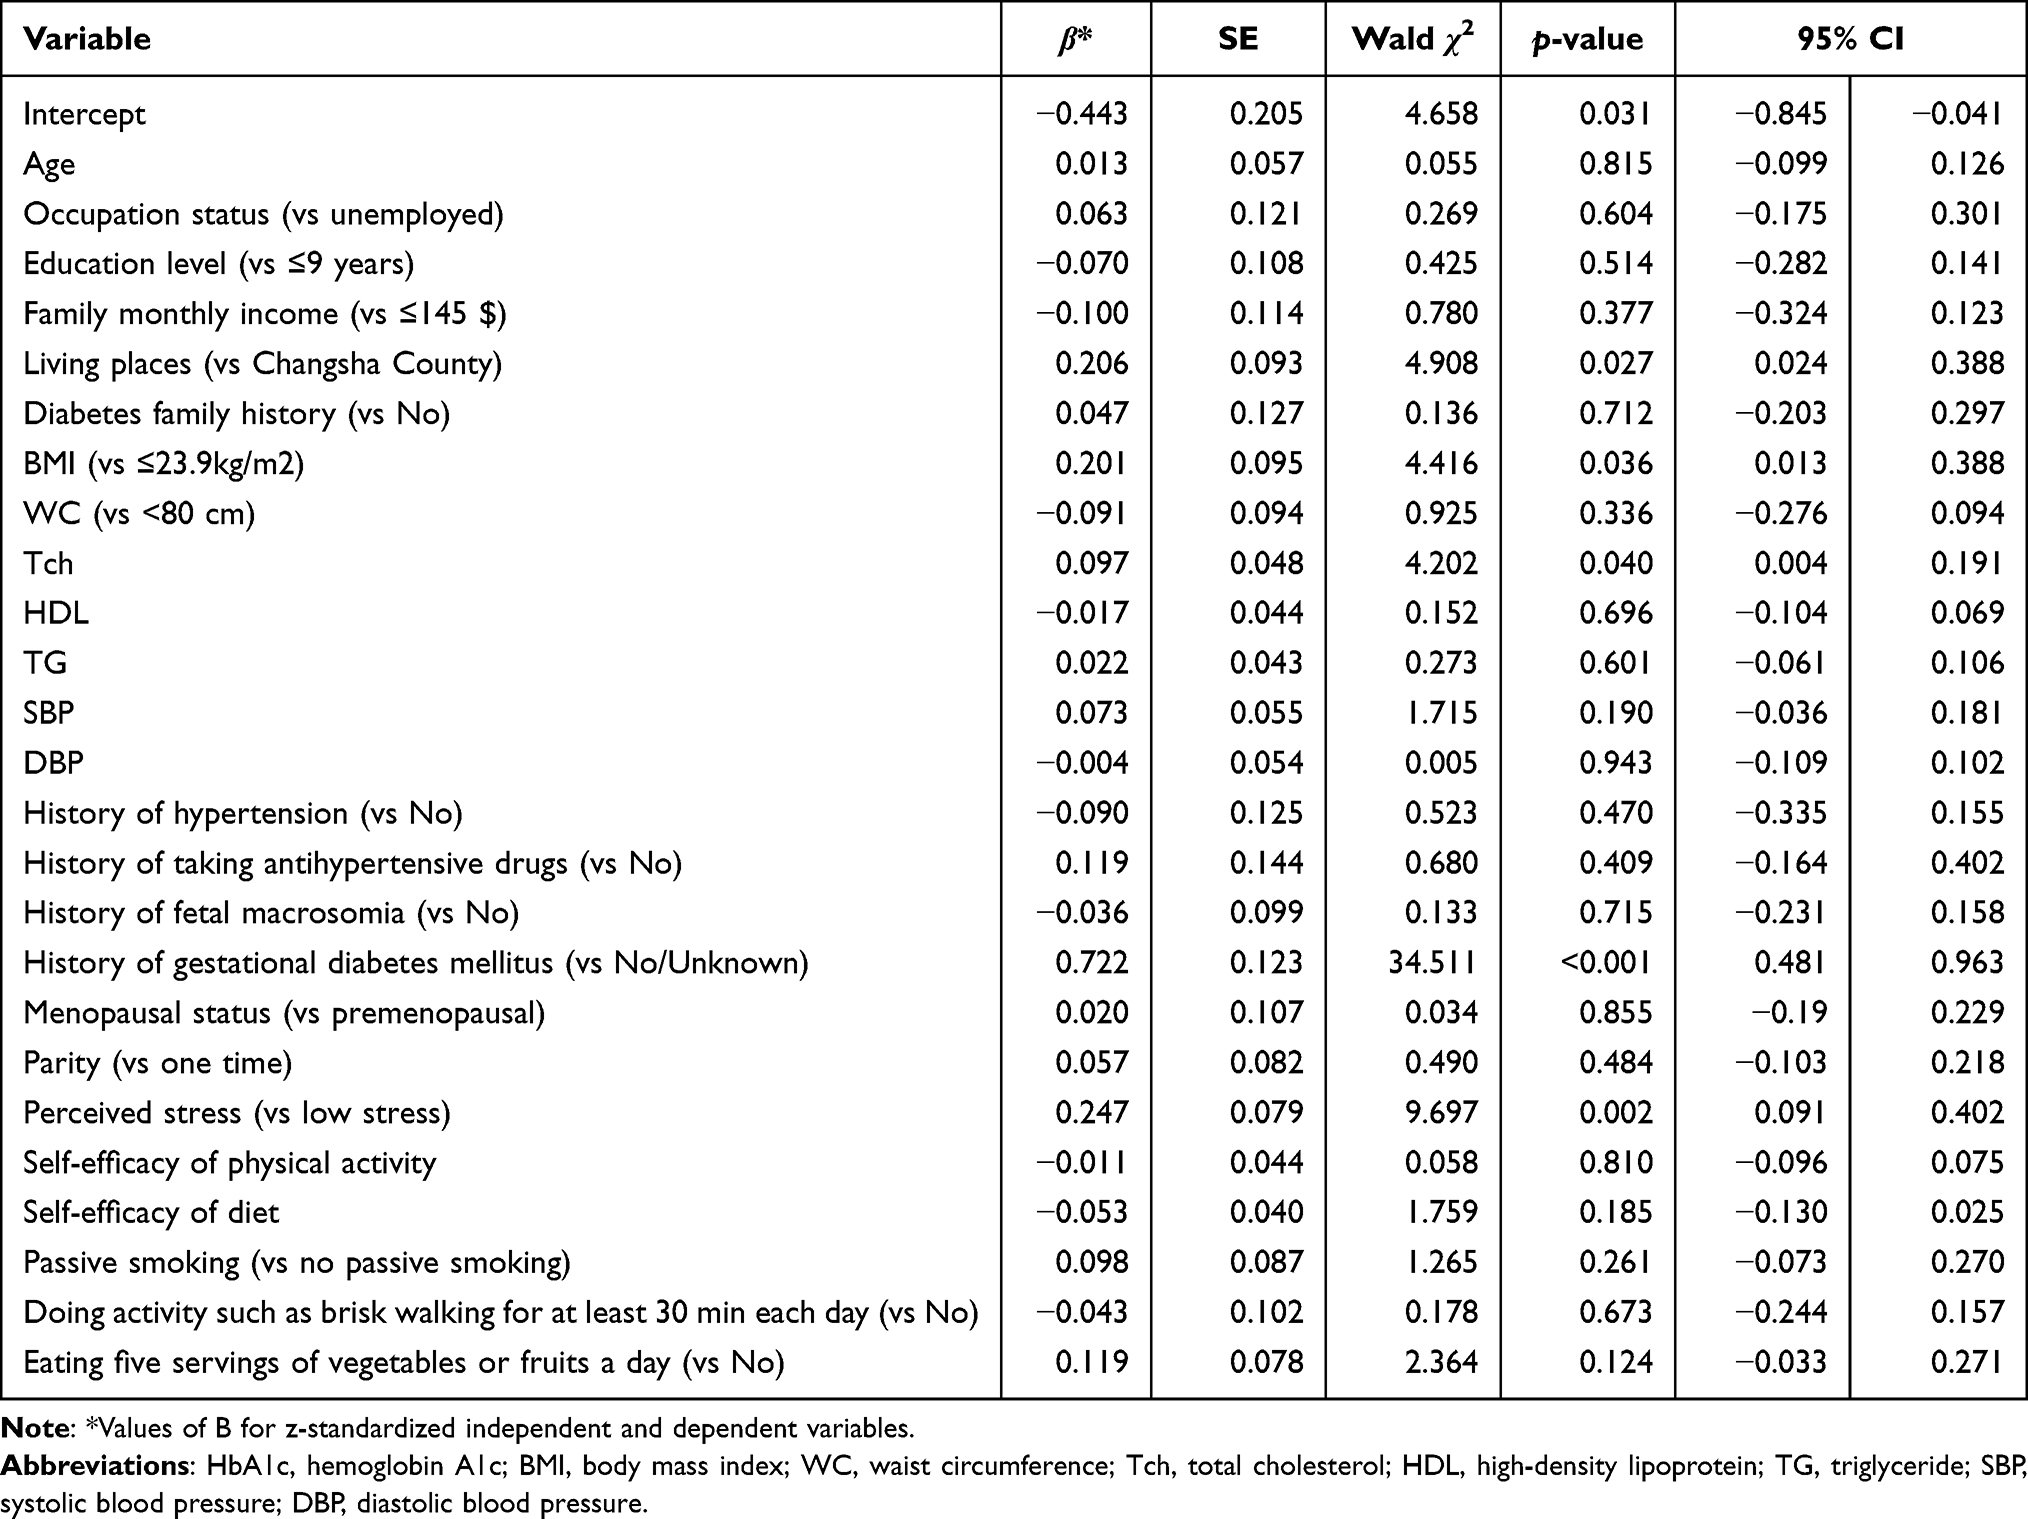 |
Table 5 Generalized Linear Model for Factors Associated with HbA1c Level (n=647) |
Discussion
To the best of our knowledge, this study was the first to target the glycemic status of women without prior diabetes diagnosis in rural areas of China who face the unique risk of developing diabetes. On the basis of the life course framework,30 this study revealed the associating factors of elevated glycemic status, including environmental health factors (eg, living in less-developed counties of rural areas), biological factors (eg, higher BMI, higher Tch, GDM history), and psychosocial factors (eg, higher perceived stress). Interestingly, regarding some already known risk factors (eg, socio-demographic factors, genetic factors, or healthy behavioral factors), we did not find that higher HbA1c level was associated with them, which may indicate the different strategies to prevent elevated glycemic status in this population.
The proportion of elevated glycemic status reported in this study (8.7%) among women without prior diabetes diagnosis was lower than that reported in Germany (18.4%),49 but higher than that reported in the US (3.8%).50 The different criteria and populations included in these studies could contribute to the difference in the proportion of elevated glycemic status. In Germany, the cut-off point of the diagnostic test for elevated glycemic status (5.7%) was lower than that reported in our study (6%). Therefore, a higher proportion might be expected. In the US, the cut-off point of the diagnostic test for elevated glycemic status was the same as that reported in the current study. However, the participants from the US (developed country) might have better health resources for chronic illness prevention. Thus, the proportion of elevated glycemic status among women without prior diabetes diagnosis could be lower in the US. The proportions of elevated glycemic status among adults without prior diabetes diagnosis in other studies in China ranged from 22.4% to 42%,51,52 which were higher than that in our study because the fasting blood glucose and 2-h oral glucose tolerance test were used and could identify more types of elevated glycemic status. However, our study provided the proportion of elevated glycemic status identified by HbA1c, which will facilitate international comparison.
Regarding environmental health factors, we found that women living in the less-developed county were likely to have higher HbA1c level. This finding was consistent with a longitudinal study in adults in the US.53 The interpretations are as follows: First, in less-developed areas, healthy food and regular health check-ups are less affordable and accessible, which increases the risk of developing elevated glycemic status or makes early diagnosis difficult.54,55 Second, participants living in the less-developed county were older and more likely to be unemployed and have lower education level than those from the developed county (Table 2), indicating that they were less likely to be aware of regular chronic disease screening and healthy lifestyles.56 Regarding genetic factors identified by self-reported family history of diabetes, these factors were not associated with higher HbA1c level, which was inconsistent with a meta-analysis of epidemiological studies among adults in China.57
Regarding anthropometric measurements of biological factors, higher BMI was associated with elevated glycemic status in this study. This result was consistent with a 45-year follow-up cohort study among adults in the UK.58 Peripheral obesity (identified by higher BMI) is associated with the formation of lipid metabolites, hormones, and cytokines; thus, it might be associated with changes in the insulin signaling pathways and insulin resistance.59 However, as an indicator of abdominal fat accumulation,35 WC was not significantly associated with elevated glycemic status in this study, which was inconsistent with a cohort study among adults in Iran.60 In a cohort study including 4992 adults aged 40 years and above in Korea, WC trajectory was identified as a better predictor of diabetes risk than WC.61
Regarding lipid metabolism of biological factors, higher Tch was associated with higher HbA1c level. This result was consistent with the findings among adults in China. We did not find a significant association between other lipid indicators (TG and HDL) and higher HbA1c level. Whether healthy behavior (doing physical activity at least 30 min each day and eating five servings of vegetables or fruits a day) can improve glycemic status remains unknown. This result was inconsistent with a meta-analysis10,62,63 that included adults from developed countries (eg, Europe, the US, or Japan). The conflicting result may be due to recall bias associated with the use of self-reported healthy behavior measurements and the poor awareness of healthy behavior with regard to the low education level and economic gap in less-developed areas.
Among the reproductive characteristics (GDM history, fetal macrosomia, parity, and postmenopausal status), GDM history was significantly associated with higher HbA1c level. In patients with GDM, impaired β-cell function already exists, which causes women to be at risk of developing elevated glycemic status.64 The result was consistent with the findings of a meta-analysis that included 17 countries.15 However, the association between the history of fetal macrosomia and higher HbA1c level was not significant, which was inconsistent with a cross-sectional study among women in Japan.14 A prospective study among women in Canada reported that women with a history of large fetal weight/fetal macrosomia but without GDM history likely maintained normal glycemic status.65 In our study, most participants (86.88%) with a history of fetal macrosomia did not report GDM history, which indicated a non-significant association between fetal macrosomia and higher HbA1c level. Regarding parity, the literature suggested that in predisposed populations (eg, women with GDM history), several parities were associated with elevated glycemic status.66 The vast majority (88.9%) of our participants did not report any characteristics of predisposition, which might interpret the non-significant association between parity and higher HbA1c level. Regarding postmenopausal status, a cohort study among women in Spain demonstrated that glucose metabolism levels might not change after adjusting for age during the transition from pre-menopause to post-menopause,67 which indicated that aging might be associated with elevated glycemic status rather than postmenopausal status.18 Therefore, postmenopausal status was not associated with higher HbA1c level in our study.
Regarding psychosocial factors, we found that higher perceived stress was associated with higher HbA1c level, which was consistent with a 35-year follow-up cohort study among Swedish men. In this study, whether self-efficacy of physical activity and self-efficacy of diet were associated with higher HbA1c level remains unknown. Moreover, physical activity and diet were not related to higher HbA1c level. However, a previous study found that self-efficacy of physical activity and diet is highly correlated with the healthy behavior of physical activity and diet,68 thereby indicating the non-significant association between self-efficacy of healthy behavior and higher HbA1c level.
This study has some limitations. First, we used HbA1c level to identify glycemic status for international comparisons which might have underestimated the proportion of elevated glycemic status in this population, as we could not identify impaired fasting glucose or abnormal glucose tolerance on the basis of the HbA1c level.69 Second, all participants were older than 35 years and were recruited from rural areas in Hunan Province. The generalizability of the results may be limited. Third, this study was a cross-sectional design that cannot show the temporal cause–effect association between factors and elevated glycemic status.
This study provides the following insights for future research and primary care practice. For research implications, first, the results support the life course model. Second, future studies are needed to unravel the mechanisms behind the association of history of fetal macrosomia or parity with glycemic status. Third, the impact of WC trajectory on elevated glycemic status must be explored in this population. Fourth, healthy behavior such as diet and physical activity must be explored by using more objective measures. The findings of this study have several implications for primary care practice. First, elevated glycemic status screening and prevention should focus on women living in rural areas who are obese and have higher Tch, GDM history, or higher perceived stress, especially in the less-developed county of rural Hunan Province, China. Second, stress management should be considered in future diabetes prevention programs. Third, GDM prevention, which is mostly neglected in the maternal health-care field in China,70 is urgently needed to help women keep healthy glycemic status later in life especially in rural areas.
Conclusions
This study reported 8.7% of elevated glycemic status among women without prior diabetes diagnosis in rural Hunan Province, China. The comprehensive associating factors of elevated glycemic status based on the life course framework explored in this study may provide insights into risk factor identification and diabetes prevention strategies in rural areas. Professional support of GDM prevention, weight control, blood lipid control, and stress management may be critical to prevent elevated glycemic status among women without prior diabetes diagnosis.
Authors’ Information
Xiangya School of Nursing, Central South University, Changsha, Hunan Province, People’s Republic of China. Zhongda Hospital Affifiliated to Southeast University, Nanjing, Jiangsu, People’s Republic of China. School of Nursing, The University of Hong Kong, Hong Kong, People’s Republic of China. School of Nursing, University of California San Francisco, San Francisco, CA, USA.
Abbreviations
HbA1c, hemoglobin A1c; GDM, gestational diabetes mellitus; NICE, National Institute for Health and Care Excellence; BMI, body mass index; WC, waist circumference; SBP, systolic blood pressure; DBP, diastolic blood pressure; Tch, total cholesterol; HDL, high-density lipoprotein; TG, triglyceride; GLM, generalized linear model; IQR, interquartile range.
Data Sharing Statement
The data for the current study is not publicly available, because it contains information that could compromise research participant privacy, but it is available from the corresponding author upon reasonable request.
Ethics Approval and Consent to Participate
The study protocol was approved by the Ethics Committee of Xiangya School of Nursing, Central South University (No.2018028). All methods were performed in accordance with relevant guidelines, regulations, and the principles of the Declaration of Helsinki. All participants were informed about the confidentiality of the information and the study’s purpose, and they were enrolled in the study only if they agreed to, then signed informed consent was obtained.
Acknowledgments
We sincerely thank all the participants who volunteered for this study. We would like to thank the hospital administrators Guiying ZHANG and Chunxiang LIAO who facilitated data collection. We also would like to extend our sincere appreciation to Prof. Renhe YU at Central South University and Prof. James WILEY at the University of California, San Francisco, for their advice on data analysis.
Author Contributions
All the authors contributed significantly to this work and supported the publication of the manuscript. All authors con-tributed to data analysis, drafting or revising the article, have agreed on the journal to which the article will be submitted, gave final approval of the version to be published, and agree to be accountable for all aspects of the work.
Funding
This study was funded by the UCSF Resource Allocation Program (RAP) (grant number UFRA-174), the China Medical Board (CMB) (grant number 16-256), the Huxiang Youth Talent Support Program (grant number 2019RS2006), and Hunan Women’s Research Association (grant number 20YB07).
Disclosure
The authors declare that they have no competing interests.
References
1. International Diabetes Federation. IDF DIABETES ATLAS ninth edition; 2019. Available from: https://diabetesatlas.org/atlas/ninth-edition/.
2. Bennett CM, Guo M, Dharmage SC. HbA(1c) as a screening tool for detection of type 2 diabetes: a systematic review. Diabet Med. 2007;24(4):333–343. doi:10.1111/j.1464-5491.2007.02106.x
3. Diabetes Branch of Chinese Medical Association. Guidelines for the prevention and treatment of type 2 diabetes in China (2020 Edition). Chin J Diabetes Mellitus. 2021;13(04):95. Chinese.
4. American Diabetes Association. 2. Classification and diagnosis of diabetes: standards of medical care in diabetes-2019. Diabetes Care. 2019;42(Suppl 1):S13–S28. doi:10.2337/dc19-S002
5. Wang D, Chen W, Zhang C, et al. The guideline for glycosylated hemoglobin laboratory assay of China. Chin J Diabetes. 2013;21(08):6. Chinese.
6. National Institute for Health and Care Excellence. Type 2 diabetes: prevention in people at high risk; 2017. Available from: https://www.nice.org.uk/guidance/ph38/resources/type-2-diabetes-prevention-in-people-at-high-risk-pdf-1996304192197.
7. International Diabetes Federation. Advocacy guide to the IDF Diabetes Atlas Ninth edition 2019; 2019. Available from: https://diabetesatlas.org/upload/resources/material/20191217_165723_2019_IDF_Advocacy_guide.pdf.
8. Wu J, Pan G, Huang Y, et al. Effects of passive smoking and its duration on the prevalence of prediabetes and type 2 diabetes mellitus in Chinese women. Aging. 2020;12(10):9440–9446. doi:10.18632/aging.103217
9. Pan A, Wang Y, Talaei M, Hu FB, Wu T. Relation of active, passive, and quitting smoking with incident type 2 diabetes: a systematic review and meta-analysis. Lancet. 2015;3(12):958–967.
10. Aune D, Norat T, Leitzmann M, Tonstad S, Vatten LJ. Physical activity and the risk of type 2 diabetes: a systematic review and dose-response meta-analysis. Eur J Epidemiol. 2015;30(7):529–542. doi:10.1007/s10654-015-0056-z
11. Bazzano LA, Li TY, Joshipura KJ, Hu FB. Intake of fruit, vegetables, and fruit juices and risk of diabetes in women. Diabetes Care. 2008;31(7):1311–1317. doi:10.2337/dc08-0080
12. Du H, Li L, Bennett D, et al. Fresh fruit consumption in relation to incident diabetes and diabetic vascular complications: a 7-y prospective study of 0.5 million Chinese adults. Plos Med. 2017;14(4):e1002279. doi:10.1371/journal.pmed.1002279
13. Carter P, Gray LJ, Troughton J, Khunti K, Davies MJ. Fruit and vegetable intake and incidence of type 2 diabetes mellitus: systematic review and meta-analysis. BMJ. 2010;341:c4229. doi:10.1136/bmj.c4229
14. Kabeya Y, Goto A, Kato M, et al. History of having a macrosomic infant and the risk of diabetes: the Japan public health center-based prospective diabetes study. PLoS One. 2013;8(12):e84542. doi:10.1371/journal.pone.0084542
15. Vounzoulaki E, Khunti K, Abner SC, Tan BK, Davies MJ, Gillies CL. Progression to type 2 diabetes in women with a known history of gestational diabetes: systematic review and meta-analysis. BMJ. 2020;369:m1361. doi:10.1136/bmj.m1361
16. Nanri A, Mizoue T, Noda M, Goto A, Sawada N, Tsugane S. Menstrual and reproductive factors and type 2 diabetes risk: the Japan Public Health Center-based Prospective Study. J Diabetes Invest. 2019;10(1):147–153. doi:10.1111/jdi.12853
17. Cheng X, Wan Q, Deng S. Parity and risk of type 2 diabetes among women from Sichuan, China: a prospective study. Chin Gen Pract. 2019;22(1):38–42. Chinese.
18. Szmuilowicz ED, Stuenkel CA, Seely EW. Influence of menopause on diabetes and diabetes risk. Nat Rev. 2009;5(10):553–558. doi:10.1038/nrendo.2009.166
19. Ren Y, Zhang M, Liu Y, et al. Association of menopause and type 2 diabetes mellitus. Menopause. 2019;26(3):325–330. doi:10.1097/GME.0000000000001200
20. Harris ML, Oldmeadow C, Hure A, Luu J, Loxton D, Attia J. Stress increases the risk of type 2 diabetes onset in women: a 12-year longitudinal study using causal modelling. PLoS One. 2017;12(2):e172126. doi:10.1371/journal.pone.0172126
21. Li C, Liu JC, Xiao X, et al. Psychological distress and type 2 diabetes mellitus: a 4-year policemen cohort study in China. BMJ Open. 2017;7(1):e14235.
22. Serrano E, Leiferman J, Dauber S. Self-efficacy and health behaviors toward the prevention of diabetes among high risk individuals living in Appalachia. J Commun Health. 2007;32(2):121–133. doi:10.1007/s10900-006-9034-4
23. O’Leary A. Self-efficacy and health: behavioral and stress-physiological mediation. Cognitive Ther Res. 1992;16(2):229–245. doi:10.1007/BF01173490
24. Indelicato L, Dauriz M, Santi L, et al. Psychological distress, self-efficacy and glycemic control in type 2 diabetes. Nutr Metab Cardiovasc Dis. 2017;27(4):300–306. doi:10.1016/j.numecd.2017.01.006
25. Census Office of the State Council of China. Tabulation on the 2010 population census of the People’s Republic of China; 2011. Available from: http://www.stats.gov.cn/tjsj/pcsj/rkpc/6rp/indexch.htm.
26. World Health Organization. Tracking universal health coverage: first global monitoring report; 2015. Available from: https://apps.who.int/iris/bitstream/handle/10665/174536/9789241564977_eng.pdf?sequence=.
27. Marmot M. Social determinants of health inequalities. Lancet. 2005;365(9464):1099–1104. doi:10.1016/S0140-6736(05)71146-6
28. Kelly SJ, Stedman J, Leonardi-Bee J. Is hemoglobin A1c level associated with measures of socio-economic status in non-diabetics after controlling for known explanatory factors? Stress Health. 2005;21(3):185–192. doi:10.1002/smi.1052
29. Carroll SJ, Dale MJ, Niyonsenga T, Taylor AW, Daniel M. Associations between area socioeconomic status, individual mental health, physical activity, diet and change in cardiometabolic risk amongst a cohort of Australian adults: a longitudinal path analysis. PLoS One. 2020;15(5):e233793. doi:10.1371/journal.pone.0233793
30. Jacob CM, Baird J, Barker M, Cooper C, Hanson M. The importance of a life-course approach to health: chronic disease risk from preconception through adolescence and adulthood: white paper; 2017. Available from: https://eprints.soton.ac.uk/436656/.
31. Chen J, Guo J, Mao P, et al. Are the factors associated with overweight/general obesity and abdominal obesity different depending on menopausal status? PLoS One. 2021;16(2):e245150.
32. National Bureau of Statistics of China. Hunan statistical yearbook; 2018. Available from: http://222.240.193.190/19tjnj/indexch.htm.
33. Schneider A, Hommel G, Blettner M. Linear regression analysis: part 14 of a series on evaluation of scientific publications. Dtsch Arztebl Int. 2010;107(44):776–782. doi:10.3238/arztebl.2010.0776
34. Qu Z, Parry M, Liu F, et al. Self-management and blood pressure control in China: a community-based multicentre cross-sectional study. BMJ Open. 2019;9(3):e25819. doi:10.1136/bmjopen-2018-025819
35. Group of China Obesity Task Force. Guidelines for the prevention and control of overweight and obesity in Chinese adults (excerpt). Acta Nutrimenta Sinica. 2004;26(01):1–4.
36. Writing Group of Chinese Guidelines for the Management of Hypertension. Chinese guidelines for the management of hypertension 2018. Chin J Cardiovasc Med. 2019;24(01):24–56. Chinese.
37. Guo J, Shi Z, Chen J, Dixon JK, Wiley J, Parry M. Translation and validation of the Canadian diabetes risk assessment questionnaire in China. Public Health Nurs. 2018;35(1):18–28. doi:10.1111/phn.12380
38. Robinson CA, Agarwal G, Nerenberg K. Validating the CANRISK prognostic model for assessing diabetes risk in Canada’s multi-ethnic population. Chronic Dis Inj Can. 2011;32(1):19–31. doi:10.24095/hpcdp.32.1.04
39. Cohen S, Kamarck T, Mermelstein R. A global measure of perceived stress. J Health Soc Behav. 1983;24(4):385–396. doi:10.2307/2136404
40. Yang T, Huang H. An epidemiological study on stress among urban residents in social transition period. Zhonghua Liu Xing Bing Xue Za Zhi. 2003;24(9):760–764. Chinese.
41. Sallis JF, Pinski RB, Grossman RM, Patterson TL, Nader PR, The development of self-efficacy scales for healthrelated diet and exercise behaviors. Health Educ Res. 1988;(3):283–292. doi:10.1093/her/3.3.283
42. Quinonez A. Personal, Social, and Environmental Influences on Physical Activity Behavior in Reproductive Age Mothers [dissertation]. California: University of California San Francisco; 2017.
43. Mao X. Translation and Psychometric Properties Testing of the Simplified Version of the Health-Related Diet and Exercise Self-Efficacy Scale [dissertation]. Changsha: Central South University; 2019.
44. Avila-Tang E, Elf JL, Cummings KM, et al. Assessing secondhand smoke exposure with reported measures. Tob Control. 2013;22(3):156–163. doi:10.1136/tobaccocontrol-2011-050296
45. McCulloch CE. Generalized linear models. J Am Stat Assoc. 2017;452(95):1320–1324.
46. Faul F, Erdfelder E, Lang A, Buchner A. G*Power 3: a flexible statistical power analysis program for the social, behavioral, and biomedical sciences. Behav Res Methods. 2007;39(2):175–191. doi:10.3758/BF03193146
47. Selya AS, Rose JS, Dierker LC, Hedeker D, Mermelstein RJ. A practical guide to calculating Cohen’s f(2), a measure of local effect size, from PROC MIXED. Front Psychol. 2012;3:111. doi:10.3389/fpsyg.2012.00111
48. Chinese Development Research Center of the State Council. The current poverty standards in China can guarantee the need to eliminate absolute poverty. Available from: https://data.cnki.net/ValueSearch/Index?datatype=year&ky=GDP.
49. Heidemann C, Du Y, Paprott R, Haftenberger M, Rathmann W, Scheidt-Nave C. Temporal changes in the prevalence of diagnosed diabetes, undiagnosed diabetes and prediabetes: findings from the German Health Interview and Examination Surveys in 1997–1999 and 2008–2011. Diabet Med. 2016;33(10):1406–1414. doi:10.1111/dme.13008
50. Selvin E, Zhu H, Brancati FL. Elevated A1C in adults without a history of diabetes in the U.S. Diabetes Care. 2009;32(5):828–833. doi:10.2337/dc08-1699
51. Yang SH, Dou KF, Song WJ. Prevalence of diabetes among men and women in China. N Engl J Med. 2010;362(25):2425–2426. doi:10.1056/NEJMoa0908292
52. Li Y, Teng D, Shi X, et al. Prevalence of diabetes recorded in mainland China using 2018 diagnostic criteria from the American Diabetes Association: national cross sectional study. BMJ. 2020;369:m997. doi:10.1136/bmj.m997
53. Cunningham SA, Patel SA, Beckles GL, et al. County-level contextual factors associated with diabetes incidence in the United States. Ann Epidemiol. 2018;28(1):20–25. doi:10.1016/j.annepidem.2017.11.002
54. Dover DC, Belon AP. The health equity measurement framework: a comprehensive model to measure social inequities in health. Int J Equity Health. 2019;18(1):36. doi:10.1186/s12939-019-0935-0
55. Xueyan Z, Weijun W, Wenyu W. Regional differences in the health status of Chinese residents: 2003–2013. J Geogr Sci. 2018;28(6):741–758. doi:10.1007/s11442-018-1502-0
56. Hsu C, Lee C, Wahlqvist ML, et al. Poverty increases type 2 diabetes incidence and inequality of care despite universal health coverage. Diabetes Care. 2012;35(11):2286–2292. doi:10.2337/dc11-2052
57. Zuo H, Shi Z, Hussain A. Prevalence, trends and risk factors for the diabetes epidemic in China: a systematic review and meta-analysis. Diabetes Res Clin Pr. 2014;104(1):63–72. doi:10.1016/j.diabres.2014.01.002
58. Power C, Thomas C. Changes in BMI, duration of overweight and obesity, and glucose metabolism: 45 years of follow-up of a birth cohort. Diabetes Care. 2011;34(9):1986–1991. doi:10.2337/dc10-1482
59. Xu H, Jin C, Guan Q. Causal effects of overall and abdominal obesity on insulin resistance and the risk of type 2 diabetes mellitus: a two-sample mendelian randomization study. Front Genet. 2020;11:603. doi:10.3389/fgene.2020.00603
60. Haghighatdoost F, Amini M, Feizi A, Iraj B. Are body mass index and waist circumference significant predictors of diabetes and prediabetes risk: results from a population based cohort study. World J Diabetes. 2017;8(7):365–373. doi:10.4239/wjd.v8.i7.365
61. Jeon J, Jung KJ, Jee SH. Waist circumference trajectories and risk of type 2 diabetes mellitus in Korean population: the Korean genome and epidemiology study (KoGES). BMC Public Health. 2019;19(1):741. doi:10.1186/s12889-019-7077-6
62. Li S, Miao S, Huang Y, et al. Fruit intake decreases risk of incident type 2 diabetes: an updated meta-analysis. Endocrine. 2015;48(2):454–460. doi:10.1007/s12020-014-0351-6
63. Wu Y, Zhang D, Jiang X, Jiang W. Fruit and vegetable consumption and risk of type 2 diabetes mellitus: a dose-response meta-analysis of prospective cohort studies. Nutr Metab Cardiovasc Dis. 2015;25(2):140–147. doi:10.1016/j.numecd.2014.10.004
64. Rottenkolber M, Ferrari U, Holland L, et al. The diabetes risk phenotype of young women with recent gestational diabetes. J Clin Endocrinol Metab. 2015;100(6):E910–E918. doi:10.1210/jc.2014-3898
65. Kew S, Ye C, Sermer M, et al. Postpartum metabolic function in women delivering a macrosomic infant in the absence of gestational diabetes mellitus. Diabetes Care. 2011;34(12):2608–2613. doi:10.2337/dc11-1554
66. Cheung NW. Is parity associated with earlier diagnosis of type 2 diabetes? Diabetes Res Clin Pr. 2004;66(3):287–291. doi:10.1016/j.diabres.2004.04.003
67. Soriguer F, Morcillo S, Hernando V, et al. Type 2 diabetes mellitus and other cardiovascular risk factors are no more common during menopause: longitudinal study. Menopause. 2009;16(4):817–821. doi:10.1097/GME.0b013e31819d4113
68. Sheeran P, Maki A, Montanaro E, et al. The impact of changing attitudes, norms, and self-efficacy on health-related intentions and behavior: a meta-analysis. Health Psychol. 2016;35(11):1178–1188. doi:10.1037/hea0000387
69. Hostalek U. Global epidemiology of prediabetes - present and future perspectives. Clin Diabetes Endocrinol. 2019;5:5. doi:10.1186/s40842-019-0080-0
70. Xu T, He Y, Dainelli L, et al. Healthcare interventions for the prevention and control of gestational diabetes mellitus in China: a scoping review. BMC Pregnancy Childbirth. 2017;17(1):171. doi:10.1186/s12884-017-1353-1
 © 2022 The Author(s). This work is published and licensed by Dove Medical Press Limited. The full terms of this license are available at https://www.dovepress.com/terms.php and incorporate the Creative Commons Attribution - Non Commercial (unported, v3.0) License.
By accessing the work you hereby accept the Terms. Non-commercial uses of the work are permitted without any further permission from Dove Medical Press Limited, provided the work is properly attributed. For permission for commercial use of this work, please see paragraphs 4.2 and 5 of our Terms.
© 2022 The Author(s). This work is published and licensed by Dove Medical Press Limited. The full terms of this license are available at https://www.dovepress.com/terms.php and incorporate the Creative Commons Attribution - Non Commercial (unported, v3.0) License.
By accessing the work you hereby accept the Terms. Non-commercial uses of the work are permitted without any further permission from Dove Medical Press Limited, provided the work is properly attributed. For permission for commercial use of this work, please see paragraphs 4.2 and 5 of our Terms.