")
Back to Journals » Clinical Epidemiology » Volume 10
Factors associated with choice of intensification treatment for type 2 diabetes after metformin monotherapy: a cohort study in UK primary care
Authors Wilkinson S , Douglas IJ, Williamson E, Stirnadel-Farrant HA , Fogarty D , Pokrajac A, Smeeth L, Tomlinson LA
Received 2 June 2018
Accepted for publication 14 September 2018
Published 8 November 2018 Volume 2018:10 Pages 1639—1648
DOI https://doi.org/10.2147/CLEP.S176142
Checked for plagiarism Yes
Review by Single anonymous peer review
Peer reviewer comments 4
Editor who approved publication: Professor Vera Ehrenstein
Samantha Wilkinson,1 Ian J Douglas,1 Elizabeth Williamson,1 Heide A Stirnadel-Farrant,2 Damian Fogarty,3 Ana Pokrajac,4 Liam Smeeth,1 Laurie A Tomlinson1
1Department of Non-Communicable Disease Epidemiology, London School of Hygiene and Tropical Medicine, London, UK; 2GlaxoSmithKline, Stevenage, UK; 3Belfast Health and Social Care Trust, Belfast, UK; 4West Herts Hospitals NHS Trust, Watford, UK
Purpose: To understand the patient characteristics associated with treatment choice at the first treatment intensification for type 2 diabetes.
Patients and methods: This is a noninterventional study, using UK electronic primary care records from the Clinical Practice Research Datalink. We included adults treated with metformin monotherapy between January 2000 and July 2017. The outcome of interest was the drug prescribed at first intensification between 2014 and 2017. We used multinomial logistic regression to calculate the ORs for associations between the drugs and patient characteristics.
Results: In total, 14,146 people started treatment with an intensification drug. Younger people were substantially more likely to be prescribed sodium-glucose co-transporter-2 inhibitors (SGLT2is), than sulfonylureas (SUs): OR for SGLT2i prescription for those aged <30 years was 2.47 (95% CI 1.39–4.39) compared with those aged 60–70 years. Both overweight and obesity were associated with greater odds of being prescribed dipeptidyl peptidase-4 inhibitor (DPP4i) or SGLT2i. People of non-white ethnicity were less likely to be prescribed SGLT2i or DPP4i: compared with white patients, the OR of being prescribed SGLT2i among South Asians is 0.60 (95% CI 0.42–0.85), and for black people, the OR is 0.54 (95% CI 0.30–0.97). Lower socioeconomic status was also independently associated with reduced odds of being prescribed SGLT2is.
Conclusion: Both clinical and demographic factors are associated with prescribing at the first stage of treatment intensification, with older and non-white people less likely to receive new antidiabetic treatments. Our results suggest that the selection of treatment options used at the first stage of treatment intensification for type 2 diabetes is not driven by clinical need alone.
Keywords: drug prescriptions, diabetes mellitus, type 2, hypoglycemic agents, primary health care, practice patterns, physicians
Introduction
Current UK and international guidelines endorse metformin as the first-line treatment for most patients with type 2 diabetes.1–4 In the UK, if further treatment is needed, National Institute for Health and Care Excellence (NICE) guidance suggests the addition of sulfonylureas (SUs), sodium-glucose co-transporter-2 inhibitors (SGLT2is), dipeptidyl peptidase-4 inhibitors (DPP4is), and thiazolidinediones (TZD) that have different risk profiles and restrictions.1 The most commonly prescribed drug options are SUs, DPP4is, and SGLT2is.5 Two of these drug classes have been available only recently, DPP4is since 2007 and SGLT2is since 2013.1–4 Another drug class recommended by NICE at this stage of treatment are the TZDs; however, prescribing of TZDs has fallen substantially over recent years and is now rarely used at the first stage of treatment intensification in the UK.5,6
At present, guidelines do not present evidence of superiority for any of these first-stage intensification drug choices. The factors influencing prescribing are not known but may include reported adverse events, growing familiarity with new agents, evidence from clinical trials, and influence of pharmaceutical companies.6,7 Therefore, our aim was to examine the patient characteristics associated with the class of drug prescribed within primary care in the United Kingdom National Health Service (NHS). To ensure comparability and to reflect recent changes in practice, we focused only on commonly used drug classes at the first stage of drug intensification for type 2 diabetes: SUs, DPP4is, and SGLT2is, between 2014 and 2017.
Materials and methods
Study design and setting
This noninterventional study used data from the UK Clinical Research Datalink (CPRD), a database of pseudonymized primary care health data broadly representative of the UK population. CPRD data include demographic and lifestyle factors, prescribing records, clinical diagnoses test records, and referrals to secondary care. Data are regularly audited to ensure quality.8 In the UK, most people with type 2 diabetes are managed in primary care with specialist input only for those with complications or very poor glycemic control.1
Participants, exposures, and outcomes
We identified all individuals aged 18 years and over. Although type 2 diabetes is typically associated with people over the age of 40 years, we chose to include younger patients since the age of diagnosis is decreasing over time, and earlier onset is associated with poorer patient outcomes.9,10 We included only patients registered at the practice for 12 months without treatment for type 2 diabetes in order to restrict the cohort to new users of type 2 diabetes drugs, and to limit inclusion of patients with type 1 diabetes mellitus. We excluded women with type 2 diabetes and a history of pregnancy within 12 months of potential inclusion as prescribing guidelines recommend different drug regimens for pregnant and breastfeeding women.11
To be eligible, individuals must have initiated treatment with metformin monotherapy between 2000 and 2017. Metformin is the only drug recommended by NICE as a first-line drug treatment for type 2 diabetes unless contraindicated, usually for patients with estimated glomerular filtration rate (eGFR) below 30 mL/min/1.73 m2.1,12
Outcomes
We investigated the drug prescribed at the first stage of intensification as our study outcome and focused on three classes of drug recommended by clinical guidelines: SU, DPP4i, and SGLT2i. TZDs are now infrequently prescribed for new users, so we did not investigate this class of drug as an outcome.5 As SGLT2is only became available recently, we limited the period to individuals who commenced treatment after 2013.5 Insulin is not recommended at the first stage of drug intensification so a prescription for insulin may suggest a change of diagnosis to type 1 diabetes mellitus, or very poor glycemic control. We therefore did not include it as an outcome but provide a descriptive analysis of individuals prescribed insulin in the Supplementary files. Intensification of treatment was defined as prescriptions for type 2 diabetes drugs other than metformin after the day of metformin initiation. To minimize misclassification from individuals switching drug regimens rather than intensifying treatment, we required that a further prescription for metformin was issued within 60 days of the first-stage intensification drug prescription (Figure 1).
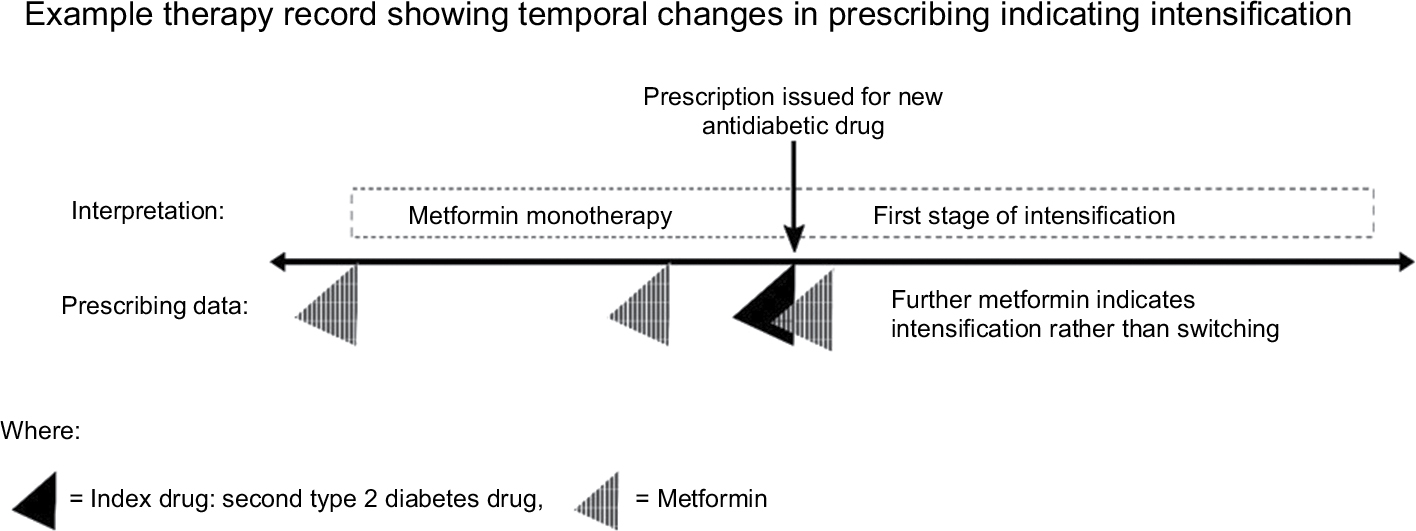 | Figure 1 Diagram of identification of individuals at the first stage of intensification of treatment for type 2 diabetes from prescribing records. |
Descriptive variables and covariates
We defined characteristics that we considered may influence prescribing choice based on clinical knowledge of type 2 diabetes, current treatment guidelines, and recommendations for individual drugs. We defined these covariates as those recorded prior to the day the first-stage intensification drug was prescribed. For the regression analysis, we considered age, sex, body mass index (BMI), ethnicity,13 socioeconomic status, smoking, hemoglobin A1c (HbA1c), eGFR,14 albumin:creatinine ratio (ACR), indicators of microvascular disease, and number of days taking metformin prior to change. For all biochemical variables, we included only the last record of each covariate in the patient record prior to drug intensification, as we considered this was most likely to influence the prescribing clinician at the point of changing treatment. Comorbid conditions, cardiovascular disease (CVD), retinopathy,15 prior amputations,16,17 diagnoses for neuropathy,18 proteinuric kidney disease, heart failure,19,20 and blindness16,20 were defined as present if they were recorded in the medical record on or prior to the date of drug intensification. We defined drug exposures (ACEI/ARB or statins) as any prescription in the year before baseline. Patient-level socioeconomic status was assigned with quintiles of index of multiple deprivation (IMD) scores that were collated in 2015 as the most recent available data.21
For HbA1c test results, all units were converted to mmol/mol.1 We excluded values less than 20 mmol/mol (4.0%), or greater than 200 mmol/mol (20.4%) as invalid. Results older than 540 days were classed as “missing” since they were unlikely to represent current glycemic control. We classified HbA1c into three groups: ≤53 mmol/mol (7%), 54–74 mmol/mol, and ≥75 mmol/mol (9%) to fit with NICE intensification target guidance (guidance recommends a target of 53 mmol/mol with insulin if HbA1c rises to 75 mmol/mol).
We calculated eGFR using the last serum creatinine result within 2 years. We assumed all creatinine measures were isotope-dilution mass spectrometry (IDMS)-standardized and calculated eGFR using the Chronic Kidney Disease Epidemiology Collaboration equation (CKD-EPI) equation.14 We excluded ethnicity from the estimate of eGFR as General Practitioners (GPs) receive unadjusted eGFRs in laboratory reports. We grouped eGFR results as analogous to CKD stage: 0 to <60 mL/min/1.73 m2, 60 to <90 mL/min/1.73 m2, and ≥90 mL/min/1.73 m2.
To classify proteinuria, we used diagnostic codes for proteinuric kidney disease and continuous measures of ACR. We considered patients to have ACR above the normal range if ACR test records had a positive qualifier, or where the value was greater than 3 mg/mmol. We created a count variable of microvascular disease markers that included a positive ACR test result, a diagnosis of retinopathy, a diagnosis of neuropathy, or a diagnosis of proteinuric kidney disease.22 To calculate the daily dose of metformin prior to treatment change, we used the last metformin prescription prior to treatment change and calculated daily dose as the strength prescribed multiplied by the number provided each day. We included calendar year, split into 6 monthly periods, as a covariate to account for prescribing trends in the UK.5 All codes used in this analysis are publicly available on the EHR data compass website: http://datacompass.lshtm.ac.uk/692/.
Statistical analysis
We describe the patients prescribed each drug (SU, DPP4i, SGLT2i) at first intensification according to clinical, demographic, and lifestyle factors. We then used multinomial logistic regression modeling to better understand the relationships between drug usage and baseline covariates.23 The OR for the explanatory variables denotes the association between each variable and each drug class at first-stage intensification compared with SU (baseline treatment).
The aim of the multinomial models is not to predict drug choice, but to identify which variables might be important to clinicians prescribing drugs for first-stage intensification. Therefore, we did not aim to find the most parsimonious model but drew conclusions from a model with as many relevant covariates as possible while ensuring the model would converge.24 A priori, we defined a wide range of factors that we expected to be important to clinical decision-making, including patient demographic information, clinical measures, comorbidities, and lifestyle measures. We examined variables with strong collinearity and selected the variables for inclusion that were most valid given the data available. For example, we chose retinopathy as a marker of microvascular disease as a sensitive and validated measure that is well screened for in primary care,15 and CVD as a marker of macrovascular disease that is well recorded.25 We found low numbers of people with reduced kidney function, so we used wide eGFR classes to avoid zero-count cells.
To handle missing data, we used multiple imputation with chained equations under the assumption of data being missing at random (MAR).26 We generated 40 imputed datasets. We used predictive mean matching to model continuous variables to better account for non-normality than linear regression: imputed values were drawn from the nearest ten non-missing observations.27 We modeled categorical variables using multinomial logistic regression and ordered categorical variables using ordinal logistic regression. For missingness in continuous variables, HbA1c, BMI, and eGFR, we imputed the variables on the continuous scale and then converted to categorical variables after imputation. The imputation models included all covariates in the analysis model, as well as auxiliary variables including dementia, heart failure, and blindness diagnoses.
Data extraction and processing of CPRD data were completed in Stata MP (version 14). All data analysis has been completed using Stata MP 14 and R version 3.4.1.
Sensitivity analyses
Patient-level IMD data are only available for practices in England, effectively excluding patients in other countries in the UK. Therefore, for our primary analysis, we did not include IMD to maximize the representativeness of the findings. In our first sensitivity analysis, we repeated the primary model for England, including patient-level IMD data to explore the impact of this on treatment intensification.
In addition, to examine the sensitivity of our results to the assumptions made, we conducted further sensitivity analyses. If the patient was censored or died in the 60 days after an alternate drug was prescribed, it is not known whether further metformin therapy was intended by the GP, and therefore these individuals could be mistakenly excluded as drug “switchers”. Therefore, in a sensitivity analysis, we included all patients who died in this period. Finally, retinopathy represents only one microvascular complication associated with type 2 diabetes but multiple complications may independently influence prescribing. Therefore, we repeated the primary analysis, replacing retinopathy with a count of microvascular disease markers including a positive ACR test result, diagnosis of retinopathy, neuropathy, or proteinuric kidney disease.
Post hoc analyses
We observed a strong calendar time interaction in the logistic regression. We therefore repeated the analysis for each individual year 2014–2016 (excluding time as a covariate) and compared ORs of interest using forest plots.
Ethical and scientific approval
The research protocol was approved by the Independent Scientific Advisory Committee (ISAC) of the Medicines & Healthcare products Regulatory Agency Database Research (protocol number 16_267). The protocol was made available to journal reviewers. This study was also approved by the London School of Hygiene and Tropical Medicine Ethics Committee, reference 11923.
Data availability
All codes used in this analysis are publicly available on the EHR data compass website: http://datacompass.lshtm.ac.uk/692/; no further data sharing is possible.
Results
We identified 307,554 people who started antidiabetic treatment, between 2000 and 2017, of whom 280,241 people were aged 18 years and over, with no recent evidence of pregnancy. Of these, 204,238 (73%) initiated treatment with metformin monotherapy and 38,739 people received SU monotherapy (14%). Of those starting treatment with metformin monotherapy, we identified 79,941 (39%) that intensified treatment with any further antidiabetic drug. We then restricted this group to 14,149 individuals who intensified treatment between 2014 and 2017 to reflect only contemporary prescribing decisions. In our selected cohort, 44% (6,294/14,149) received SU, 37% (5,285/14,149) received DPP4i, 11% (1,488/14,149) received SGLT2i, and 8% (1,082/14,149) received insulin or other combinations (Table S1). In keeping with our decision to focus on SUs, DPP4i, and SGLT2is, only 2% (290/14,149) of the cohort were prescribed TZDs between 2014 and 2017. Full inclusions and exclusions are presented in the flowchart in Figure 2.
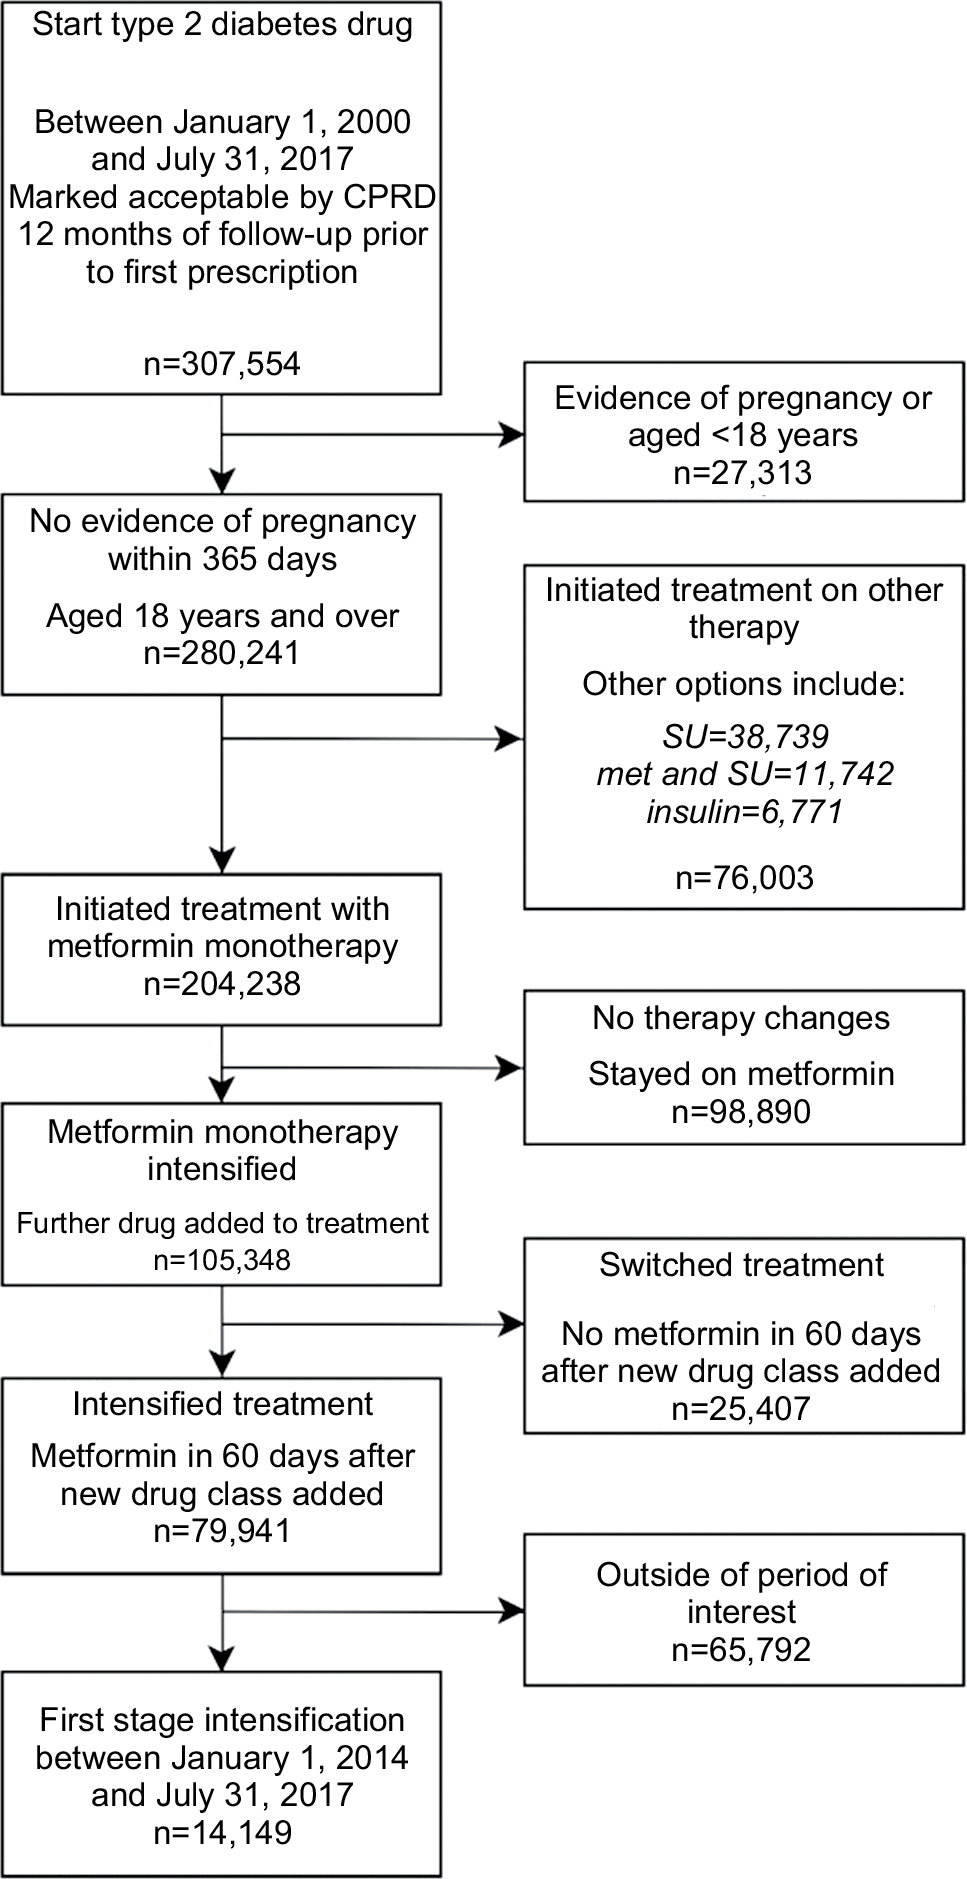 | Figure 2 Flow diagram showing the creation of the study population and reasons for exclusion. Abbreviation: CPRD, UK Clinical Research Datalink. |
Baseline characteristics of patients at point of type 2 diabetes drug intensification 2014–2017
Patient demographic and lifestyle factors for patients prescribed SUs, DPP4is, and SGLT2is are shown in Table 1. Details of patients prescribed insulin or other drug combinations are given in Table S2. The mean age of individuals intensifying treatment was 60 years, mean BMI was 33 kg/m2, and mean eGFR was 87 mL/min/1.73 m2. Individuals prescribed SGLT2is were younger, had higher BMIs, a higher representation of white people, and fewer people classed as more deprived. The DPP4i group had a higher proportion of obese people and white people compared with the SU group. Of the clinical factors, people prescribed SGLT2is had less impaired kidney function compared with people receiving SUs and DPP4i (Table 1). The prevalence of neuropathy, blindness, heart failure, dementia, and proteinuria was low, and similar, across the drug classes. The SGLT2i group had the lowest prevalence of CVD (10%) vs 14% in the SU and DPP4i groups.
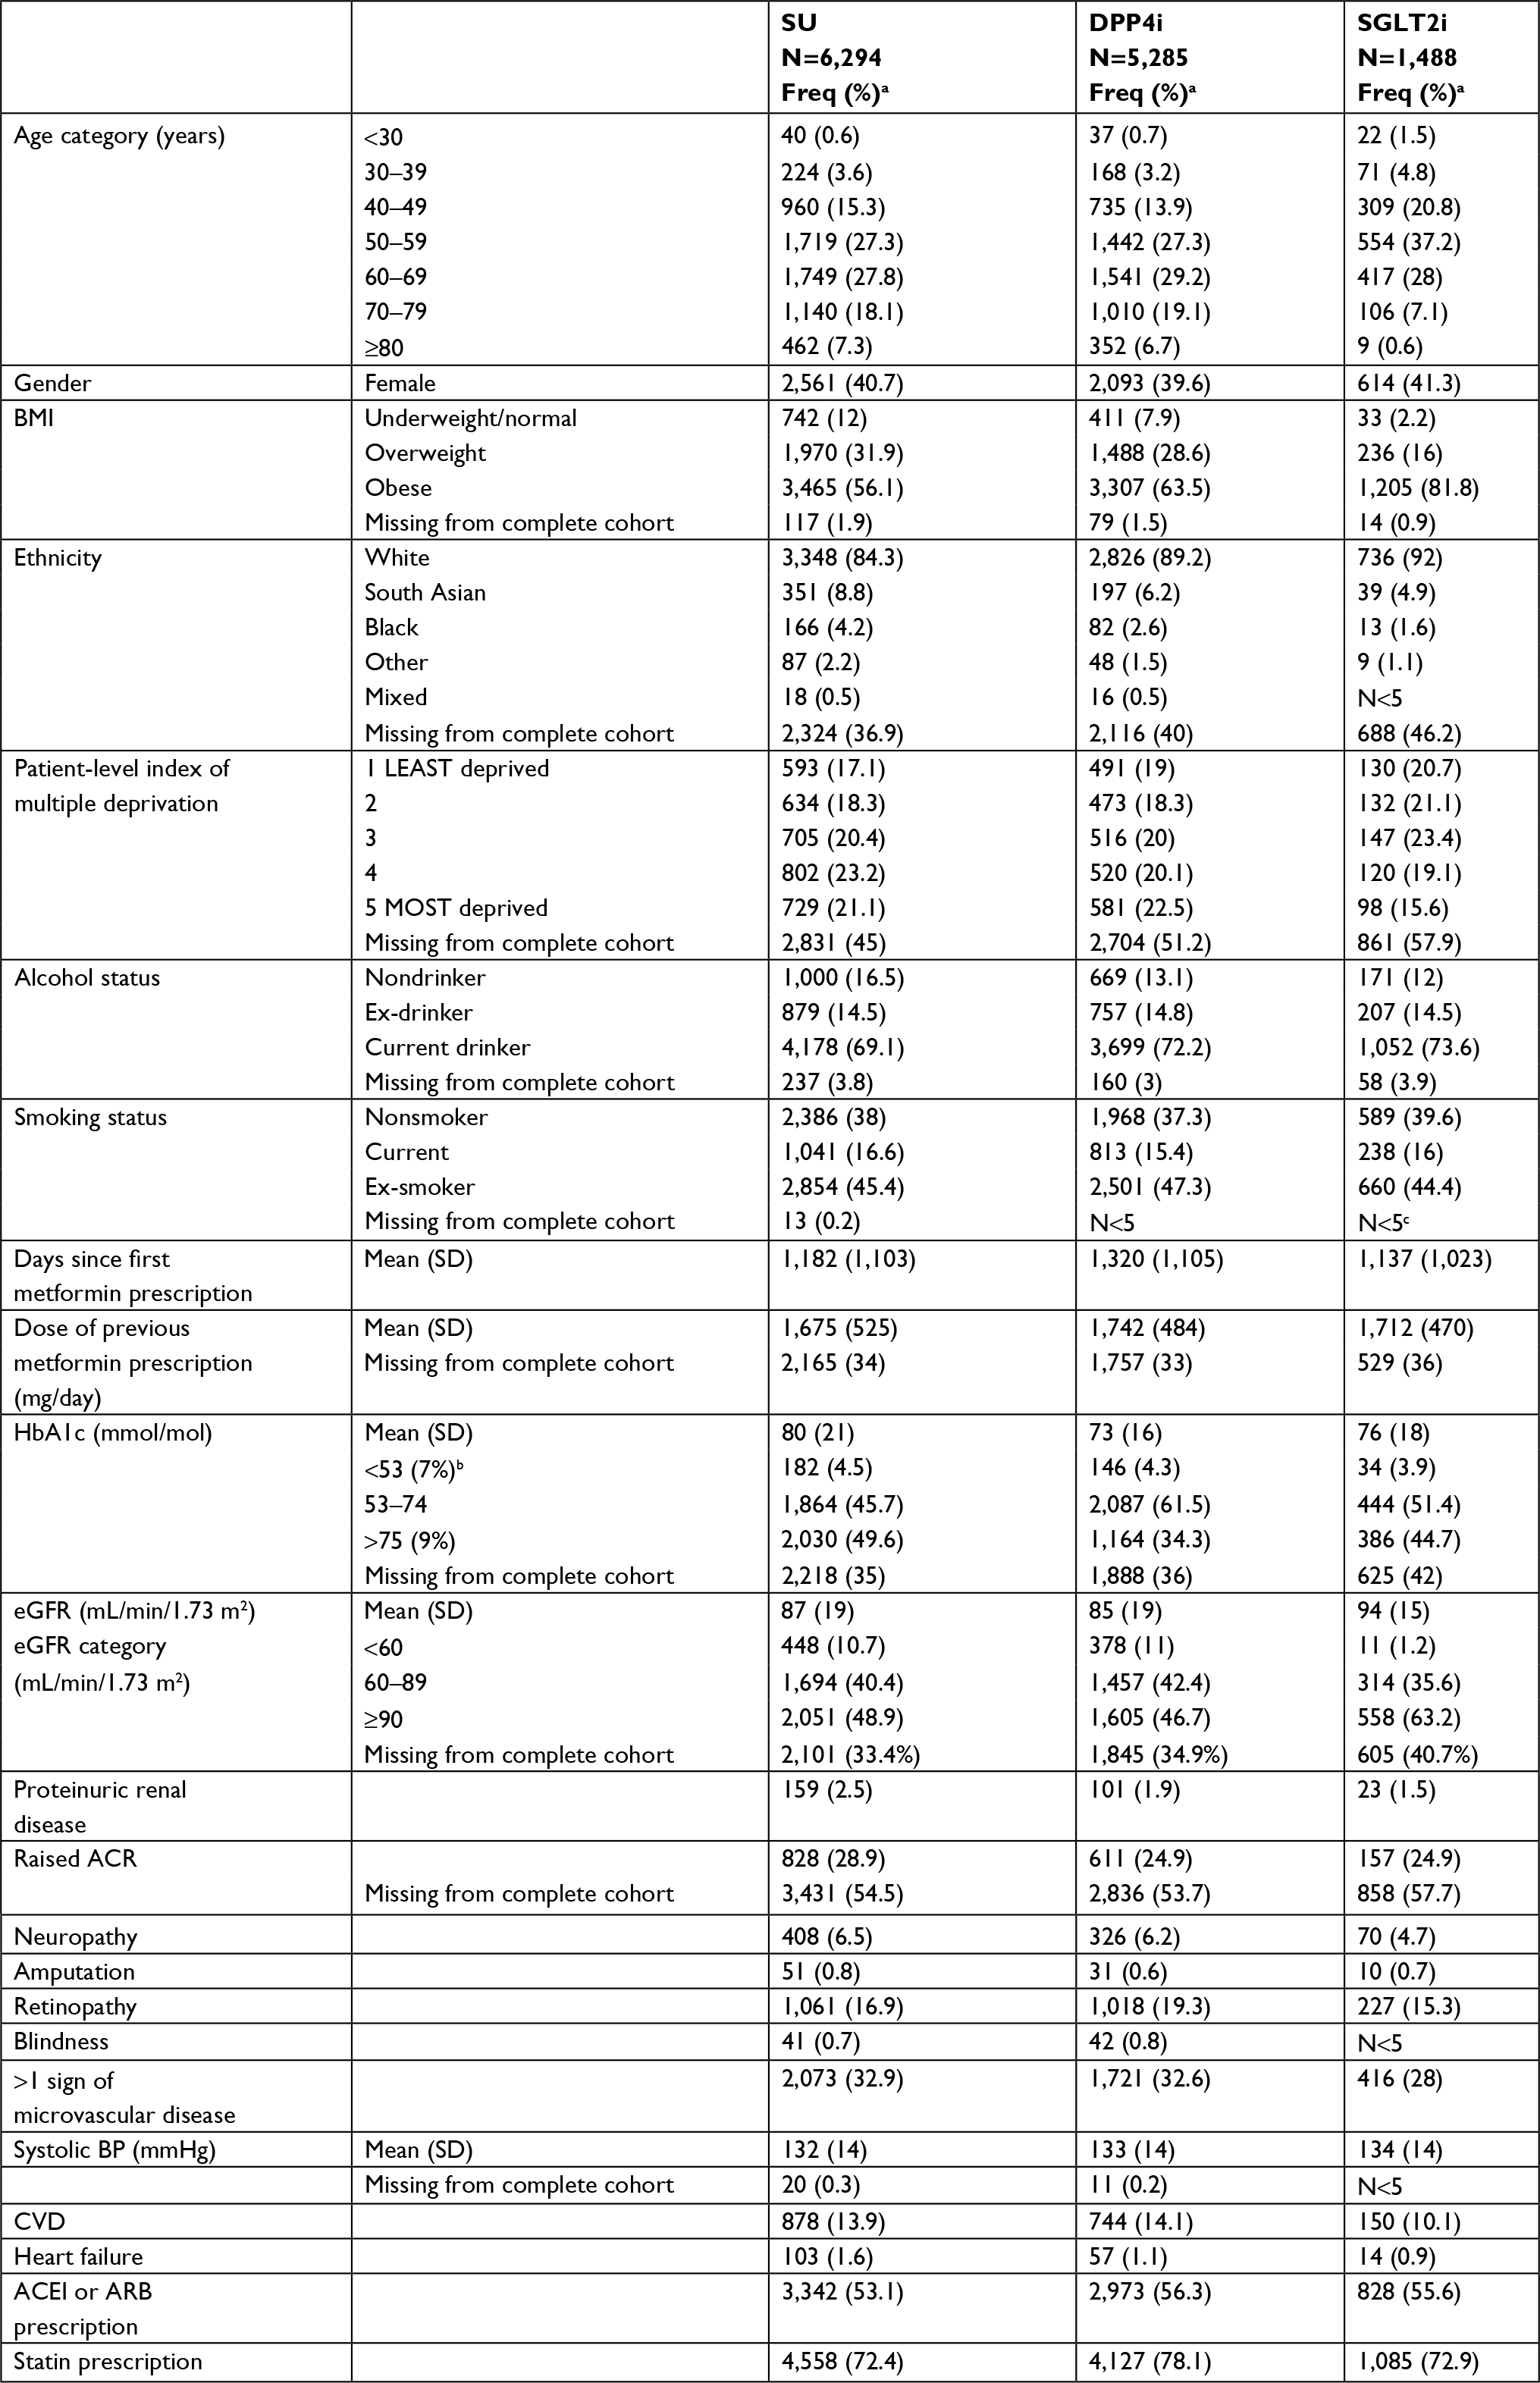 | Table 1 Patient demographic and lifestyle factors, according to first-stage intensification drug prescribing Notes: Numbers are N (%) unless otherwise stated. aUnless otherwise specified; % are of non-missing values, where missing categories are provided, percentage indicates percentage from the entire cohort. bHbA1c % represents HbA1c group according to the National Glycohemoglobin Standardization Program percentage. cFrequencies below five not stated as per Independent Scientific Advisory Committee for MHRA Database Research policy. Abbreviations: ACEI, angiotensin-converting-enzyme inhibitor; ACR, albumin:creatinine ratio; ARB, angiotensin II receptor blockers; BMI, body mass index; CVD, cardiovascular disease; BP, blood pressure; DPP4i, dipeptidyl peptidase-4 inhibitors; HbA1c, hemoglobin A1c; SGLT2i, sodium-glucose co-transporter-2 inhibitors; SU, sulfonylurea; eGFR, estimated glomerular filtration rate. |
Multinomial logistic regression
The results of the primary multinomial regression analysis are presented in Table 2. Age was associated with prescribing choice, with younger people substantially more likely to be prescribed SGLT2is than SUs. The OR for SGLT2i prescription for those aged <30 years was 2.47 (95% CI 1.39–4.39), compared to those aged 60–70 years, and there was a trend towards SU prescribing as age increases. SUs were more commonly prescribed for people with very poor glycemic control: among people with HbA1c >75, the OR for DPP4i prescription was 0.70 (95% CI 0.56–0.88) and that for SGLT2is prescription was 0.76 (95% CI 0.52–1.12) compared with that for SU prescription. For people with an eGFR >90 mL/min/1.73 m2, the odds of receiving SGLT2is was 6.72 (95% CI 3.71–12.20) times greater than someone with an eGFR <60 mL/min/1.73 m2. The presence of microvascular and macrovascular diseases was not associated with drug prescribing but both being overweight and obese were associated with greater odds of being prescribed both DPP4is and SGLT2is. Compared with white patients, the odds of being prescribed SGLT2i among South Asians was 0.60 (95% CI 0.42–0.85) and for black people the OR was 0.54 (95% CI 0.30–0.97). The odds of receiving DPP4i was also lower for South Asian and black people, 0.71 (95% CI 0.58–0.87) and 0.69 (95% CI 0.51–0.95), respectively. In the sensitivity analysis also including socioeconomic status, people from the two most deprived groups were also less likely to be prescribed SGLT2is (eg, OR 0.59 [95% CI 0.44–0.80] for the lowest fifth of IMD compared with the highest) while the findings for ethnicity were unchanged (Table S3). As we have shown previously, prescribing of DPP4i and SGLT2i drugs is increasing rapidly over time.5
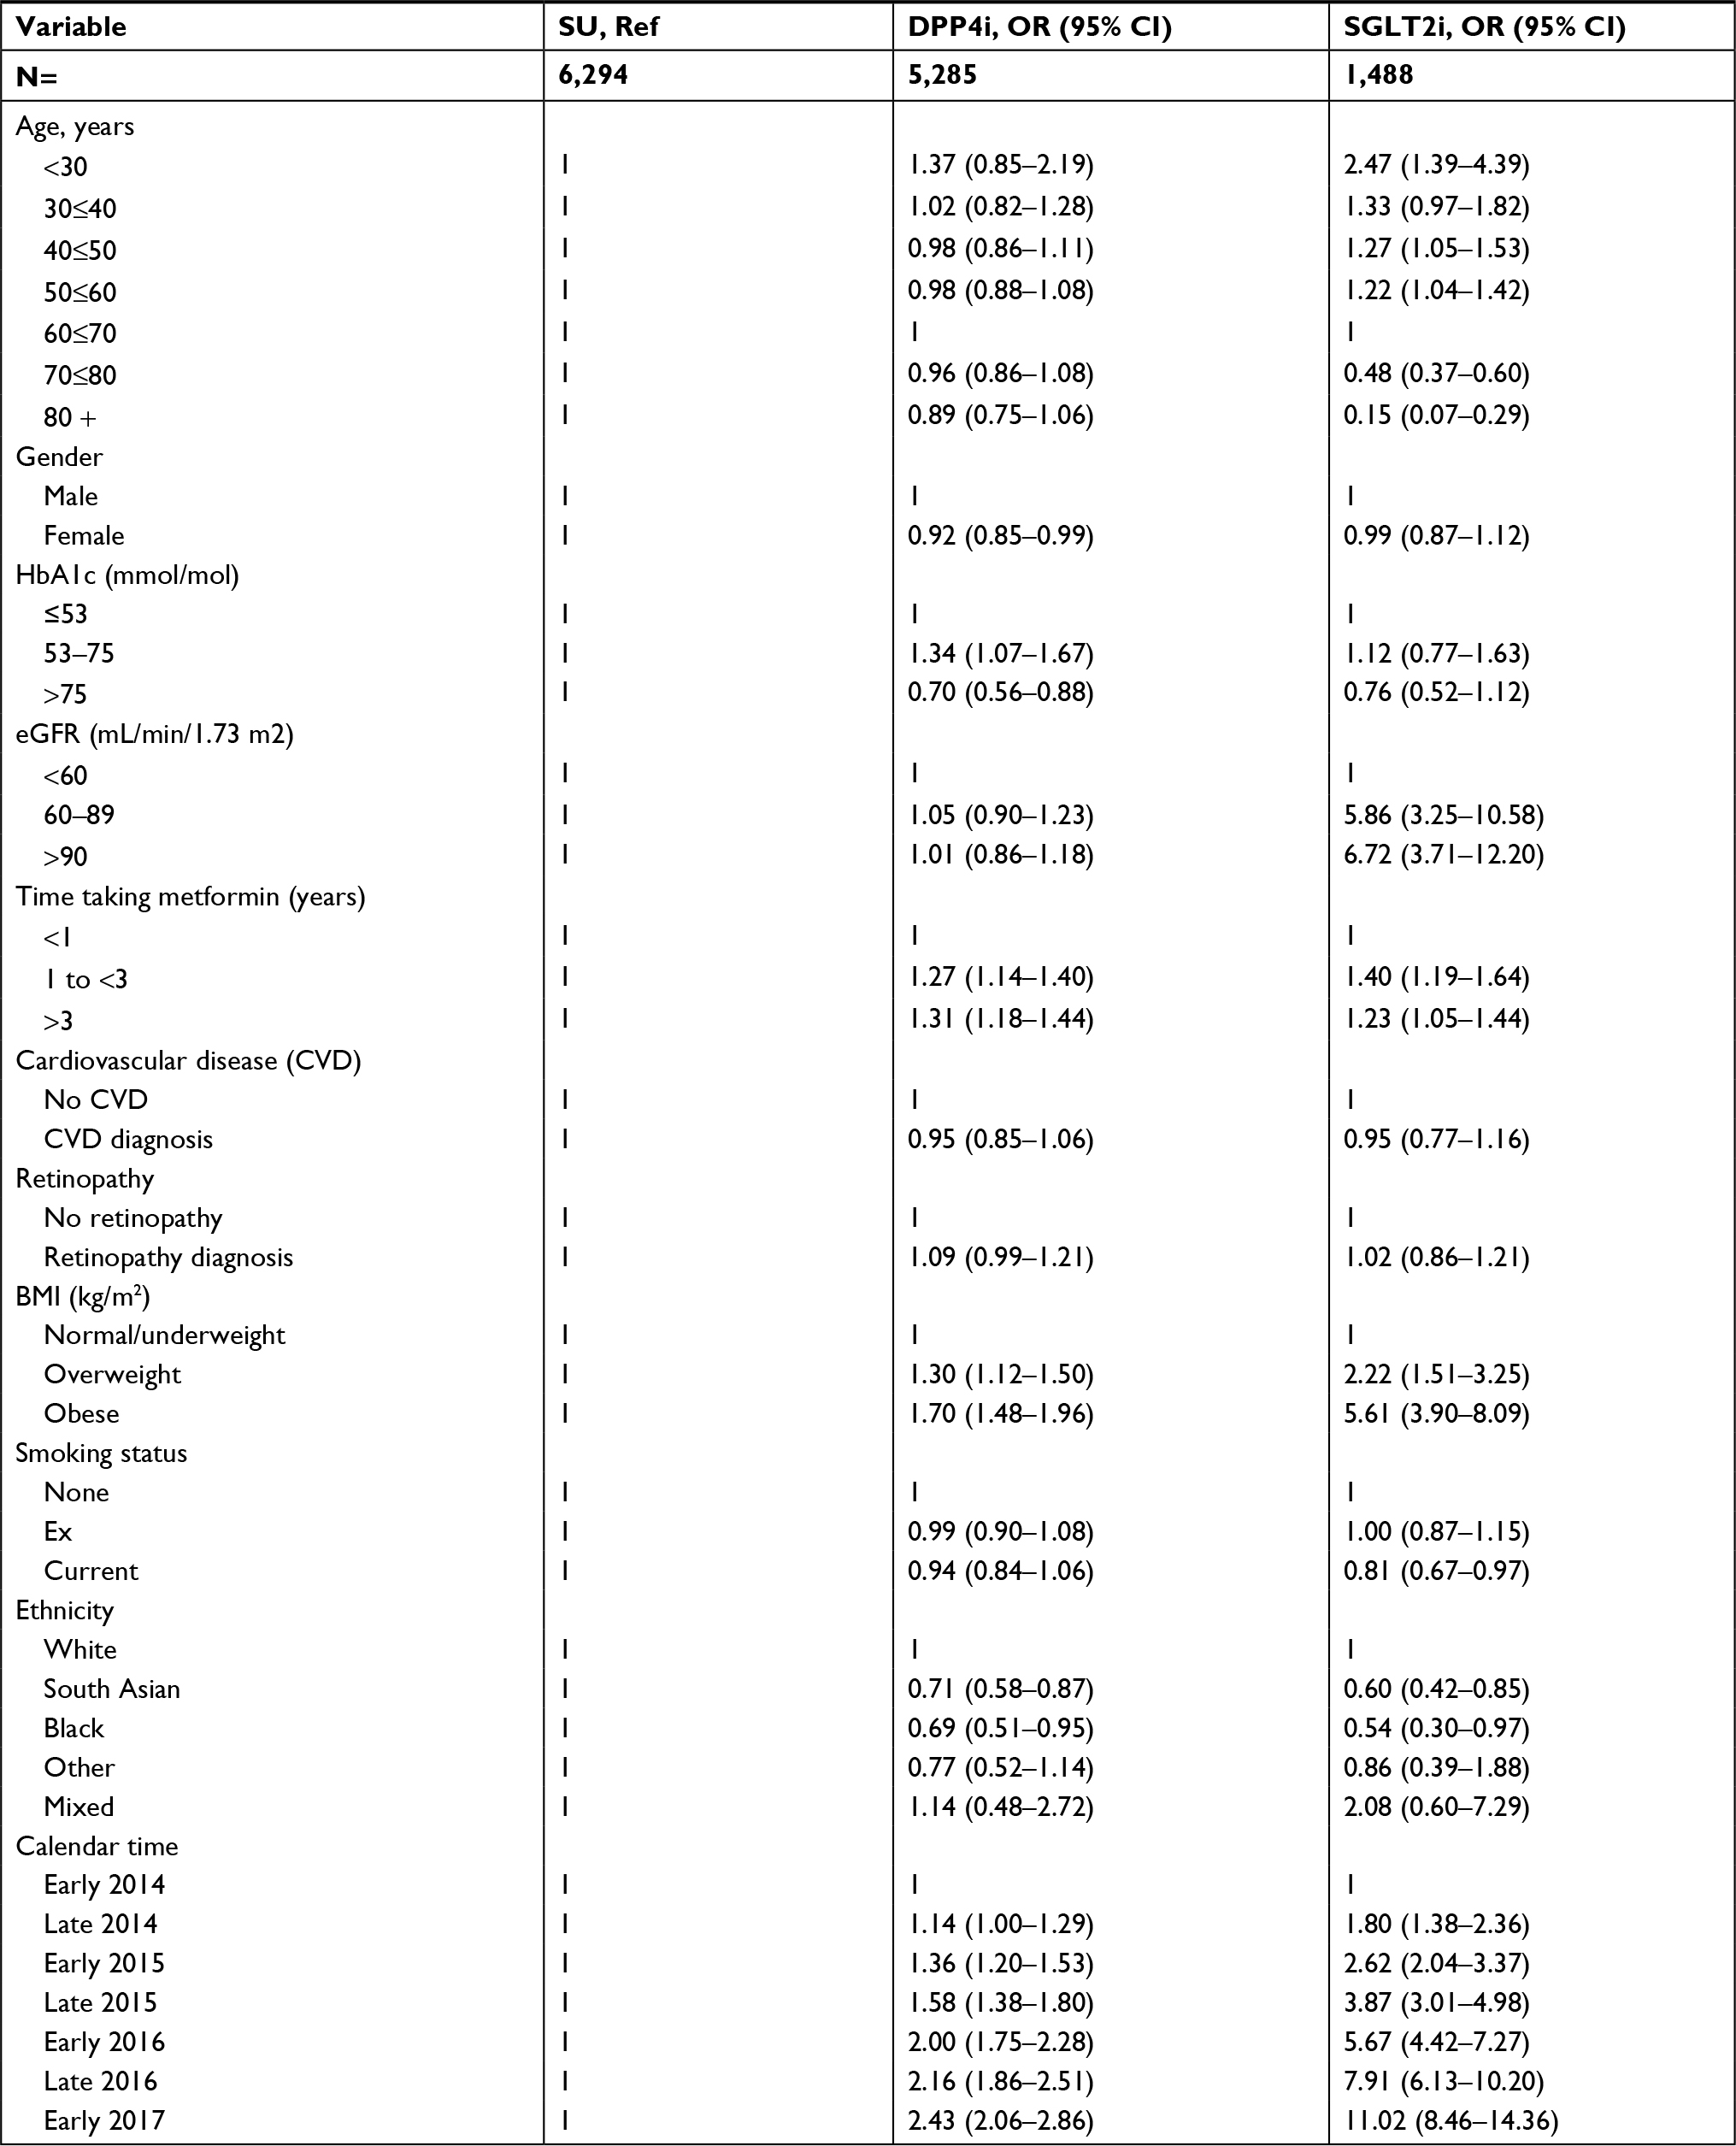 | Table 2 Fully adjusted ORs (95% CIs) for prescription of DPP4i or SGLT2i compared with SUs Note: Results of primary analysis, using multinomial logistic regression with multiple imputation to account for missing data. Abbreviations: BMI, body mass index; DPP4i, dipeptidyl peptidase-4 inhibitors; HbA1c, hemoglobin A1c; SGLT2i, sodium-glucose co-transporter-2 inhibitors; SU, sulfonylurea; eGFR, estimated glomerular filtration rate. |
Taking a complete case analysis approach to the model, or including individuals who were censored or died in the 60 days after prescribing of the intensification treatment for type 2 diabetes, produced no material differences from the primary analysis (Table S4). Redefining microvascular disease as a count of disease indicators also had no effect on the results (data not shown).
Post hoc analyses
Comparison of ORs for ethnicity for each individual year 2014–2016 (Figure S1) showed that for both South Asian and black people, the OR for receiving either SGLT2i or DPP4i was below 1.0 in every year, though for black patients the point estimate moves closer to 1.0 over time.
Discussion
We have identified clinical and nonclinical patient factors associated with drug prescribing between 2014 and 2017, a period when prescribing of the new drug classes, DPP4is and SGLT2is, rapidly increased.5 Compared with SUs, SGLT2is were more commonly prescribed for younger people, for people who are overweight and obese, and for people who are white and of higher socioeconomic status. Findings for DPP4is are similar, although less marked. SUs are more commonly prescribed for patients with very poor diabetic control.
To our knowledge, this is the first analysis of factors associated with prescribing choice for the new type 2 diabetes drugs in the UK. Our findings reflect contemporary data, collected from a large primary care cohort from January 2000 to July 2017. We have identified patients starting additional treatments at a similar stage in their disease course, enabling direct comparability. However, there are limitations to this analysis. First, we may have misclassified some patients with type 1 diabetes, and as SGLT2is are used off-label as an adjunct therapy, this could in part explain our findings of an association with prescribing for the youngest patients. However, we excluded patients who were prescribed insulin at intensification, and required that metformin was re-prescribed after drug intensification, so any degree of misclassification is likely to be minimal. Second, drug prescribing may be influenced by local prescribing guidance such as preapproval restrictions issued by clinical-commissioning groups (CCGs).28 In turn, CCGs may have varying proportions of residents of different ethnicities, so this again may influence our findings related to ethnicity and, similarly, to socioeconomic status. Restrictions related to maintaining anonymity of the data limit this level of data analysis. Third, we used prescribing data collected from primary care and we do not know which prescriptions were initiated in secondary care or specialist community care. Individuals intensified in specialist care environments may be more likely to receive newer drug options, which their GP then continues in primary care. Therefore, factors leading to inequity of access to new medications may occur by variation in who is referred to secondary care but we could not address this in our analysis. Finally, due to low numbers, we did not examine the characteristics associated with prescribing of TZDs, although these are a comparable choice in current prescribing guidance. Following a number of issues including concern about increased risk of heart failure and the 2011 MHRA warning of bladder cancer risk associated with use of pioglitazone, the TZDs have been infrequently prescribed for new users.5,29,30
Of the clinical factors assessed, some of the associations are expected. DPP4is are widely accepted to be weight neutral, and SGLT2is may aid weight loss, whereas SUs are associated with weight gain.2 This may in part explain the independent association of being overweight and obese with being prescribed the new drugs. We found no SGLT2i prescriptions used in people with eGFR <45 mL/min/1.73 m2. This suggests that prescribing of SGLT2is is aligned with clinical guidelines and prescribing information which restrict SGLT2i prescribing when kidney function is low.31 SUs are also prescribed to the patients with the poorest glycemic control. This may reflect NICE guidance that recommends SUs for patients with symptomatic hyperglycemia, or clinicians may perceive that SUs are more effective at reducing HbA1c compared with DPP4is and SGLT2is.1,32
Our findings that age, ethnicity, and levels of deprivation are associated with choice of treatment are in line with other evidence regarding factors that influence prescribing of new drugs.33 Younger patients are known to receive newer drugs more, perhaps driven by patient information and expectations, or by concern that older patients are more likely to experience side effects. However, SUs may not be the most appropriate treatment choice for older people, given their higher risks for hypoglycemia.33–36 Globally, higher income patients often receive newer and more expensive drugs due to their ability to pay more for treatment.33 However, in our study, all individuals are under the care of the NHS, and hence the ability to pay should have no bearing on prescribing, yet level of deprivation is still an independent predictor of drug choice. South Asian and black people received newer drug options (DPP4is and SGLT2is) less often than white people. Disparity in diabetes treatment by ethnicity is well established.37 However, our finding that this extends to prescribing of new treatments is novel. The reasons for these differences are likely to be complex and could include patient awareness of new drug choices, language barriers, or practice-level differences which we were unable to investigate.
An additional finding of our study is the marked differences between the characteristics of people prescribed SGLT2i in routine clinical use compared with randomized trials. The mean age of participants prescribed SGLT2i in our study was 55 years compared with 63.2 years in CANVAS and 63.1 years in EMPA-REG.38,39 In addition, 68% of people in CANVAS randomized to SGLT2i had a prior history of CVD, compared with 10% of people with coded CVD who received SGLT2i in routine care in our study. The reason for the preferential prescribing of these drugs to younger people without ischemic heart disease in routine clinical care, despite the evidence base generated among people with CVD or high cardiovascular risk, is unclear.
This study demonstrates that where there is a choice between well-established and more novel treatments for type 2 diabetes, both clinical and nonclinical factors are associated with prescribing. These include age, ethnicity, and socioeconomic status, suggesting there is disparity in care unrelated to clinical need. The patient characteristics of those taking the newer drugs vary markedly from those studied in clinical trials. The impact of these factors on the clinical outcomes of patients with type 2 diabetes in a diverse population is not yet understood.
Acknowledgments
This study was supported by GlaxoSmithKline (GSK), through a PhD scholarship for SW. LAT is funded by a Wellcome Trust intermediate clinical fellowship (101143/Z/13/Z). HS-F is a full-time employee of GSK. IJD is paid by an unrestricted grant from GSK.
Author contributions
SW, LAT, IJD, HAS-F, EW, and LS conceived and devised the study, and SW analyzed the data. All authors contributed to the interpretation of the data. SW drafted the article and all authors (SW, IJD, EW, HAS-F, DF, AP, LS, LAT) reviewed and edited the manuscript, and approved the version to be published, and agree to be accountable for all aspects of the work. The corresponding author attests that all listed authors meet authorship criteria and that no others meeting the criteria have been omitted. LAT accepts full responsibility for the work and the conduct of the study, had access to the data, and controlled the decision to publish.
Disclosure
SW is funded by a GSK PhD scholarship. HAS-F is an employee of and holds shares in GSK. IJD is funded by, holds stock in and has consulted for GSK. DF has consulted for clinical trial adjudication associated with oral hypoglycemia medications (ACI clinical), and consulted for Boehringer-Ingelheim. AP reports personal fees from NovoNordisk, Boehringer Ingleheim, and Eli Lilly outside of the submitted work. LS has received grants from GSK and has received grants from the Wellcome Trust, the the Medical Research Council, the National Institute for Health Research, the British Heart Foundation, and Diabetes UK outside of the submitted work and is a Trustee of the British Heart Foundation. LAT and EW have no relevant conflicts of interest to disclose in this work.
References
National Institute for Health and Care Excellence (NICE). NG28: Type 2 diabetes in adults: management. 2015. | ||
International Diabetes Federation (IDF). IDF Clinical Practice Recommendations for Managing Type 2 Diabetes in Primary Care. 2017. | ||
American Diabetes Association. Standards of medical care in diabetes - 2017. Diabetes Care. 2017;40(Suppl 1):S1–S135. | ||
Healthcare Improvement Scotland. Guideline 154 Pharmacological management of glycaemic control in people with type 2 diabetes, in A national clinical guideline. 2017. Available from: http://sign.ac.uk/assets/sign154.pdf. Accessed April 12, 2018. | ||
Wilkinson S, Douglas I, Stirnadel-Farrant H, et al. Changing use of antidiabetic drugs in the UK: trends in prescribing 2000–2017. BMJ Open. 2018;8(7):e022768. | ||
Gourgari E, Wilhelm EE, Hassanzadeh H, Aroda VR, Shoulson I. A comprehensive review of the FDA-approved labels of diabetes drugs: Indications, safety, and emerging cardiovascular safety data. J Diabetes Complications. 2017;31(12):1719–1727. | ||
Fleischman W. Association between payments from manufacturers of pharmaceuticals to physicians and regional prescribing: cross sectional ecological study. BMJ. 2016;354:i4189. | ||
Herrett E, Gallagher AM, Bhaskaran K, et al. Data Resource Profile: Clinical Practice Research Datalink (CPRD). Int J Epidemiol. 2015;44(3):827–836. | ||
Zoungas S, Woodward M, Li Q, et al. Impact of age, age at diagnosis and duration of diabetes on the risk of macrovascular and microvascular complications and death in type 2 diabetes. Diabetologia. 2014;57(12):2465–2474. | ||
Koopman RJ, Mainous AG, Diaz VA, Geesey ME. Changes in age at diagnosis of type 2 diabetes mellitus in the United States, 1988 to 2000. Ann Fam Med. 2005;3(1):60–63. | ||
Electronic Medicines Compendium (eMC). Summary of Product Characteristics: Metformin 500mg tablets. 2017 Jan 2016. Available from: http://www.medicines.org.uk/emc/history/23244. Accessed April 12, 2018. | ||
Chamberlain JJ, Herman WH, Leal S, et al. Pharmacologic Therapy for Type 2 Diabetes: Synopsis of the 2017 American Diabetes Association Standards of Medical Care in Diabetes. Ann Intern Med. 2017;166(8):572-578. | ||
Mathur R, Bhaskaran K, Chaturvedi N, et al. Completeness and usability of ethnicity data in UK-based primary care and hospital databases. J Public Health. 2014;36(4):684–692. | ||
Levey AS, Stevens LA, Schmid CH, et al. A new equation to estimate glomerular filtration rate. Ann Intern Med. 2009;150(9):604–612. | ||
Mathur R, Bhaskaran K, Edwards E, et al. Population trends in the 10-year incidence and prevalence of diabetic retinopathy in the UK: a cohort study in the Clinical Practice Research Datalink 2004-2014. BMJ Open. 2017;7(2):e014444. | ||
Hippisley-Cox J, Coupland C. Diabetes treatments and risk of amputation, blindness, severe kidney failure, hyperglycaemia, and hypoglycaemia: open cohort study in primary care. BMJ. 2016;352:i1450. | ||
Tebboth A, Lee S, Scowcroft A, et al. Demographic and Clinical Characteristics of Patients With Type 2 Diabetes Mellitus Initiating Dipeptidyl Peptidase 4 Inhibitors: A Retrospective Study of UK General Practice. Clin Ther. 2016;38(8):1825–1832. | ||
Reed C, Hong J, Novick D, Lenox-Smith A, Happich M. Incidence of diabetic peripheral neuropathic pain in primary care - a retrospective cohort study using the United Kingdom General Practice Research Database. Pragmat Obs Res. 2013;4:27–37. | ||
Hollingworth W, Biswas M, Maishman RL, et al. The healthcare costs of heart failure during the last five years of life: A retrospective cohort study. Int J Cardiol. 2016;224:132–138. | ||
Denaxas SC, George J, Herrett E, et al. Data resource profile: cardiovascular disease research using linked bespoke studies and electronic health records (CALIBER). Int J Epidemiol. 2012;41(6):1625–1638. | ||
Ministry of Housing, C.L.G. English indices of deprivation 2015. 2015 December 2017. Available from: https://www.gov.uk/government/statistics/english-indices-of-deprivation-2015. Accessed April 12, 2018. | ||
Liang H, Kennedy C, Manne S, Lin JH, Dolin P. Monitoring for proteinuria in patients with type 2 diabetes mellitus. BMJ Open Diabetes Res Care. 2015;3(1):e000071. | ||
Hosmer DW Jr, Lemeshow S. Applied Logistic Regression. 2nd ed. Hoboken, New Jersey: John Wiley & Sons; 2000:398. | ||
Greenland S. Modeling and variable selection in epidemiologic analysis. Am J Public Health. 1989;79(3):340–349. | ||
Herrett E, Shah AD, Boggon R, et al. Completeness and diagnostic validity of recording acute myocardial infarction events in primary care, hospital care, disease registry, and national mortality records: cohort study. BMJ. 2013;346:f2350. | ||
Rubin DB. Multiple Imputation for Nonresponse in Surveys. New York: Wiley; 1987. | ||
Morris TP, White IR, Royston P. Tuning multiple imputation by predictive mean matching and local residual draws. BMC Med Res Methodol. 2014;14(1):75. | ||
Mehta S, Wells S, Jackson R, Harrison J, Kerr A. The effect of removing funding restrictions for atorvastatin differed across sociodemographic groups among New Zealanders hospitalised with cardiovascular disease: a national data linkage study. N Z Med J. 2016;129(1443):18–29. | ||
Medicines and Healthcare products Regulatory Agency. Pioglitazone: risk of bladder cancer. Drug Safety. Update. 2011. Available from: https://www.gov.uk/drug-safety-update/pioglitazone-risk-of-bladder-cancer. Accessed April 12, 2018. | ||
Nissen SE, Wolski K. Effect of rosiglitazone on the risk of myocardial infarction and death from cardiovascular causes. N Engl J Med. 2007;356(24):2457–2471. | ||
Electronic Medicines Compendium (eMC). Summary Product Characteristics: Invokana 100 mg and 300 mg film-coated tablets. Dapagliflozin. Available from: http://www.medicines.org.uk/emc/medicine/28400. Accessed April 12, 2018. | ||
Inzucchi SE, Bergenstal RM, Buse JB, et al. Management of hyperglycemia in type 2 diabetes, 2015: a patient-centered approach: update to a position statement of the American Diabetes Association and the European Association for the Study of Diabetes. Diabetes Care. 2015;38(1):140–149. | ||
Lublóy Á. Factors affecting the uptake of new medicines: a systematic literature review. BMC Health Serv Res. 2014;14(1):469. | ||
Kirkman MS, Briscoe VJ, Clark N, et al. Diabetes in older adults. Diabetes Care. 2012;35(12):2650–2664. | ||
Ng JM, Mellor DD, Masson EA, Allan BJ. Sulphonyurea as a cause of severe hypoglycaemia in the community. Prim Care Diabetes. 2010;4(1):61–63. | ||
Winocour P. Managing hyperglycaemia in patients with diabetes and diabetic nephropathy-chronic kidney disease. Assoc Br Clin Diabetol. 2018. | ||
Millett C, Gray J, Saxena S, Netuveli G, Khunti K, Majeed A. Ethnic disparities in diabetes management and pay-for-performance in the UK: the Wandsworth Prospective Diabetes Study. PLoS Med. 2007;4(6):e191. | ||
Neal B, Perkovic V, Mahaffey KW, et al. Canagliflozin and Cardiovascular and Renal Events in Type 2 Diabetes. N Engl J Med. 2017;377(7):644–657. | ||
Zinman B, Wanner C, Lachin JM, et al. Empagliflozin, Cardiovascular Outcomes, and Mortality in Type 2 Diabetes. N Engl J Med. 2015;373(22):2117–2128. |
 © 2018 The Author(s). This work is published and licensed by Dove Medical Press Limited. The full terms of this license are available at https://www.dovepress.com/terms.php and incorporate the Creative Commons Attribution - Non Commercial (unported, v3.0) License.
By accessing the work you hereby accept the Terms. Non-commercial uses of the work are permitted without any further permission from Dove Medical Press Limited, provided the work is properly attributed. For permission for commercial use of this work, please see paragraphs 4.2 and 5 of our Terms.
© 2018 The Author(s). This work is published and licensed by Dove Medical Press Limited. The full terms of this license are available at https://www.dovepress.com/terms.php and incorporate the Creative Commons Attribution - Non Commercial (unported, v3.0) License.
By accessing the work you hereby accept the Terms. Non-commercial uses of the work are permitted without any further permission from Dove Medical Press Limited, provided the work is properly attributed. For permission for commercial use of this work, please see paragraphs 4.2 and 5 of our Terms.