")
Back to Journals » Pediatric Health, Medicine and Therapeutics » Volume 11
Factors Associated with Anemia Among Children 6–23 Months of Age in Ethiopia: A Multilevel Analysis of Data from the 2016 Ethiopia Demographic and Health Survey
Authors Gebrehaweria Gebremeskel M , Lemma Tirore L
Received 20 May 2020
Accepted for publication 21 August 2020
Published 16 September 2020 Volume 2020:11 Pages 347—357
DOI https://doi.org/10.2147/PHMT.S258114
Checked for plagiarism Yes
Review by Single anonymous peer review
Peer reviewer comments 2
Editor who approved publication: Professor Roosy Aulakh
Menaseb Gebrehaweria Gebremeskel,1 Lire Lemma Tirore2
1Department of Public Health, College of Medicine and Health Sciences, Adigrat University, Adigrat, Tigray Ethiopia; 2Department of Public Health, College of Medicine and Health Sciences, Wachemo University, Hossana, Southern Nations Nationalities and peoples, Ethiopia
Correspondence: Menaseb Gebrehaweria Gebremeskel
Department of Public Health, College of Medicine and Health Sciences, Adigrat University, PO Box: 50, Adigrat, Tigray, Ethiopia
Tel +251 3 48870000
Fax +251909850754
Email [email protected]
Background: Anemia is disproportionately borne among children in the African regions including Ethiopia. In Ethiopia, there is limited information on the prevalence and factors associated with anemia among children aged 6– 23 months. Therefore, the aim of this study was to identify individual- and community-level factors associated with anemia among children 6– 23 months of age.
Methods: The data were obtained from the 2016 Ethiopia Demographic and Health Survey, conducted from January to June 2016. A sample of 2554 children aged 6– 23 months was included. Data were analyzed using STATA version 14. A multilevel ordinal logistic regression model was fitted and an adjusted odds ratio with a 95% confidence interval was obtained.
Results: The prevalence of anemia among children 6– 23 months of age was 72.3%; 27.5% mild, 41% moderate, and 3.8% severe anemia. child age 18– 23 months (AOR: 0.76; 95%CI: 0.61– 0.93), female sex (AOR: 0.84; 95%CI: 0.72– 0.98), maternal anemia (AOR: 1.53; 95%CI: 1.28– 1.82), exclusive breastfeeding (AOR: 0.73; 95%CI: 0.54– 0.98), child fever (AOR: 1.41; 95%CI: 1.03– 1.93), underweight children (AOR: 1.42; 95%CI: 1.17– 1.73) and exposure to either newspaper, radio or television (AOR: 0.78; 95%CI: 0.61– 0.99) were the individual-level factors associated with anemia. High community-poverty (AOR: 1.30; 95%CI: 1.01– 1.67), living in the regions of Somali (AOR: 2.08; 95%CI: 1.31– 3.29), Amhara (AOR: 0.65; 95%CI: 0.45– 0.94), Benishangul (AOR: 0.39; 95%CI: 0.25– 0.61) and Harari (AOR: 1.97; 95%CI: 1.18– 3.31) were the community-level factors associated with anemia.
Conclusion: This study showed that childhood anemia is affected both by the individual- and community-level factors. The strategies of promoting exclusive breastfeeding, addressing maternal anemia, child fever, giving special attention for underweight children, and targeting regions identified to have a high risk of anemia should be strengthened to reduce childhood anemia.
Keywords: anemia, individual- and community-level factors, feeding practices, ordinal logistic regression
Introduction
Anemia in children 6–23 months of age is defined as hemoglobin (Hb) concentration in the blood below 11 g/dL.1 It is further classified as mild (10.0 g/dL <Hb <10.9 g/dL), moderate (7.0 g/dL ≤Hb ≤9.9 g/dL) and severe (Hb <7.0 g/dL) based on the concentrations of hemoglobin in the blood.1 Anemia is said to be a severe public health problem when its prevalence is 40% or more, a moderate public health problem when its prevalence is between 20% and 40% and a mild public health problem when its prevalence is between 5% and 20% in any group.2 Although biochemical and hematological tests exist, hemoglobin concentration in the blood is the most reliable indicator of anemia at the population level.3 This later method was used to assess anemia among children aged 6–23 months in the 2016 Ethiopia Demographic and Health Survey (EDHS).4
Globally, anemia affects around 42.6% of children under-five years old.5 African countries have the highest prevalence (62.3%) followed by South-East Asia (53.8%) and Eastern Mediterranean region (48.6%).5 Furthermore, it affects about two-fifths of children under-five years old in Sub-Saharan African countries.6
According to the respective Ethiopia Demographic and Health Survey reports, anemia prevalence among children 6–59 months of age increased from 44% in 2011 to 57% in 2016.4,7 Similarly, its prevalence among children 6–23 months of age was 60.9% and 72.3% in 2011 and 2016, respectively.4,7 This indicates that anemia is a severe public health problem in this age category that increased by 11.4% within a five-year period, during which the government of Ethiopia undertook efforts such as vitamin “A” supplementation, deworming, and use of fortified foods to reduce anemia through national nutrition programs.8
Iron deficiency is the most common cause of anemia during the first two years of life.2 This is due to dietary inadequacies during this critical period, when children switch from a predominantly milk-based diet to a diet based on solid foods, and require more iron for growth.2 In addition, other factors such as infections (malaria, helminthic infections, intestinal worms, and diarrheal disease) genetic conditions, social and demographic factors such as a mother’s education, wealth index, and family size, can affect various medical conditions in children.9–11 The situation is also complicated not only from events in childhood, but also from maternal iron.12
Anemia is an indicator of poor nutrition and health with major consequences of socioeconomic development of a population.13 Children younger than two years of age with severe anemia are at increased risk of mortality and even mild forms, which might be corrected, cause permanent cognitive damage by decreasing attention span and shortening of memory.14
In Ethiopia, prior studies have conducted on factors associated with anemia among children 6–59 months of old.15–17 However, there is limited information on the prevalence and factors associated with anemia among children aged 6–23 months.
This study also planned to use an ordinal multilevel analysis technique which leads to correct estimation of parameters and standard errors.18 Using multilevel analysis technique, community-level effects can be identified from individual-level effects.16,19,20 Furthermore, the effect of anemia differs depending on its severity levels (no anemia, mild, moderate, and severe), since it is an ordinal variable. However, this approach has rarely been used in Ethiopia to identify factors associated with anemia among children.
Finally, this study aims to reveal and affirm many of the risk factors of anemia among children 6–23 months of age.
Materials and Methods
Data Source
Data were extracted from the nationally representative 2016 EDHS. The 2016 EDHS is the fourth survey implemented by the Central Statistical Agency (CSA) in collaboration with the Ministry of Health under the technical assistance of Inner City Fund (ICF) thorough the DHS Program. The data were downloaded from the DHS program website, https://dhsprogram.com/, after obtaining permission. To register and get permission to use the EDHS data, the title and concept note of the thesis proposal was sent through the DHS website. Then an authorization letter was obtained from ICF international permission to use the EDHS data. Accessed data were used for this study only and the EDHS dataset was not shared with a third party without direct registration.
Study Design and Sample Size
A population-based cross-sectional survey was used to collect the 2016 EDHS data. The 2016 EDHS was used a stratified two-stage cluster sampling design. Stratification was achieved by separating each region into urban and rural areas, yielding 21 sampling strata. In the first stage, 645 enumeration areas (EAs) or clusters were selected. Among the selected 645 EAs, 202 were in urban and 443 in rural areas. In the second stage, households were the sampling units and a fixed number of 28 households per each EA were selected. From the total of 10,641 children under-five years old, 3105 were children 6–23 months of age. Data on hemoglobin level from the survey were available for 2554 children.
Anemia Testing
Information on child anemia was obtained by collecting blood specimens from all children age 6–59 months after consent was obtained from their parents or other adults responsible for them. Blood samples were drawn from a drop of blood taken from a finger prick (or a heel prick in the case of children age 6–11 months) and collected in a microcuvette. The Central Statistical Agency (CSA) recruited and trained 72 individuals on how to collect biomarker data (testing for anemia by measuring hemoglobin levels). Hemoglobin analysis was carried out on-site using a battery-operated portable HemoCueanalyser and results were provided verbally and in writing. Details on sampling technique, sample size, data collection tools, data quality control and ethical concerns are available in the 2016 EDHS report.4
Study Variables
All the variables of this study were selected from peer-reviewed literature and questionnaires from the 2016 EDHS. These variables were coded and categorized based on the Demographic and Health Survey (DHS-7) recode manual.21 Anemia status was considered as the outcome variable of this study. Anemia severity among children 6–23 months of age is divided in to four categories based on hemoglobin level cutoff points of the World Health Organization.1
Category 1: non-anemia (Hb ≥11 g/dL).
Category 2: mild anemia (10.0 g/dL ≤Hb ≤10.9 g/dL)
Category 3: moderate anemia (7.0 g/dL ≤Hb < 9.9 g/dL)
Category 4: severe anemia (Hb <7.0 g/dL).
The individual-level variables were: sex, age, birth weight, religion, number of children under-five years old, symptoms of acute respiratory infection, child fever and diarrhea, maternal age and anemia, educational and employment status, child vaccination status and media exposure, stunting wasting and underweight.
Anthropometrics
Stunting was defined as height or length for age (HFA) <-2 SD (standard deviation), wasting as weight-for-height (WFH) <-2 SD and underweight as weight-for-age (WFA) <-2 SD.4
Variables Related to Dietary Diversity and Meal Frequency
The variables related to dietary diversity and meal frequency were: beans (peas, lentils, nuts, and others), grains (bread, pasta, and noodles, or made into ready-to-eat breakfast cereals), tubers (potatoes, cassava, and carrots), vegetables (any dark green leafy vegetables), fruits (mangoes, papayas, other vitamin A fruits), meat, egg, dietary products (cheese, yogurt, other milk products), breastfeeding status, exclusive breastfeeding and minimum meal frequency (children who received solid, semi-solid or soft foods at least twice per day)
The community-level variables that directly measure the community characteristics in the 2016 EDHS were the place of residence (rural or urban) and region (either of the nine regions or the two administrative cities). We created also other additional variables by aggregating the individual-level’s characteristics within their respective clusters. These variables were: community-poverty, community women-education and community women-unemployment.
Community-poverty: the proportion of women who reside in poor or poorest households within the cluster. The aggregate of the poorest or poor individuals can show the overall poverty of the cluster. For this proportion, the median value was calculated as summary statistics and categorized as “High” or “Low” based on this national median value.
Community-women education: Proportion of mothers who attend primary, secondary and higher education within the cluster. The median value was calculated as summary statistics that represent the educational status of women in the cluster and was categorized as “High” or “Low” based on the national median value.
Community-women unemployment status: Proportion of mothers who were not employed within the cluster in the past 12 months. It was categorized as high if clusters had more than or equal to the national median proportion of unemployed mothers or low otherwise.
Methods of Data Analysis
Before doing any analysis, weighting and normalization were done for the sample in order to ensure the representativeness of the sample to different regions and place of residence. Data were analyzed by STATA version 14 and a multilevel ordinal logistic regression model was fitted. Frequencies, percentages, bar graph and pie charts were used to describe categorical variables. The effect of each predictor variable on the outcome variable was checked at a significance level of p≤0.25 independently.22 Variables that are statistically significant at the bivariate multilevel logistic regression analysis were considered as candidates for multivariable analysis. Finally, multivariable analysis was performed to estimate adjusted odds ratios with 95%CI at a significance level of p<0.05.
Assuming varying intercepts across communities (clusters) but fixed coefficients, four models were developed. The first one was the null model which is fitted without independent variables; this was used to determine the variance in anemia status between the clusters in the sample. Whereas, model one was adjusted for individual-level factors and used to examine their contribution to the variation of anemia status. Model two was adjusted for community-level factors and was used for examining whether the community-level variables explain between-cluster variation on childhood anemia. Model three was developed by combining both the individual- and community-level variables.
Null model: for individual i in community (cluster) j, the model can be represented as:

 … … … … null model18
Where:  is anemia status of
  child in the
  cluster
 is the intercept; that is the probability of having anemia in the absence of explanatory variables;
  is community-level effect;
  is error at individual level

 logistic (0,
  ) … … … ….23


Multilevel (Three-level) Ordinal Logistic Regression Model
This model was derived by mixing both individual- and community-level factors simultaneously.
 … … … … … … … ….24
 - is a cumulative probability of being at “c” category of anemia for
  individual in cluster.
 - is a model threshold or intercept for
  level of anemia and it is a fixed parameter.
It represents the cumulative logits of being at or below  level of anemia when the covariates and random effects equal to zero. It is strictly increasing (ie
  < γ2 <· · · <
 ).
).
 number of categories of anemia which equals to 4.
is a coefficient (fixed effect of explanatory variable).
 - is a covariate vector for
  individual in
  cluster.
 -is level-2 (cluster) random effect
Random Effects
Both individual and community (cluster) random effect variances were expressed in terms of variance proportional change (VPC).
 is a proportion of total variation on anemia attributable to community random effect.
It is given as:
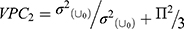 Where
Where  is individual-level variance which equals to 3.29.
 - is cluster (level-2) random effect variance 25
Ethical Considerations
The Ethiopia Health Research Committee said that ethical approval was not necessary in this study considering the fact that the study used data from a research study already approved by an ethical research committee. The relevant data (children recode) on anemia status of children 6–23 months of age was extracted from the EDHS 2016. This was done after being registered and sending the concept note of this study through website in order to get permission from ICF international to access and use the dataset. After obtaining permission (author letter is already obtained), the dataset was downloaded from the website at http://www.DHSprogram.com. In addition, this health survey dataset with all identifier information removed was used for analysis purposes only. Details on the ethical concerns are available in the 2016 EDHS report.4
Results
Individual-level Characteristics of Respondents
Sociodemographic and Socioeconomic Characteristics of Respondents
The prevalence of anemia was 72.3%; 27.5% mild, 41% moderate and 3.8% severe with median hemoglobin concentration of 10.1 (IQR: 9.1–11). More than half (53%) of the children were female. The mean ±SD for the age of children was 13±4 months. About 40.8% of children had average birth weight and 84.7% of households had less than three children under-five years old. Fifteen percent of children were not vaccinated, over half were incompletely vaccinated and 32% were fully vaccinated. Nearly a quarter (24.8%) and 20% of children had symptoms of acute respiratory infection and fever, respectively two weeks prior to the survey. Most of the respondents were Muslims (41%) followed by Orthodox Christians (33.7%). About three-fifths (61.3%) of mothers had no education, three-quarters (74.5%) were unemployed during the 12 months prior to the survey, and eight in ten had never been exposed to newspaper, radio, or television. More than one-third (33%), 14% and 21% of children were stunted, wasted, and underweight, respectively (Table 1). One-third of mothers (30%) were in the age category of 25–29 years. Only 1.5% and 6% of mothers were in the age category of 45–49 and 15–19, respectively (Figure 1).
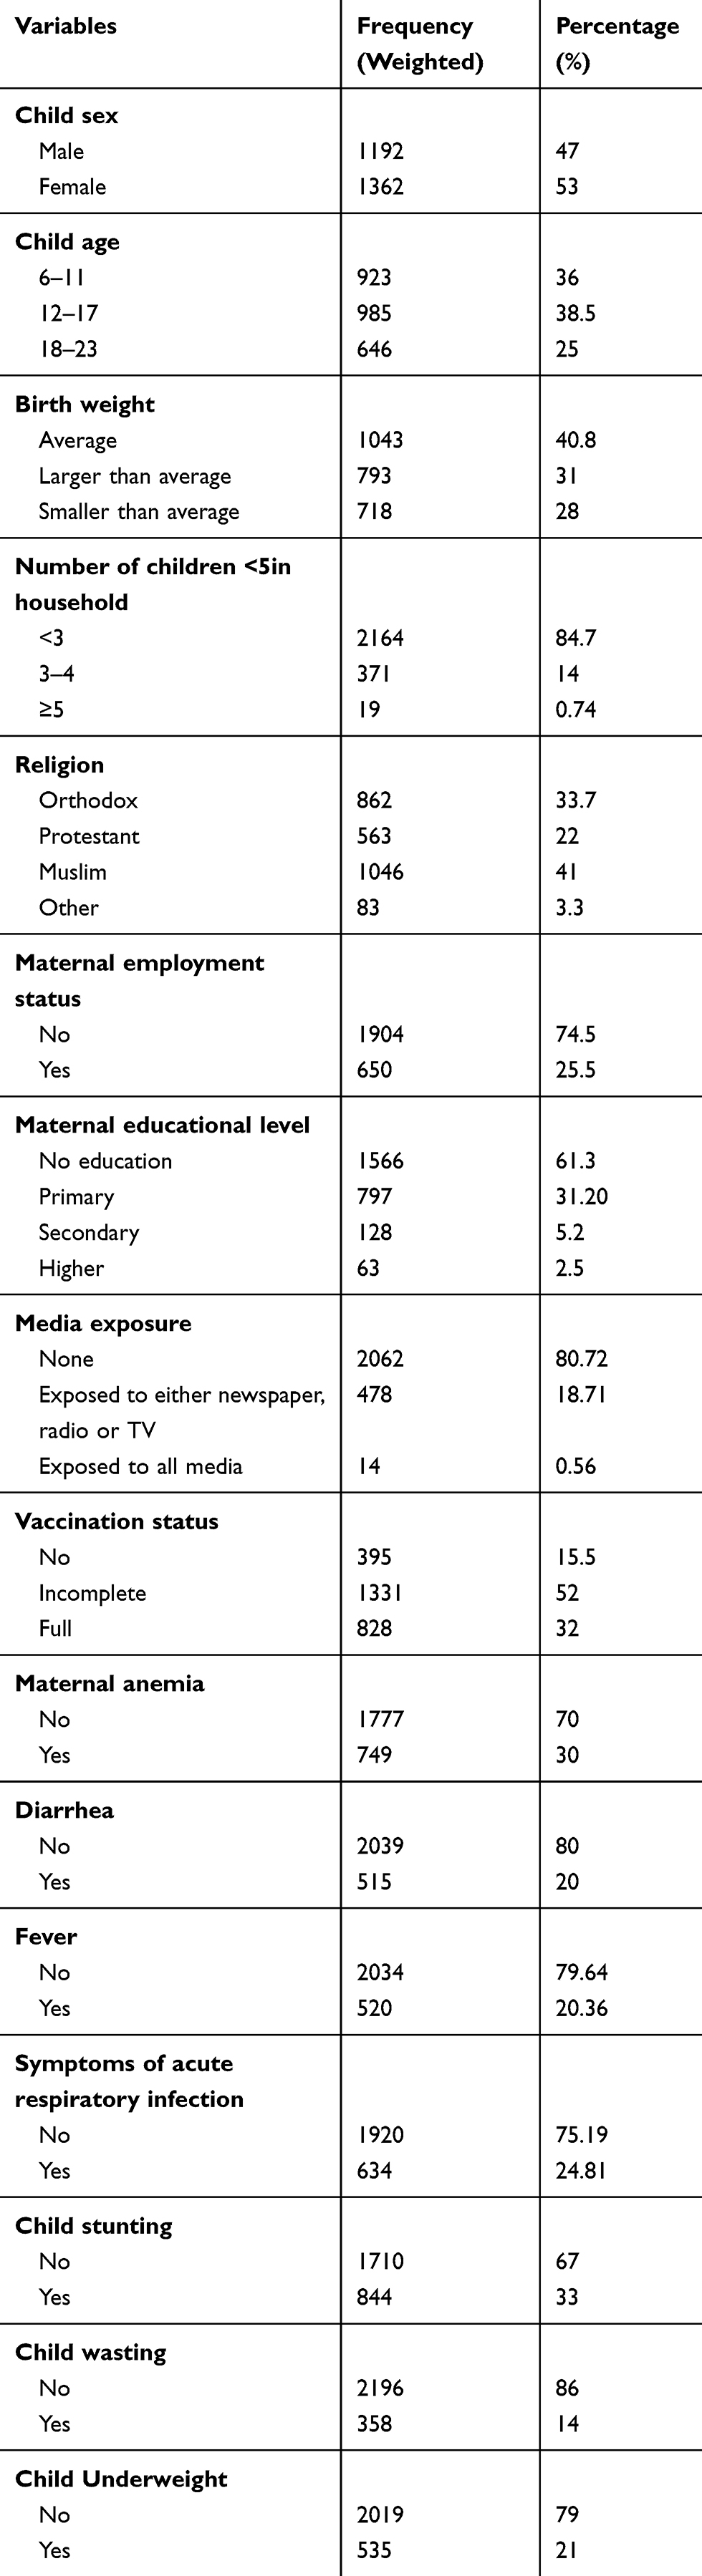 |
Table 1 Individual-level Characteristics of Children in Ethiopia: A Multilevel Analysis of Data from the 2016 Ethiopia Demographic and Health Survey (n=2554) |
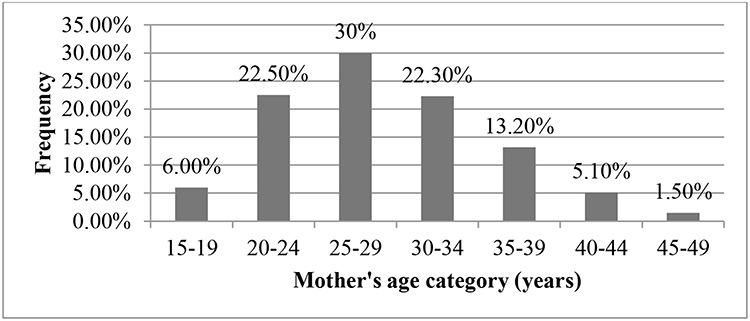 |
Figure 1 Characteristics of mothers (caretakers) by age in Ethiopia: A multilevel analysis of data from the 2016 Ethiopia Demographic and Health Survey (n=2554). |
Feeding Practice Characteristics of Children
About 87% of children were currently breastfeeding, nearly 2% never breastfed and 11% ever breastfed. Nine out of ten (91.7%) children had no exclusive breastfeeding. Above half (55.4%) of children consumed grains, 23% consumed tubers, and 13% consumed fruits. Twenty percent of children consumed beans, 26% consumed dietary products, 6% consumed meat, 17.3% consumed egg, and 13.4% consumed vegetables. Over half (65.2%) of the children ate at least twice per day (Table 2).
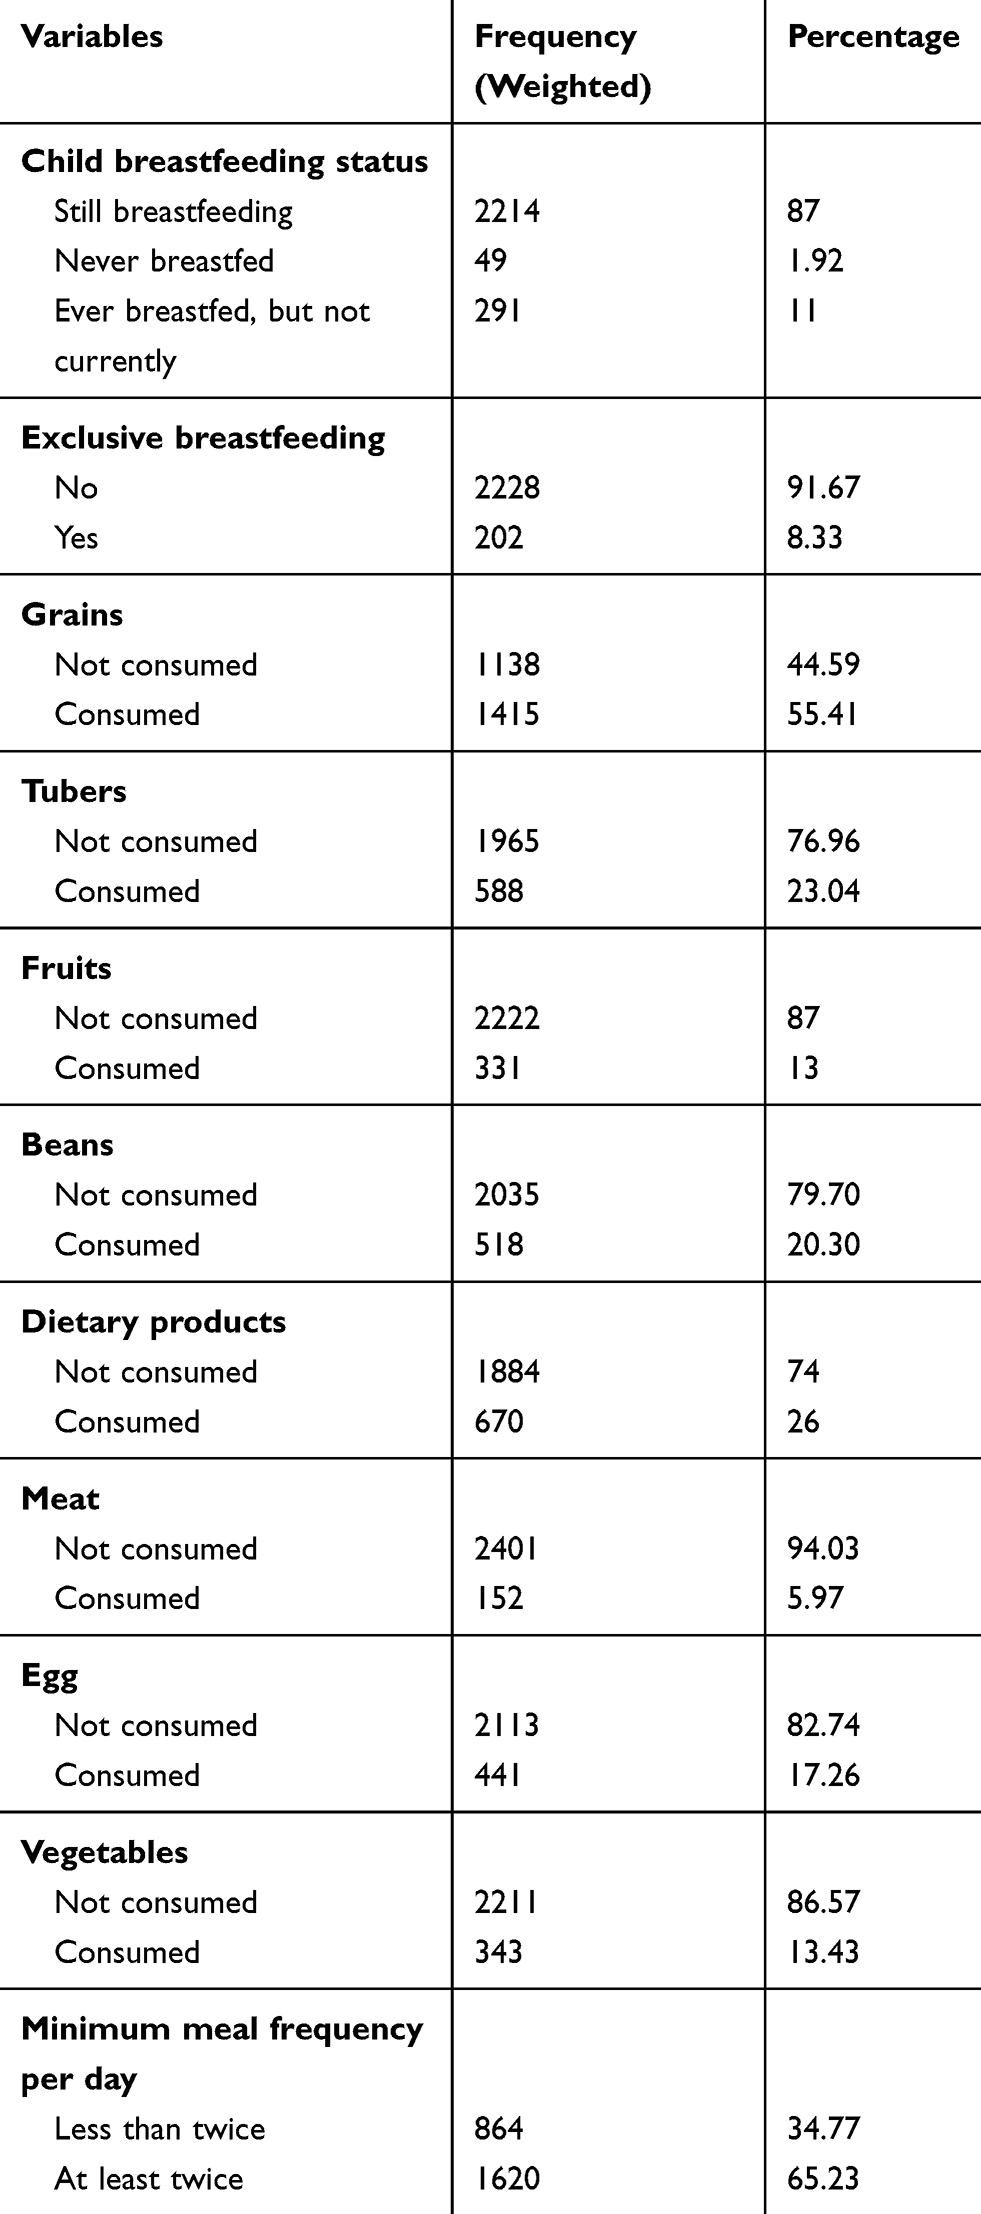 |
Table 2 Feeding Practice Characteristics of Children in Ethiopia: A Multilevel Analysis of Data from the 2016 Ethiopia Demographic and Health Survey (n=2554) |
Community-level Characteristics of Study Subjects
About nine out of ten (89%) of the respondents were rural area residents. Most of the respondents were from Oromia (43.9%) followed by SNNP (21%), and Amhara (19%) region. Above half (54%) of the respondents were living in communities with a high proportion of female unemployment. Above half (54.7%) of the mothers were living in communities with a low poverty status and over half of them (53%) were from communities with a high proportion of educated women (Table 3).
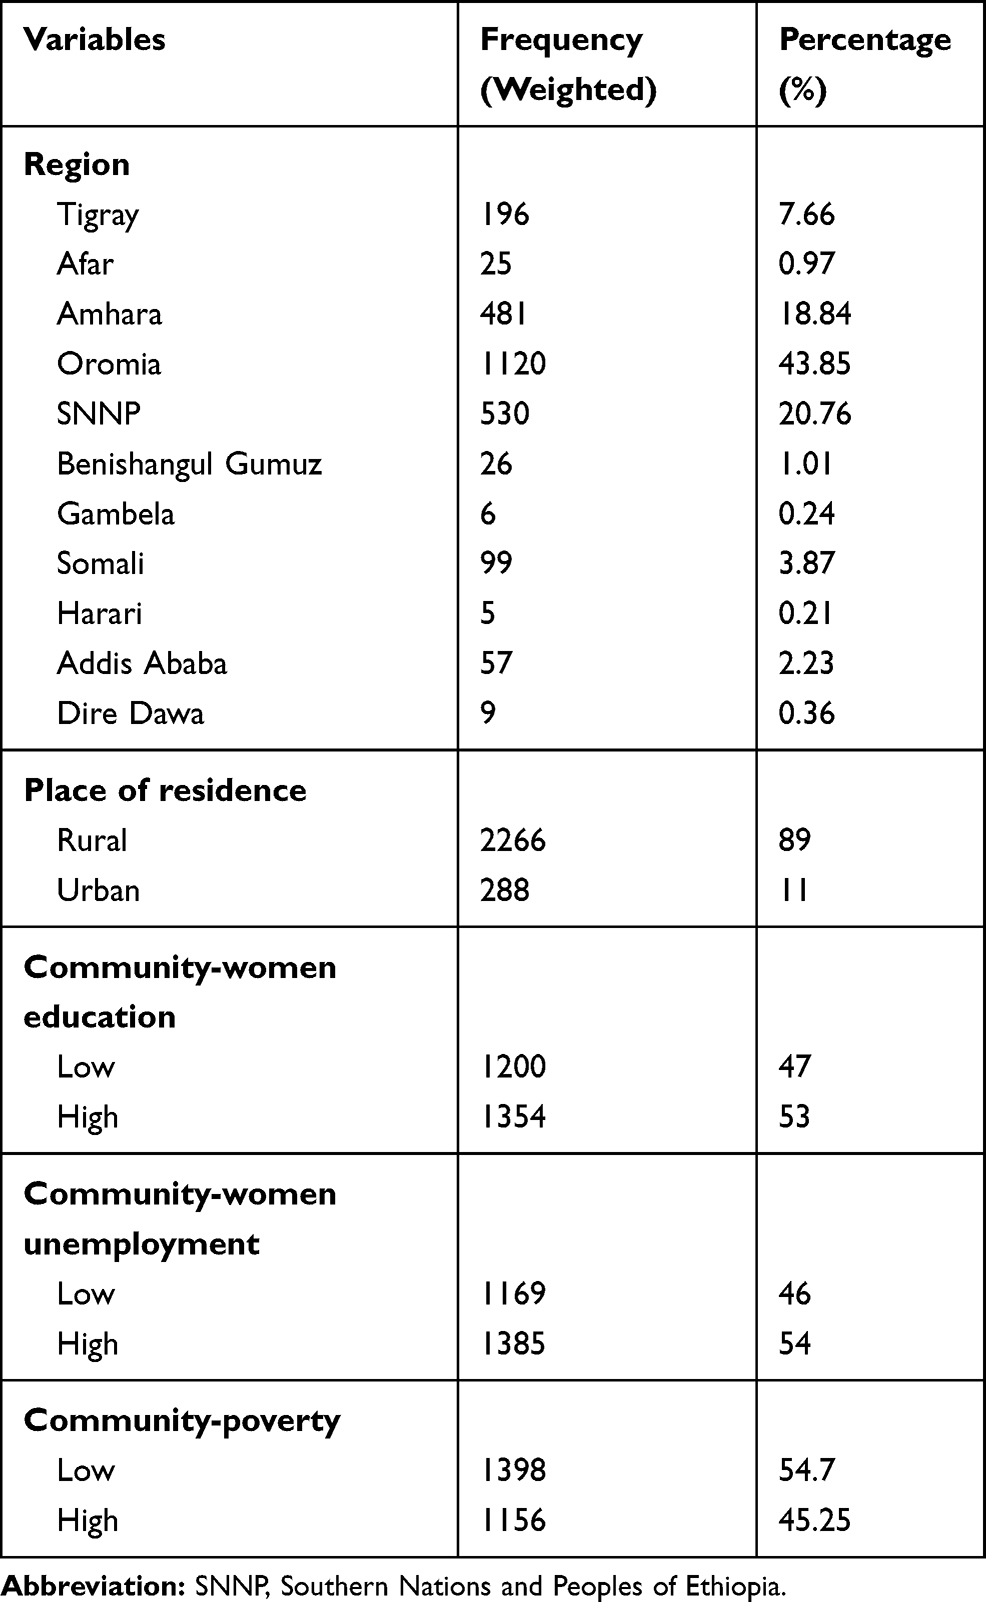 |
Table 3 Community-Level Characteristics of 6–23 Months Old Children in Ethiopia: A Multilevel Analysis of Data from the 2016 Ethiopia Demographic and Health Survey (n=2554) |
Individual- and Community-level Factors Associated with Anemia
Table 4 presents factors associated with anemia among children 6–23 months. The same odds ratio was used and interpreted comparing higher vs lower level of anemia (severe vs moderate and below, moderate and severe vs mild and below, mild and above vs no anemia).
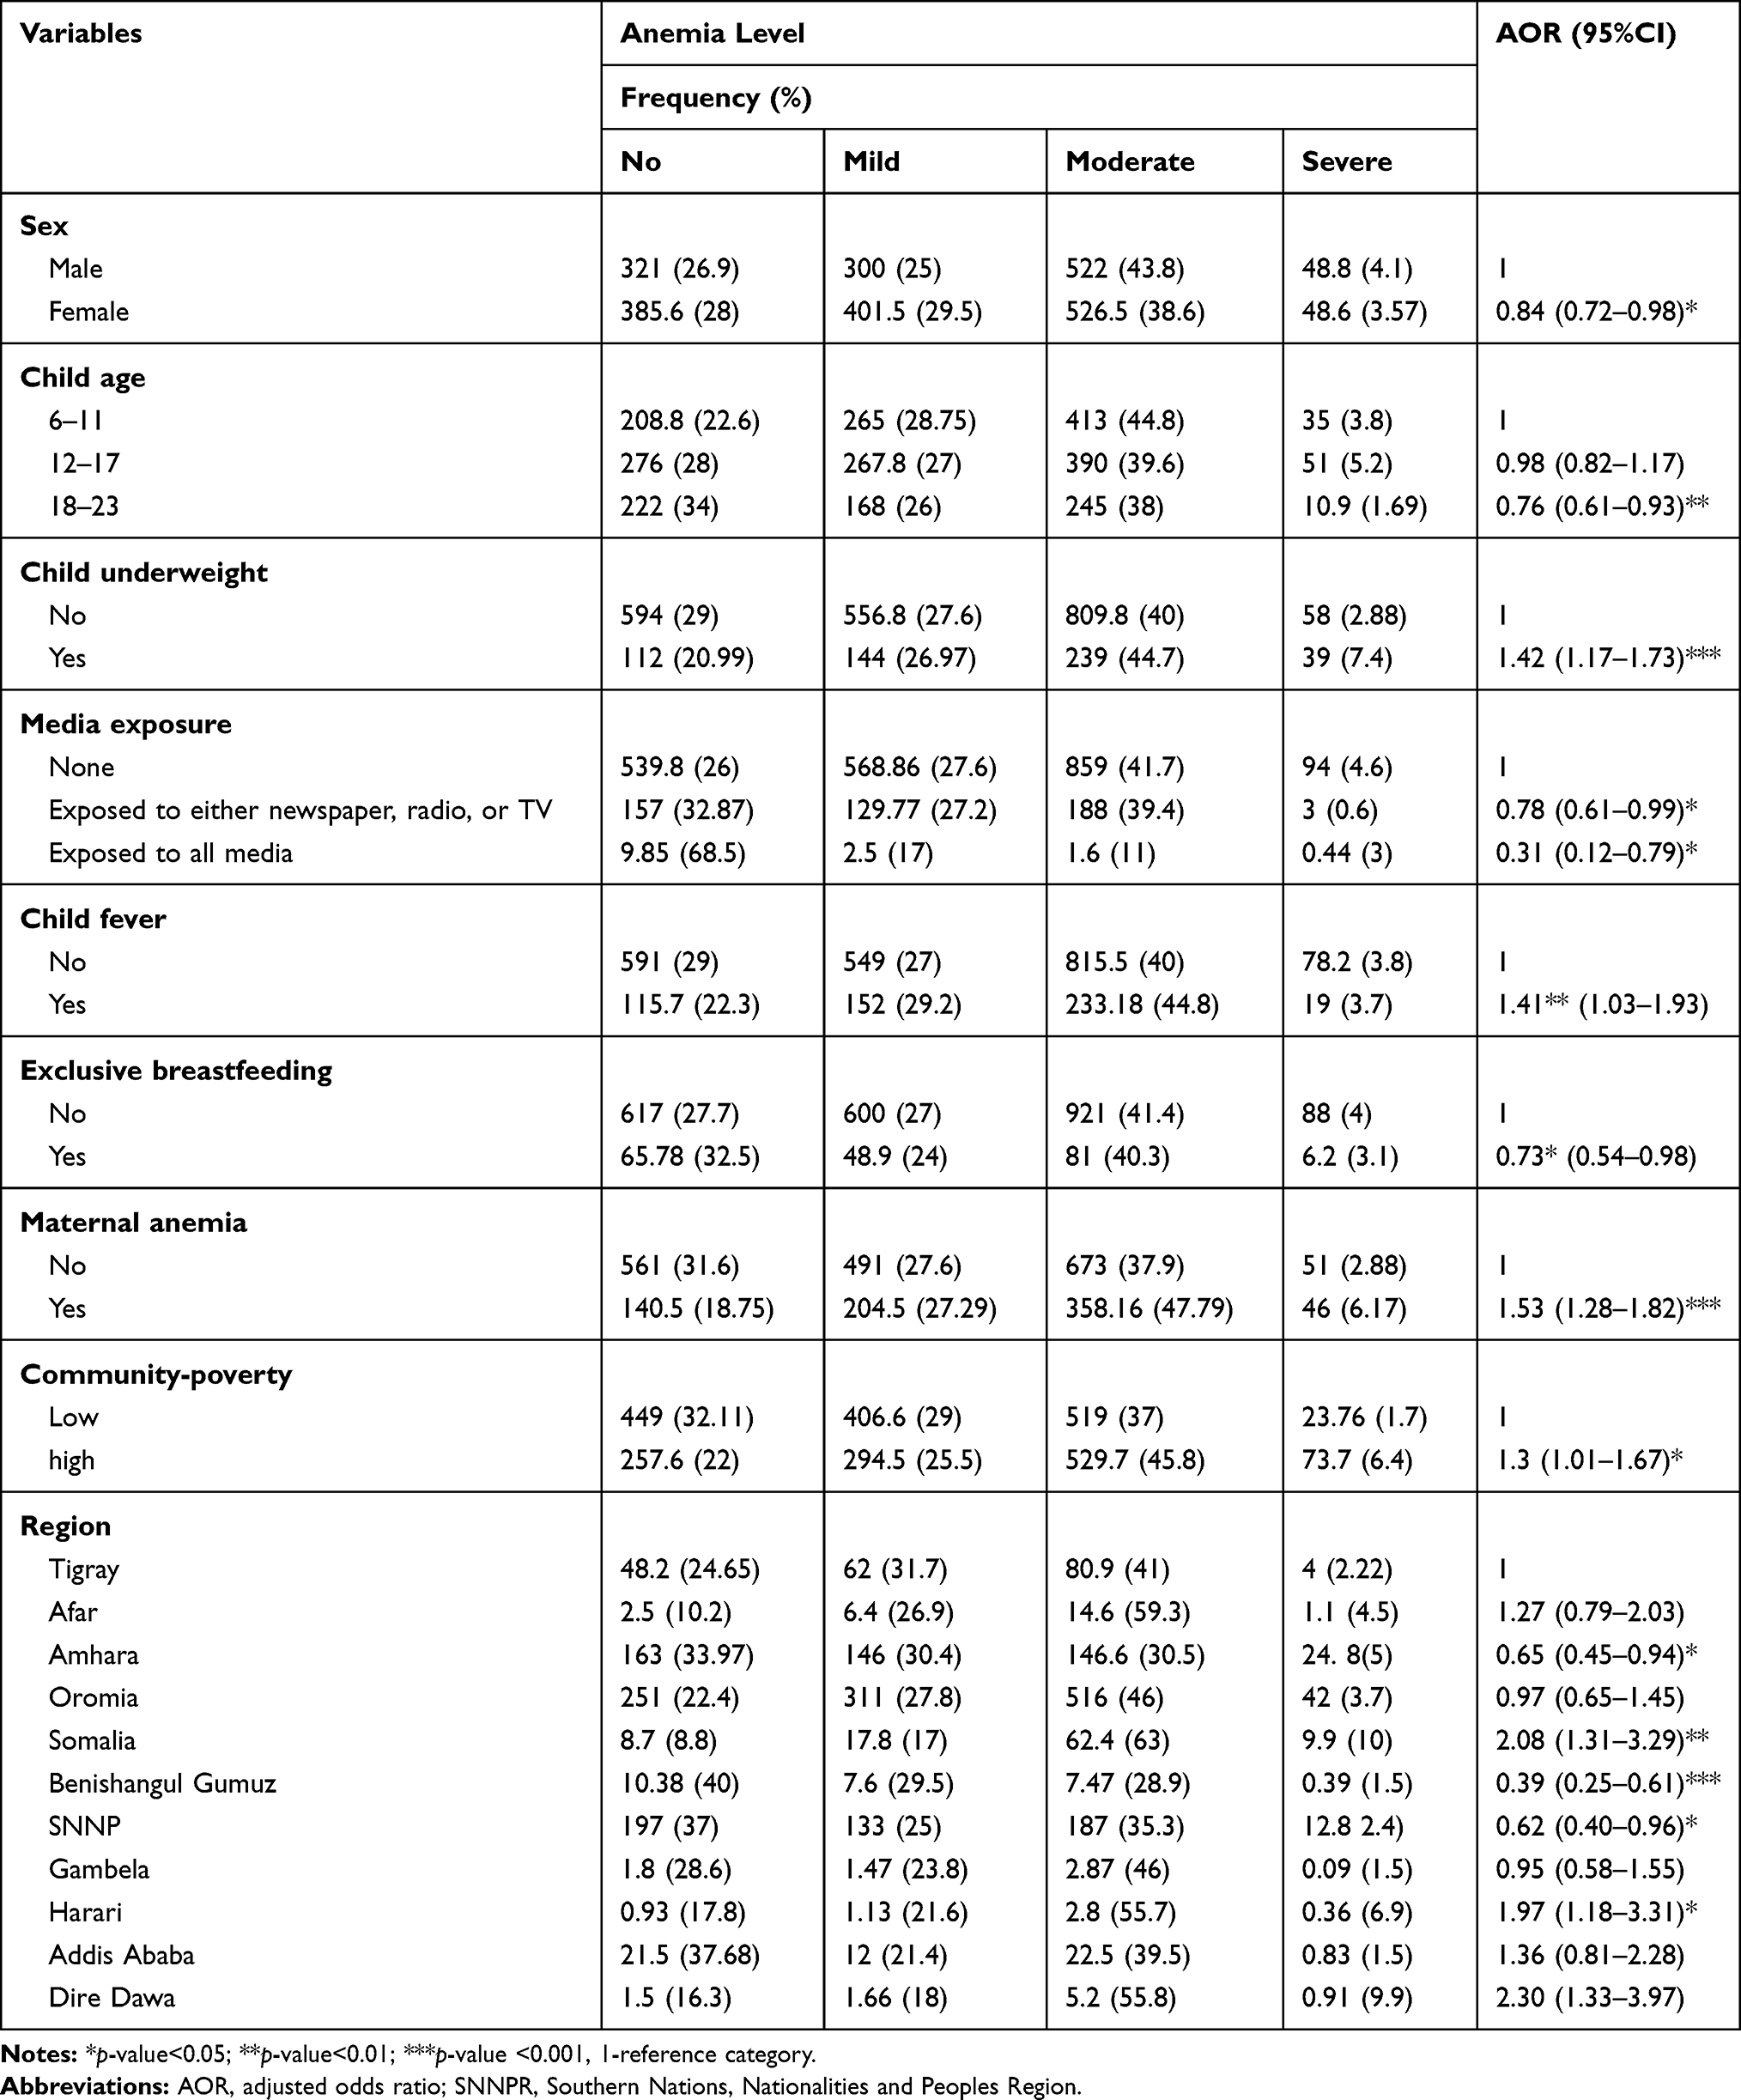 |
Table 4 Individual- and Community-Level Factors Associated with Anemia Among Children 6–23 Months of Age in Ethiopia: A Multilevel Analysis of Data from the 2016 Ethiopia Demographic and Health Survey (n=2554) |
Female children were 16% less likely to be at higher levels of anemia compared to male. Children in the age group of 18–23 months were 24% less likely to be at higher levels of anemia compared to children in the age group of 6–11 months. Underweight children had 40% higher odds of having worse anemia than children who were not underweight. Children of mothers (caretakers) who watch TV or listen radio at least once a week had 22% lesser odds of being at higher levels of anemia compared to their counter parts. Children of mothers (caretakers) who used all media (TV, radio, and newspaper) at least once a week had 69% lower odds of being at higher level of anemia compared to their counterparts. Children of mothers who had anemia had a 1.53 times greater odds of being at higher levels of anemia compared to the children of mothers who had no anemia (Table 4).
The odds of having higher levels of anemia were 2.08, 1.97, and 2.3 times greater for children from Somali, Harari, and Dire Dawa regions compared to the children from the Tigray region. Children living in Amhara, Benishangul, and SNNPS had 35%, 61%, and 38% lesser odds of higher levels of anemia compared to children living in the Tigray region. Children from communities with high poverty had 1.3 times greater odds of higher levels of anemia compared to children from communities with low poverty (Table 4).
Random Effect Estimates of Individual- and Community-level Factors
Random Effects
Four random intercept models were fitted (model 1, 2, 3, and 4).
Model 1 (Null model): This model showed 18% (VPC2=18%) of the total variation in anemia was due to unobserved community-level factors. This quantity of VPC2 was suggestive of using a multilevel model rather than a single level model (Table 4). Models 2 and 3 are adjusted for individual- and community-level variables, respectively.
Model 4 (Final Model): Adjusted for Individual- and Community-level Factors Together
This model showed that 5.73% (VPC2=5.73) of the unexplained variation in anemia could be attributable to unobserved community-level factors alone (Table 5).
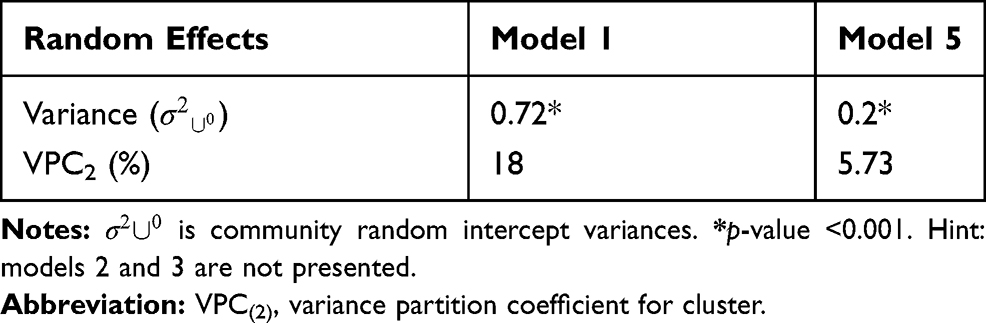 |
Table 5 Random Intercept Variances of Two-level Mixed Effect Models |
Model Diagnostics and Adequacy Checking
Multicollinearity was checked using variation inflation factor (VIF) at cutoff point of 10.26 It was checked for the independent variables in the final model and the VIF was found to range from 1.2 to 4.2 with mean VIF of 2.1. This shows that multicollinearity might not be a problem. Interaction effect was examined by fitting regression models that contained cross-product terms, which yield no significant (p>0.05) interaction effect. Model accuracy was checked by the area under the curve. The receiver operating characteristics (ROC) curve provides a measure of the model’s ability to discriminate between those subjects who experience the outcome of interest vs those who do not.27 The area under the ROC of this model was 0.7069,; which means the ROC curve accuracy for outcome variable (anemia) was 70.7% (Figure 2).
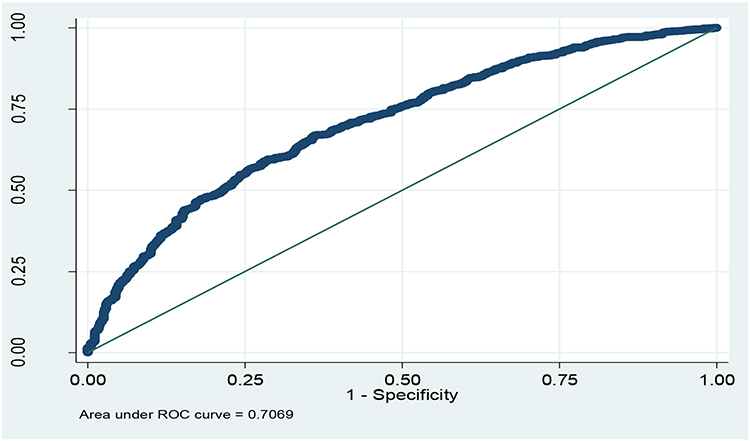 |
Figure 2 Receiver Operating Characteristics curve for anemia among children 6–23 months of age in Ethiopia: A multilevel analysis of data from the 2016 Ethiopia Demographic and Health Survey (n=2554). |
Discussion
The aim of this study was to identify individual- and community-level factors associated with anemia among children aged 6–23 months by employing multilevel ordinal logistic regression analysis. Therefore, anemia among children aged 6–23 months was determined both by individual- and community-level factors. This was supported by the observed heterogeneity in odds of anemia between clusters (communities). Child sex, age, underweight, media exposure, maternal anemia, exclusive breastfeeding and fever were individual-level variables that remained significant in the final model, while region and community-poverty were community-level variables found to be significant in the final model.
Female children were less likely to be at higher levels of anemia compared to male. This finding is similar with a study reported in Ethiopia.9,28,29 The possible explanation for this discrepancy could be due to some inherited causes of anemia are X-linked (eg, G6PD deficiency and X-linked sideroblastic anemia) and occur most commonly in males.30
Child age was negatively associated with anemia. Children 6–11 and 12–17 months old had a higher odds of anemia compared to children 18–23 months old. This result is in line with a study done in Ethiopia.28 This might be due to low consumption of dietary diversity as verified by this study (Table 3) which shows low prevalence of meat, beans, eggs consumption although there was no association with anemia. In addition, complementary foods introduced at the age of six months are often initially rejected by the infant, thereby exacerbating the risk of anemia.
This study also revealed that being underweight was positively associated with anemia. The association between this anthropometric indices and anemia has been observed in other studies.17,31 The possible explanation could be that being underweight and anemic are all caused by a similar pathway that is: feeding children fewer than four times a day and low dietary diversity as indicted by the result of this study (Table 3). Another explanation could be nutritional inadequacies may impair immunity with a repeated infection which, in turn, depletes iron stores. This is supported by the findings of this study, which show that child fever is significantly associated with anemia.
Children of mothers (caretakers) who are exposed to newspaper, radio, or TV at least once a week had lower odds of being at higher levels of anemia compared to their counterparts. To the authors’ knowledge, this is a new finding. The possible explanation could be that media is the main source of information and awareness creation regarding cause of anemia and how to feed children to reduce this.
Children who had exclusive breastfeeding were less likely to have anemia than children who had no exclusive breastfeeding. This finding is in line with a study done in Ethiopia.28 This is due to exclusive breastfeeding in the first six months of life, which reduces exposure to environmental disease-causing pathogens.32 In addition, the presence of lactoferrin and alpha-lacto-albumin in human milk contribute to the defense of breastfed infants against pathogenic bacteria and viruses since they have antimicrobial properties.33
The odds of anemia were higher for children from anemic mothers than non-anemic mothers. This is supported by a study conducted by Prieto-Patron et al.12 The reasons may be that mothers and children share common home environments, socioeconomic and dietary conditions. Moreover, maternal anemia is associated with low birth weight; even children born with adequate weight have reduced iron reserves when their mothers are anemic.34
The presence of fever in the last two weeks prior to the survey was found to be a significant determinant of anemia. This finding confirms the findings from Indonesia and Burma.35,36 This could explain as fever is a symptom of acute febrile illness such as malaria; which might cause red blood cell destruction. Inflammation also decreases red blood cell production.37 Another explanation could be that sick children are known to have poorer appetites.
Region was found to be significantly associated with anemia. This finding is supported by other studies from Ghana and Ethiopia.9,16 Children from Somali, Dire Dawa, and Harari regions had higher levels of anemia than children from Tigray. This could be because of differences in living standards, socioeconomic status, and cultural norms regarding feeding habits among regions. People living in Somalia make their living from livestock production and the main daily meal is milk. A previous study documented that milk reduces the bioavailability of iron which leads to anemia.38 The result in this study (Table 3) also supports this finding in that these children had low consumption of meat, eggs, vegetables and fruits, although there was no association with anemia, these groups are iron sources.
Another finding of this study was the significant association of community-poverty status and anemia among children. Children who live in communities with high poverty status had higher odds of anemia than others. This significant association might be due to less access to health care, fewer job opportunities, and lack of other social services within the community, which resulted in lower-income.
The strategies of promoting exclusive breastfeeding, addressing maternal anemia, child fever, giving special attention to underweight children, and targeting regions identified to have a high risk, should be strengthened to reduce childhood anemia.
Limitations
The limitations of this study include: not controlling possible child-related explanatory variables such as parasitic infection and chronic illness were not included in the analysis because these variables are not in the EDHS data. The data based on self-reporting are limited by recall and misclassification biases, and only children living at the time of the survey were included. In addition, the community variability in the combined model is 6.95%. This indicates that there are still other variables that are not controlled.
Conclusion
Individual-level factors such as lower child age, female sex, child underweight, exposed to newspaper, radio, or TV, no exclusive breastfeeding, child fever, and maternal anemia; community-level factors such as region and community-poverty were identified as factors associated with anemia in children.
The strategies of promoting exclusive breastfeeding, addressing maternal anemia, child fever, giving special attention for underweight children, and targeting regions identified to have a high risk, should be strengthened to reduce childhood anemia.
Acknowledgments
The authors acknowledge EDHS, DHS program and ICF International for providing us with permission to access the dataset.
Disclosure
The authors report no conflicts of interest in this work.
References
1. WHO. Haemoglobin Concentrations for the Diagnosis of Anaemia and Assessment of Severity. Vitamin and Mineral Nutrition Information System. Geneva: World Health Organization (WHO/NMH/NHD/MNM/111); 2011.
2. WHO. Iron Deciency Anemia Assessment, Prevention and Control: A Guide for Program Managers. Geneva, Switzerland: World Health Organization; 2001.
3. WHO. Worldwide Prevalence of Anemia 1993–2005: WHO Global Database on Anemia. Geneva: WHO; 2008.
4. Central Statistical Agency [Ethiopia]. Ethiopia Demographic and Health Survey 2016. Addis Ababa, Ethiopia, and Rockville, Maryland, USA: CSA and ICF; 2016.
5. WHO. The Global Prevalence of Anemia in 2011. Geneva: World Health Organization; 2015.
6. Magalhaes RJS, Clements AC. Spatial heterogeneity of haemoglobin concentration in preschool-age children in sub-Saharan Africa. Bull World Health Organ. 2011;89(6):459–468. doi:10.2471/BLT.10.083568
7. Central Statistical Agency [Ethiopia], ICF, International. Ethiopia Demographic and Health Survey 2011. Addis Ababa, Ethiopia and Calverton, Maryland, USA: Central Statistical Agency and ICF International; 2012.
8. Federal Democratic Republic of Ethiopia. National Nutrition Programme June 2013-June. Available from: http://www.unicef.org/ethiopia.
9. Fosu MO, Frimpong FO, Arthur MO. Factors associated with haemoglobin prevalence among ghanaian children aged 6 – 59 months. J Biol Agri Healthcare. 2014;4:2.
10. Saaka M, Galaa SZ. How is dietary diversity related to haematological status of preschool children in Ghana. Food Nutr Res. 2017;61.
11. Ngwira A, Kazembe L. Analysis of severity of childhood anemia in Malawi: a Bayesian ordered categories model. Open Access Med Stat. 2016;6:9–20. doi:10.2147/OAMS.S95159
12. Prieto-Patron A, Horst K, Hutton ZV, Detzel P. Association between anaemia in children 6 to 23 months old and child, mother, household and feeding indicators. Nutrients. 2018;2018(10):1269. doi:10.3390/nu10091269
13. WHO. Global Nutrition Targets 2025. Anaemia Policy Brief (WHO/NMH/NHD/144). Geneva: World Health Organization; 2014.
14. Bernard J, Brabin ZP, Verhoeff F. An analysis of anemia and child mortality. J Nutr. 2001;131(2):636–648. doi:10.1093/jn/131.2.636S
15. Jemal Y, Haidar J, Makau WK. The magnitude and determinants of anaemia among refugee preschool children from the Kebribeyah refugee camp, Somali region, Ethiopia. South Afr J Clin Nutri. 2017;30(1):1–6. doi:10.1080/16070658.2017.1237446
16. Kawo KN, Asfaw ZG, Sebro NY Multilevel Analysis of Determinants of Anemia Prevalence among Children aged 6-59 Months in Ethiopia: Classical and Bayesian approaches. 2016.
17. Muchie KF. Determinants of severity level of anemia among children aged 6-59 months in Ethiopia: further analysis of the 2011 Ethiopian Demographic and health survey. BMC Nutri. 2016;2:51. doi:10.1186/s40795-016-0093-3
18. Heck RH, Thomas SL, Tabata LN Multilevel and longitudinal modeling with IBM SPSS 2010.
19. Dey S, Raheem E. Multilevel multinomial logistic regression model for identifying factors associated with anemia in children 6–59 months in northeastern states of India. Cogent Mathematics. 2016;3. doi:10.1080/23311835.2016.1159798
20. Ngnie-Teta I, Receveur O, Defo BK, Receveur O. Risk factors for moderate to severe anemia among children in Benin and Mali: insights from a multilevel analysis. Food Nutr Bull. 2007;28:1. doi:10.1177/156482650702800109
21. ICF. Demographic and Health Surveys Standard Recode Manual for DHS7. The Demographic and Health Surveys Program. Rockville, Maryland, USA: ICF; 2018.
22. Stoltzfus JC. Logistic regression: a brief primer. Acad Emerg Med. 2011;18(10):1099–1104. doi:10.1111/j.1553-2712.2011.01185.x
23. Ali S, Ali A, Khan SA, Hussain S. Sufficient sample size and power in multilevel ordinal logistic regression models. Comput Math Methods Med. 2016;2016:1–8. doi:10.1155/2016/7329158
24. Raman R, Hedeker D. A mixed‐effects regression model for three‐level ordinal response data. Stat Med. 2005;24(21):3331–3345. doi:10.1002/sim.2186
25. Leckie G, French R. Module 11: three-level multilevel models MLwiN practical. LEMMA VLE Module 11. 2013;11:1–56.
26. Williams R Multicollinearity. 2015. Available from: http://www3ndedu/william/.
27. Hosmer DW, Lemeshow S. Applied Logistic Regression.
28. Woldie H, Kebede Y, Tariku A. Factors associated with anemia among children aged 6–23 months attending growth monitoring at tsitsika health center, Wag-Himra Zone, Northeast Ethiopia. J Nutr Metab. 2015;2015:1–9. doi:10.1155/2015/928632
29. Gayawan E, Arogundadeb E, Adebayo S. Possible determinants and spatial patterns of anaemia among young children in Nigeria: a Bayesian semi-parametric modeling. Int Health. 2014;6:35–45. doi:10.1093/inthealth/iht034
30. Glader B. Hereditary Hemolytic Anemias Due to Red Blood Cell Enzyme Disorders.
31. Gari T. Anaemia among children in a drought affected community in south-central Ethiopia. PLoS One. 2017;12(3):e0170898. doi:10.1371/journal.pone.0170898
32. Meinzen-Derr JK, Guerrero ML, Altaye M, Ortega-Gallegos H, Ruiz-Palacios GM, Morrow AL. Risk of infant anemia is associated with exclusive breast-feeding and maternal anemia in a Mexican cohort. J Nutr Metab. 2006;136(2):452–458.
33. Lönnerdal B. Nutritional and physiologic significance of human milk proteins. Am J Clin Nutri. 2003;77(6):1537S–43S. doi:10.1093/ajcn/77.6.1537S
34. Allen L. Biological mechanisms that might underlie iron’s effects on fetal growth and preterm birth. J Nutr. 2001;131(2):581–589. doi:10.1093/jn/131.2.581S
35. Semba R, Pee S, Ricks M, Sari M, Bloem MW. Diarrhea and fever as risk factors for anemia among children under age five living in urban slum areas of Indonesia. Int J Infect Dis. 2007;12:62–70. doi:10.1016/j.ijid.2007.04.011
36. Ai Zhao YZ, Peng Y, Jiayin L, et al. Prevalence of Anemia and Its Risk Factors Among Children 6–36 Months Old in Burma. 2012.
37. Quintero JP, Siqueira AM, Tobon A, et al. Malaria-related anemia: a Latin American perspective. Men Inst Oswaldo Cruz. 2011;106:91–104. doi:10.1590/S0074-02762011000900012
38. Kejo D, Petrucka PM, Martin H, Kimanya ME, Mosha TC. Prevalence and predictors of anemia among children under 5 years of age in Arusha District, Tanzania. Ped Health Med Ther. 2018;9:9–15. doi:10.2147/PHMT.S148515
 © 2020 The Author(s). This work is published and licensed by Dove Medical Press Limited. The full terms of this license are available at https://www.dovepress.com/terms.php and incorporate the Creative Commons Attribution - Non Commercial (unported, v3.0) License.
By accessing the work you hereby accept the Terms. Non-commercial uses of the work are permitted without any further permission from Dove Medical Press Limited, provided the work is properly attributed. For permission for commercial use of this work, please see paragraphs 4.2 and 5 of our Terms.
© 2020 The Author(s). This work is published and licensed by Dove Medical Press Limited. The full terms of this license are available at https://www.dovepress.com/terms.php and incorporate the Creative Commons Attribution - Non Commercial (unported, v3.0) License.
By accessing the work you hereby accept the Terms. Non-commercial uses of the work are permitted without any further permission from Dove Medical Press Limited, provided the work is properly attributed. For permission for commercial use of this work, please see paragraphs 4.2 and 5 of our Terms.