")
Back to Journals » International Journal of Nanomedicine » Volume 12
Facile synthesis of N-rich carbon quantum dots from porphyrins as efficient probes for bioimaging and biosensing in living cells
Authors Wu FS, Su HF, Wang K, Wong W, Zhu XJ
Received 24 July 2017
Accepted for publication 29 August 2017
Published 10 October 2017 Volume 2017:12 Pages 7375—7391
DOI https://doi.org/10.2147/IJN.S147165
Checked for plagiarism Yes
Review by Single anonymous peer review
Peer reviewer comments 2
Editor who approved publication: Dr Thomas Webster
Fengshou Wu,1,2,* Huifang Su,3,* Kai Wang,1 Wai-Kwok Wong,2 Xunjin Zhu2
1Key Laboratory for Green Chemical Process of the Ministry of Education, School of Chemical Engineering and Pharmacy, Wuhan Institute of Technology, Wuhan, 2Department of Chemistry and Institute of Advanced Materials, HKBU Institute of Research and Continuing Education (Shenzhen), Hong Kong Baptist University, Hong Kong, 3Department of Medical Oncology, Sun Yet-Sen University Cancer Center, State Key Laboratory of Oncology in South China, Collaborative Innovation Center for Cancer Medicine, Guangzhou, People’s Republic of China
*These authors contributed equally to this work
Abstract: N-rich metal-free and metal-doped carbon quantum dots (CQDs) have been prepared through one-step hydrothermal method using tetraphenylporphyrin or its transition metal (Pd or Pt) complex as precursor. The structures and morphology of the as-prepared nanoparticles were analyzed by X-ray diffraction, high-resolution transmission electron microscopy, X-ray photoelectron spectroscopy, and Fourier transform infrared spectra. Three kinds of nanocomposites show similar structures except for the presence of metal ions in Pd-CQDs and Pt-CQDs indicated by X-ray photoelectron spectroscopy. All of them display bright blue emission upon exposure to ultraviolet irradiation. The CQDs exhibit typical excitation-dependent emission behavior, with the emission quantum yield of 10.1%, 17.8%, and 15.2% for CQDs, Pd-CQDs, and Pt-CQDs, respectively. Moreover, the CQDs, Pd-CQDs, and Pt-CQDs could serve as fluorescent probes for the specific and sensitive detection of Fe3+ ions in aqueous solution. The low cytotoxicity of CQDs is demonstrated by MTT assay against HeLa cells. Therefore, the CQDs can be used as efficient probes for cellular multicolor imaging and fluorescence sensors for the detection of Fe3+ ions due to their low toxicity, excellent biocompatibility, and low detection limits. This work provides a new route to synthesize highly luminescent N-rich metal-free or metal-doped CQDs for multifunctional applications.
Keywords: carbon quantum dots, porphyrin, biosensing, bioimaging, Fe3+
Introduction
Carbon quantum dots (CQDs), as a new type of fluorescent nanomaterial, have attracted tremendous interest in biomedical imaging and tumor diagnosis due to their bright fluorescence, good hydrophilicity and biocompatibility, tunable photoluminescence, and low toxicity compared with conventional organic dyes and semiconductor QDs.1–3 In the last decade, a variety of CQDs have been synthesized by two main methods: “top-down” and “bottom-up”.4 Among them, hydrothermal treatment of natural precursors is a low-cost and convenient route to prepare CQDs.5–9 However, most reported CQDs have a relatively low fluorescence quantum yield in comparison to inorganic semiconductor quantum dots.10–13 To improve the fluorescent properties of CQDs, two kinds of modifications including surface functionalization and heteroatom doping were proposed.14–16 In 2006, Sun et al first proved that surface passivation of CQDs with poly(ethylene) glycol diamine can remarkably enhance their fluorescence quantum yields.17–20 More recently, heteroatom-doped CQDs have attracted much attention, as they can effectively modulate the intrinsic properties of CQDs, such as electronic characteristics and local surface chemical features, and sometimes may provide CQDs with additional properties.21,22 For example, N-, B-, P-, S-, or Si-doped CQDs could improve the optical properties of pure CQDs.23–29 Lanthanide-doped CQDs can act as new probes with near infra-red fluorescence or fluorescence/magnetic resonance dual response.30–33 However, the development of functional CQDs doped with transition metal using fixed metal complexes as precursors is yet to be reported.34–36
Tetraphenylporphyrin (TPP) is the simplest tetrapyrrole, which could easily chelate with various transition metals such as Pd, Pt, Fe, Co, and so on. Using TPP or its metal complexes as precursor, a flaky graphite structure could be easily formed due to their planar geometries. Herein, the new N-rich metal-free CQDs or metal-doped CQDs (M-CQDs) with bright luminescence were prepared by a facile one-pot hydrothermal method using TPP or its Pd(II) or Pt(II) complex as a carbon precursor. Their structures and morphology were unambiguously demonstrated by high-resolution transmission electron microscopy (HRTEM), X-ray diffraction (XRD), X-ray photoelectron spectroscopy (XPS), and Fourier transform infrared (FTIR) spectra. Three kinds of nanocomposites show similar structures except for the presence of metal ions in Pd-CQD and Pt-CQD indicated by XPS spectra. Moreover, the CQDs and M-CQDs as fluorescent sensors for the detection of Fe3+ were fully investigated. Finally, the cytotoxicity and biocompatibility of CQDs and the application of CQDs as efficient probes for multicolor bioimaging and fluorescence sensors for the detection of Fe3+ ions were studied.
Materials and methods
Materials and instruments
TPP and its metal complexes of Pd(II)TPP and Pt(II)TPP were synthesized in the laboratory. All chemicals were used as received without any further purification. FTIR spectra were recorded on a Bruker Vertex 70 spectrometer. XPS was performed using an SKL-12 spectrometer modified with a VG CLAM 4 multichannel hemispherical analyzer. Photoluminescence (PL) spectra were recorded on a Perkin-Elmer LS 55 spectrofluorometer. The electronic absorption spectra in the ultraviolet/visible (UV/vis) region were recorded with a Hewlett Packard 8453 UV/vis spectrophotometer. TEM analyses were performed on an FEI-Tecnai G2 S-Twin TEM, operating at an acceleration voltage of 200 kV. X-ray powder diffraction measurements were investigated using a Bruker D8 Advance diffractometer through nonmonochromatic Cu Kα X-ray at 40 kV, 40 mA.
Preparation of CQDs and M-CQDs
The proposed formation procedure of CQDs and M-CQDs is shown in Figure 1. Briefly, 0.25 g of TPP or its metal complex (Pd[II]TPP or Pt[II]TPP), five drops of concentrated nitric acid, and 0.5 mL of 1,2-ethanediamine (EDA) were dissolved in a 25 mL beaker with 10 mL ethanol. After ultrasonic mixing for 15 min, the homogeneous solution was transferred to an autoclave and then heated at 250°C for 20 h. The solution was purified in a centrifuge for 30 min to remove agglomerated particles, and then dialyzed against deionized (DI) water for 2 days. The aqueous solution of CQDs and M-CQDs was lyophilized at 4°C to yield the desired product.
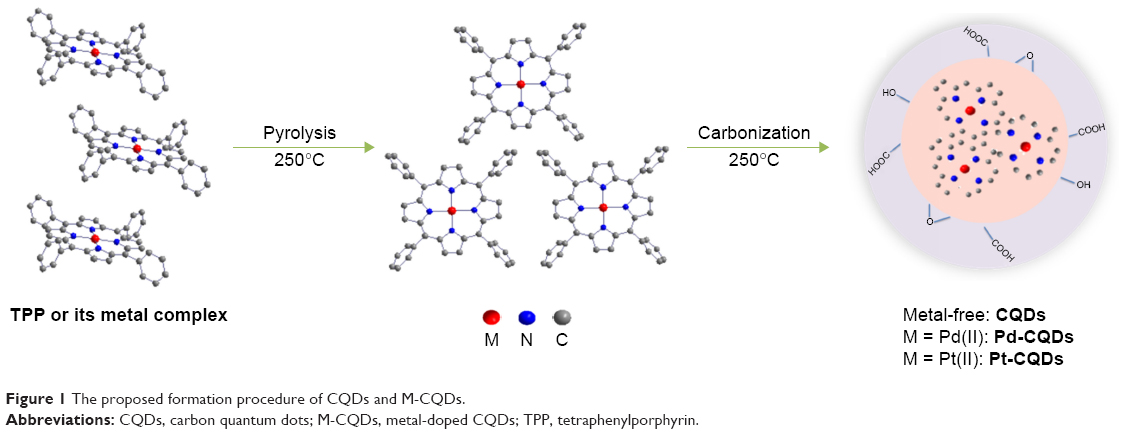 | Figure 1 The proposed formation procedure of CQDs and M-CQDs. |
The calculation of quantum yields of CQDs and M-CQDs
The quantum yield of CQDs was measured with quinine sulfate as the reference (0.1 M H2SO4 aqueous solution, fluorescent quantum yield ~54%) by the following equation:
Φ = Φst (I/Ist) (η/ηst)2 |
where Φ is the fluorescence quantum yield, I is the slope of curves, and η is the refractive index of solvent. The subscript “st” refers to the reference of known quantum yield (quinine sulfate in 0.1 M H2SO4). Absorption was kept below 0.1 at an excitation wavelength of 360 nm to minimize reabsorption.
Metal ion detection of CQDs and M-CQDs
For the detection of various metal ions, FeCl3, AgNO3, CuCl2, CaCl2, ZnCl2, CoCl2, Hg(NO3)2, MgCl2, AlCl3, MnCl2, PbCl2, FeCl2, and NiCl2 were used as various ion sources. All chemicals were used as received without further purification. CQDs or M-CQDs solution (50 μg/mL, 3 mL) was added to the solutions containing a calculated amount of ions. The PL spectra were recorded after reaction for 5 s. The excitation wavelength was fixed at 380 nm for all the PL spectra.
Fe3+ ion detection of CQDs and M-CQDs
At room temperature, 3 mL aqueous solution of CQDs or M-CQDs (50 μg/mL) was added with different concentrations of Fe3+ (0, 5, 10, 20, 40, 60, 80, 100, 120, and 140 μM) for 2 min. The fluorescence spectra were recorded at an excitation wavelength of 380 nm in 5 min.
Cytotoxicity assay of CQDs
Human cervical cancer cells (HeLa) were purchased from Cell Bank, Chinese Academy of Sciences (Shanghai, People’s Republic of China). HeLa cells (6×10³ cells per well) were seeded in 96-well plates and incubated at 37°C in a humidified 5% CO2 atmosphere. After 24 h, the cells were exposed to CQDs with different concentrations (0–1 mg/mL) and further incubated for 24 h. The cells were rinsed with PBS (pH 7.4) and treated with 20 μL MTT (5 mg/mL, in fresh medium), and then incubated for another 4 h. The formazan crystals formed were dissolved in dimethyl sulfoxide (DMSO). The optical absorbance of each solution at 570 nm was measured to calculate the cell viability values.
Bioimaging applications of CQDs
Cellular imaging was evaluated using a confocal laser scanning microscope. HeLa cells (5×10⁴ cells per well) were seeded in six-well culture plates and allowed to adhere for 24 h. The cells were then treated with CQDs (0.5 mg/mL) at 37°C for 1 h. After that, the supernatant was carefully removed and the cells were washed three times with PBS. Subsequently, the slides were mounted and observed using a confocal microscope (Zeiss laser scanning confocal microscope, LSM7 DUO; Carl Zeiss Meditec AG, Jena, Germany) using ZEN 2009 software (Carl Zeiss Meditec AG).
Results and discussion
Preparation of CQDs and M-CQDs
TPP and its metal complexes of Pd(II)TPP and Pt(II)TPP were synthesized according to the routine method. CQDs or M-CQDs were prepared by a facile one-pot hydrothermal method of the related porphyrins in the presence of concentrated nitric acid and EDA at 250°C for 20 h. When the temperature is lower than 200°C, it is hard to carbonize porphyrins to form CQDs. On the other hand, when the temperature is higher than 250°C, the carbonization degree is too high to form CQDs or M-CQDs in the nanoscale, resulting instead in powders on the microscale. The as-prepared CQDs and M-CQDs were well dispersed in water and presented strong blue fluorescence.
TEM characterization
As shown in Figure 2, the TEM images confirmed the formation of CQDs, and the as-synthesized colorless CQDs and M-CQDs have a relatively narrow size distribution ranging from 2 to 4 nm with the average diameter around 3 nm. The average size of CQDs was 2.7 nm (Figure 2A), which was slightly smaller than that of M-CQDs (Figure 2B and C). The HRTEM images (inset of Figure 2) indicate the high crystallinity of CQDs and M-CQDs with the lattice spacing around 0.21 nm, which agrees well with that the (100) facet of graphite.17
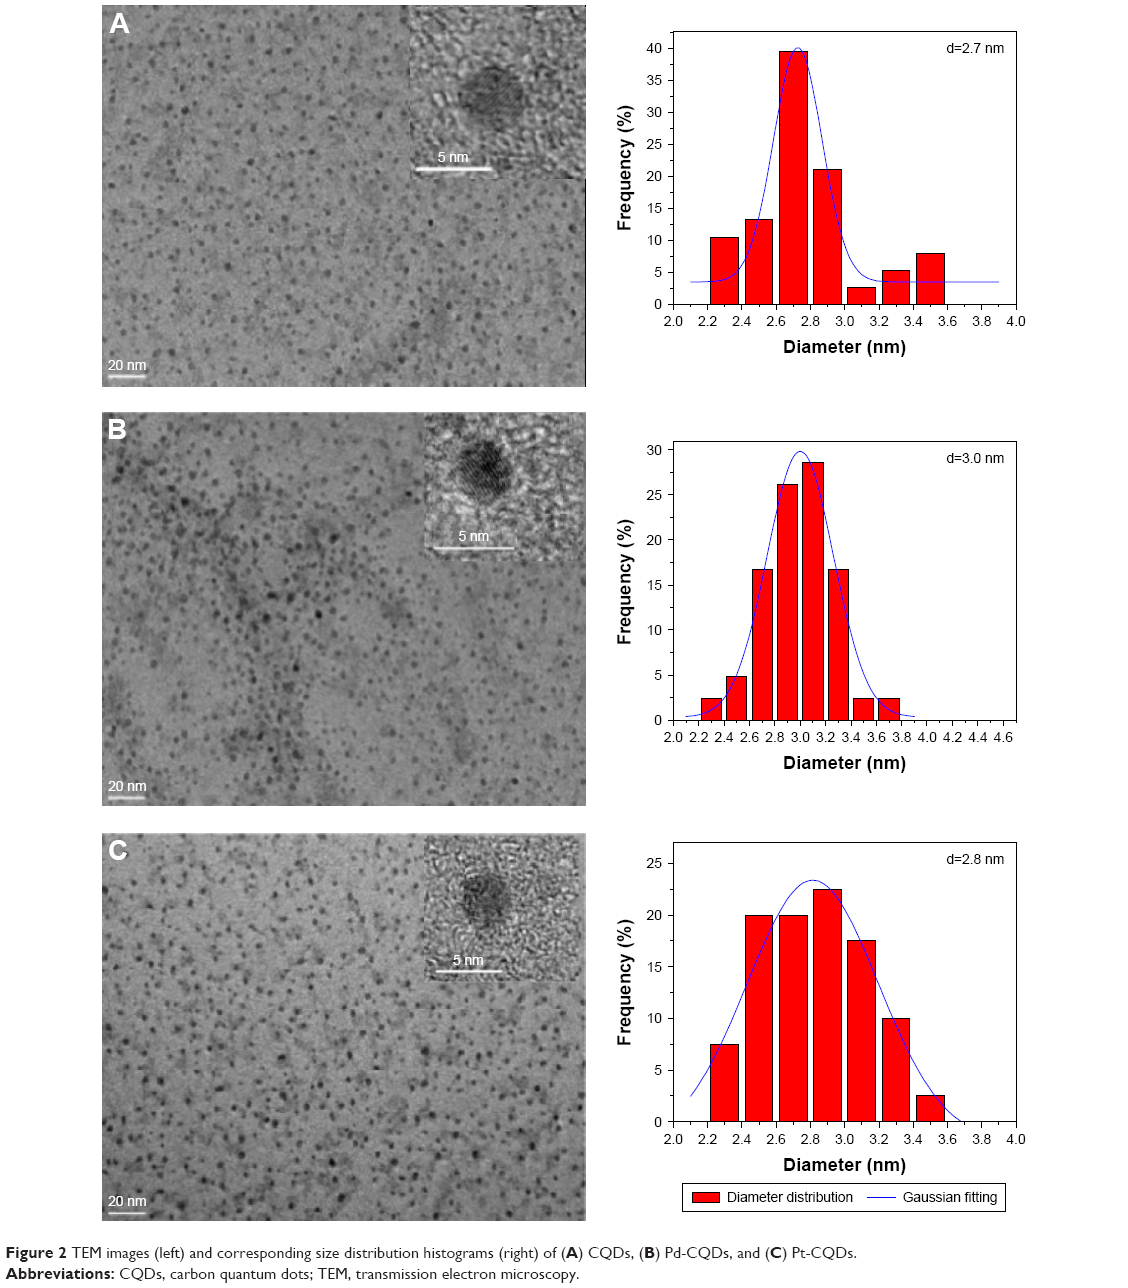 | Figure 2 TEM images (left) and corresponding size distribution histograms (right) of (A) CQDs, (B) Pd-CQDs, and (C) Pt-CQDs. |
XRD characterization
The XRD profiles in Figure 3A show that the CQDs and M-CQDs have single broad diffraction peaks centered around 21°, which is attributed to the (002) lattice spacing of carbon-based materials with amorphous nature.33
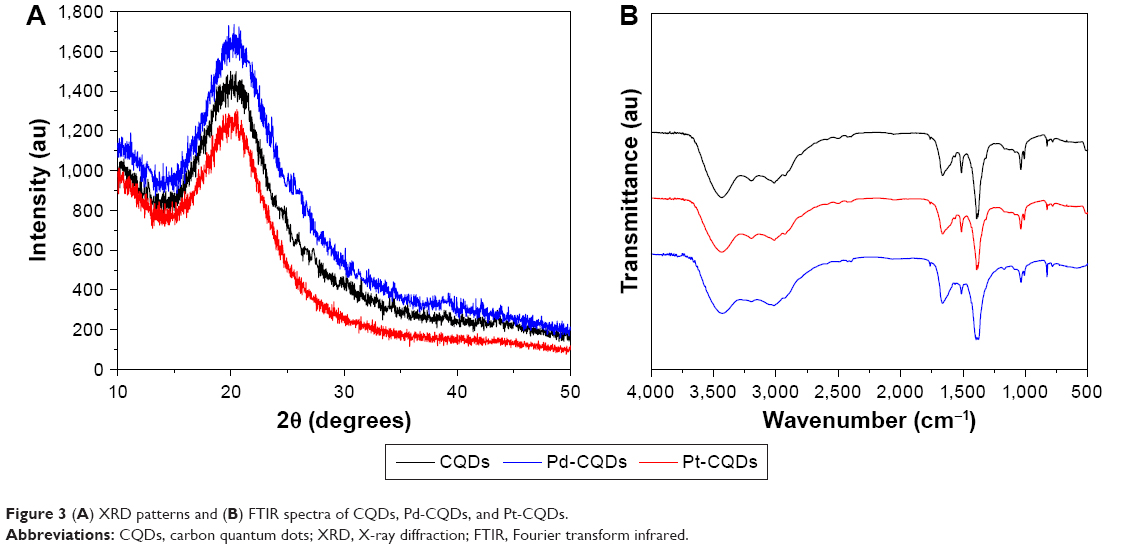 | Figure 3 (A) XRD patterns and (B) FTIR spectra of CQDs, Pd-CQDs, and Pt-CQDs. |
FTIR characterization
The functional groups of the CQDs and M-CQDs were characterized by FTIR spectroscopy. As shown in Figure 3B, the peaks around 3,429 cm−1 could be ascribed to the stretching vibrations of −OH, whereas the peaks around 1,658 cm−1 indicate the existence of carbonyl (C=O). The results confirm that the CQDs are functionalized with oxygen containing groups such as carboxyl, epoxyl, and hydroxyl.37 The absorption peak at 1,512 cm−1 can be attributed to the C=C stretching vibrations. The peak at 3,015 cm−1 comes from the stretching vibration of N−H in CQDs.38 The peak at 1,036 cm−1 originates from the C−O−C stretching vibration. The bimodal stretching vibration peak of −NH lies at 3,015 cm−1 and the characteristic absorption bands of the C−N stretching vibration lie at 1,381 cm−1, which indicate the presence of N element on the surface of CQDs and M-CQDs. All these functional groups contribute to the excellent aqueous solubility of CQDs.
XPS characterization
The composition of the CQDs and M-CQDs was characterized by XPS. The survey XPS spectrum of CQDs in Figure 4A clearly shows three peaks at 284.58, 400.75, and 531.34 eV, for C 1s, N 1s, and O 1s, respectively.18 A high-resolution XPS spectrum of C 1s (Figure 4B) provides proof for the presence of C−C/C=C (sp3, 284.5 eV), C−N/C−O (sp3, 285.8 eV), and C=O−N (sp2, 288.2 eV) bonds. The N 1s spectrum of CQDs (Figure 4C) shows two peaks at 399.5 and 403.8 eV which can be attributed to the C−N−C and N−C bond of amide linkage, respectively. The two fitted peaks at 531.9 and 533.4 eV in O 1s spectrum (Figure S1) can be assigned to C=O and C−OH/C−O−C groups, respectively. The XPS analysis clearly indicates the presence of oxygen-containing groups in the as-prepared CQDs, such as −COOH, −OH, −C-N, and so on, which is in good agreement with the FTIR spectrum. Moreover, the XPS survey spectra of Pd-CQDs (Figure 4D) indicates the presence of C, N, O and Pd elements, which is further validated by their high-resolution XPS spectrum (Figure 4E and F). The high-resolution spectrum of Pd 3d (Figure 4F) is split into two peaks centered at 337.6 eV (Pd 3d5/2) and 342.9 eV (Pd 3d3/2), respectively. Pt-CQDs shows the similar XPS spectra (Figure 4G–I) with that of Pd-CQDs. The spectrum of Pt 4f (Figure 4I) also shows two peaks at 72.8 eV (Pt 4f7/2) and 77.1 eV (Pt 4f5/2), indicating the divalent state of metal in M-CQDs.39,40 The Pd and Pt metal content in the corresponding M-CQDs is measured to be 3.5% and 2.6%, respectively. The XPS spectrum clearly demonstrated that the metals (Pd or Pt) have been successfully embedded into the CQDs through the hydrothermal treatment of related metal complex of TPP.
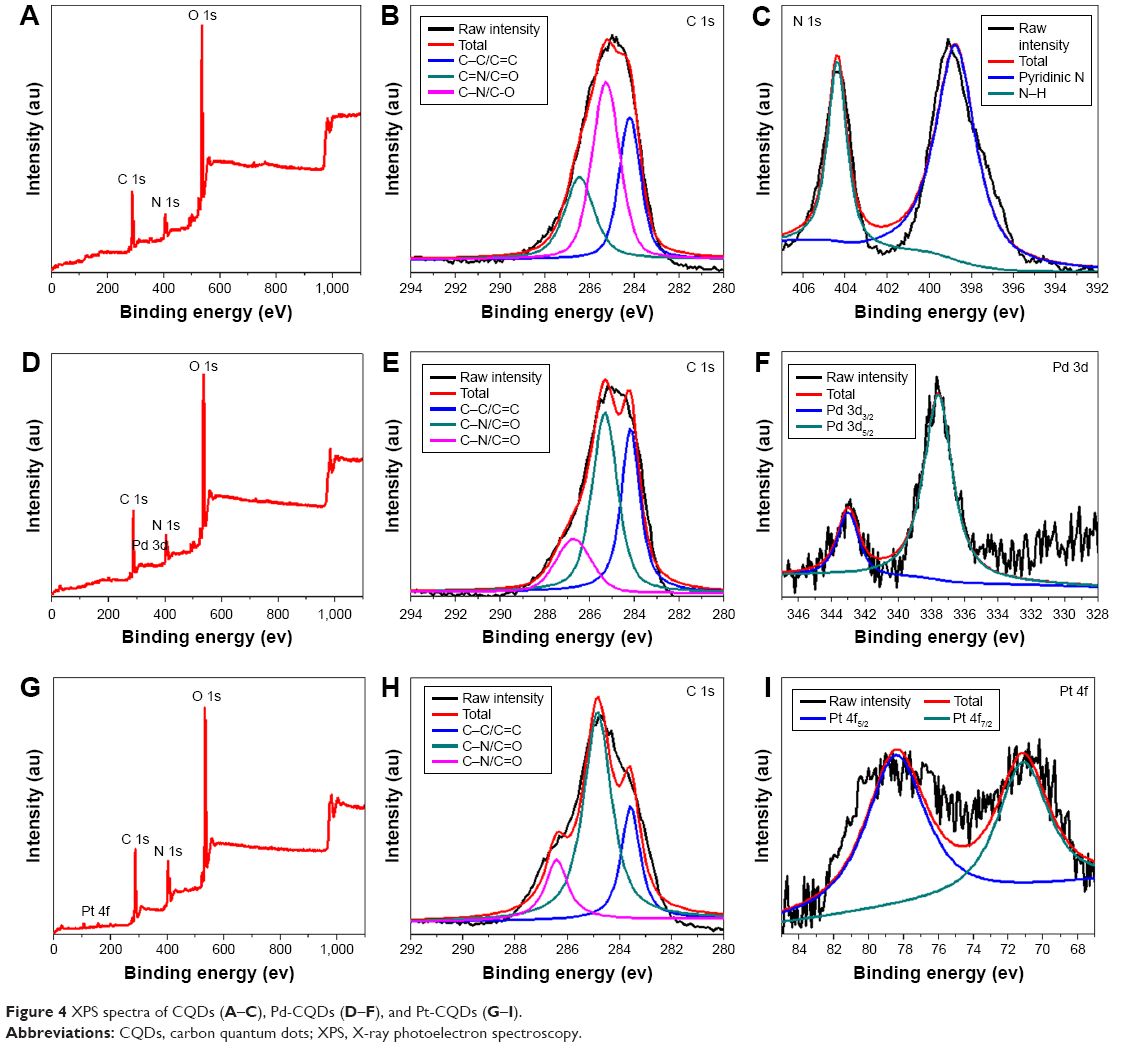 | Figure 4 XPS spectra of CQDs (A–C), Pd-CQDs (D–F), and Pt-CQDs (G–I). |
NMR characterization
Moreover, nuclear magnetic resonance (NMR) spectroscopy (1H and 13C) of CQDs was employed to distinguish sp3-hybridized carbon atoms from sp2-hybridized carbon atoms. As shown in Figure 5, sp2 carbons were detected in the 1H NMR spectrum. In the 13C NMR spectrum, signals in the range of 10–45 ppm, which correspond to aliphatic (sp3) carbon atoms, and signals from 160–180 ppm, which are indicative of aromatic (sp2) carbon atoms, were observed.6
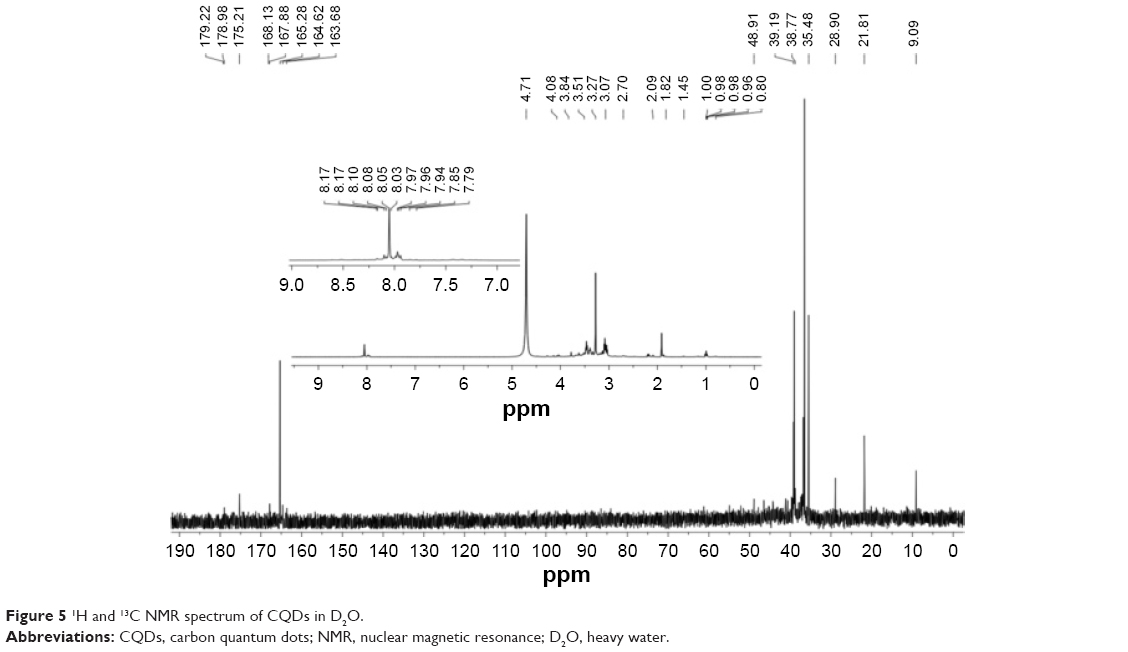 | Figure 5 1H and 13C NMR spectrum of CQDs in D2O. |
Photophysical properties
Similar to other CQDs reported in literature,41–43 the as-prepared CQDs and M-CQDs in aqueous solution exhibited strong luminescence. Figures 6A, S2, and S3 show the UV-vis absorption, PL spectra, and excitation spectrum of the CQDs and M-CQDs in aqueous solution, respectively. The UV-vis absorption spectrum of the CQDs exhibits a strong absorption below 300 nm with maximum peak at ~220 nm, which is mainly attributed to the π−π* transitions of aromatic sp2 domains. Moreover, a weak absorption tail between 300 and 400 nm was also observed, attributable to the n−π* transitions of heteroatom (N and O)-containing bonds.
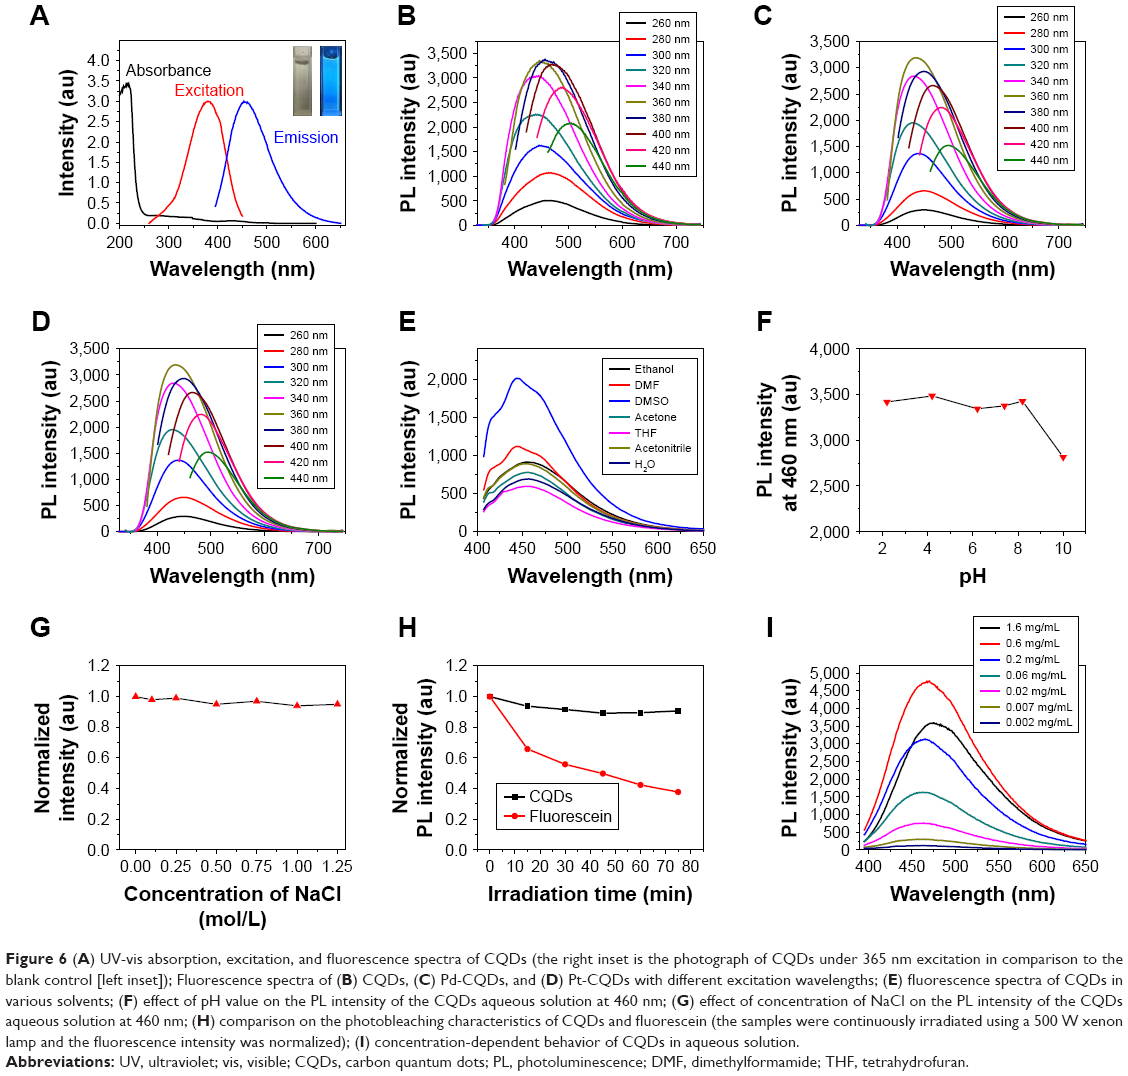 | Figure 6 (A) UV-vis absorption, excitation, and fluorescence spectra of CQDs (the right inset is the photograph of CQDs under 365 nm excitation in comparison to the blank control [left inset]); Fluorescence spectra of (B) CQDs, (C) Pd-CQDs, and (D) Pt-CQDs with different excitation wavelengths; (E) fluorescence spectra of CQDs in various solvents; (F) effect of pH value on the PL intensity of the CQDs aqueous solution at 460 nm; (G) effect of concentration of NaCl on the PL intensity of the CQDs aqueous solution at 460 nm; (H) comparison on the photobleaching characteristics of CQDs and fluorescein (the samples were continuously irradiated using a 500 W xenon lamp and the fluorescence intensity was normalized); (I) concentration-dependent behavior of CQDs in aqueous solution. |
The PL with a peak around 460 nm was observed for the aqueous dispersion of CQDs under excitation at 360 nm, which corresponded to the visible blue colour under UV illumination (365 nm) as shown in the digital picture (inset, Figure 6A). Additionally, the maximum PL wavelengths of CQDs, Pd-CQDs, and Pt-CQDs are considerably dependent on the excitation wavelengths, as shown in Figure 6B–D. As the excitation wavelength gradually increases from 260 to 440 nm, the maximum PL wavelength of CQDs shifts from 432 to 514 nm. This property should be of great interest for multicolour imaging applications at cellular environment.19,44 Using quinine sulfate (quantum yield =54%) as the reference, the quantum yield of CQDs, Pd-CQDs, and Pt-CQDs were calculated to be 10.1%, 17.8%, and 15.2%, respectively (Figure S4).
To further investigate the molecular state of CQDs and M-CQDs, the solvent-dependent behavior was tested in tetrahydrofuran, acetone, alcohol, dimethylformamide, and so on. As shown in Figures 6E and S5, the CQDs and M-CQDs (0.01 mg/mL) in DMSO have the largest fluorescence intensity, followed sequentially by dimethylformamide, C2H5OH (CH3CN), CH3COCH3, H2O, and tetrahydrofuran. Next, the fluorescent stability of CQDs and M-CQDs in aqueous solution was investigated. As revealed in Figures 6F and S6, the PL intensity of CQD and M-CQD solutions at 460 nm did not show any significant change as the pH value changed from 2.2 to 8.2, and it decreased sharply in strong base aqueous solutions with the pH value ranging from 8.2 to 10. This feature of CQDs is beneficial for their bioimaging applications, considering that a physiological environment has in general a pH value of 7–8. The stability of CQDs is of great importance for the practical applications. As shown in Figures 6G and S7, the fluorescence intensity of CQDs and M-CQDs in a set of NaCl solutions with different concentrations was measured. Even in a solution with salt concentration higher than 1.25 M, the fluorescence intensity of CQDs and M-CQDs was still comparable with that in DI water, indicative of the superior colloidal stability.45 The negligible fluorescence fluctuation over a broad range of salt concentrations demonstrates that the CQDs and M-CQDs are suitable for biological imaging applications. Furthermore, the CQDs and M-CQDs show excellent photostability, as shown in Figures 6H and S8. The PL intensity of CQDs and M-CQDs did not change significantly even after a continuous irradiation under a 500 W xenon lamp for durations up to 75 min. In contrast, under the same irradiation condition, the PL intensity of the commercial organic dye (fluorescein) decreased to only 37% of its original value, suggesting superior photostability of CQDs compared to that of fluorescein.
Self-absorption quenching is often observed in fluorescent materials, including carbon-based materials. The concentration-dependent PL behavior was measured to investigate collisional quenching in the CQDs and M-CQDs. From the concentration-dependent PL spectrum shown in Figures 6I and S9, the PL intensity decreased at too high or too low concentration, and the optimal concentration was about 0.6 mg mL−1. When the concentration was high enough, collisional quenching occurred and the PL intensity decreased. In addition, high optical density or turbidity can also result in decreased PL intensity. The concentration of CQDs and M-CQDs used should be carefully determined for investigating the PL mechanism and practical applications.
The ion sensing of CQDs
Typically, the oxygen functional groups on the surfaces of CQDs contribute not only to water solubility, but also to their strong interaction with metal ions. Accordingly, the impact of different metal ions (all at 50 μM) including Ca2+, Fe3+, Hg2+, Na+, Mg2+, Mn2+, K+, Fe2+, Co2+, Ni2+, Al3+, Cu2+, Pb2+, and Zn2+ on the PL intensity of CQDs and M-CQDs was studied (Figure 7A). As shown in Figures 7B and S10, the fluorescence intensities of CQDs were significantly decreased in the presence of Fe3+, while the other ions displayed weak or even negligible effects on their fluorescence intensities. These observations indicate that the fluorescence of CQDs and M-CQDs show selective response to Fe3+ and therefore could be used for the assay of Fe3+.
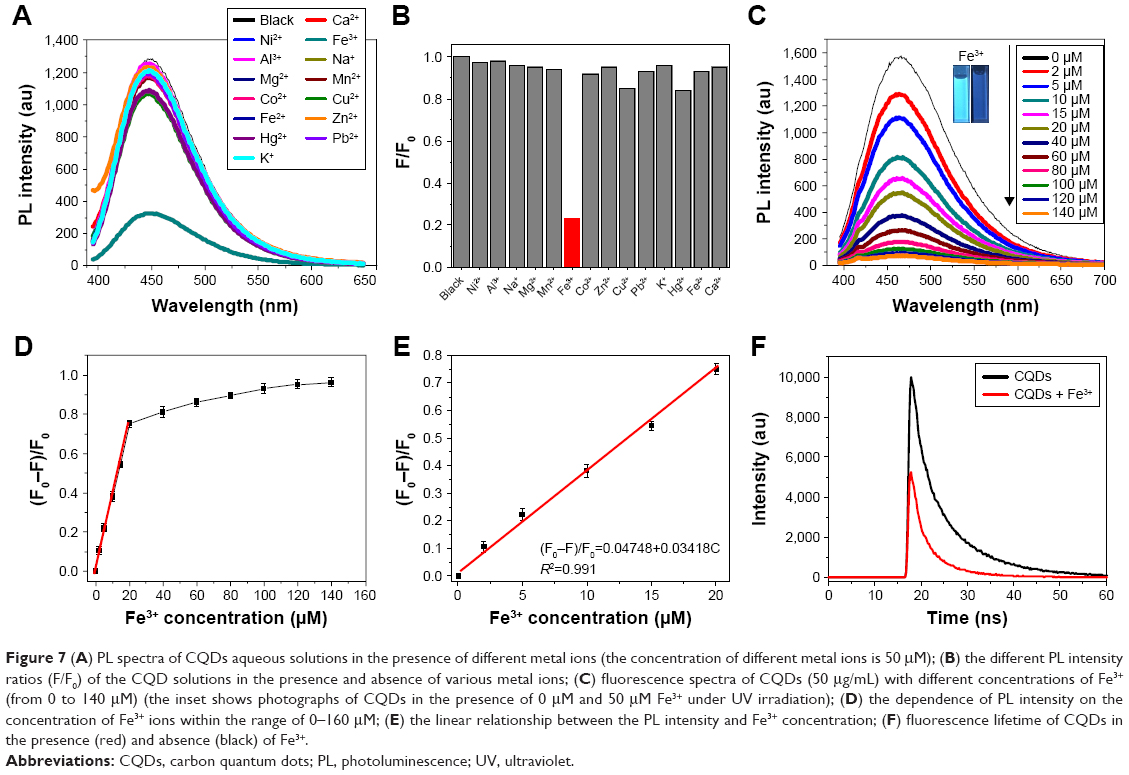 | Figure 7 (A) PL spectra of CQDs aqueous solutions in the presence of different metal ions (the concentration of different metal ions is 50 μM); (B) the different PL intensity ratios (F/F0) of the CQD solutions in the presence and absence of various metal ions; (C) fluorescence spectra of CQDs (50 μg/mL) with different concentrations of Fe3+ (from 0 to 140 μM) (the inset shows photographs of CQDs in the presence of 0 μM and 50 μM Fe3+ under UV irradiation); (D) the dependence of PL intensity on the concentration of Fe3+ ions within the range of 0–160 μM; (E) the linear relationship between the PL intensity and Fe3+ concentration; (F) fluorescence lifetime of CQDs in the presence (red) and absence (black) of Fe3+. |
As shown in Figure 7C, when Fe3+ with concentration ranging from 0 to 140 μM was added to the as-prepared CQDs aqueous solution sequentially, the fluorescence intensity of CQDs at 460 nm gradually decreased. Accordingly, the color of CQDs changed from bright blue-green to faint blue-green under UV irradiation (the inset of Figure 7C). Figure 7D presents the relationship between the concentration of Fe3+ and the fluorescent quenching factors (F0–F)/F0 in the range of 0 to 150 mM, where F0 and F indicate the fluorescence intensities of CQDs at 460 nm in the absence and presence of Fe3+. The inset of Figure 7E shows that the (F0–F)/F0 has a good linear relationship with the concentration of Fe3+ in the range of 0–20 μM, and the linear regression equation is (F0–F)/F0 =0.04748+0.03418C with a correlation coefficient of 0.991, where C is the concentration of Fe3+ (μM). The limit of detection for Fe3+ was figured out to be 3.7 μM (=3S/N, where S is the standard deviation and N is the slope of the linear response region at low concentrations less than 20 μm), which is comparable to the sensitivity reported in some previous reports.46,47 The high sensitivity together with the high selectivity for Fe3+ makes the CQDs a promising fluorescent sensing platform for the highly efficient detection of Fe3+.
In addition, the selectivity toward Fe3+ was also ascertained by the competition experiment. As shown in Figure S11, 50 μg/mL of CQD solution was treated with 30 μM Fe3+ in the presence of 100 μM concentration of other metal ions. Low interference was observed for the detection of Fe3+ in the presence of other ions. Thus, CQDs can be used as a selective fluorescent sensor toward Fe3+ in the presence of most competing ions. The high selectivity could be ascribed to the strong coordination between Fe3+ and the phenolic hydroxyl groups on the surface of CQDs.48 The electrons in the excited state of CQDs are then transferred to the half-filled 3d orbitals of Fe3+, facilitating the nonradiative electron/hole recombination and resulting in significant fluorescence quenching. To prove our speculation, time-correlated single photon counting method was used to analyze the charge transfer in the exciton recombination process of CQDs with and without Fe3+. As shown in Figure 7F, the average lifetime of CQDs was decreased from 9.17 to 5.34 ns with the addition of 50 μM Fe3+ to the CQDs solution. The significantly reduced lifetime indicates the occurrence of dynamic quenching and confirms that the electron transfer between Fe3+ and CQDs contributes to the fluorescence quenching.43,49
MTT test
In order to evaluate the compatibility between cells and CQDs, a cytotoxicity study was carried out with a standard MTT assay using HeLa cells. We chose the reaction time of 24 h to observe cell viability as a function of CQD concentrations (0, 0.031, 0.062, 0.125, 0.25, 0.5, and 1 mg/mL). As shown in Figure 8, the CQDs exhibit very low cytotoxicity, ie, viability of over 90% at a concentration of 0.25 mg/mL after 24 h incubation. The viability of cells was over 85% even when the concentration of CQDs was elevated to 1 mg/mL. The results demonstrate that the CQDs have good biocompatibility and low toxicity toward HeLa cells.48 The low cytotoxicity confirms the suitability of the fluorescent CQDs for bioimaging applications.
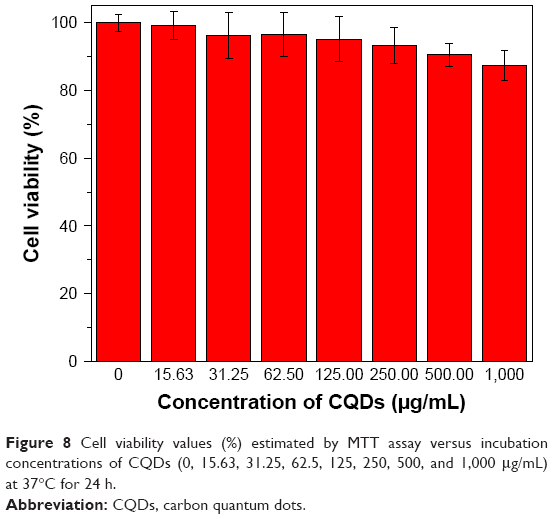 | Figure 8 Cell viability values (%) estimated by MTT assay versus incubation concentrations of CQDs (0, 15.63, 31.25, 62.5, 125, 250, 500, and 1,000 μg/mL) at 37°C for 24 h. |
Bioimaging applications
Considering the facile procedure and intriguingly strong PL of the CQDs, it becomes worthwhile to investigate whether CQDs can be utilized as imaging probes for living cell imaging. As shown in Figure 9, the HeLa cells treated with 0.2 mg/mL of CQDs exhibit blue (Figure 9B), green (Figure 9C), and red (Figure 9D) colors under 405 nm, 458 nm, and 514 nm excitation, respectively, which is consistent with the excitation-dependent PL behavior of the CQDs. Moreover, the CQDs were observed to be distributed mainly over the cell cytoplasm, and the nucleus displayed very weak emission signals. This result coincides with previous reports that CQDs were able to stain both the cytoplasm and cell membrane but it was difficult to label the nucleus.5 Thus, the CQDs were suggested to be internalized into the cells through endocytosis, similar to other CQDs reported previously.19 Besides, it was found that the fluorescence intensity of CQDs in cancer cells considerably decreased after treatment with Fe3+ metal ions, indicating that Fe3+ ions effectively quench fluorescence intensity of CQDs in cancer cells. This result demonstrates that the synthesized CQDs have good biocompatibility and are suitable for the detection of metal ions in living cells.
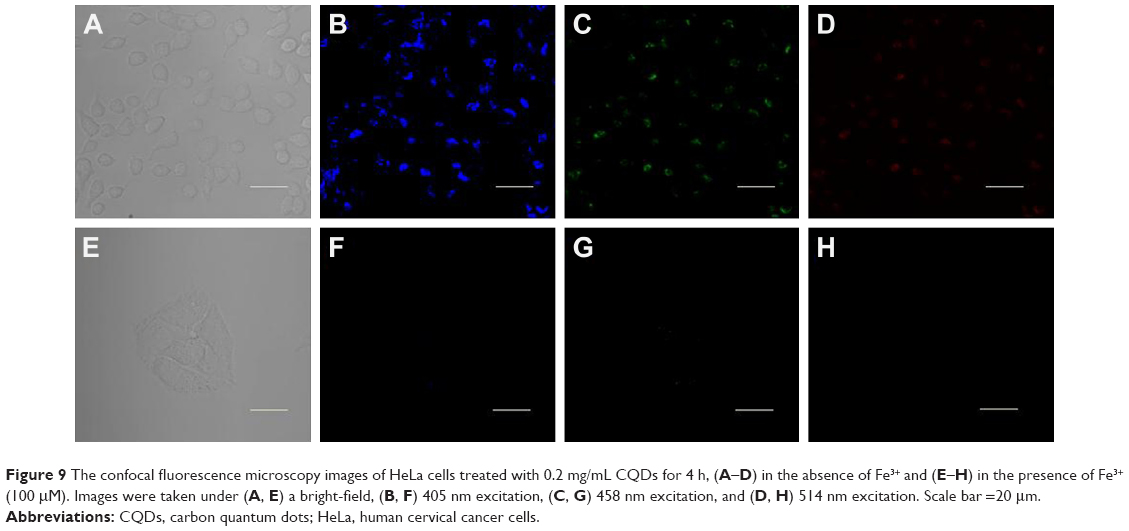 | Figure 9 The confocal fluorescence microscopy images of HeLa cells treated with 0.2 mg/mL CQDs for 4 h, (A–D) in the absence of Fe3+ and (E–H) in the presence of Fe3+ (100 μM). Images were taken under (A, E) a bright-field, (B, F) 405 nm excitation, (C, G) 458 nm excitation, and (D, H) 514 nm excitation. Scale bar =20 μm. |
Conclusion
In summary, a facile method has been developed to prepare bright luminescent N-rich metal-free and metal-doped CQDs by hydrothermal reactions using TPP and its metal complexes as the precursors. Their aqueous solutions emit bright blue light under UV irradiation, and the PL wavelength was red-shifted under excitation with longer wavelengths. Moreover, the CQDs and M-CQDs could serve as fluorescent probes for the highly sensitive and selective detection of Fe3+ ions in aqueous solution. The low cytotoxicity of CQDs is demonstrated by MTT assay against HeLa cells. Therefore, the CQDs can be used as efficient probes for cellular multicolor imaging and fluorescence sensors for the detection of Fe3+ ions due to their low toxicity, excellent biocompatibility, and low detection limits. This work provides a new route to synthesize highly luminescent N-rich metal-free or metal-doped CQDs for multifunctional applications.
Acknowledgments
We are thankful for the support from National Natural Science Foundation of China (21601142), Natural Science Foundation of Hubei Province (2017CFB689), and the Wuhan Science and Technology Talent Training Program of Chenguang Project (2015070404010190). Xunji Zhu thanks Hong Kong Research Grants Council (HKBU 22304115-ECS) and the financial support from Hong Kong Baptist University (FRG2/14-15/034). We also thank Dr FL Jiang and Prof Y Liu at Wuhan University for their assistance in TEM measurements.
Disclosure
The authors report no conflicts of interest in this work.
References
Qian Z, Shan X, Chai L, et al. Si-doped carbon quantum dots: a facile and general preparation strategy, bioimaging application, and multifunctional sensor. ACS Appl Mater Inter. 2014;6(9):6797–6805. | ||
Baker SN, Baker GA. Luminescent carbon nanodots: emergent nanolights. Angew Chem Int Ed. 2010;49(38):6726–6744. | ||
Zhu S, Tang S, Zhang J, Yang B. Control the size and surface chemistry of graphene for the rising fluorescent materials. Chem Commun. 2012; 48(38):4527–4539. | ||
Zheng XT, Ananthanarayanan A, Luo KQ, Chen P. Glowing graphene quantum dots and carbon dots: properties, syntheses, and biological applications. Small. 2015;11(14):1620–1636. | ||
Zhao S, Lan M, Zhu X, et al. Green synthesis of bifunctional fluorescent carbon dots from garlic for cellular imaging and free radical scavenging. ACS Appl Mater Inter. 2015;7(31):17054–17060. | ||
Zhu S, Meng Q, Wang L, et al. Highly photoluminescent carbon dots for multicolor patterning, sensors, and bioimaging. Angew Chem Int Ed. 2013;52(14):3953–3957. | ||
Hsu PC, Chen PC, Ou CM, et al. Extremely high inhibition activity of photoluminescent carbon nanodots toward cancer cells. J Mater Chem B. 2013;1(13):1774–1781. | ||
Yang X, Zhuo Y, Zhu S, et al. Novel and green synthesis of high-fluorescent carbon dots originated from honey for sensing and imaging. Biosens Bioelectron. 2014;60:292–298. | ||
Ko HY, Chang YW, Paramasivam G, et al. In vivo imaging of tumour bearing near-infrared fluorescence-emitting carbon nanodots derived from tire soot. Chem Commun. 2013;49(87):10290–10292. | ||
Lim SY, Shen W, Gao Z. Carbon quantum dots and their applications. Chem Soc Rev. 2015;44(1):362–381. | ||
Zhang J, Yu SH. Carbon dots: large-scale synthesis, sensing and bioimaging. Mater Today. 2016;19(7):382–393. | ||
Hola K, Zhang Y, Wang Y, et al. Carbon dots-emerging light emitters for bioimaging, cancer therapy and optoelectronics. Nano Today. 2014;9(5):590–603. | ||
Dong Y, Pang H, Yang HB, et al. Carbon-based dots co-doped with nitrogen and sulfur for high quantum yield and excitation-independent emission. Angew Chem Int Ed. 2013;52(30):7800–7804. | ||
Park Y, Yoo J, Lim B, et al. Improving the functionality of carbon nanodots: doping and surface functionalization. J Mater Chem A. 2016;4(30):11582–11603. | ||
Guo R, Zhou S, Li Y, et al. Rhodamine-functionalized graphene quantum dots for detection of fe3+ in cancer stem cells. ACS Appl Mater Inter. 2015;7(43):23958–23966. | ||
Dong Y, Wang R, Li G, et al. Polyamine-functionalized carbon quantum dots as fluorescent probes for selective and sensitive detection of copper ions. Anal Chem. 2012;84(14):6220–6224. | ||
Sun YP, Zhou B, Lin Y, et al. Quantum-sized carbon dots for bright and colorful photoluminescence. J Am Chem Soc. 2006;128(24):7756–7757. | ||
Dong Y, Wang R, Li H, et al. Polyamine-functionalized carbon quantum dots for chemical sensing. Carbon. 2012;50(8):2810–2815. | ||
Yang Z, Xu M, Liu Y, et al. Nitrogen-doped, carbon-rich, highly photoluminescent carbon dots from ammonium citrate. Nanoscale. 2014;6(3):1890–1895. | ||
Shi Y, Pan Y, Zhong J, et al. Facile synthesis of gadolinium (III) chelates functionalized carbon quantum dots for fluorescence and magnetic resonance dual-modal bioimaging. Carbon. 2015;93:742–750. | ||
Zhang Z, Shi Y, Pan Y, et al. Quinoline derivative-functionalized carbon dots as a fluorescent nanosensor for sensing and intracellular imaging of Zn2+. J Mater Chem B. 2014;2(31):5020–5027. | ||
Wang X, Wang D, Guo Y, et al. Imidazole derivative-functionalized carbon dots: using as a fluorescent probe for detecting water and imaging of live cells. Dalton Trans. 2015;44(12):5547–5554. | ||
Jiang G, Jiang T, Zhou H, et al. Preparation of N-doped carbon quantum dots for highly sensitive detection of dopamine by an electrochemical method. RSC Adv. 2015;5(12):9064–9068. | ||
Qian Z, Ma J, Shan X, et al. Highly luminescent N-doped carbon quantum dots as an effective multifunctional fluorescence sensing platform. Chem Eur J. 2014;20(8):2254–2263. | ||
Shan X, Chai L, Ma J, et al. B-doped carbon quantum dots as a sensitive fluorescence probe for hydrogen peroxide and glucose detection. Analyst. 2014;139(10):2322–2325. | ||
Li S, Li Y, Cao J, et al. Sulfur-doped graphene quantum dots as a novel fluorescent probe for highly selective and sensitive detection of Fe3+. Anal Chem. 2014;86(20):10201–10207. | ||
Chandra S, Laha D, Pramanik A, et al. Synthesis of highly fluorescent nitrogen and phosphorus doped carbon dots for the detection of Fe3+ ions in cancer cells. Luminescence. 2016;31(1):81–87. | ||
Zhang J, Yang L, Yuan Y, et al. One-pot gram-scale synthesis of nitrogen and sulfur embedded organic dots with distinctive fluorescence behaviors in free and aggregated states. Chem Mater. 2016;28(12):4367–4374. | ||
Zhou J, Shan X, Ma J, et al. Facile synthesis of P-doped carbon quantum dots with highly efficient photoluminescence. RSC Adv. 2014;4(11):5465–5468. | ||
Liao H, Wang Z, Chen S, et al. One-pot synthesis of gadolinium(III) doped carbon dots for fluorescence/magnetic resonance bimodal imaging. RSC Adv. 2015;5(82):66575–66581. | ||
Xu Y, Jia XH, Yin XB, et al. Carbon quantum dot stabilized gadolinium nanoprobe prepared via a one-pot hydrothermal approach for magnetic resonance and fluorescence dual-modality bioimaging. Anal Chem. 2014;86(24):12122–12129. | ||
Wu F, Su H, Zhu X, et al. Near-infrared emissive lanthanide hybridized carbon quantum dots for bioimaging applications. J Mater Chem B. 2016;4(38):6366–6372. | ||
Bourlinos AB, Bakandritsos A, Kouloumpis A, et al. Gd(III)-doped carbon dots as a dual fluorescent-MRI probe. J Mater Chem. 2012;22(44): 23327–23330. | ||
Wu W, Zhan L, Fan W, et al. Cu–N Dopants boost electron transfer and photooxidation reactions of carbon dots. Angew Chem Int Ed. 2015;54(22):6540–6544. | ||
Liu R, Huang H, Li H, et al. Metal nanoparticle/carbon quantum dot composite as a photocatalyst for high-efficiency cyclohexane oxidation. ACS Catal. 2014;4(1):328–336. | ||
Biswas A, Paul S, Banerjee A. Carbon nanodots, Ru nanodots and hybrid nanodots: preparation and catalytic properties. J Mater Chem A. 2015;3(29):15074–15081. | ||
Dhenadhayalan N, Lin KC. Chemically induced fluorescence switching of carbon-dots and its multiple logic gate implementation. Sci Rep. 2015;5:10012. | ||
Moon BJ, Oh Y, Shin DH, et al. Facile and purification-free synthesis of nitrogenated amphiphilic graphitic carbon dots. Chem Mater. 2016;28(5):1481–1488. | ||
Qian H, He Q, Zheng J, et al. Catechol-functionalized microporous organic polymer as supported media for Pd nanoparticles and its high catalytic activity. Polymer. 2014;55(2):550–555. | ||
Matin MA, Lee E, Kim H, et al. Rational syntheses of core–shell Fe@(PtRu) nanoparticle electrocatalysts for the methanol oxidation reaction with complete suppression of CO-poisoning and highly enhanced activity. J Mater Chem A. 2015;3(33):17154–17164. | ||
Liu Y, Zhao Y, Zhang Y. One-step green synthesized fluorescent carbon nanodots from bamboo leaves for copper(II) ion detection. Sensor Actuat B Chem. 2014;196:647–652. | ||
Parvin N, Mandal TK. Synthesis of a highly fluorescence nitrogen-doped carbon quantum dots bioimaging probe and its in vivo clearance and printing applications. RSC Adv. 2016;6(22):18134–18140. | ||
Yu J, Xu C, Tian Z, et al. Facilely synthesized N-doped carbon quantum dots with high fluorescent yield for sensing Fe3+. New J Chem. 2016;40(3):2083–2088. | ||
Li F, Liu C, Yang J, et al. Mg/N double doping strategy to fabricate extremely high luminescent carbon dots for bioimaging. RSC Adv. 2014;4(7):3201–3205. | ||
Guo Y, Zhang L, Cao F, Leng Y. Thermal treatment of hair for the synthesis of sustainable carbon quantum dots and the applications for sensing Hg2+. Sci Rep. 2016;6:35795. | ||
Ananthanarayanan A, Wang X, Routh P, et al. Facile synthesis of graphene quantum dots from 3d graphene and their application for Fe3+ sensing. Adv Funct Mater. 2014;24(20):3021–3026. | ||
Yang Q, Wei L, Zheng X, Xiao L. Single particle dynamic imaging and Fe3+ sensing with bright carbon dots derived from bovine serum albumin proteins. Sci Rep. 2015;5:17727. | ||
Liu M, Xu Y, Niu F, et al. Carbon quantum dots directly generated from electrochemical oxidation of graphite electrodes in alkaline alcohols and the applications for specific ferric ion detection and cell imaging. Analyst. 2016;141(9):2657–2664. | ||
Zhang YL, Wang L, Zhang HC, et al. Graphitic carbon quantum dots as a fluorescent sensing platform for highly efficient detection of Fe3+ ions. RSC Adv. 2013;3(11):3733–3738. |
Supplementary materials
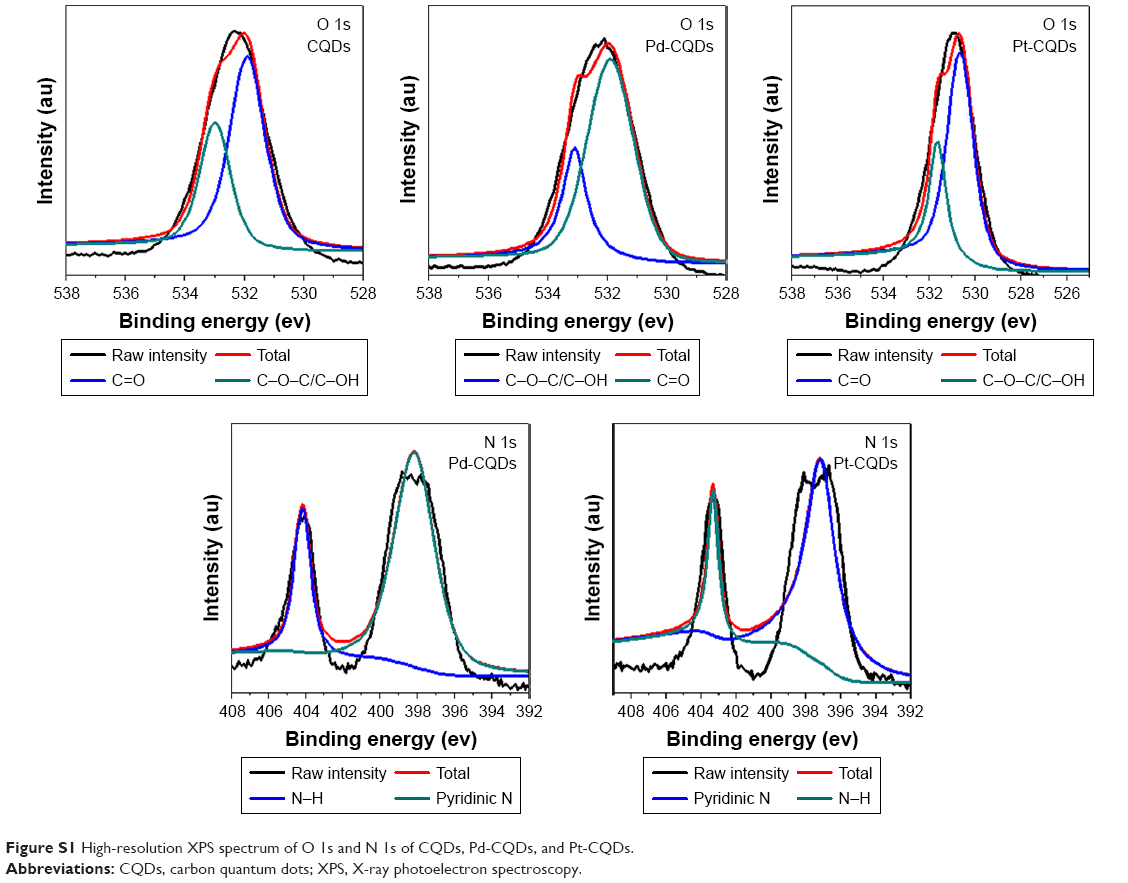 | Figure S1 High-resolution XPS spectrum of O 1s and N 1s of CQDs, Pd-CQDs, and Pt-CQDs. |
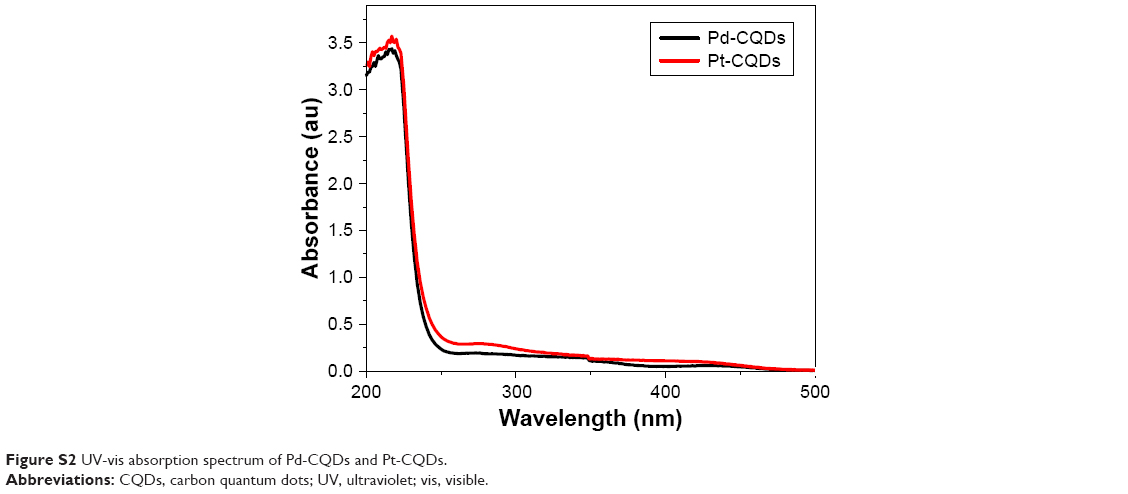 | Figure S2 UV-vis absorption spectrum of Pd-CQDs and Pt-CQDs. |
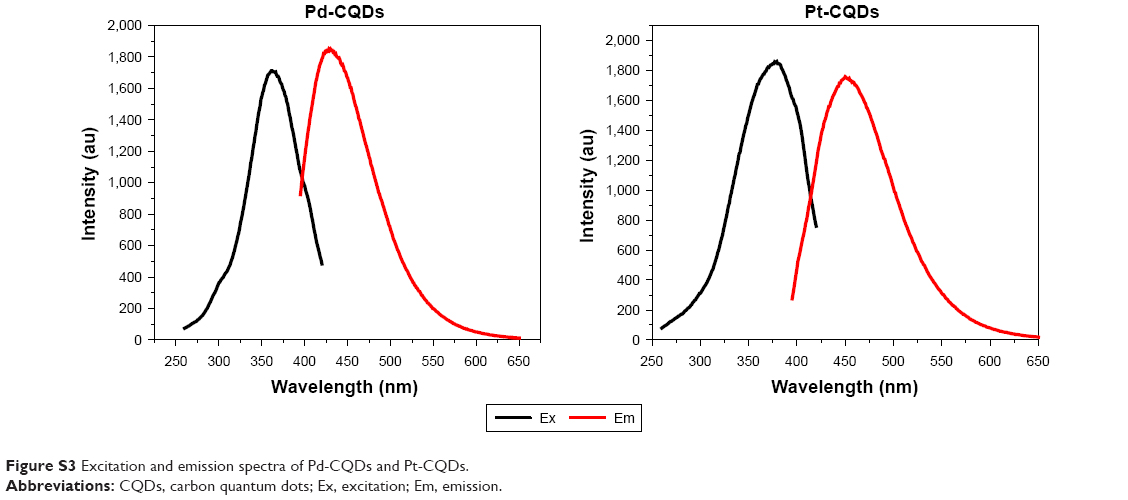 | Figure S3 Excitation and emission spectra of Pd-CQDs and Pt-CQDs. |
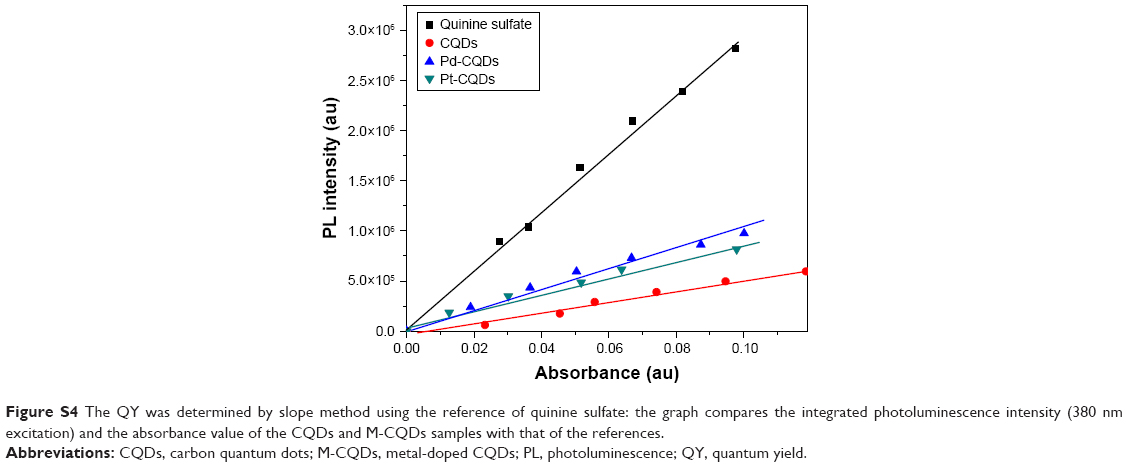 | Figure S4 The QY was determined by slope method using the reference of quinine sulfate: the graph compares the integrated photoluminescence intensity (380 nm excitation) and the absorbance value of the CQDs and M-CQDs samples with that of the references. |
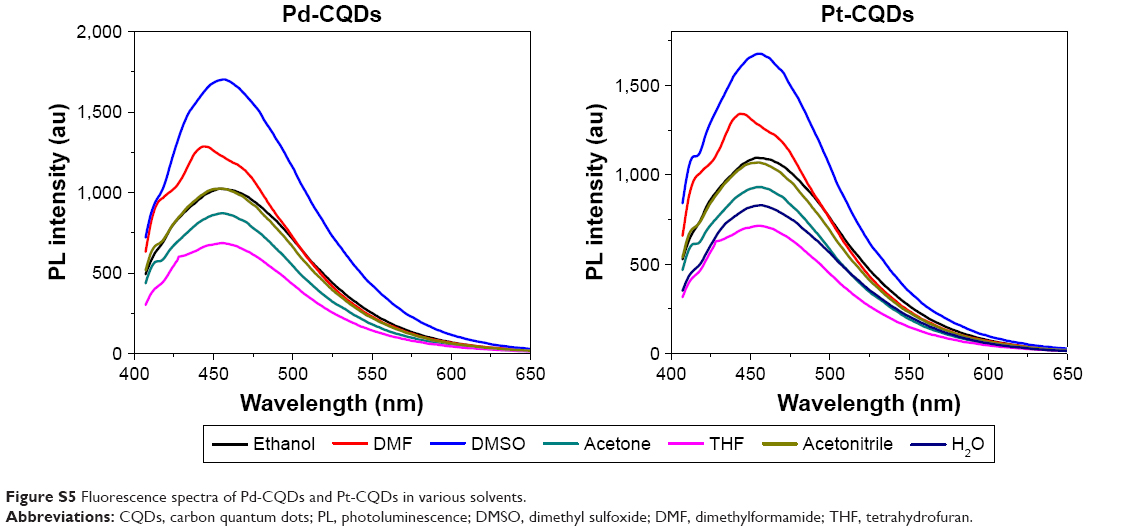 | Figure S5 Fluorescence spectra of Pd-CQDs and Pt-CQDs in various solvents. |
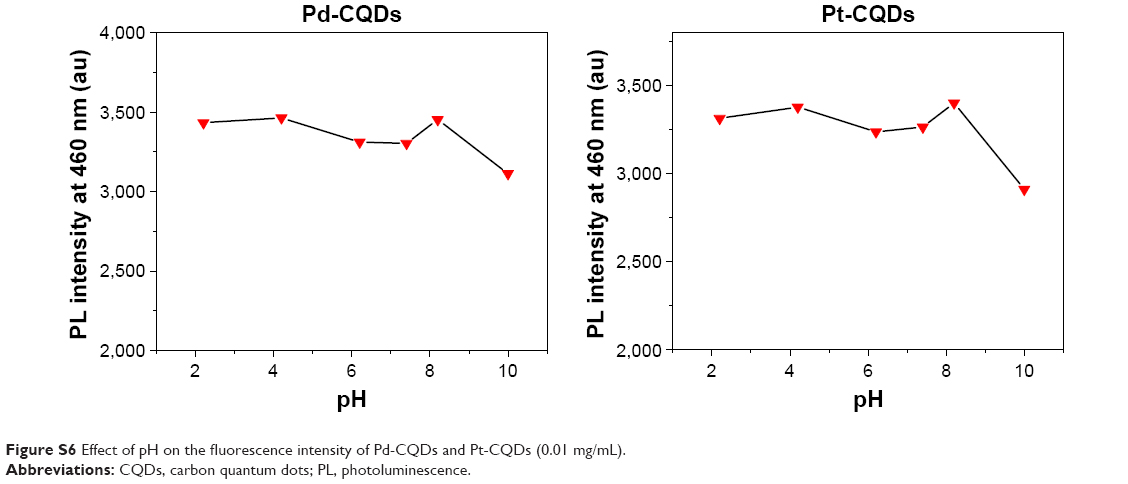 | Figure S6 Effect of pH on the fluorescence intensity of Pd-CQDs and Pt-CQDs (0.01 mg/mL). |
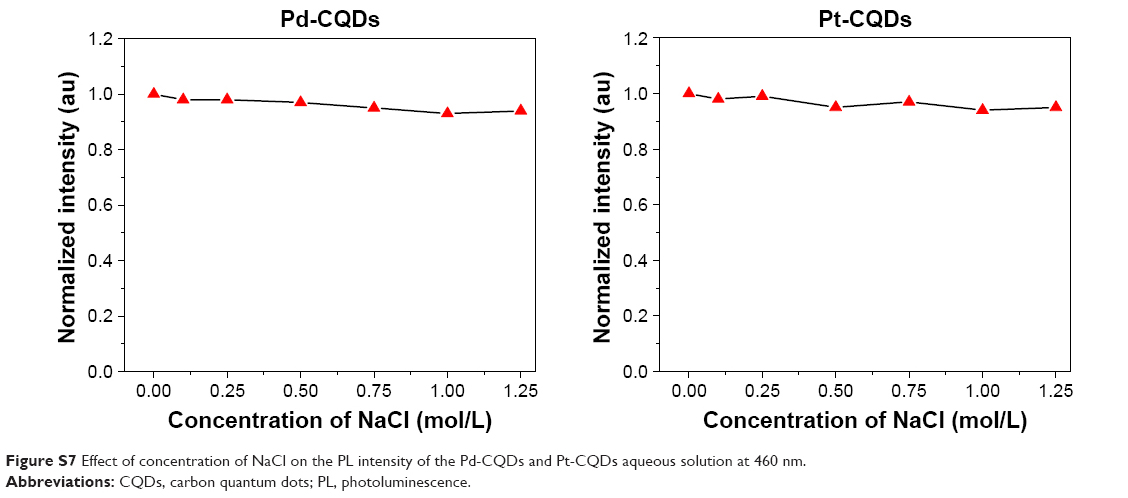 | Figure S7 Effect of concentration of NaCl on the PL intensity of the Pd-CQDs and Pt-CQDs aqueous solution at 460 nm. |
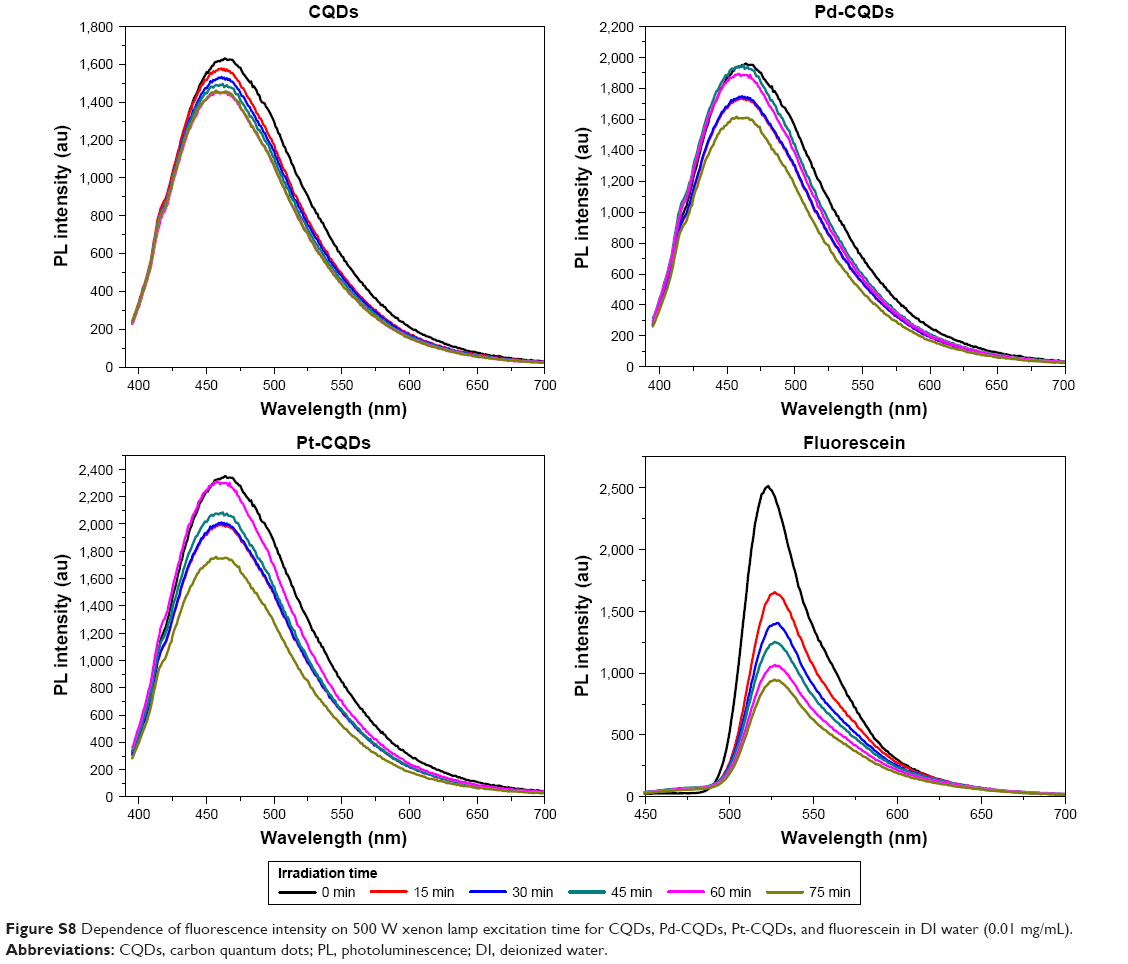 | Figure S8 Dependence of fluorescence intensity on 500 W xenon lamp excitation time for CQDs, Pd-CQDs, Pt-CQDs, and fluorescein in DI water (0.01 mg/mL). |
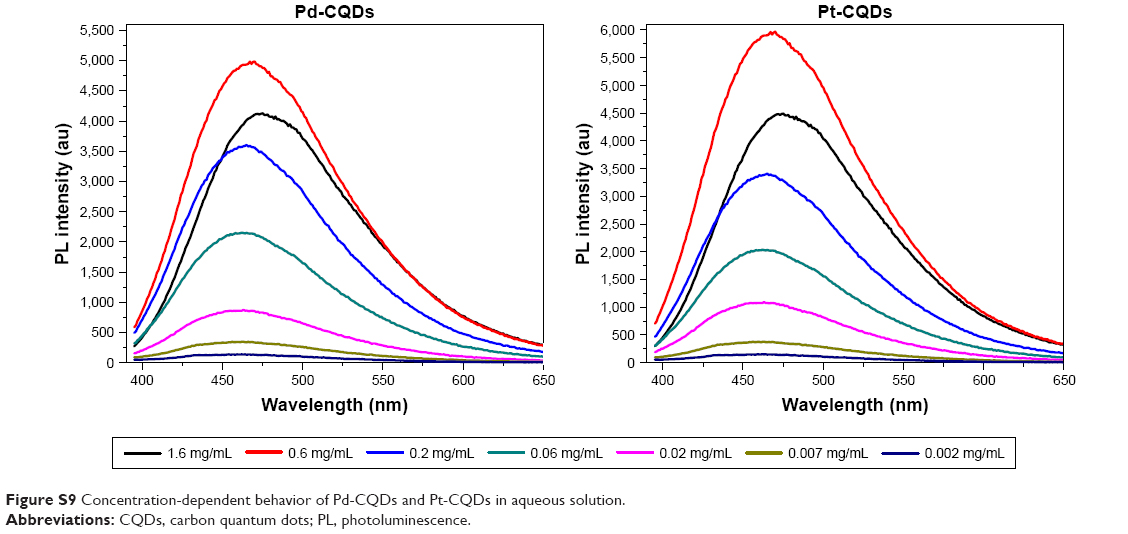 | Figure S9 Concentration-dependent behavior of Pd-CQDs and Pt-CQDs in aqueous solution. |
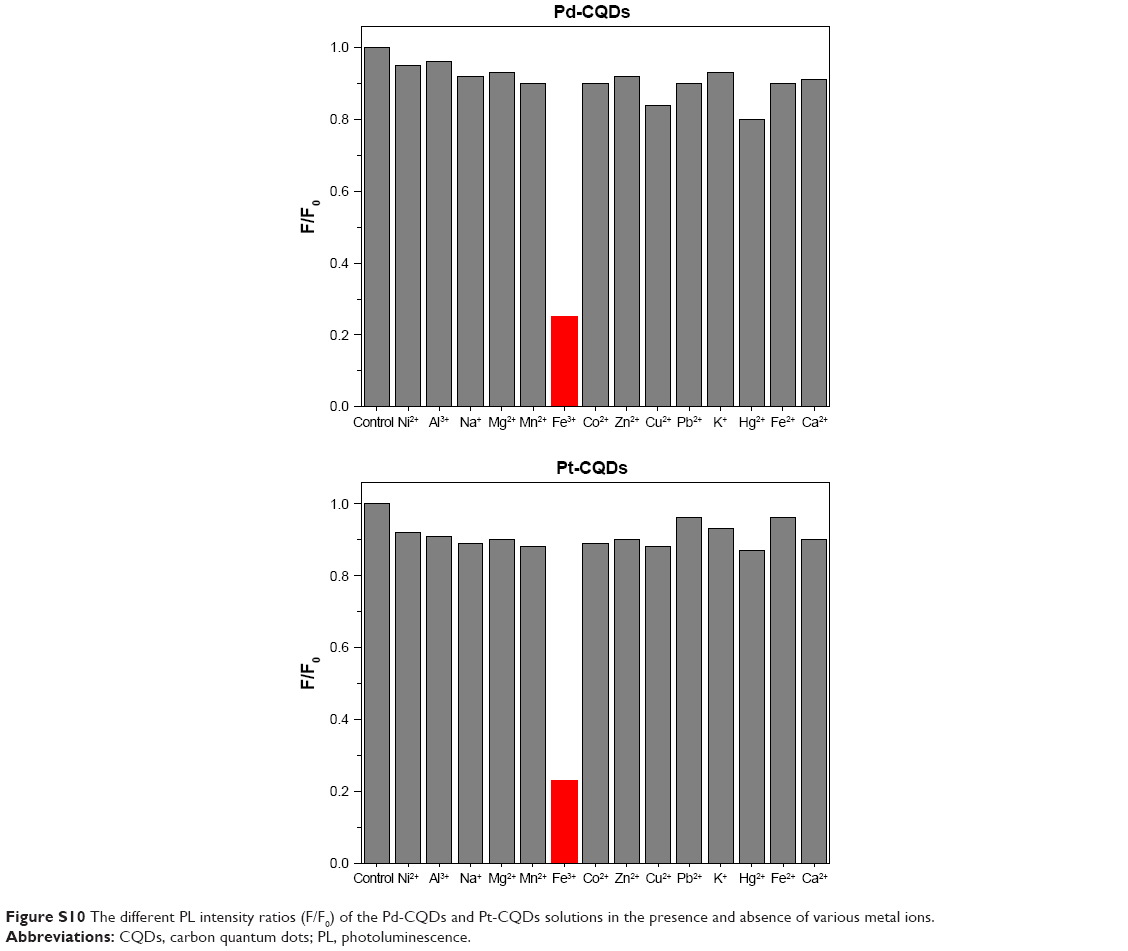 | Figure S10 The different PL intensity ratios (F/F0) of the Pd-CQDs and Pt-CQDs solutions in the presence and absence of various metal ions. |
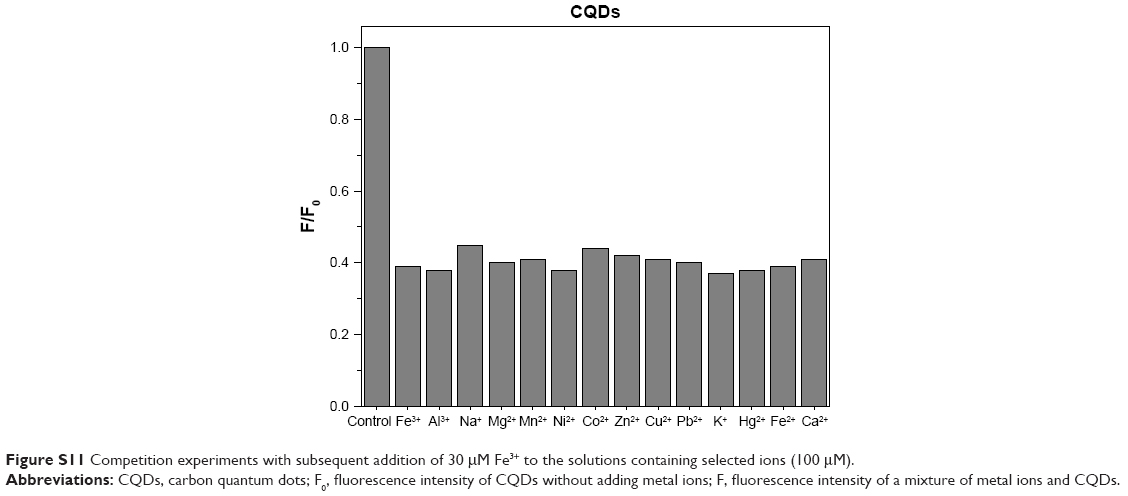 | Figure S11 Competition experiments with subsequent addition of 30 μM Fe3+ to the solutions containing selected ions (100 μM). |
 © 2017 The Author(s). This work is published and licensed by Dove Medical Press Limited. The full terms of this license are available at https://www.dovepress.com/terms.php and incorporate the Creative Commons Attribution - Non Commercial (unported, v3.0) License.
By accessing the work you hereby accept the Terms. Non-commercial uses of the work are permitted without any further permission from Dove Medical Press Limited, provided the work is properly attributed. For permission for commercial use of this work, please see paragraphs 4.2 and 5 of our Terms.
© 2017 The Author(s). This work is published and licensed by Dove Medical Press Limited. The full terms of this license are available at https://www.dovepress.com/terms.php and incorporate the Creative Commons Attribution - Non Commercial (unported, v3.0) License.
By accessing the work you hereby accept the Terms. Non-commercial uses of the work are permitted without any further permission from Dove Medical Press Limited, provided the work is properly attributed. For permission for commercial use of this work, please see paragraphs 4.2 and 5 of our Terms.