")
Back to Journals » International Journal of Nanomedicine » Volume 13
Facile fabrication of hypericin-entrapped glyconanoparticles for targeted photodynamic therapy
Authors Shao C , Shang K, Xu H , Zhang Y, Pei Z, Pei Y
Received 1 January 2018
Accepted for publication 5 June 2018
Published 23 July 2018 Volume 2018:13 Pages 4319—4331
DOI https://doi.org/10.2147/IJN.S161262
Checked for plagiarism Yes
Review by Single anonymous peer review
Peer reviewer comments 3
Editor who approved publication: Professor Lei Yang
Chen Shao, Kun Shang, Huaibao Xu, Yu Zhang, Zhichao Pei, Yuxin Pei
Shaanxi Key Laboratory of Natural Products & Chemical Biology, College of Chemistry & Pharmacy, Northwest A&F University, Yangling, Shaanxi 712100, China
Background: Photodynamic therapy is a safe, noninvasive modality for cancer therapy, in which the photosensitizer (PS) is a crucial component. Hypericin (Hy) is a promising PS; however, its clinical application is significantly limited by its poor hydrophilicity.
Materials and methods: To overcome the clinical application limitation of Hy, a novel strategy is developed here by entrapping Hy into polydopamine (PDA) film formed on the surface of magnetic iron oxide nanoparticles (MNPs) through the self-polymerization of dopamine under alkaline condition. The amount of Hy in the Hy-entrapped PDA–MNP composite nanoparticles (denoted as PHMs) was measured by spectrophotometry. Furthermore, lactose, as the targeting ligand to asialoglycoprotein receptors, was conjugated to the surface of the PHMs by taking advantage of the spontaneous reaction of PDA with amino groups.
Results: Spectrophotometry analysis revealed that the amount of Hy in the PHMs was 72 µmol g-1 PHMs. The fabricated Hy-entrapped glyconanoparticle (Lac-PHM) exhibited excellent water dispersibility, stability, and selectivity for asialoglycoprotein receptors overexpressing HepG2 cells. Atomic absorption spectroscopy analysis showed that the amount of the Lac-PHMs taken in HepG2 cells was 2.1-fold higher than that of the triethylene glycol-modified PHMs. The results of intracellular reactive oxygen species generation detection, cytotoxicity study, and apoptosis detection indicated that the Lac-PHMs had a satisfying photodynamic effect to HepG2 cells.
Conclusion: The strategy developed in this work offers great potential for delivery of a variety of hydrophobic PSs.
Keywords: hypericin, photodynamic therapy, glyconanoparticles, targeted drug delivery
Introduction
Photodynamic therapy (PDT) has been developed as a safe, noninvasive treatment modality for a number of diseases.1 In cancer therapy, PDT can kill drug- and radio-resistant tumor cells, reducing the need for delicate surgery and lengthy recuperation, which makes it an attractive alternative to conventional therapies.2,3 The photosensitizer (PS) is the most crucial component of PDT. After accumulating in tumor sites, it can be excited by light to produce various reactive oxygen species (ROS) through interaction with molecular oxygen in tissues. The ROS can then oxidize cellular components including unsaturated lipids, amino acid residues, and nucleic acids to induce cell necrosis and/or apoptosis.4–6 Hematoporphyrin derivatives are the most classical PSs and have been widely used in cancer therapy.7–9 However, these porphyrin-based PSs have several disadvantages, including low absorption of light, suboptimal tumor selectivity, and long-lasting cutaneous photosensitivity.10–12 To alleviate the problems encountered with hematoporphyrin derivatives in PDT application, new PSs are continuously being explored.11,13,14
Hypericin (Hy) is a natural compound belonging to the class of phenanthro-perylenequinone. It has been widely used as antidepressant, antiviral, and antiretroviral agents in the past decades.15–17 Recently, Hy has attracted much attention as a potent PS with substantial quantum yield, low photobleaching, a large excitation range, and negligible dark cytotoxicity.7,17,18 However, like most PSs, Hy is highly hydrophobic and cannot dissolve in aqueous medium, which reduces its photodynamic property and shortens its circulation time in blood in vivo, thus affecting its accumulation in the tumor site and weakening the effect of PDT for cancer therapy.18–20 A promising strategy to overcome this problem is to associate Hy with a nanocarrier that is biocompatible and dispersible in an aqueous physiologic environment.21 Solid lipid nanoparticles (SLNs) are the most studied Hy nanocarriers;20,22,23 they show good tolerability and biocompatibility, can protect the incorporated drug from chemical- and photodegradation, and the exposed polyethylene glycol (PEG) units on the surface of SLNs afford good aqueous dispersibility and long circulation potential. The Hy-loaded SLNs exhibit remarkable dark cytotoxicity and PDT effect on cancer cells. Polylactic acid (PLA) nanoparticles (NPs) have also been used to carry Hy, and their performance on PDT is similar to SLNs.24 However, both SLNs and PLA NPs are short on reactive groups for surface modification.25–27 Another strategy to deliver Hy is through conjugation with a hydrophilic polymer through covalent coupling reactions, and then forming Hy-loaded NPs through conjugation on NP scaffolds. The hydrophilic polymer allows the nanosystems to disperse well in aqueous solution, and the physicochemical property of the NP scaffolds can provide extra function to the nanosystems.28 This method also prevents the aggregation of Hy in an aqueous environment and increases its cellular accumulation.23,24 Indeed, the accumulation of PS in target cells is essential for PDT efficiency.29,30 To our knowledge, despite targeting moieties based on active targeting strategy being one of the most powerful and promising pathways to increase the drug accumulation in the lesion for treatment, none of the current Hy nanocarriers have incorporated this strategy.31–33
In this work, we present a facile and novel strategy to design a nanocarrier for Hy delivery: Hy was first entrapped into polydopamine (PDA) film through the process of dopamine polymerization on the surface of magnetic iron oxide nanoparticles (MNPs). Subsequently, lactose, which can specifically interact with asialoglycoprotein receptors (ASGP-R), was conjugated to the PDA surface of the as-fabricated PDA–Hy–MNP composite nanoparticles (PHMs) through Michael addition or Schiff base reaction under alkaline condition.34–36 The final fabricated Hy-entrapped glyconanoparticles (denoted as Lac-PHMs) have the following properties: excellent stability and dispersibility in aqueous environment, fair targeting ability for ASGP-R-overexpressing cancer cells, negligible cytotoxicity in the absence of light, and a satisfying performance in PDT. Furthermore, the strategy we designed for Hy delivery is very versatile and easily expandable, with not only Hy being replaceable by other hydrophobic PSs, but the conjugated targeting moieties, and the scaffold as well, to perform different functions.
Materials and methods
Materials
All chemicals and solvents were of analytical reagent grade and used as received unless specified. Emodin, which is the raw material for the synthesis of Hy, was purchased from Xi’an Natural Field Bio-Technique Co., Ltd (Xi’an, China). Iron (III) chloride hexahydrate, ethylene glycol, sodium acetate, acetic anhydride, and N,N-dimethylformamide were purchased from Tianjin Bodi Chemical Co., Ltd. (Tianjin, China). Dopamine hydrochloride (DA-HCl), lactose, triethylene glycol (TEG), poly(ethylene glycol) 2000 (PEG 2000), 1-(3-dimethylaminopropyl)-3-ethylcarbodiimide hydrochloride, triethyleneglycol monochlorohydrin, sodium methylate, p-toluenesulfonic acidmonohydrate, 2′,7′-dichlorofluorescin diacetate (DCFDA), boron trifluoride diethyl etherate, p-nitroso-dimethylaniline (RNO), imidazole, methylene blue (MB), N-acetylcysteine (NAC), and dihydroethidium (DHE) were purchased from Aladdin Chemistry Co., Ltd. (Shanghai, China). Dimethylsulfoxide (DMSO) and Tris(hydroxymethyl)aminomethane were obtained from Sigma-Aldrich Co. LLC. (Darmstadt, Germany). The 5% Pd/C was purchased from Shaanxi Rocknew material Co., Ltd. (Xi’an, China). MTT was obtained from Xiya reagent (Linshu, China). Annexin V–fluorescein isothiocyanate (FITC) fluorescence microscopy kit was purchased from Beyotime Biotechnology Inc. (Shanghai, China). Column chromatography was performed using silica gel with a grain size of 40–63 μm (Qingdao Haiyang Chemical Co., Ltd., Qingdao, China). DMEM, RPMI 1640 medium, and trypsin-EDTA solution were obtained from Gibco BRL Co., Ltd. (Grand Island, New York, USA). Fetal bovine serum (FBS) was purchased from Yuanhengjinma Co., Ltd. (Beijing, China). Penicillin/streptomycin was purchased from KeyGen Biotech. Co., Ltd. (Nanjing, China). Human hepatocellular carcinoma cancer cell line HepG2 and the human breast adenocarcinoma cell line MCF-7 were obtained from the Type Culture Collection of the Chinese Academy of Science (Shanghai, China). In the synthesis of Hy, a Rayonet PRP-100 photochemical reactor (Brandford, USA) and a CEM Discover-SP W/Activent Microwave Synthesis System (Matthews, NC, USA) were used. The ultrasonic treatment in this work was conducted with an L-650Y ultrasonicator (Shanghai LNB Instrument Co., Ltd., Shanghai, China). MNPs were prepared with a Teflon-lined stainless-steel autoclave (10 mL capacity) in a drying oven (DGX-9243B-1, Shanghai Fuma Laboratory Instrument Co., Ltd., Shanghai, China). A permanent magnet was used to collect and purify NPs in all processes. The LED array photosource (50 W) used in PDT treatment and ROS generation research was purchased from Shenzhen Kiwifruit Co., Ltd. (Shenzhen, China).
Characterization
1H nuclear magnetic resonance (NMR) spectra were recorded on a Bruker Advance 500 instrument (Bruker BioSpin GmbH, Rheinstetten, Germany) in CDCl3 or CD3OD using the residual signals from CHCl3 (1H: δ=7.26 ppm) or CH3OH (1H: δ=3.31 ppm) as internal standards. The hydrodynamic diameters and ζ-potentials of NPs were determined by a Delsa Nano C analyzer (Beckman Coulter, Inc., Miami, FL, USA). Transmission electron microscope (TEM) images were taken with a HitachiH-600 instrument (Hitachi Ltd., Tokyo, Japan) operated at 75 kV. UV-Vis absorption detection was conducted on a UV-Vis-near infrared spectrometer (Shimadzu UV-1750, Kyoto, Japan). Fluorescence spectra of free Hy and Lac-PHMs were obtained with an Agilent Cary Eclipse fluorescence spectrophotometer (California, CA, USA). Infrared spectra were obtained using the KBr pellet method and recorded with a Bruker Tensor 27 Fourier transform infrared (FT-IR)-instrument (Bruker Optik GmbH, Ettlingen, Germany). The amount of cellular uptake of NPs was measured with a Hitachi Z2000 polarized Zeeman atomic absorption spectrometer (Tokyo, Japan). A microplate reader (Tecan, infinite M200 PRO, Tecan Deutschland GmbH, Crailsheim, Germany) was used for MTT assay. Fluorescence images were taken with a Leica TCS-SP8 laser scanning confocal microscope (LSCM, Leica, Germany).
Synthesis
The amino-modified lactose 1 and amino-modified TEG 2 (the chemical structure of 2 is shown in Figure S1) were synthesized according to the published procedures, respectively.37,38 Their NMR spectra data were consistent with the published data. Hy was synthesized according to a method developed in our lab.39 MNPs were prepared through solvothermal reaction.40 Briefly, FeCl3·6H2O (1.35 g) was first dissolved in ethylene glycol (40 mL), then PEG 2000 (1.00 g) and NaOAc (3.60 g) were added and mechanically stirred for 30 minutes. The resulting solution was transferred into a Teflon-lined stainless-steel autoclave (50 mL). The autoclave was sealed and heated at 200°C for 8 hours and then cooled to room temperature. The precipitate was washed with ethanol and deionized water several times and collected with a permanent magnet. The final product was redispersed in ethanol for future use.
Fabrication of PHMs and PMs
The formation of PDA film on MNP surface was completed through a solution oxidation method.36,41 To fabricate PHMs, MNPs (3.0 mg) were first dispersed in a Tris–HCl buffer solution (10 mM, pH 8.5, 35 mL), then Hy (5.0 mg), dissolved in acetone (5.0 mL) and DA-HCl (25.0 mg), was added to the buffer solution. After 3 hours of continuous stirring at room temperature, the precipitate in the mixture was magnetically separated and washed with ultrapure water and PBS (pH 7.2) until there was no Hy in the supernatant (determined by UV-Vis spectroscopy). The obtained PHMs were dispersed in ultrapure water.
PMs (PDA-coated MNPs) were fabricated with a similar procedure in the absence of Hy acetone solution. The volume of Tris–HCl buffer was changed to 40 mL and the reaction time was shortened to 1 hour.
Fabrication of Lac-PMs, TEG-PMs, Lac-PHMs, and TEG-PHMs
The as-prepared PHMs and PMs (fabricated from 3.0 mg MNPs) were dispersed in Tris–HCl buffer (10 mM, pH 8.5, 15 mL), respectively, then 25 mg of amino-modified lactose 1 or 15 mg of amino-modified TEG 2 was added and stirred at room temperature for 6 hours. Lac-PHMs, TEG-PHMs, Lac-PMs, and TEG-PMs were washed with ultrapure water and pH 7.2 PBS several times then collected with a permanent magnet and redispersed in pH 7.2 PBS for further use.
Cell culture
HepG2 and MCF-7 cells were, respectively, maintained as monolayer cultures in RPMI 1640 and DMEM supplemented with 10% FBS and 1% penicillin-streptomycin at 37°C in a humid atmosphere (5% CO2). The cells were precultured until confluence was reached before each experiment.
Quantification of cellular uptake of free Hy and the Hy loaded in Lac-PHMs/TEG-PHMs
HepG2 and MCF-7 cells were, respectively, seeded into six-well plates at 1×10⁵ cells per well. After 24 hours of incubation (37°C, 5% CO2), the mediums were, respectively, replaced by fresh RPMI 1640 and DMEM mediums, which contained free Hy (1.0 μM, in 0.2% DMSO), Lac-PHMs, or TEG-PHMs (at Hy equivalent concentration of 1.0 μM), respectively. After incubation at 37°C for 4 hours, the mediums were removed. The cells were washed three times with PBS, and then digested using 0.25 w/v% trypsin/0.03 w/v% EDTA. The suspensions were centrifuged at 1,000 rpm for 5 minutes at 25°C, and the pellets were then resuspended in PBS for cell counting. Subsequently, the cells were centrifuged to obtain the cell pellets for quantification analysis.
In the quantification of cellular uptake of free Hy, 0.5 mL ultrapure water was used to, respectively, resuspend the cell pellets and the cells were fully disrupted with the ultrasonicator. The solutions were then, respectively, diluted with 0.9 mL acetone, and the fluorescence intensities of the solutions at 650 nm (excitation wavelength was 590 nm) were measured. The Hy concentration in the mixture solution can be calculated using the standard curve (Figure S2). The amount of Hy in HepG2 cells and MCF-7 cells can be calculated from Equation 1:
|
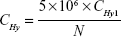
where CHy1 stands for the concentration of Hy in the mixture solutions (μM); N stands for the cell numbers; CHy stands for the amount of Hy in HepG2 cells or MCF-7 cells (fmol cell−1).
In the quantification of cellular uptake of Lac-PHMs and TEM-PHMs, 1.2 mL HCl (18%) was added to the cell pellets to digest cells in boiling water for 2 hours. Then the digestion solutions were filtered with 0.22 μm filter membrane and the atomic absorption of iron element in the filtrates was detected using an atomic absorption spectrometer. The amount of iron element in each sample can be determined by comparison to the standard curve (Figure S3), and the amount of iron element in HepG2 cells and MCF-7 cells can be calculated according to Equation 2:
|
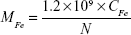
where CFe stands for the concentration of iron element in the samples (μg mL−1); N stands for the cell numbers; MFe stands for the amount of iron element in HepG2 cells or MCF-7 cells (fg cell−1).
The mass ratio of Lac-PHMs and TEG-PHMs to the MNPs is 1.24, and the mass of Lac-PHMs and TEG-PHMs in HepG2 or MCF-7 cells can be calculated by Equation 3:
|
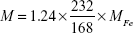
where MFe stands for the amount of iron element in HepG2 cells or MCF-7 cells (fg cell−1); M stands for the amount of Lac-PHMs or TEG-PHMs in HepG2 or MCF-7 cells (fg cell−1).
The amount of Hy in Lac-PHMs and TEG-PHMs was obtained, and thus the corresponding concentration of Hy loaded in Lac-PHMs and TEG-PHMs in HepG2 or MCF-7 can be calculated.
In the quantification study, the results are the averages of three independent measurements.
Qualitative and quantitative detection of intracellular ROS generation
ROS generation in cells upon light irradiation was studied using DCFDA as an indicator. For the qualitative detection with an LSCM, HepG2 and MCF-7 cells were, respectively, seeded onto 35 mm cell-culture dishes (5×10⁴ cells) and incubated for 24 hours (37°C, 5% CO2), then RPMI 1640 or DMEM containing free Hy (1.0 μM, in 0.2% DMSO medium) or the NPs (at Hy equivalent concentration of 1.0 μM for Lac-PHMs and TEG-PHMs, at a concentration of 15 μg mL−1 for Lac-PMs and TEG-PMs) was employed to replace the previous mediums. After further incubation at 37°C for 4 hours, the mediums were removed and the cells were washed twice with PBS. Here, the cells without treatment were used as PBS control, the cells treated with 10.0 mM NAC for 12 hours were used as negative control, and the cells treated with 2.0 mM H2O2 for 2 hours were used as positive control. Subsequently, 1.5 mL DCFDA solution (20.0 μM) was added to each dish and incubated at 37°C for 30 minutes. After removing the non-entrapped DCFDA, the cells were washed with PBS three times and then exposed to an LED array photosource (λ = 595–600 nm, 8.6 mW cm−2) for 30 minutes. Immediately after this, fluorescent images of the cell-culture dishes were taken with an LSCM. The fluorescence of 2′,7′-dichlorofluorescein (DCF) was excited by blue light 488 nm and observed through the green channel. For the quantitative detection, HepG2 and MCF-7 cells were, respectively, seeded onto 96-well plates at a density of 7×10³ cells per well, and the subsequent experimental procedure was the same as that in the qualitative detection until the PDT treatment was conducted. After the PDT treatment, the supernatants were removed and a mixture of DMSO and FBS (150 μL, DMSO/FBS = 9:1, v/v) was added to each cell containing well. Then the 96-well plates were shaken for 20 minutes and the fluorescence intensity of DCF was detected immediately with a microplate reader. The excitation wavelength was 488 nm and the emission wavelength was 520 nm. Data are presented as average ± SD (n=3).
Cytotoxicity study
To detect the dark toxicity of the Hy nanocarriers, HepG2 and MCF-7 cells seeded in 96-well plates were precultured for 24 hours, then the mediums were replaced with 90 μL fresh mediums and 10 μL of the Hy nanocarriers (dispersed in PBS) or free Hy (in 0.2% DMSO-PBS). The final concentrations of Hy were 0.0, 0.2, 0.4, 0.6, 0.8, and 1.0 μM, respectively. After 4 hours of incubation, the noninternalized Hy nanocarriers and free Hy were washed with PBS three times and the cells were further cultured for 24 hours. The cell viabilities were determined by MTT assay. For phototoxicity detection, the influence of irradiation time was first studied. After 4 hours of respective incubation with free Hy and the Hy nanocarriers, the cells were washed twice with PBS and exposed to the LED array photosource (λ=595–600 nm, 8.6 mW cm−2) for different time frames (0, 5, 10, 20, and 30 minutes), then cultured for 24 hours (37°C, 5% CO2). Following this, MTT assay was performed. The influence of Hy concentration on the phototoxicity was also evaluated, where the light irradiation time was fixed at 30 minutes and the Hy concentrations were the same as those used for the dark toxicity detection. Here, the effect of light stimulation on PS-untreated cells was also investigated. The cells without any treatment and irradiation were used as control. The cytotoxicity data are presented as average ± SD (n=5).
Annexin V–FITC/propidium iodide (PI) staining
HepG2 and MCF-7 cells were, respectively, seeded in 35 mm cell-culture dishes (5×10⁴ cells) and precultured for 24 hours, then, respectively, incubated with free Hy (1.0 μM, in 0.2% DMSO medium), Lac-PHMs, and TEG-PHMs (at Hy equivalent concentration of 1.0 μM) in fresh medium for 4 hours. Cells without treatment were used as control. The cells were subsequently washed with PBS and irradiated with the LED array photosource (λ=595–600 nm, 8.6 mW cm−2) for 30 minutes. After a further incubation for 24 hours, the cells were washed twice with PBS. Thereafter, the Annexin V–FITC binding solution (0.6 mL) and Annexin V–FITC apoptosis detection reagent (with 12 μL Annexin V–FITC and 24 μL PI) were added to each cell-culture dish in succession. The cells were cultured for 15 minutes in the dark, and then washed three times with PBS to remove free dyes. Following this, fluorescent images of the cell-culture dishes were taken immediately with a LSCM. The fluorescence of FITC and PI were excited with 488 nm and 552 nm, respectively, and observed through the green channel and red channel, respectively.
Results and discussion
Fabrication and characterization of Hy-entrapped composite NPs
Low cost, good mechanical stability, convenience in synthesis, and especially their unique superparamagnetic property make MNPs one of the most widely used NPs. In this work, MNPs were employed as a scaffold to fabricate Hy delivery systems. The MNPs were synthesized through the solvothermal method.40 Dynamic light scattering (DLS) analysis showed their average hydrodynamic diameter to be 291 nm (Figure S4). The fabrication of the Lac-PHMs is illustrated in Figure 1. The coating of PDA on the surface of MNPs was conducted through the classical solution oxidation method.42 In this experiment, the MNPs were dispersed in Tris–HCl buffer (pH 8.5) with ultrasonic treatment and the suspension was stirred with a mechanical stirrer, then Hy dissolved in acetone was added to the dispersion followed by the addition of DA-HCl dissolved in pH 8.5 Tris–HCl buffer. The entrapment of Hy was accomplished by stirring the mixture at room temperature for 3 hours. Finally, the PHMs were obtained by repeated washing with pH 7.2 PBS and ultrapure water until no Hy could be detected in the supernatant. To test the entrapment stability of Hy, PHMs were redispersed in PBS and left standing at room temperature in the absence of light for 1 week. No fluorescence could be detected in the supernatant, indicating that the entrapment of Hy in the PHMs was stable.
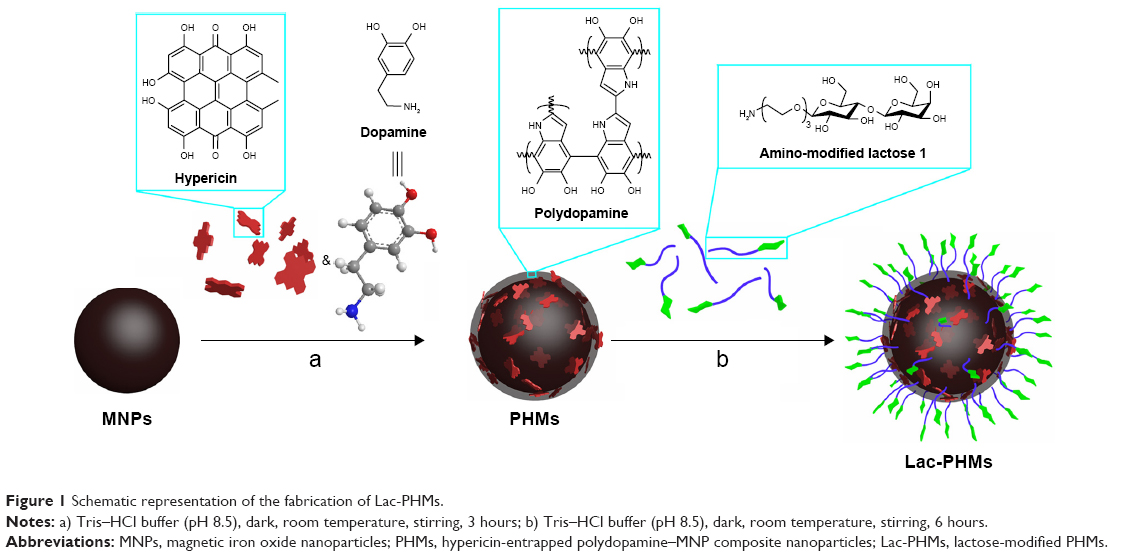 | Figure 1 Schematic representation of the fabrication of Lac-PHMs. |
In the process of fabricating PHMs, Hy was dissolved in acetone before being added to the reaction system in order to avoid its aggregation. To evaluate the influence of acetone on dopamine polymerization, a control experiment was run in which Hy and acetone were not added to the reaction system and the time of dopamine polymerization on the MNP surface was decreased to 1 hour. The PHMs and the product of the control experiment (PDA–MNP composite nanoparticles, denoted as PMs) were then observed by TEM. The TEM images revealed that the mean thickness of the PDA film on PHMs was 8 nm, while that on PMs was 14 nm (Figure 2). This result demonstrated that the addition of acetone distinctly decreased the polymerization rate of dopamine.
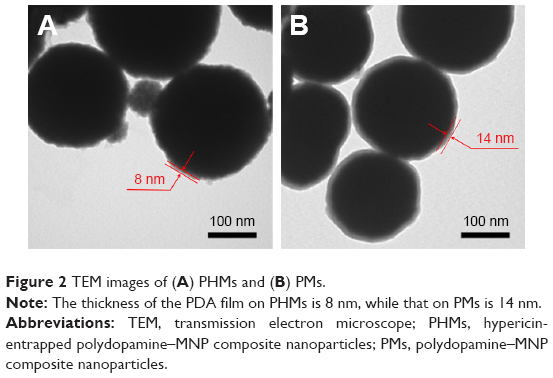 | Figure 2 TEM images of (A) PHMs and (B) PMs. |
The FT-IR spectra of PDA, Hy, MNPs, PMs, and PHMs are shown in Figure S5. The absorption peaks at 1,333 and 1,510 cm−1 (C=N and C−N−C stretching vibration) appeared in the spectra of PDA, PMs, and PHMs, indicating that PDA film had been successfully coated on the surface of MNPs in both the fabrication processes of PMs and PHMs; the absorption peak at 1,261 cm−1 (C−O stretching vibration) appeared in the spectra of Hy and PHMs, suggesting that Hy had been entrapped into the PDA film of PHMs.
The Lac-PHMs were fabricated through conjugation of lactose to the surface of PHMs by simply mixing amino-modified lactose 1 with PHMs at room temperature in pH 8.5 Tris–HCl buffer for 6 hours. The reaction was a Schiff base reaction or a Michael addition between the amino group of compound 1 and quinone oxidized from the catechol on the PDA surface.36 Besides Lac-PHMs, TEG-conjugated PHMs (TEG-PHMs), lactose-conjugated PMs (Lac-PMs), and TEG-conjugated PMs (TEG-PMs) were also fabricated through this method. The ζ-potentials, hydrodynamic diameters, and polydispersity indexes of all NPs in this work were measured in ultrapure water by DLS and the results are shown in Table 1. The average ζ-potential of MNPs was 0.54 mV, meaning that there was almost no charge on the surface of MNPs, while the ζ-potential of PMs changed to −8.03 mV because of the existence of the catechol group in the PDA structure. The ζ-potential of PHMs was −14.46 mV, which is much higher than that of PMs, because of the phenolic hydroxyl groups of Hy entrapped in the PDA film. The ζ-potentials of Lac-PHMs and TEG-PHMs, respectively, changed to −9.47 and −12.23 mV, while the ζ-potentials of Lac-PMs and TEG-PMs, respectively, changed to −9.15 and −10.29 mV. In addition, the hydrodynamic diameters of the NPs also changed with the surface modification. DLS analysis showed that the average hydrodynamic diameter of PHMs was 349 nm, while that of Lac-PHMs and TEG-PHMs was, respectively, 553 and 447 nm. The increase in hydrodynamic diameter was also observed when comparing Lac-PMs and TEG-PMs with PMs (Figure S6). The changes in ζ-potential and hydrodynamic diameter indicated that lactose and TEG had been successfully conjugated to the surfaces of PHMs and PMs, respectively. Unlike the ζ-potentials or hydrodynamic diameters, the polydispersity indexes of the NPs showed little change with the surface modification, ranging from 0.155 for PMs to 0.246 for TEG-PHMs.
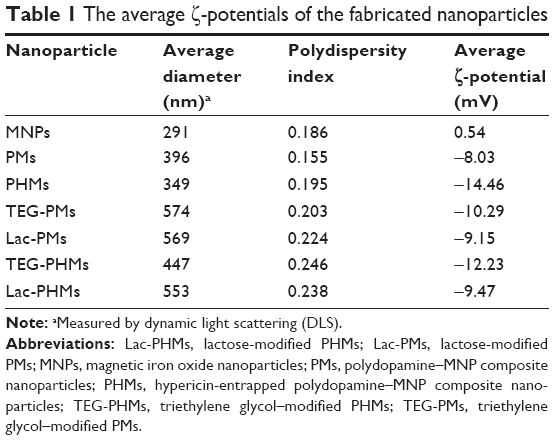 | Table 1 The average ζ-potentials of the fabricated nanoparticles |
The amount of Hy in PHMs, Lac-PHMs, and TEG-PHMs was measured by UV-Vis spectroscopy and calculated based on a standard curve (Figure S7). Spectrophotometry analysis showed that the amount of Hy in PHMs, Lac-PHMs, and TEG-PHMs was, respectively, 72, 66, and 69 μmol g−1 NPs (for measurement, see the Supplementary material). The amount of lactose and TEG on Lac-PMs, Lac-PHMs, TEG-PMs, and TEG-PHMs was, respectively, 140, 170, 180, and 240 μmol g−1 NPs; this was directly determined by calculating the weight differences between the modified NPs and the unmodified NPs.
After dispersing 15 μg mL−1 of Lac-PHMs, TEG-PHMs, Lac-PMs, and TEG-PMs in pH 7.2 PBS for 24 hours, no obvious precipitates could be observed, illustrating their good dispersibility in aqueous medium.
The 1O2 quantum yields (Φ) of Lac-PHMs in PBS and free Hy in 0.2% DMSO-PBS were measured by RNO-bleaching method (see the Supplementary material for experiment),23 where MB (ΦMB = 0.52) was employed as a standard reference. The calculated ΦLac-PHMs in PBS was 0.092, while the ΦHy in 0.2% DMSO-PBS was 0.064.
The absorption spectrum of Lac-PHMs was recorded and compared with that of free Hy (in 0.2% DMSO-PBS). The main absorption peaks in the two spectra appeared at the same position (Figure S8). Considering that the interaction between PS and FBS may cause blue- or red shift of its spectrum and thus affect its PDT efficiency, the spectrum of Lac-PHMs in 10% FBS was obtained after 24 hours of incubation at 37°C. As shown in Figure S9, no obvious change was observed for the main absorption peaks. To investigate the stability of Lac-PHMs in FBS, the NPs were dispersed in 10% FBS and shaken at 37°C for 48 hours. After magnetic separation, the supernatant was measured by UV-Vis and no Hy was detected, which demonstrated that the Lac-PHMs were stable in FBS.
After irradiation with the LED array (λ=595–600 nm, 8.6 mW cm−2) for 30 minutes, photobleaching was observed from the fluorescence spectrum of Hy (dissolved in DMSO, the excitation wavelength was 590 nm) (Figure S10), but not from Lac-PHMs (dispersed in DMSO) (Figure S11). This result indicates that the entrapment of Hy into the PDA film could protect Hy from photobleaching.
Cellular uptake quantification of free Hy and Hy loaded in Lac-PHMs/TEG-PHMs
Cancer-targeted drug delivery systems are generally designed to achieve better cancer therapeutic efficiency through active accumulation at tumor site. In this work, HepG2 cells that overexpress ASGP-R were used as the lactose-positive cell model,43 while MCF-7 cells that have a low-level ASGP-R expression were employed as the lactose-negative cell model.44,45 Concurrently, Lac-PHMs and TEG-PHMs were used as ASGP-R-positive and -negative Hy nanocarriers, respectively. In this experiment, the cellular uptake of free Hy (in 0.2% DMSO-DMEM) was also examined for comparison. The cellular uptake quantification results are shown in Figure 3. For Lac-PHMs and TEG-PHMs, the results were converted to the loaded Hy concentrations. The results revealed that the uptake amount of Lac-PHMs was 2.1-fold higher than that of TEG-PHMs in HepG2 cells after 4 hours incubation, which was similar to the uptake of both PHMs in MCF-7 cells. This demonstrated that the Lac-PHMs can effectively target HepG2 cells through a receptor-mediated mechanism from the specific interaction between lactose and ASGP-R. The uptake of free Hy by both HepG2 and MCF-7 cells was higher than that of the NPs, which might be due to diffusion being an additional possible cellular internalization pathway, while PHMs can only enter cells through endocytosis.
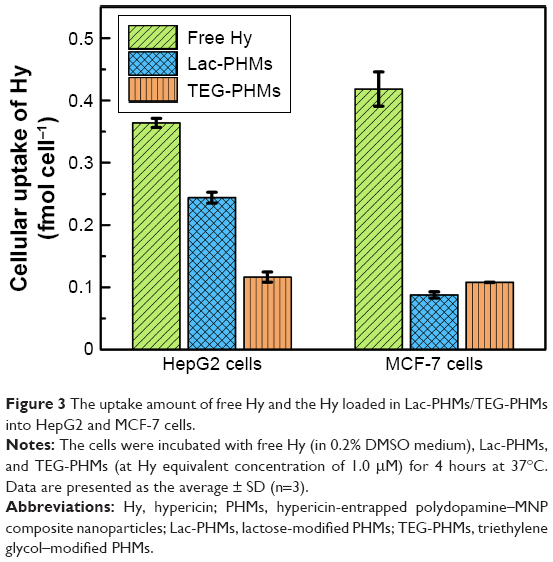 | Figure 3 The uptake amount of free Hy and the Hy loaded in Lac-PHMs/TEG-PHMs into HepG2 and MCF-7 cells. |
Intracellular ROS generation monitoring
The intracellular ROS generation is a crucial step of PDT. In this work, the intracellular ROS generation induced by Hy nanocarriers upon light irradiation was systematically evaluated by using DCFDA, a fluorescent ROS indicator. The fluorescence of DCFDA is negligible when incubated with cells; however, after the PS inside cells is activated by light irradiation, the generated ROS will cause the structure conversion of DCFDA to DCF, which emits strong green fluorescence upon 488 nm excitation,46,47 and the fluorescence intensity is proportional to the amount of ROS. The ROS generated by free Hy (in 0.2% DMSO medium), Lac-PHMs, TEG-PHMs, Lac-PMs, and TEG-PMs in HepG2 and MCF-7 cells was first studied qualitatively with an LSCM, where the concentration of free Hy and Hy in Lac-PHMs and TEG-PHMs was 1.0 μM. The concentration of Lac-PM and TEG-PM was 15 μg mL−1, which was the same as the mass concentration of Lac-PHMs. Free Hy and the NPs were, respectively, incubated with HepG2 or MCF-7 cells for 4 hours, then DCFDA was added and incubated with cells for 30 minutes, followed by irradiation for 30 minutes with an LED array photosource (λ=595–600 nm, 8.6 mW cm2). Cells without any treatment were used as PBS control, and the H2O2- and NAC-treated cells were, respectively, used as the positive and negative controls. After the PDT treatment, fluorescence images of DCF were taken and shown in Figure 4. No fluorescence was observed in the negative control group as the reducing compound NAC could clear the intracellular ROS. In contrast, very strong fluorescence was observed in the positive control group and free Hy group. There was very weak fluorescence in the PBS control groups and the Lac-PMs or TEG-PM groups, which meant that negligible ROS was generated as the Hy-less NPs had no photodynamic effect. For the Hy-containing NPs, the fluorescence in Lac-PHMs-added group was stronger than that in TEG-PHMs-added group in HepG2 cells, whereas in MCF-7 cells the two NPs generated similar fluorescence intensity, which meant that more ROS was induced by Lac-PHMs in HepG2 cells because of the increased accumulation due to the specific interaction between lactose and ASGP-R. The quantitative ROS generation study was performed with a microplate reader. The results are summarized in Figure 5 and are consistent with the qualitative results. It can be seen that the fluorescence intensity generated by Lac-PHMs in HepG2 cells was about 1.7-fold higher than that detected in MCF-7 cells, and comparable to those found in H2O2 groups (positive) and free Hy groups. The fluorescence intensities generated by TEG-PHMs in the two cell lines were at a similar level to that generated by Lac-PHMs in MCF-7 cells, while none or very weak fluorescence intensity was detected from PBS, NAC (negative control), Lac-PM, and TEG-PM groups.
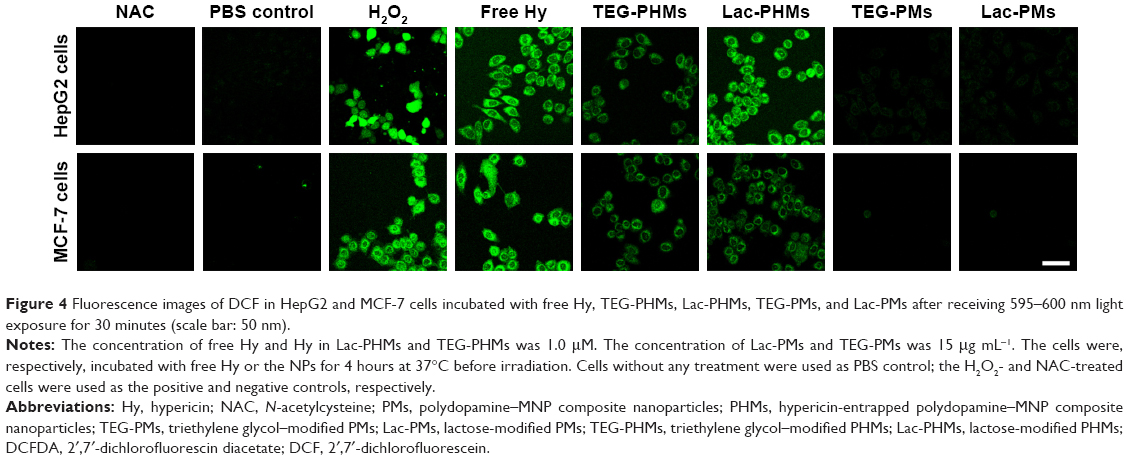 | Figure 4 Fluorescence images of DCF in HepG2 and MCF-7 cells incubated with free Hy, TEG-PHMs, Lac-PHMs, TEG-PMs, and Lac-PMs after receiving 595–600 nm light exposure for 30 minutes (scale bar: 50 nm). |
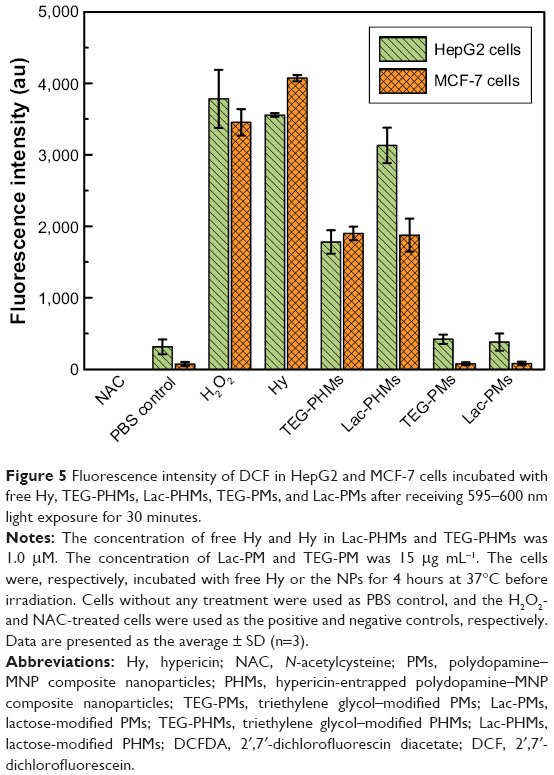 | Figure 5 Fluorescence intensity of DCF in HepG2 and MCF-7 cells incubated with free Hy, TEG-PHMs, Lac-PHMs, TEG-PMs, and Lac-PMs after receiving 595–600 nm light exposure for 30 minutes. |
The intracellular ROS generation monitoring was further conducted with the fluorescent probe DHE. DHE is a cell-permeable blue fluorescent dye and can be oxidized by ROS to oxyethidium, which can intercalate with intracellular DNA and emit a red fluorescence. The results obtained were consistent with those mentioned above (see Figures S12 and S13).
Dark toxicity test
The dark toxicity of Lac-PHMs and TEG-PHMs was evaluated with HepG2 and MCF-7 cell lines, and compared with that of free Hy (at Hy equivalent concentrations of 0.0, 0.2, 0.4, 0.6, 0.8, and 1.0 μM, respectively). After coincubation for 4 hours, the cells were washed with PBS three times to remove the noninternalized Hy or NPs and further cultured for 24 hours before MTT assay. The cell viability of Lac-PHMs or TEG-PHMs for both investigated cell lines are displayed in Figure 6. As can be seen, the cell viability changed little for all the studied groups, indicating that the dark toxicity of Lac-PHMs and TEG-PHMs is comparable to that of Hy and is negligible.
 | Figure 6 The dark toxicities of free Hy, Lac-PHMs, and TEG-PHMs: (A) HepG2 cells; (B) MCF-7 cells. |
Phototoxicity test and apoptosis assay
The phototoxicity was evaluated from the two main factors which decide the effect of PDT; irradiation time of photosource, and concentration of Hy. To evaluate the impact of irradiation time, HepG2 and MCF-7 cells were, respectively, incubated for 4 hours in the presence of Lac-PHMs, TEG-PHMs, or free Hy (at Hy equivalent concentration of 1.0 μM), washed with PBS, and then irradiated using LED array photosource (λ=595–600 nm, 8.6 mW cm−2) for different time frames (0, 5, 10, 20, and 30 minutes, respectively). Following 24 hours culture after the irradiation, the cells were subjected to phototoxicity determination through MTT assay. The results are summarized in Figure 7A and B. As shown in Figure 7A, for PS-untreated cells, the light stimulation caused no cell viability loss even after 30 minutes irradiation, meaning that the light source employed here had no phototoxicity to the cells; for PS-treated cells, a longer irradiation time caused a lower viability of HepG2 cells, irrespective of whether the PS was free Hy, Lac-PHMs, or TEG-PHMs. However, Lac-PHMs showed a higher phototoxicity than TEG-PHMs at the same irradiation time. For instance, with 30 minutes irradiation, Lac-PHMs caused a decrease in the cell viability to 77% compared to 56% for TEG-PHMs. This can be ascribed to the increased accumulation of Lac-PHMs in HepG2 cells due to specific interaction of lactose on the surface of Lac-PHMs with ASGP-R overexpressing on the cell membrane of HepG2. In contrast, no obvious differences were observed in the MCF-7 cell groups, no matter the cells were treated with Lac-PHMs, TEG-PHMs or free Hy (except for at 30 minutes, where the cell viability of free Hy dropped to 60%, see Figure 7B). Similar results were obtained in the study on the effect of Hy concentration on photocytotoxicity, where the irradiation time was fixed at 30 minutes, and free Hy and the two Hy nanocarriers were added at Hy equivalent concentrations of 0.2, 0.4, 0.6, 0.8, and 1.0 μM, respectively (see Figure 7C and D). In both the cell lines, free Hy induced more viability loss than the Hy nanocarriers because of free Hy’s superior cell internalization efficiency, as observed earlier.
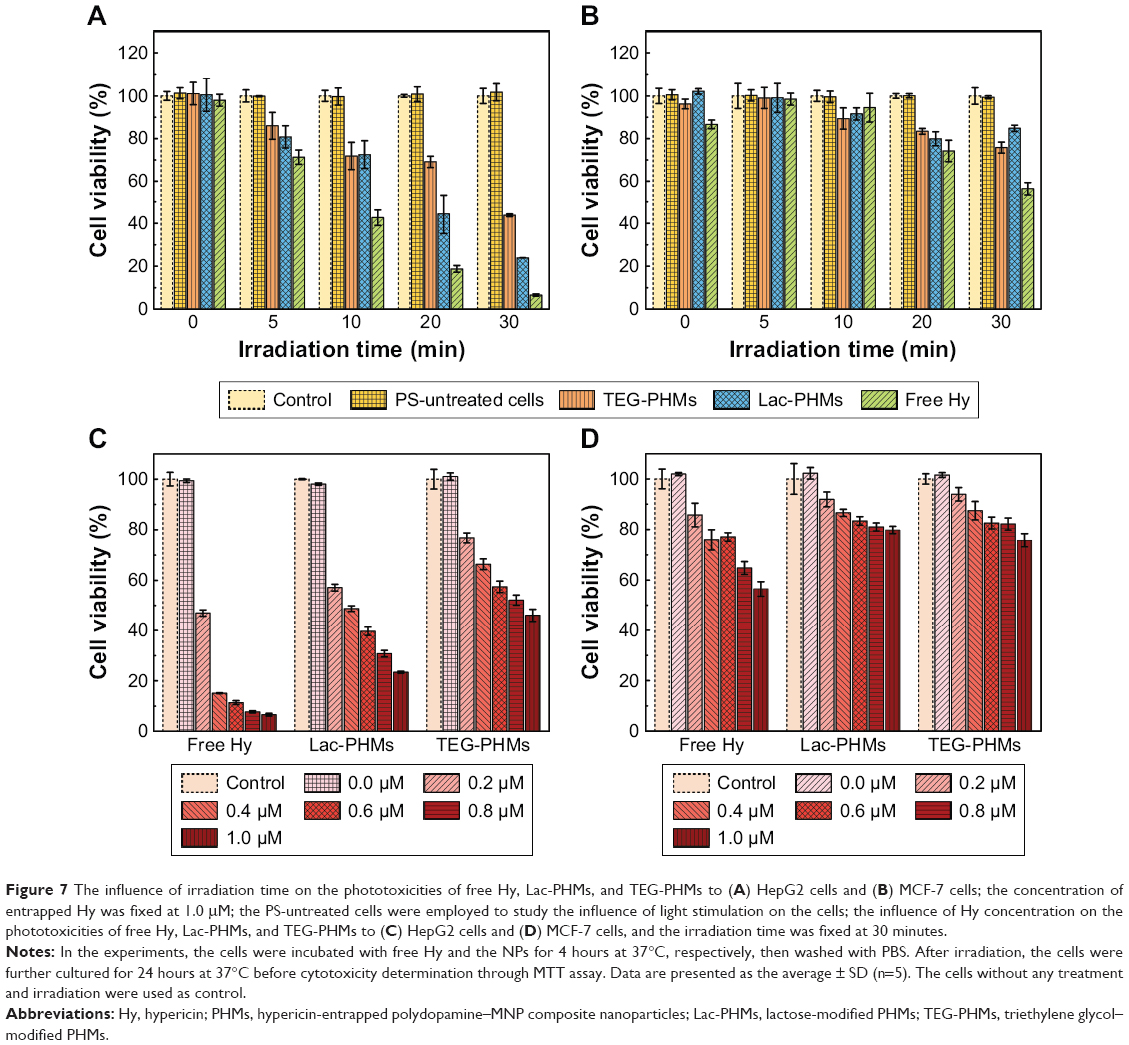 | Figure 7 The influence of irradiation time on the phototoxicities of free Hy, Lac-PHMs, and TEG-PHMs to (A) HepG2 cells and (B) MCF-7 cells; the concentration of entrapped Hy was fixed at 1.0 μM; the PS-untreated cells were employed to study the influence of light stimulation on the cells; the influence of Hy concentration on the phototoxicities of free Hy, Lac-PHMs, and TEG-PHMs to (C) HepG2 cells and (D) MCF-7 cells, and the irradiation time was fixed at 30 minutes. |
As a qualitative comparison of the MTT assay results, Annexin V–FITC and PI were applied to stain the HepG2 and MCF-7 cells, which had been cultured for 24 hours following the respective incubation with free Hy, Lac-PHMs, and TEG-PHMs (at Hy equivalent concentration of 1.0 μM; cells without adding NPs were used as control) for 4 hours and the subsequent irradiation. Annexin V–FITC can stain the externalization of phosphatidylserine in apoptotic cells with green fluorescence, while PI can bind to and stain the DNA in dead cells with red fluorescence. The staining images, obtained using an LSCM, are shown in Figure 8 and are consistent with the MTT assay results. For HepG2 cells, the intensities of both green and red fluorescence in Lac-PHMs-added group were stronger than those in TEG-PHMs-added group; while for MCF-7 cells, the fluorescence intensities in the two groups were at a similar level. All the results in the MTT assay and Annexin V–FITC/PI staining experiment indicate that compared with nontargeted Hy nanocarrier, Lac-PHMs can achieve better therapeutic efficiency for a certain type of cancer that overexpresses ASGP-R on the cell surface.
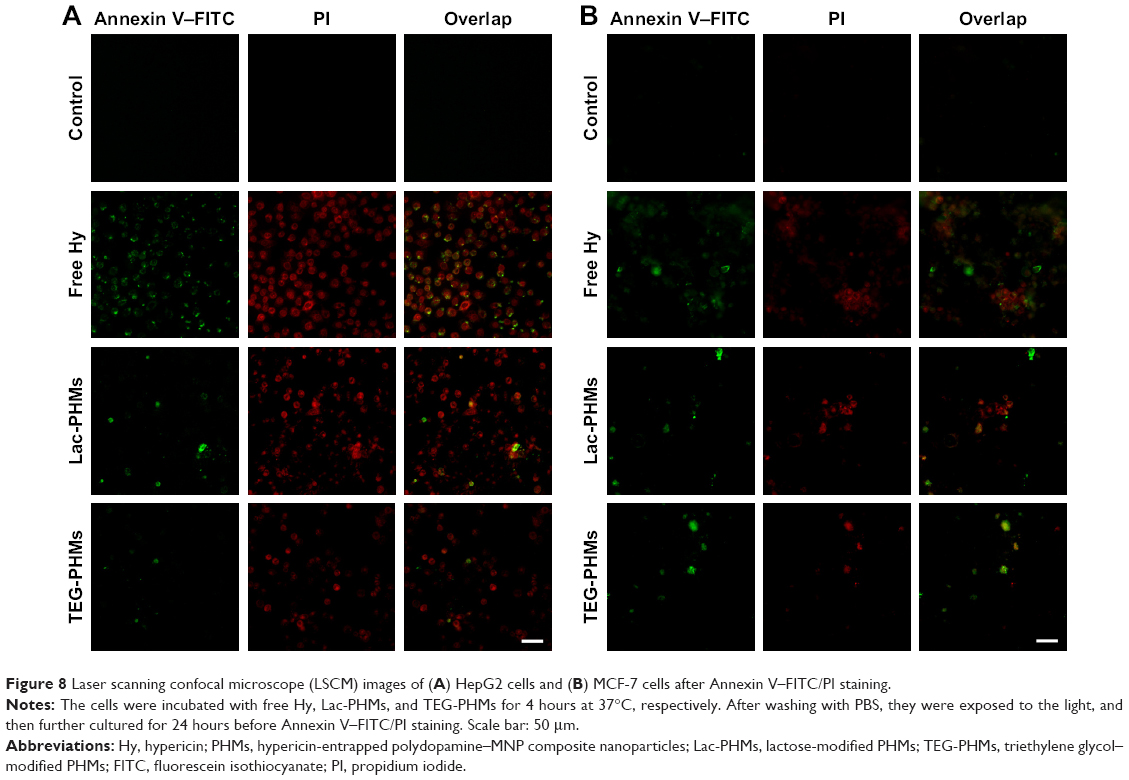 | Figure 8 Laser scanning confocal microscope (LSCM) images of (A) HepG2 cells and (B) MCF-7 cells after Annexin V–FITC/PI staining. |
It should be noted that DMSO must be used to enhance the solubility of Hy in aqueous solution as free Hy in the cell experiments. However, the potential cytotoxic side effects of DMSO make the direct use of free Hy very risky.48,49
It was recently reported that the PDA-coated MNPs displayed photothermal conversion effect under the irradiation of specified wavelengths of light, which can also be employed in cancer therapy.41 To determine whether the loss of cell viability of the Hy nanocarriers designed in this work was due to light with a wavelength of 595–600 nm being converted to heat, Lac-PMs and TEG-PMs, which had been proven to have no photodynamic ability, were employed to examine any potential photothermal conversion effect of the as-designed Hy nanocarriers. HepG2 and MCF-7 cells were, respectively, incubated with the two NPs (15 μg mL−1) for 4 hours, then washed with PBS and exposed to the photosource. After 30 minutes of irradiation and a further 24 hours of culture, the cell viability was determined using MTT assay. The results are summarized in Figure 9. Lac-PMs and TEG-PMs did not induce any cell necrosis or apoptosis under the light irradiation, which suggested that the photodynamic effect was the only factor associated with the as-fabricated Hy nanocarriers for cancer therapy.
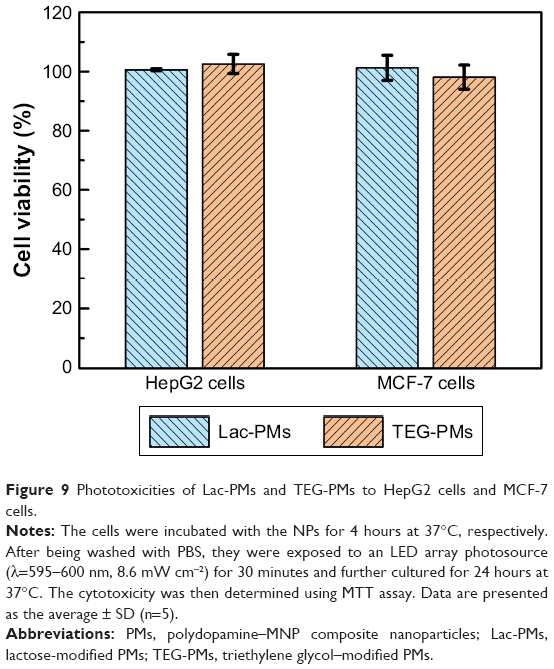 | Figure 9 Phototoxicities of Lac-PMs and TEG-PMs to HepG2 cells and MCF-7 cells. |
Conclusion
In conclusion, to promote the application of the hydrophobic PS Hy in PDT for cancer therapy, a brand new Hy nanocarrier was fabricated through a facile and novel strategy, where Hy was entrapped into the PDA film by adding it to the reaction system of dopamine polymerization on the MNP surface. Thereafter, lactose was conveniently modified to the surface of the PDA–Hy–MNP composite NPs to improve their tumor specificity by increasing the PS accumulation in the specific tumor site and thus increasing the PDT efficiency. The final fabricated Hy-entrapped glyconanoparticles exhibited outstanding stability and dispersibility in aqueous medium. Furthermore, the cellular uptake study, the intracellular ROS generation monitoring, the cytotoxicity test, and the apoptosis assay demonstrated that the Hy-entrapped glyconanoparticles can efficiently target the ASGP-R-overexpressing HepG2 cells while maintaining a satisfactory PDT. In our strategy, the scaffold can be changed between a very wide range of materials. Furthermore, the entrapped PS and the conjugated ligand can also be freely changed over a large range, allowing the potential to produce numerous desired PS nanocarriers for enhanced PDT application in medical science.
Acknowledgments
This research work was supported by the National Natural Science Foundation of China (21772157 and 21572181) and the Project of Science and Technology of Social Development in Yangling Demonstration Zone (2017SF-02).
Disclosure
The authors report no conflicts of interest in this work.
References
Dougherty TJ, Gomer CJ, Henderson BW, et al. Photodynamic therapy. J Natl Cancer Inst. 1998;90(12):889–905. | ||
Brown SB, Brown EA, Walker I. The present and future role of photodynamic therapy in cancer treatment. Lancet Oncol. 2004;5(8):497–508. | ||
Dolmans DE, Fukumura D, Jain RK. Photodynamic therapy for cancer. Nat Rev Cancer. 2003;3(5):380–387. | ||
Josefsen LB, Boyle RW. Photodynamic therapy and the development of metal-based photosensitisers. Met Based Drugs. 2008;2008:1–23. | ||
Couleaud P, Bechet D, Vanderesse R, et al. Functionalized silica-based nanoparticles for photodynamic therapy. Nanomedicine. 2011;6(6):995–1009. | ||
Yano S, Hirohara S, Obata M, et al. Current states and future views in photodynamic therapy. J Photochem Photobiol C. 2011;12(1):46–67. | ||
Bernal C, Ribeiro AO, Andrade GP, Perussi JR. Photodynamic efficiency of hypericin compared with chlorin and hematoporphyrin derivatives in HEp-2 and Vero epithelial cell lines. Photodiagnosis Photodyn Ther. 2015;12(2):176–185. | ||
Lei TC, Glazner GF, Duffy M, et al. Optical properties of hematoporphyrin monomethyl ether (HMME), a PDT photosensitizer. Photodiagnosis Photodyn Ther. 2012;9(3):232–242. | ||
Bisson JF, Notter D, Labrude P, Vigneron C, Guillemin F. Induction of superficial bladder tumors in the female Fischer 344 rats with AY-27 tumor cells for the study of diffusion and localization of hemoglobin derived components (hematoporphyrin derivative) in view of photochemotherapy. Artif Cells Blood Substit Immobil Biotechnol. 1999;27(1):77–84. | ||
Bellnier DA, Greco WR, Loewen GM, et al. Population pharmacokinetics of the photodynamic therapy agent 2-[1-hexyloxyethyl]-2-devinyl pyropheophorbide-a in cancer patients. Cancer Res. 2003;63(8):1806–1813. | ||
O’Connor AE, Gallagher WM, Byrne AT. Porphyrin and nonporphyrin photosensitizers in oncology: preclinical and clinical advances in photodynamic therapy. Photochem Photobiol. 2009;85(5):1053–1074. | ||
Grünebaum J, Söbbing J, Mulac D, Langer K. Nanoparticulate carriers for photodynamic therapy of cholangiocarcinoma: In vitro comparison of various polymer-based nanoparticles. Int J Pharm. 2015;496(2):942–952. | ||
Wainwright M. Photodynamic therapy: the development of new photosensitisers. Anticancer Agents Med Chem. 2008;8(3):280–291. | ||
Kuo WS, Shao YT, Huang KS, Chou TM, Yang CH. Antimicrobial amino-functionalized nitrogen-doped graphene quantum dots for eliminating multidrug-resistant species in dual-modality photodynamic therapy and bioimaging under two-photon excitation. ACS Appl Mater Interfaces. 2018;10(17):14438–14446. | ||
Theodossiou TA, Hothersall JS, de Witte PA, Pantos A, Agostinis P. The multifaceted photocytotoxic profile of hypericin. Mol Pharm. 2009;6(6):1775–1789. | ||
Xu Y, Wang D, Zhuang Z, et al. Hypericin-mediated photodynamic therapy induces apoptosis in K562 human leukemia cells through JNK pathway modulation. Mol Med Rep. 2015;12(5):6475–6482. | ||
Huntosova V, Nadova Z, Dzurova L, Jakusova V, Sureau F, Miskovsky P. Cell death response of U87 glioma cells on hypericin photoactivation is mediated by dynamics of hypericin subcellular distribution and its aggregation in cellular organelles. Photochem Photobiol Sci. 2012;11(9):1428–1436. | ||
Feinweber D, Verwanger T, Brüggemann O, Teasdale I, Krammer B. Applicability of new degradable hypericin-polymer-conjugates as photosensitizers: principal mode of action demonstrated by in vitro models. Photochem Photobiol Sci. 2014;13(11):1607–1620. | ||
Liu P, Yue C, Sheng Z, et al. Photosensitizer-conjugated redox-responsive dextran theranostic nanoparticles for near-infrared cancer imaging and photodynamic therapy. Polym Chem. 2014;5(3):874–881. | ||
Lima AM, Pizzol CD, Monteiro FB, et al. Hypericin encapsulated in solid lipid nanoparticles: phototoxicity and photodynamic efficiency. J Photochem Photobiol B. 2013;125:146–154. | ||
García Vior MC, Monteagudo E, Dicelio LE, Awruch J. A comparative study of a novel lipophilic phthalocyanine incorporated into nanoemulsion formulations: Photophysics, size, solubility and thermodynamic stability. Dyes Pigm. 2011;91(2):208–214. | ||
Youssef T, Fadel M, Fahmy R, Kassab K. Evaluation of hypericin-loaded solid lipid nanoparticles: physicochemical properties, photostability and phototoxicity. Pharm Dev Technol. 2012;17(2):177–186. | ||
Barras A, Boussekey L, Courtade E, Boukherroub R. Hypericin-loaded lipid nanocapsules for photodynamic cancer therapy in vitro. Nanoscale. 2013;5(21):10562–10572. | ||
Zeisser-Labouèbe M, Lange N, Gurny R, Delie F. Hypericin-loaded nanoparticles for the photodynamic treatment of ovarian cancer. Int J Pharm. 2006;326(1–2):174–181. | ||
Garcia-Fuentes M, Torres D, Alonso MJ, Dolores T, Maria JA. New surface-modified lipid nanoparticles as delivery vehicles for salmon calcitonin. Int J Pharm. 2005;296(1–2):122–132. | ||
Nobs L, Buchegger F, Gurny R, Allémann E. Surface modification of poly(lactic acid) nanoparticles by covalent attachment of thiol groups by means of three methods. Int J Pharm. 2003;250(2):327–337. | ||
Schubert MA, Müller-Goymann CC. Characterisation of surface-modified solid lipid nanoparticles (SLN): influence of lecithin and nonionic emulsifier. Eur J Pharm Biopharm. 2005;61(1–2):77–86. | ||
Unterweger H, Subatzus D, Tietze R, et al. Hypericin-bearing magnetic iron oxide nanoparticles for selective drug delivery in photodynamic therapy. Int J Nanomed. 2015;10:6985–6996. | ||
Allison RR, Downie GH, Cuenca R, Hu XH, Childs CJ, Sibata CH. Photosensitizers in clinical PDT. Photodiagnosis Photodyn Ther. 2004;1(1):27–42. | ||
Bechet D, Couleaud P, Frochot C, Viriot ML, Guillemin F, Barberi-Heyob M. Nanoparticles as vehicles for delivery of photodynamic therapy agents. Trends Biotechnol. 2008;26(11):612–621. | ||
Diab Y, Muallem MZ. Targeted therapy in ovarian cancer. A comprehensive systematic review of literature. Anticancer Res. 2017;37(6):2809–2815. | ||
Zhong Y, Meng F, Deng C, Zhong Z. Ligand-directed active tumor-targeting polymeric nanoparticles for cancer chemotherapy. Biomacromolecules. 2014;15(6):1955–1969. | ||
Ye P, Zhang W, Yang T, et al. Folate receptor-targeted liposomes enhanced the antitumor potency of imatinib through the combination of active targeting and molecular targeting. Int J Nanomed. 2014;9(1):2167–2178. | ||
Shao C, Li X, Pei Z, et al. Facile fabrication of glycopolymer-based iron oxide nanoparticles and their applications in the carbohydrate–lectin interaction and targeted cell imaging. Polym Chem. 2016;7(6):1337–1344. | ||
Chang Y, Lv Y, Wei P, et al. Multifunctional glyco-nanofibers: siRNA induced supermolecular assembly for codelivery in vivo. Adv Funct Mater. 2017;27(44):1703083. | ||
Liu Y, Ai K, Lu L. Polydopamine and its derivative materials: synthesis and promising applications in energy, environmental, and biomedical fields. Chem Rev. 2014;114(9):5057–5115. | ||
Kato H, Uzawa H, Nagatsuka T, et al. Preparation and evaluation of lactose-modified monoliths for the adsorption and decontamination of plant toxins and lectins. Carbohydr Res. 2011;346(13):1820–1826. | ||
Heller K, Ochtrop P, Albers MF, Zauner FB, Itzen A, Hedberg C. Covalent protein labeling by enzymatic phosphocholination. Angew Chem Int Ed Engl. 2015;54(35):10327–10330. | ||
Pei Y, Li Z, Pei Z, Hou Y. Process for synthesizing hypericin by monochromatic light initiation. Chinese patent CN 103274920 A. 2013. | ||
Deng H, Li X, Peng Q, Wang X, Chen J, Li Y. Monodisperse magnetic single-crystal ferrite microspheres. Angew Chem Int Ed Engl. 2005;44(18):2842–2845. | ||
Zheng R, Wang S, Tian Y, et al. Polydopamine-coated magnetic composite particles with an enhanced photothermal effect. ACS Appl Mater Interfaces. 2015;7(29):15876–15884. | ||
Taskin MB, Xu R, Gregersen H, Nygaard JV, Besenbacher F, Chen M. Three-dimensional polydopamine functionalized coiled microfibrous scaffolds enhance human mesenchymal stem cells colonization and mild myofibroblastic differentiation. ACS Appl Mater Interfaces. 2016;8(25):15864–15873. | ||
Zhong Y, Yang W, Sun H, et al. Ligand-directed reduction-sensitive shell-sheddable biodegradable micelles actively deliver doxorubicin into the nuclei of target cancer cells. Biomacromolecules. 2013;14(10):3723–3730. | ||
Chen W, Meng F, Cheng R, Deng C, Feijen J, Zhong Z. Biodegradable glycopolymer-b-poly(ε-caprolactone) block copolymer micelles: versatile construction, tailored lactose functionality, and hepatoma-targeted drug delivery. J Mater Chem B. 2015;3(11):2308–2317. | ||
Zou Y, Song Y, Yang W, Meng F, Liu H, Zhong Z. Galactose-installed photo-crosslinked pH-sensitive degradable micelles for active targeting chemotherapy of hepatocellular carcinoma in mice. J Control Release. 2014;193:154–161. | ||
Yu J, Hsu CH, Huang CC, Chang PY. Development of therapeutic Au-methylene blue nanoparticles for targeted photodynamic therapy of cervical cancer cells. ACS Appl Mater Interfaces. 2015;7(1):432–441. | ||
Curtin JF, Donovan M, Cotter TG. Regulation and measurement of oxidative stress in apoptosis. J Immunol Methods. 2002;265(1–2):49–72. | ||
Hanslick JL, Lau K, Noguchi KK, et al. Dimethyl sulfoxide (DMSO) produces widespread apoptosis in the developing central nervous system. Neurobiol Dis. 2009;34(1):1–10. | ||
Qi W, Ding D, Salvi RJ. Cytotoxic effects of dimethyl sulphoxide (DMSO) on cochlear organotypic cultures. Hear Res. 2008;236(1–2):52–60. |
 © 2018 The Author(s). This work is published and licensed by Dove Medical Press Limited. The full terms of this license are available at https://www.dovepress.com/terms.php and incorporate the Creative Commons Attribution - Non Commercial (unported, v3.0) License.
By accessing the work you hereby accept the Terms. Non-commercial uses of the work are permitted without any further permission from Dove Medical Press Limited, provided the work is properly attributed. For permission for commercial use of this work, please see paragraphs 4.2 and 5 of our Terms.
© 2018 The Author(s). This work is published and licensed by Dove Medical Press Limited. The full terms of this license are available at https://www.dovepress.com/terms.php and incorporate the Creative Commons Attribution - Non Commercial (unported, v3.0) License.
By accessing the work you hereby accept the Terms. Non-commercial uses of the work are permitted without any further permission from Dove Medical Press Limited, provided the work is properly attributed. For permission for commercial use of this work, please see paragraphs 4.2 and 5 of our Terms.