")
Back to Journals » International Journal of Nanomedicine » Volume 16
Fabrication of Submicro-Nano Structures on Polyetheretherketone Surface by Femtosecond Laser for Exciting Cellular Responses of MC3T3-E1 Cells/Gingival Epithelial Cells
Authors Xie D, Xu C, Ye C, Mei S, Wang L, Zhu Q, Chen Q, Zhao Q, Xu Z, Wei J, Yang L
Received 26 January 2021
Accepted for publication 12 April 2021
Published 10 May 2021 Volume 2021:16 Pages 3201—3216
DOI https://doi.org/10.2147/IJN.S303411
Checked for plagiarism Yes
Review by Single anonymous peer review
Peer reviewer comments 3
Editor who approved publication: Professor Israel (Rudi) Rubinstein
Dong Xie,1,2,* Chenhui Xu,1,* Cheng Ye,1,* Shiqi Mei,3 Longqing Wang,1 Qi Zhu,1 Qing Chen,1 Qi Zhao,1 Zhiyan Xu,3 Jie Wei,3 Lili Yang1
1Spine Center, Department of Orthopaedics, Shanghai Changzheng Hospital, Second Military Medical University, Shanghai, 200003, People’s Republic of China; 2Department of Orthopaedics, PLA Navy No.905 Hospital, Shanghai, 200052, People’s Republic of China; 3Key Laboratory for Ultrafine Materials of Ministry of Education, East China University of Science and Technology, Shanghai, 200237, People’s Republic of China
*These authors contributed equally to this work
Correspondence: Lili Yang Tel +86-021-81885793
Email [email protected]
Purpose: Polyetheretherketone (PEEK) exhibits high mechanical strengths and outstanding biocompatibility but biological inertness that does not excite the cell responses and stimulate bone formation. The objective of this study was to construct submicro-nano structures on PEEK by femtosecond laser (FSL) for exciting the responses of MC3T3-E1 cells and gingival epithelial (GE) cells, which induce regeneration of bone/gingival tissues for long-term stability of dental implants.
Materials and Methods: In this study, submicro-nano structures were created on PEEK surface by FSL with power of 80 mW (80FPK) and 160 mW (160FPK).
Results: Compared with PEEK, both 80FPK and 160FPK with submicro-nano structures exhibited elevated surface performances (hydrophilicity, surface energy, roughness and protein absorption). Furthermore, in comparison with 80FPK, 160FPK further enhanced the surface performances. In addition, compared with PEEK, both 80FPK and 160FPK significantly excited not only the responses (adhesion, proliferation, alkaline phosphatase [ALP] activity and osteogenic gene expression) of MC3T3-E1 cells but also responses (adhesion as well as proliferation) of GE cells of human in vitro. Moreover, in comparison with 80FPK, 160FPK further enhanced the responses of MC3T3-E1 cells/GE cells.
Conclusion: FSL created submicro-nano structures on PEEK with elevated surface performances, which played crucial roles in exciting the responses of MC3T3-E1 cells/GE cells. Consequently, 160FPK with elevated surface performances and outstanding cytocompatibility would have enormous potential as an implant for dental replacement.
Keywords: polyetheretherketone; PEEK, surface modification, submicro-nano structures, functional group, cell responses
Introduction
Due to outstanding biocompatibility, biostability and mechanical performances, polyetheretherketone (PEEK) have been widely applied in surgical treatments for bone defects/fractures, joint arthroplasties, spinal fusions, craniofacial applications.1 Recently, PEEK has been received increasing interest as dental implants because of its high mechanical strength and elastic modulus similarity to human cortical bone that can avoid the stress shielding effects in comparison with titanium (Ti) based implants.2 As an implant for dental application, integration with the host bone (known as osseointegration) is considered as the gold standard for a successful implantation, which has long been regarded as a prerequisite for implant loading in the early and late stages.3 Unfortunately, PEEK is a bioinert biomaterial that does not excite the cells responses, displaying no osteogenic bioactivity.4 As a result, PEEK does not have the ability to stimulate bone regeneration and integrate with host bone, and thereby decreases initial fixation as well as long-term stability of implants.5 As an implant for dental application, it should not only bond with bone tissues to obtain osseointegration but also be integrated with gingival tissues to achieve bio-sealing.6 The formation of bio-sealing of gingival with implants can prevent the bacterial from invasion that can avoid peri-implantitis occurrence.7
The surface characteristics of PEEK implants have long been the object of research aimed at elevating surface bio-performances that could excite cells responses as well as stimulate new bone formation.8 The most common method for improving the surface bio-performances of PEEK implants is surface modification (e.g., physical-chemical or biological methods), typically, surface coating.9 Various bioactive coatings (e.g., hydroxyapatite, biomolecules, drugs, etc.) on PEEK surface have been developed, which have shown to be effective in promoting new bone formation and osseointegration.9–11 Although great progress has been made by various surface modifications of PEEK implants, there are still many aspects which could be further upgraded. The surface features (such as morphology, micro or nano topography, hydrophilicity, roughness, functional groups and so on) of dental materials play key roles in facilitating osteoblasts responses (such as adhesion, proliferation and differentiation and so on).12 Topographic surface patterning is regarded as a powerful tool for controlling cells behaviours and functions.13 For topographic patterns, micron or nano topography determines whether specific cell reactions occur. Regulating scale and pattern in chemical as well as topographic patterning can help to remarkably create purpose-specific cells-regulating cues for different applications such as biomedical implants and tissue engineering, so on.14 The micro or nano topography exhibited special effects on cells responses (such as attachment, proliferation, and differentiation).15 The cell responses affected by differently sized surface patterns can provide key insights regarding pathological and biological as well as immunological processes.15
Femtosecond laser (FSL) irradiation is an effective technology to fabricate periodical features with micro or nano topography on biomaterials surfaces.16 This technology is suitable to fabricate micro or nano structures on various materials surfaces (including ceramics/glasses, metals and polymers).16 The advantages of FSL include the simplicity in varying processing conditions, rapid scanning speed, high accuracy and reproducibility, and minimal oxidation of material surface during processing.17 Importantly, minimizing polymer surface oxidation is very valuable in the surface treatment of polymeric biomaterials, such as PEEK.18 Consequently, in the present study, to optimize the surface bio-properties of PEEK for dental application, a strategy of surface modification by FSL with power of 80 mW (80FPK) and 160 mW (160FPK) was proposed to create submicro-nano structures on PEEK surface. The objective of this study was to construct submicro-nano structures on PEEK by FSL for exciting the responses of MC3T3-E1 cells and GE cells, which would induce regeneration of bone/gingival tissues for long-term stability of dental implants. Consequently, in comparison with PEEK, the surface performances (e.g., micro-nano morphology, hydrophilicity, surface energy, roughness and protein absorption) of FPK (both 80FPK and 160FPK) were investigated after FSL treatment. Moreover, the responses of MC3T3-E1 cells and human GE cells to FPK were evaluated in vitro.
Materials and Methods
Preparation of Specimens
The PEEK powders (450 G, Victrex, UK) were added into stainless-steel mold (Φ 10×2 mm) and then shaped by a compressing machine (YP-15T, Jinfulun Technology Co., Ltd, China) under the pressure of 6 MPa. The obtained PEEK specimens (Φ 10×2 mm) were sintered by applying a muffle furnace (345°C) for 4 hours. Afterwards, the surface of PEEK was treated by utilizing FSL instrument (GLX-200HP-1053, Time-Bandwidth Products AG, Switzerland) with various processing power of 80 mW (named 80FPK) and 160 mW (named 160FPK). Other process parameters of the FSL instrument: scanning speed was 800 μm/s, and pulse width was 120 fs. All the specimens (PEEK, 80FPK and 160FPK) were separately ultrasonic cleaned with deionized water and absolute ethanol for 3 times, and subsequent dried at 40°C for 24 hours.
Characterization of Specimens
The surface morphology as well as composition of the samples (PEEK, 80FPK and 160FPK) were characterized using scanning electron microscope (SEM; GeminiSEM 500, ZEISS Co., Germany), laser confocal microscope (VK-X 110, Keyence Co., Japan), atomic force microscope (AFM; DiMultiMode, Veeco Co., USA), Fourier transform infrared spectrometer (FTIR; Frontier, PerkinElmer Co., USA) by the KBr disc methods, X-ray diffraction (XRD; D8 Advance, Bruker Co., Germany) and X-ray photoelectron spectroscope (XPS; K-Alpha, Thermo Scientific Co., USA). The element composition of the samples (PEEK, 80FPK and 160FPK) was measured by utilizing energy dispersive spectrometry (GeminiSEM 500, ZEISS Co., Germany). The water and diiodomethane contact angle of the samples (PEEK, 80FPK and 160FPK) were determined by applying droplet shape analyzer (DSA100, KRUSS Co., Germany). The surface energy of the samples (PEEK, 80FPK and 160FPK) was determined by utilizing the attached software of droplet shape analyzer.
Protein Adsorption
Bicinchoninic acid (BCA) assay was performed to evaluate the adsorption of proteins on the specimens (PEEK, 80FPK and 160FPK).19 Briefly, bovine serum albumin (BSA, Sigma Co., USA) and fibronectin (FN, Sigma Co., USA) solutions were diluted by phosphate buffered saline (PBS, Gibco Co., USA) to obtain BSA (100 μg/mL) and FN (25 μg/mL) solutions, respectively. Then the specimens were placed into 12-well plate, and 2 mL of BSA and FN solutions was separately added onto the specimen surface at 37°C for 4 hours. Afterwards, the specimens were rinsed with fresh PBS to wash off the unabsorbed protein. Then the specimens were immersed in 2% sodium dodecyl sulphate in PBS and sonicated for 20 min to completely detach the BSA adsorbed from the surface of the specimens. The concentration of protein of supernatant was tested by BCA kit (Sigma Co., USA), and the protein adsorption was calculated by following formula:
Protein adsorption = Cs/Cp × 100%
Cs is the protein concentration of the supernatant while Cp is the protein concentration of BSA/FN solution.
Responses of MC3T3-E1 Cells to Specimens in vitro
The MC3T3-E1 cell lines were purchased from Procell Life Technology Co., Ltd., Wuhan, China. The responses of the cells to the specimens (PEEK, 80FPK and 160FPK) were determined. UV radiation and 75% ethanol were utilized to sterilize the specimens respectively, followed by placing specimens into 12-well plates. The cells were cultured with 5% CO2 at 37°C in α-minimum essential medium (α-MEM, Wisent Co., Canada) with 10% (v/v) fetal bovine serum (FBS, Wisent Co., Canada) and 1% (v/v) penicillin/streptomycin (Procell Life Science & Technology Co., China), while the medium was replaced every 3 days. The 0.25% trypsin EDTA (Sigma-Aldrich Co., USA) and centrifugation were utilized to collect cells before cells achieved 90% confluence. Before seeding on specimens, the cells were resuspended in fresh medium, and the MC3T3-E1 cells at 3–5 passages were carried out. The cells were seeded at an initial density of 2 × 10⁴ cells/mL in culture media.
Morphology of MC3T3-E1 Cells on Specimens
At different time after culturing, the medium was removed, and the specimens were rinsed by using PBS solution for 3 times and fixed with 2.5% glutaraldehyde (Leagene Biotechnology Co., China) for 2 hours. Moreover, glutaraldehyde solution was removed, and the specimens dehydrated by using ethanol (10, 20, 30, 50, 70, 85, 90 and 100%). The time applied for each alcohol concentration was 8 minutes, and time intervals between each alcohol concentration was 5 minutes. The final ethanol solution (100%) was replaced by isoamyl acetate, followed by supercritical drying. The morphology of MC3T3-E1 cells on the specimens at day 1 and 3 after culturing was observed by using a SEM.
Attachment and Proliferation of MC3T3-E1 Cells on Specimens
The attachment and proliferation of MC3T3-E1 cells on the specimens was investigated by utilizing methylthiazol tetrazolium test (MTT) at different time after culturing.20,21 After the specimens were placed into the plates, 0.1 mL of the MTT solution (0.5 mg/mL) was added into the plates, and the specimens were incubated at 37°C with 5% CO2 for 4 hours. After incubation, 500 μL dimethyl sulfoxide (Sigma-Aldrich Co., USA) was added into the plates to dissolve the purple formazan, and then mixed by pipetting the solution. Then, the solution was incubated for 10 minutes (at 37°C). The optical density (OD) values of MC3T3-E1 cells on specimens were determined at 570 nm by using automated plate reader (Varioskan LUX, Thermo Scientific Co., USA). Furthermore, the specimens were separately stained by utilizing fluorescein isothiocyanate (Abcam Co., UK) and 4ʹ,6ʹ-diamidino-2-phenylindole (Abcam Co., UK) for 40 minutes and 5 minutes, and the cell morphology of MC3T3-E1 cells on the specimens at 24 hours was observed by using confocal laser scanning microscope (CLSM; Nikon A1R, Nikon Co., Japan).
ALP Activity of MC3T3-E1 Cells on Specimens
The MC3T3-E1 cells were cultured on specimens (PEEK, 80FPK and 160FPK). At 7, 10, and 14 days after culturing, the medium was removed, and the specimens were cleaned by using PBS for 3 times. The cells on the specimens were lysed by 1% NP-40 for 1 hour, and then centrifuged for 10 minutes at 2000 rpm. Every sample was mixed with pNPP in ALP solution for 15 minutes, and the reaction was then arrested by addition of NaOH (5 mol/L). The OD values of MC3T3-E1 cells on specimens was tested at 405 nm using microplate reader (AMR-100, Allsheng Co., China), while the total protein amount was detected by protein quantitative kit (BCA assay, Abbkine Co., USA). ALP activity was defined as OD values per total protein amount.
Osteogenic Gene Expressions of MC3T3-E1 Cells on Specimens
Osteogenic genes expressions of MC3T3-E1 cells were quantified by utilizing real-time quantitative polymerase chain reaction, including mRNA expressions of alkaline phosphatase (ALP), runt-related transcription factor 2, Osteopontin (OPN) and Osteocalcin (OCN). The specimens were removed at 3, 7, and 14 days after culturing, the total RNA was extracted by utilizing Trizol reagent (Life Technologies Co., USA). According to manufacturer’s instructions, PrimeScript I Strand cDNA Synthesis kit (TaKaRa Co., Japan) was used to reverse the transcribe the obtained RNA into the complementary DNA (cDNA). These osteogenic genes expressions were measured by the quantitative real-time PCR (CFX96, Hercules Co., US). Glyceraldehyde 3-phosphate dehydrogenase (GAPDH) was selected as the housekeeping gene to normalize the results. Moreover, Primer sequences used are listed in Table 1.
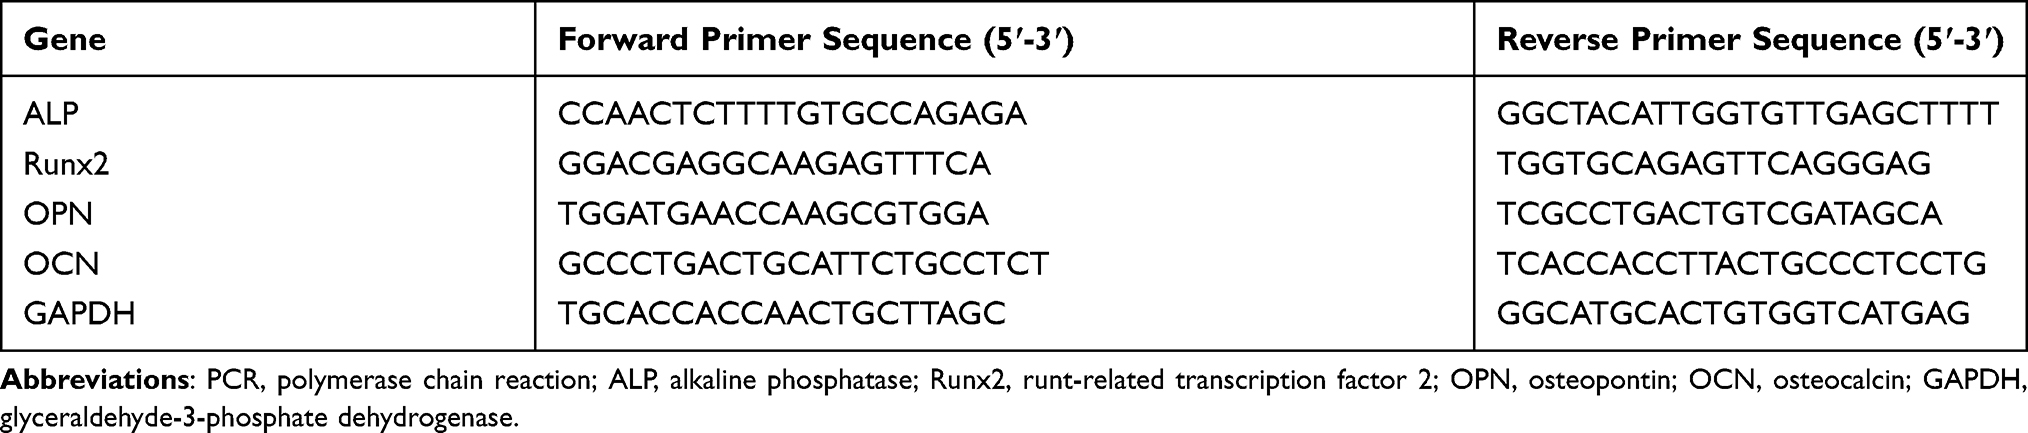 |
Table 1 Primer Sequences Used for the Quantitative Real-Time PCR |
Responses of GE Cells to Specimens in vitro
The GE cell lines were obtained from School of Medicine, Shanghai Jiaotong University, China. The use of the GE cell lines has been approved by the Human Ethics Committee of Shanghai Jiaotong University. The specimens were sterilized by 75% ethanol and UV radiation, and were subsequently placed into 12-well plate. The GE cells were cultured in Dulbecco’s modified eagle medium (Gibco Co., USA) with 10% (v/v) FBS and 1% (v/v) penicillin/streptomycin. The specimens were co-cultured with cells at 37°C with 5% CO2, while the medium was replaced every 3 days. Before cells reached 90% confluence, 0.25% trypsin EDTA (Gibco Co., USA) was used to collect cells. Before seeding on specimens, the cells were resuspended in fresh medium, and the GE cells at 2–4 passages were used.
Morphology and Adhesion of GE Cells on Specimens
The GE cells were cultured on specimens (PEEK, 80FPK, and 160FPK) at an initial density of 1 × 10⁴ cells/mL. After cultured for 6, 12, and 24 hours, the medium was removed, and the specimens were lightly washed by PBS for 3 times and fixed with 2.5% glutaraldehyde (Leagene Biotechnology Co., China) for 2 hours. After that, glutaraldehyde solution was removed, and the specimens were dehydrated in graded ethanol (10, 20, 30, 50, 70, 85, 90, and 100%). The time applied for each alcohol concentration was 8 minutes, and time intervals between each alcohol concentration was 5 minutes. The final ethanol solution (100%) was replaced by isoamyl acetate, followed by supercritical dried, and the cell morphology of GE cells was analyzed by SEM.
The adhesion of GE cells on specimens (PEEK, 80FPK, and 160FPK) was quantitative analyzed by MTT assay. After cultured for 6, 12, and 24 hours, 100 μL MTT solution (0.5 mg/mL) was added into the medium, which was removed after incubation for 4 hours at 37°C with 5% CO2. Subsequently, 500 μL dimethyl sulfoxide (Sinopharm Co., China) was added into medium to solubilize the formazan product. Moreover, 100 mL aliquot from each well was taken and transferred to fresh 96-well plate, and the OD value was tested at 570 nm by using microplate reader.
Proliferation of GE Cells on Specimens
The GE cells were cultured on specimens (PEEK, 80FPK, and 160FPK) for different time. After cultured for 1, 3, and 5 days, the medium was removed, and the specimens were lightly washed by using PBS for 3 times and fixed with 2.5% glutaraldehyde for 2 hours. Afterwards, the specimens were separately stained by using fluorescein isothiocyanate (Beyotime Biotech Co., China) and 4ʹ,6ʹ-diamidino-2-phenylindole (Beyotime Biotech Co., China) for 40 minutes and 5 minutes. The cell morphology of GE cells was observed using the CLSM (Nikon A1R, Nikon Co., Japan). Subsequently, the proliferation of GE cells was quantitative analyzed by MTT assay.
Statistical Analysis
All values were expressed as the means ± standard deviations (SD). Significant differences between two groups were measured by one-way analysis of variance (ANOVA) followed by Tukey’s test. p<0.5 and p<0.05 were considered statistically significant.
Results
Surface Morphology and Composition of Specimens
Figure 1 is the SEM images of surface morphologies of the specimens (PEEK, 80FPK, and 160FPK). The surface of PEEK was relatively flat and smooth under different magnification, as shown in Figure 1A, D, and G. However, after FSL treatment, 80FPK (Figure 1B and E) revealed rough surface with a few pores and many strip-shape bulges while 160FPK (Figure 1C and F) also exhibited rough surface with some pores and many grain-shape bulges. Under high magnification, 80FPK (Figure 1H) surface exhibited submicro structures of a few submicron pores (size of around 400 nm) and bulges (size of around 400 nm). In addition, 160FPK (Figure 1I) surface also revealed submicro structures of some submicron pores (size of around 400 nm) and bulges (size of around 400 nm). Moreover, for both 80FPK and 160FPK, many nanoparticles (around tens of nm) were found on the surface of the bulges (submicro structures). Therefore, both 80FPK and 160FPK surface exhibited submicro-nano structures.
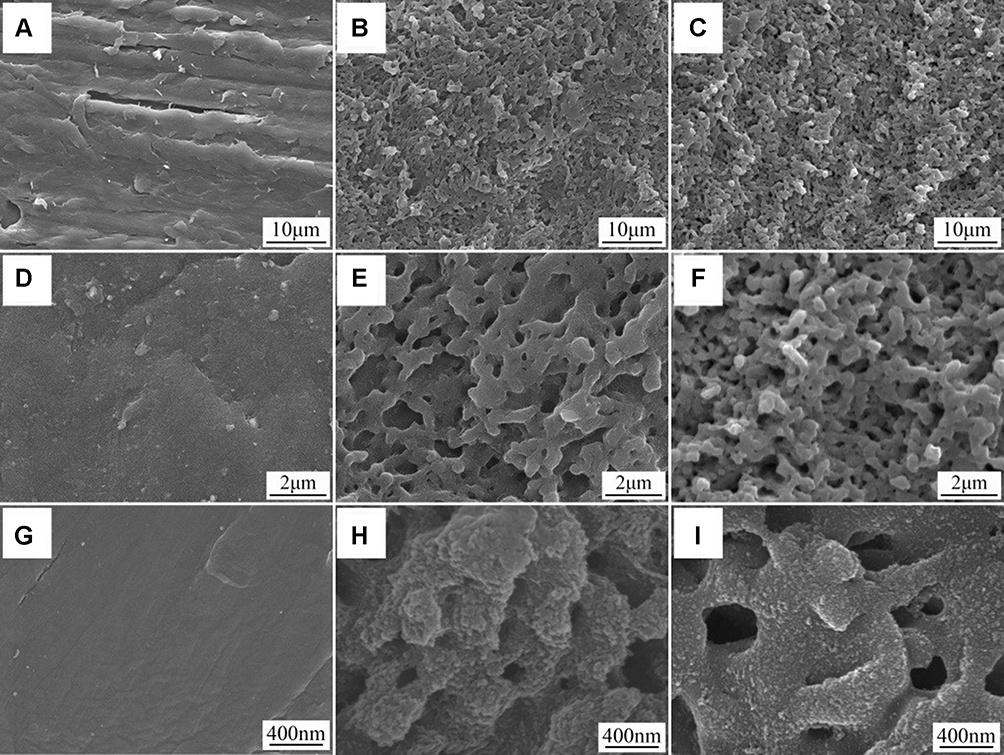 |
Figure 1 SEM images of surface morphologies of PEEK (A, D and G), 80FPK (B, E and H) and 160FPK (C, F and I) under different magnification. Abbreviations: SEM, scanning electron microscope; PEEK, polyetheretherketone; 80FPK, femtosecond laser treated polyetheretherketone with processing power of 80 mW; 160FPK, femtosecond laser treated polyetheretherketone with processing power of 160 mW. |
Figure 2A–C) displays the AFM images of surface morphologies of the specimens. The surface of both 80FPK and 160FPK was obviously rougher than PEEK, and the surface of 160FPK was slightly rougher than 80FPK. The roughness values Ra of PEEK (17.2 ± 6.6 nm), 80FPK (146.6 ± 7.7 nm) and 160FPK (151.7 ± 12.1 nm) were shown in Figure 2D.
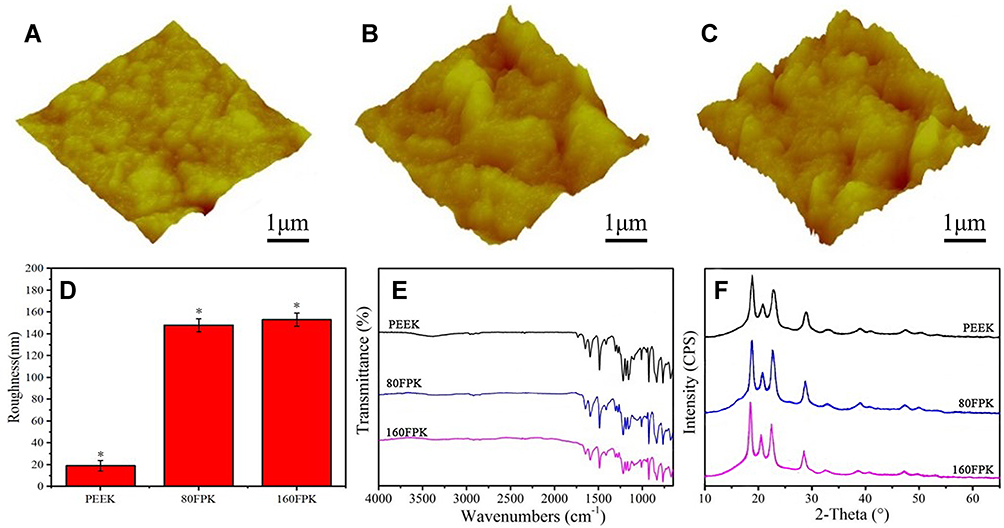 |
Figure 2 AFM images (A–C) and roughness (D) of PEEK (A), 80FPK (B) and 160FPK (C); FTIR (E) and XRD (F) of specimens (*p < 0.05, vs. PEEK). Abbreviations: AFM, atomic force microscope; PEEK, polyetheretherketone; 80FPK, femtosecond laser treated polyetheretherketone with processing power of 80 mW; 160FPK, femtosecond laser treated polyetheretherketone with processing power of 160 mW; FTIR, Fourier transform infrared spectrometer; XRD, X-ray diffraction. |
Figure 2E is the FTIR spectra of the specimens. For PEEK, the peaks appeared at 1646 cm−1 and 928 cm−1 were attributed to carbonyl stretching vibration, and the peak at 1591 cm−1 was originated from C=C in the benzene ring.22 After FSL treatment, the peak positions of 80FPK and 160FPK were almost same as PEEK. Figure 2F illustrates the XRD patterns of the specimens. Compared PEEK with 80FPK and 160FPK, it was found that the characteristic peaks positions of PEEK (2θ = 18.7°, 20.8°, 22.8°, and 28.8°) did not change after FSL treatment.22
The XPS spectra of PEEK (Figure 3A and B) and 160FPK (Figure 3C and D) are displayed in Figure 3. The wide-scan XPS spectra of PEEK (Figure 3A) and 160FPK (Figure 3C) show the signals of O and C elements were the major constituents, indicating the surface modifications did not change the element composition. The C1s core-level XPS spectrum of PEEK (Figure 3B) shows C element existed in the form of C-C=C, C-O-C, and C=O, which were attributed to the structure of PEEK. After FSL treatment, the peaks of C-C=C, C-O-C, and C=O decreased while the peak of simple substance carbon appeared on 160FPK surface (Figure 3D).
 |
Figure 3 Wide-scan XPS spectrum (A and C) and C1s core-level XPS spectrum (B and D) of PEEK (A and B) and 160FPK (C and D). Abbreviations: XPS, X-ray photoelectron spectroscope; PEEK, polyetheretherketone; 160FPK, femtosecond laser treated polyetheretherketone with processing power of 160 mW. |
Water Contact Angles, Surface Energy and Protein Adsorption
Figure 4A is water contact angles of the specimens. The water contact angles of PEEK, 80FPK, and 160FPK were 88.5 ± 1.9°, 45.4 ± 3.3° and 27.5 ± 2.8°. The results indicated that the hydrophilicity of both 80FPK and 160FPK obviously increased compared with PEEK, Moreover, the hydrophilicity of 160FPK slightly increased compared with 80FPK. Figure 4B is the surface energies of the specimens. The surface energies of PEEK, 80FPK, and 160FPK were 27.4 ± 1.4 mJ/m2, 59.4 ± 1.7mJ/m2 and 68.1 ± 1.9 mJ/m2.
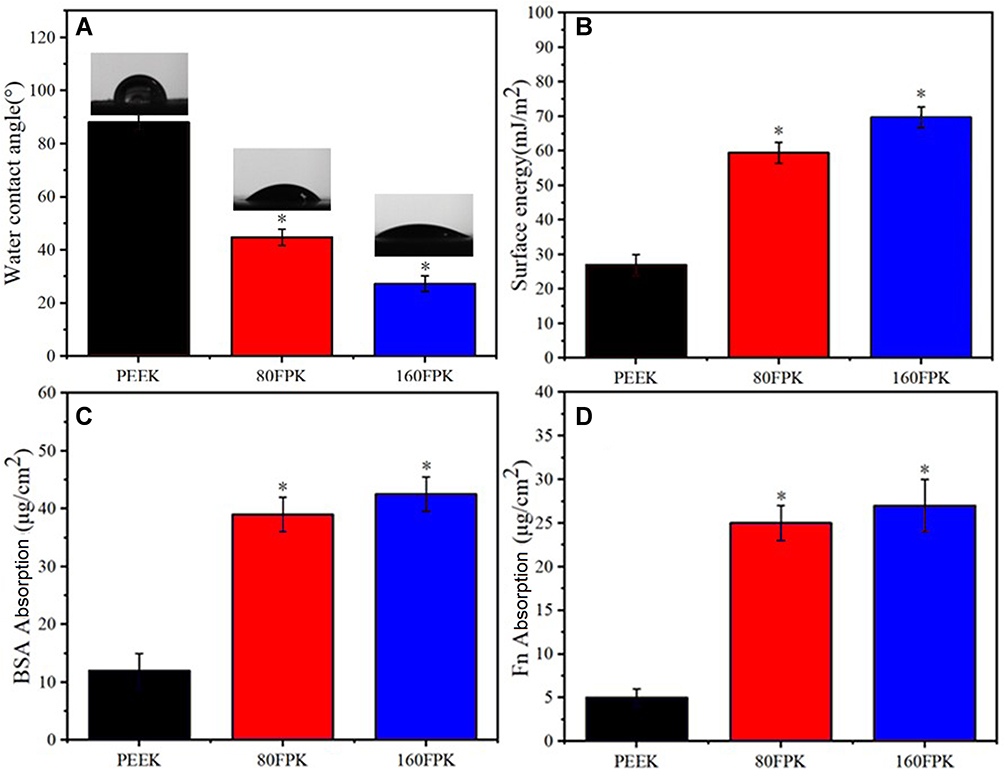 |
Figure 4 Water contact angles (A) and surface energies (B) of specimens, and adsorption of BSA (C) and Fn (D) on specimens (*p < 0.05, vs. PEEK). Abbreviations: BSA, bovine serum albumin; Fn, fibronectin; PEEK, polyetheretherketone. |
Figure 4C displays the adsorption of protein (BSA) on the specimens. The adsorption of BSA on PEEK, 80FPK and 160FPK were 12.3 ± 2.1 μg/cm2, 38.6 ± 2.4 μg/cm2, and 47.2 ± 2.3 μg/cm2. Figure 4D is the adsorption of protein (Fn) of the specimens. The adsorption of Fn on PEEK, 80FPK, and 160FPK were 5.0 ± 1.4 μg/cm2, 25.2 ± 2.6 μg/cm2, and 28.5 ± 3.6 μg/cm2.
Morphology and Adhesion of MC3T3-E1 Cells on Specimens
Figure 5A–C) reveals the CLSM images of cells on the specimens at 24 hours after culturing. Only several cells were seen on PEEK surface while more cells were found on both 80FPK and 160FPK surface. The number of cells on 160FPK were more than 80FPK, and more cells on 160FPK spread better than 80FPK.
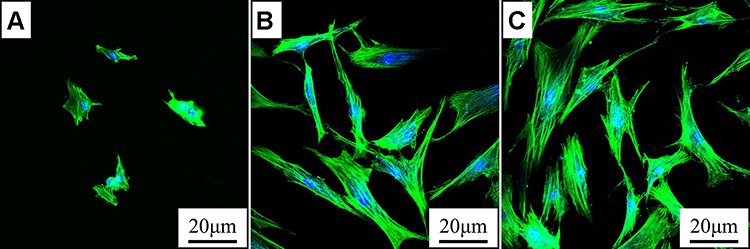 |
Figure 5 CLSM images of morphologies of MC3T3-E1 cells on PEEK (A), 80FPK (B) and 160FPK (C) at 24 hours after culturing. Abbreviations: CLSM, confocal laser scanning microscope; PEEK, polyetheretherketone; 80FPK, femtosecond laser treated polyetheretherketone with processing power of 80 mW; 160FPK, femtosecond laser treated polyetheretherketone with processing power of 160 mW. |
Figure 6A–F) illustrates the SEM micrographs of morphologies of MC3T3-E1 cells on the specimens at different time after culturing. The number of cells on PEEK, 80FPK and 160FPK increased with time. At day 1 and 3, the cells on PEEK were spherical morphology and the number of cells on PEEK were less than those of 80FPK and 160FPK. In addition, the adhesion and spreading of the cells on both 80FPK and 160FPK were better than PEEK. At day 3, more cells on 160FPK spread better than 80FPK.
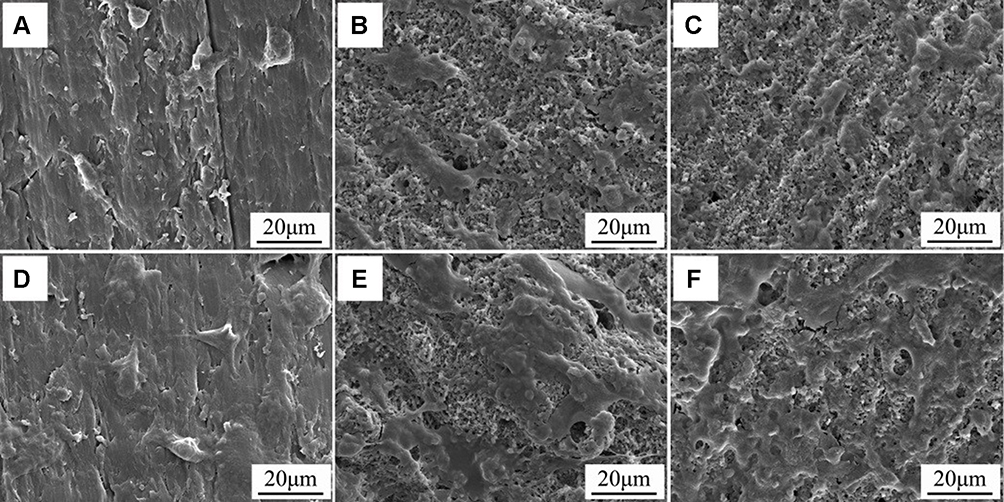 |
Figure 6 SEM micrographs of morphologies of MC3T3-E1 cells on PEEK (A and D), 80FPK (B and E) and 160FPK (C and F) at 1 (A–C) and 3 days (D–F) after culturing. Abbreviations: SEM, scanning electron microscope; PEEK, polyetheretherketone; 80FPK, femtosecond laser treated polyetheretherketone with processing power of 80 mW; 160FPK, femtosecond laser treated polyetheretherketone with processing power of 160 mW. |
Proliferation and ALP Activity of MC3T3-E1 Cells on Specimens
Figure 7A is attachment ratio of MC3T3-E1 cells on the specimens at 6, 12, and 24 hours. The attachment ratio of the cells on both 80FPK and 160FPK remarkably increased with time. At 6 and 12 hours, the attachment ratio of the cells on 80FPK and 160FPK was significantly higher than PEEK. Moreover, the attachment ratio of the cells on 160FPK was slightly higher than 80FPK.
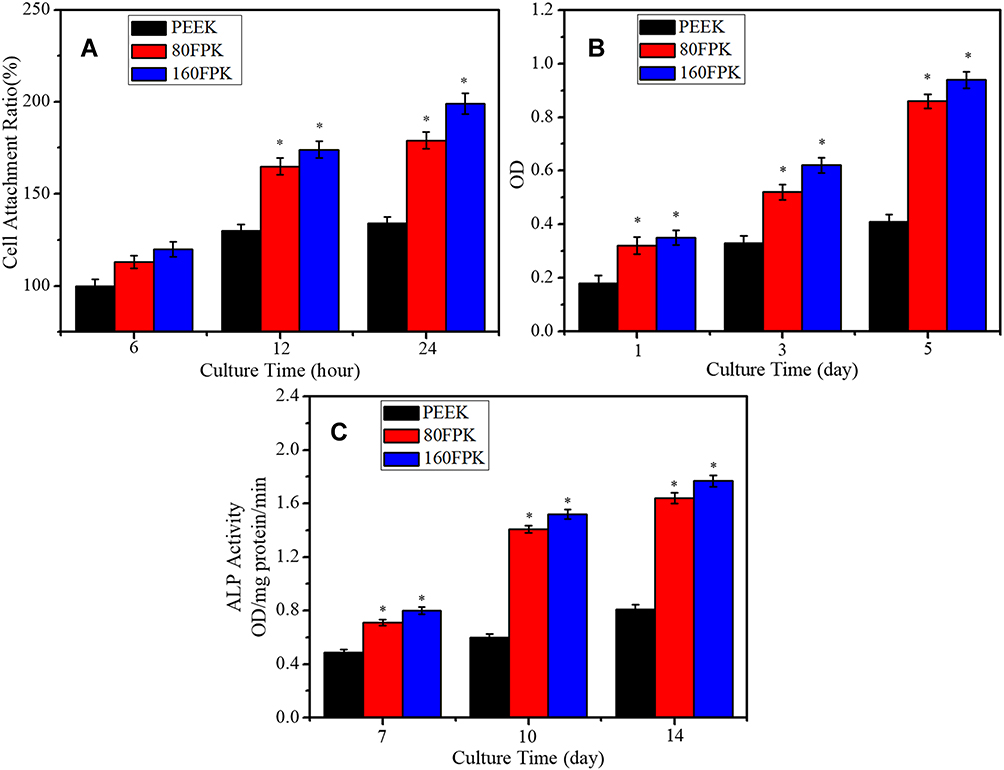 |
Figure 7 Attachment ratios (A), OD values (B) and ALP activities (C) of MC3T3-E1 cells on PEEK, 80FPK and 160FPK at different times after culturing (*p < 0.05, vs. PEEK). Abbreviations: OD, optical density; ALP, alkaline phosphatase; PEEK, polyetheretherketone; 80FPK, femtosecond laser treated polyetheretherketone with processing power of 80 mW; 160FPK, femtosecond laser treated polyetheretherketone with processing power of 160 mW. |
Figure 7B displays the OD values (for proliferation) of cells on the specimens at day 1, 3, and 5. The proliferation of cells on both 80FPK and 160FPK remarkably increased with culturing time. Additionally, at each time point, the proliferations of cells for 80FPK and 160FPK were obviously higher than PEEK. Moreover, the proliferation of cells for 160FPK was slightly higher than 80FPK.
Figure 7C is the ALP activities of cells on the specimens at day 7, 10, and 14 after culturing. The ALP activities of cells on both 80FPK and 160FPK significantly increased with time while no significant increase was seen for PEEK. Furthermore, the ALP activity for 80FPK and 160FPK was obviously higher than PEEK at every time point. Moreover, the ALP activity for 160FPK was slightly higher than 80FPK.
Expressions of Osteogenic Related Genes of MC3T3-E1 Cells on Specimens
The expressions of osteogenesis genes of ALP, runt-related transcription factor 2 (Runx2), OPN and OCN of the cells on the specimens were shown in Figure 8A–D). The genes expressions for both 80FPK and 160FPK increased with time but no significant increase for PEEK. At day 3, there were no remarkable difference in the expression of ALP, Runx2, OPN, and OCN for all specimens. At day 7 and 14, the expressions of these genes for both 160FPK and 80FPK were significantly higher than PEEK, and 160FPK were higher than 80FPK.
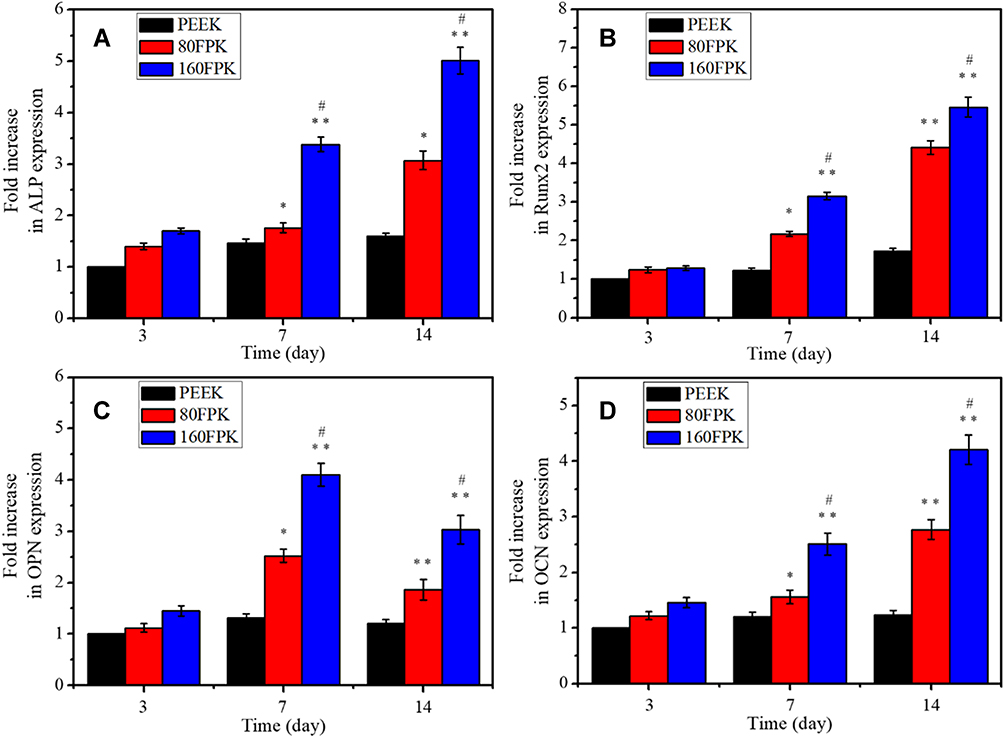 |
Figure 8 Expressions of osteogenic genes of ALP (A), Runx2 (B), OPN (C) and OCN (D) of MC3T3-E1 cells on the specimens at different time after culturing (*p < 0.05, **p < 0.01, vs. PEEK; #p < 0.05, 160FPK vs. 80FPK). Abbreviations: ALP, alkaline phosphatase; Runx2, runt-related transcription factor 2; OPN, osteopontin; OCN, osteocalcin; PEEK, polyetheretherketone; 80FPK, femtosecond laser treated polyetheretherketone with processing power of 80 mW; 160FPK, femtosecond laser treated polyetheretherketone with processing power of 160 mW. |
Morphology of GE Cells on Specimens
Figure 9A–F) reveals the CLSM images of GE cells on the specimens at 12 and 24 hours after culturing. The number of cells on both 160FPK than 80FPK obviously increased with culturing times. Moreover, more cells on both 160FPK and 80FPK attached better than PEEK. At 24 hours, the cells on 160FPK were more than 80FPK.
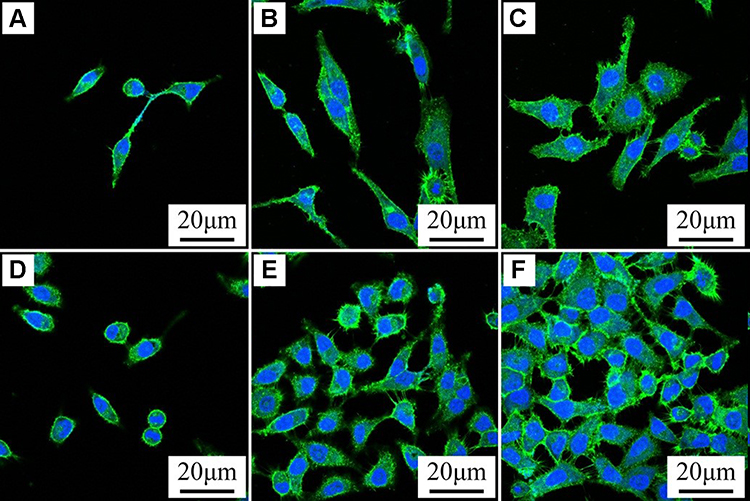 |
Figure 9 CLSM images of morphologies of GE cells on PEEK (A and D), 80FPK (B and E) and 160FPK (C and F) at 12 (A–C) and 24 (D–F) hours after culturing. Abbreviations: CLSM, confocal laser scanning microscope; GE, gingival epithelial; PEEK, polyetheretherketone; 80FPK, femtosecond laser treated polyetheretherketone with processing power of 80 mW; 160FPK, femtosecond laser treated polyetheretherketone with processing power of 160 mW. |
Figure 10A–F) is the SEM micrographs of morphologies of GE cells on the specimens at 3 days after culturing. The number of cells on PEEK was less than 80FPK and 160FPK. Under high magnification, the cells on PEEK were spherical morphology while the cells with irregular flat morphology on both 160FPK and 80FPK. Moreover, the cells on both 160FPK and 80FPK spread better than PEEK, and the pseudopods of cells on both 160FPK and 80FPK were more obvious than PEEK.
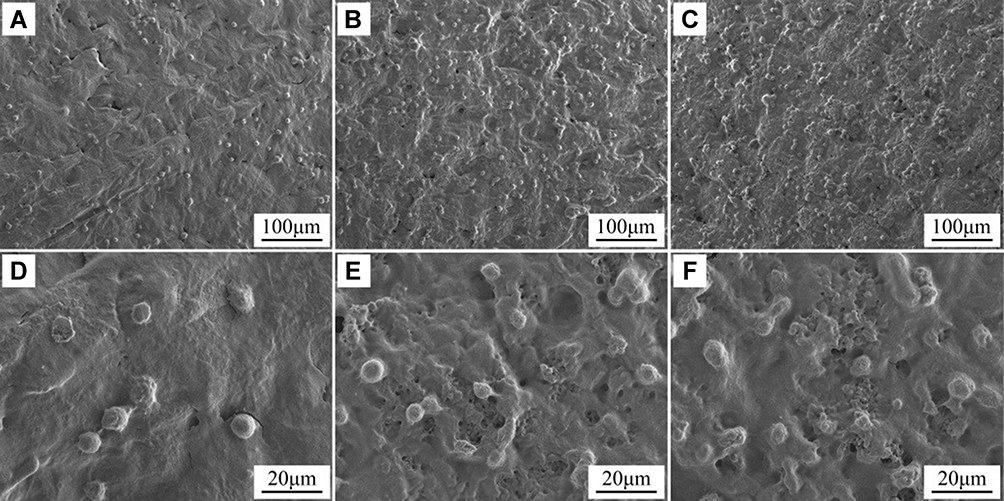 |
Figure 10 SEM micrographs of morphologies of GE cells on PEEK (A and D), 80FPK (B and E) and 160FPK (C and F) at 3 days (different magnification) after culturing. Abbreviations: SEM, scanning electron microscope; GE, gingival epithelial; PEEK, polyetheretherketone; 80FPK, femtosecond laser treated polyetheretherketone with processing power of 80 mW; 160FPK, femtosecond laser treated polyetheretherketone with processing power of 160 mW. |
Attachment and Proliferation of GE Cells on Specimens
Figure 11A shows the attachment ratio of GE cells on the specimens at 6, 12, and 24 hours. The attachment ratio of cells on 80FPK and 160FPK remarkably increased with time. Additionally, at each time point, the attachment ratio of cells on 80FPK and 160FPK was remarkably higher than PEEK. Moreover, the attachment ratio of cells on 160FPK was slightly higher than 80FPK.
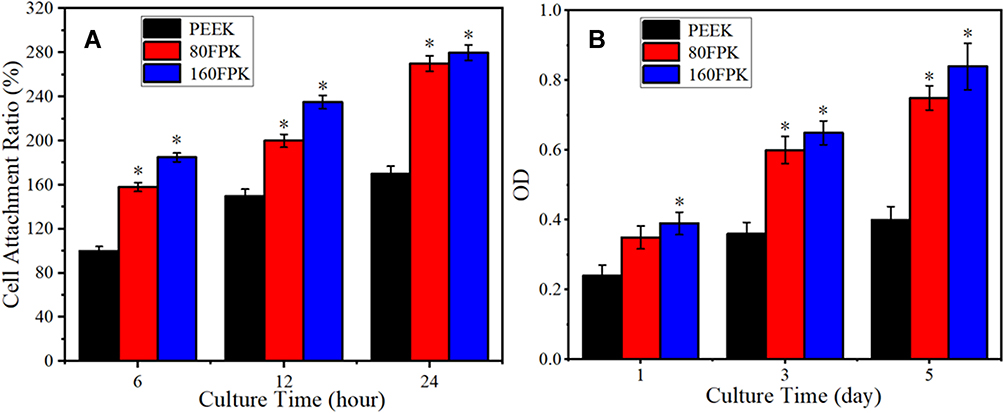 |
Figure 11 Attachment ratios (A) and OD values (B) of GE cells on PEEK, 80FPK and 160FPK at different time after culturing (*p < 0.05, vs. PEEK). Abbreviations: OD, optical density; GE, gingival epithelial; PEEK, polyetheretherketone; 80FPK, femtosecond laser treated polyetheretherketone with processing power of 80 mW; 160FPK, femtosecond laser treated polyetheretherketone with processing power of 160 mW. |
Figure 11B displays the OD value (for proliferation) of GE cells on the specimens at day 1, 3, and 5. The proliferation of cells on both 80FPK and 160FPK obviously increased with culturing time. Additionally, at day 3 and 5, the proliferation of cells on 80FPK and 160FPK was significantly higher than PEEK. Moreover, the proliferation of cells on 160FPK was slightly higher than 80FPK.
Discussions
Because of high mechanical strength and admirable biocompatibility, PEEK has become commonly implantable material, and extensively used as biomedical implants for bone substitutes. However, PEEK is bioinert material that does not excite cells responses and promote new regeneration, exhibiting no bioactivity.23,24 Surface features (e.g., micro-nano morphology, roughness, hydrophilicity and composition) have remarkable effects on the biological performances of dental materials.25 Therefore, in this study, a strategy of surface modification by FSL with power of 80 mW (80FPK) and 160 mW (160FPK) was proposed to fabricate submicro-nano structures on PEEK surface. After FSL treatment, compared to PEEK with smooth surface, 80FPK surface revealed submicro-nano structures of submicron pores (~ 400 nm) and bulges (~ 400 nm), and 160FPK surface also showed submicro-nano structures of submicron pores (~ 400 nm) and grain-shape bulges (~ 400 nm). Moreover, for both 80FPK and 160FPK, there were many nanoparticles (around tens of nm) on the surface of bulges. As a result, after FSL treatment, both 80FPK and 160FPK with rough surface exhibited submicro-nano structures.
Surface roughness of dental implants is one of the vital factors that affects the cells functions and behaviors.26 In this study, in comparison with PEEK (17.2 nm), the surface roughness of both 80FPK (146.6 nm) and 160FPK (151.7 nm) significantly increased due to the formation of submicro-nano structures on their surface after FSL treatment. Compared with 80FPK, the surface roughness of 160FPK further increased by the FSL treatment with higher power. Generally, rough surface of dental implants facilitates cell attachment because the rough surface has a higher surface area, which might provide more binding sites for absorption of proteins that is an essential for cell attachment.27 Hydrophilic surface of dental implants facilitates the early blood contact, protein absorption, cell attachment, proliferation and differentiation as well as bone regeneration.28 In this study, compared to PEEK with hydrophobic surface, both 80FPK and 160FPK surface with submicro-nano structures and simple substance carbon showed hydrophilic surface after FSL treatment. Moreover, in comparison with 80FPK, the hydrophilicity of 160FPK surface further increased by the FSL treatment with higher power. The improvement of surface hydrophilicity makes the surface more favorable for protein adsorption that promotes cell attachment and growth.29 As a result, compared to PEEK with hydrophobic surface, both 80FPK and 160FPK with hydrophilic surface might be better for cell attachment and growth.
Biomaterials with high surface energy can improve the absorption of proteins in biological environment, and the adsorbed proteins further attract surrounding cells, and thus excite new bone regeneration.30 In this study, the surface energy of 80FPK (68.0 mJ/m2) and 160FPK (71.3 mJ/m2) obviously increased in comparison with PEEK (29.08 mJ/m2). Furthermore, compared with 80FPK, the surface energy for 160FPK further increased by the FSL treatment with higher power. Compared with PEEK, the improvements of hydrophilicity and surface energy for both 80FPK and 160FPK might be attribute to the presence of simple substance carbon (with high hydrophilicity and surface energy) on their surface after FSL treatment according to the C1s core-level XPS spectrum. The rough and hydrophilic surface with high surface energy of biomaterials could adsorb more anchoring proteins, which might cause a favorable micro-environment for cells responses.31 These adsorbed proteins would serve as ligands to bind to cell membrane protein receptors causing cell adhesion on biomaterials.32 Fibronectin (Fn) can specially bind to protein receptors (integrins) on cell membranes, which plays a key role in the early cell adhesion on biomaterials.33 In this study, in comparison with PEEK (BSA: 6.4 μg/cm2, Fn: 5.1 μg/cm2), the adsorption of proteins (BSA and Fn) on both 80FPK (BSA: 37.2 μg/cm2, Fn: 23.4 μg/cm2) and 160FPK (BSA: 56.8 μg/cm2, Fn: 32.5 μg/cm2) surface significantly increased due to the presence of submicro-nano structures after FSL treatment. In comparison with 80FPK, the adsorption of proteins on 160FPK further increased by the FSL treatment with higher power.
The surface performances (e.g., micro-nano morphology, composition, roughness and hydrophilicity) of dental implants have remarkable effects on the behaviors and functions of the cells.34 Efficient cell adhesion onto the implant surface is essential for the subsequent proliferation and differentiation.35 In the present study, compared with PEEK, the adhesion of MC3T3-E1 cells on both 80FPK and 160FPK obviously increased. Moreover, compared with 80FPK, 160FPK further enhanced cell adhesion. The favorable early cell adhesion on implant surface have great potential for further promoting spreading, migration, proliferation as well as differentiation, which are the vital factors for new bone formation.36 In the present study, the proliferation of MC3T3-E1 cells on both 80FPK and 160FPK were obviously higher than PEEK. Moreover, as compared with 80FPK, 160FPK further enhanced cell proliferation. The attachment and proliferation of cells intensively pertain to the surface features of the implantable materials.37 Evidently, compared with PEEK, the significant improvements of cell adhesion and proliferation on both 80FPK and 160FPK were attributed to the presence of submicro-nano structures after FSL treatment, which obviously improved the surface performances (such as roughness, hydrophilicity, surface energy and adsorption of proteins). Moreover, compared with 80FPK, the further enhancements of cell adhesion and proliferation on 160FPK were ascribed to the elevated surface performances by FSL treatment with higher power.
As an osteogenic marker, ALP is often expressed in osteoblasts.38 Among the major osteogenic marks, the improvement of ALP activity is a vital event occurring during the early period of new bone formation.39 In the study, both 80FPK and 160FPK revealed higher ALP activity of MC3T3-E1 cells than PEEK. Moreover, in comparison with 80FPK, 160FPK further enhanced the ALP activity. Evidently, the submicro-nano structured surface of both 80FPK and 160FPK improved the ALP activity of the cells. The expressions of mRNA (e.g., ALP, Runx2, OPN and OCN) by osteoblasts are the important osteogenic related genes, which are generally used to determine the osteogenic differentiation of MC3T3-E1 cells on the specimens.40 In this study, the expressions of 4 kinds of genes for both 80FPK and 160FPK were remarkable higher than PEEK. Furthermore, the expressions of 4 kinds of genes for 160FPK were significantly higher than 80FPK. Therefore, compared with PEEK, the obvious improvements of osteogenic differentiation of MC3T3-E1 cells on both 80FPK and 160FPK were ascribed to the presence of submicro-nano structured surface after FSL treatment, which improved the surface performances. Moreover, compared with 80FPK, the further enhancements of cell differentiation on 160FPK were attributed to the elevated surface performances by FSL treatment with higher power.
Except for osseointegration, the dental implants should be integrated with gingival tissue to obtain bio-sealing for preventing bacterial from invasion, thereby avoid peri-implantitis occur.17,18 Consequently, in the present study, the responses of GE cells to the specimens were evaluated in vitro. For the adhesion of GE cells on the specimens, both 80FPK and 160FPK were obviously higher than PEEK. Moreover, 160FPK further enhanced cell adhesion as compared with 80FPK. For the cell proliferation on the specimens, both 80FPK and 160FPK were significantly higher than PEEK. Furthermore, 160FPK further enhanced cell proliferation as compared with 80FPK. Perceptibly, compared with PEEK, the obvious improvements of adhesion and proliferation of GE cells on both 80FPK and 160FPK were attributed to the presence of submicro-nano structured surface after FSL treatment, which improved the surface performances. Moreover, compared with 80FPK, the further enhancements of adhesion and proliferation of GE cells on 160FPK were ascribed to the elevated surface performances by FSL treatment with higher power.
Surface features (e.g., micro-nano morphology and composition) of the dental implants, significantly influence the behaviors and functions of osteoblasts as well as new bone formation.41 Study have shown that a rougher surface with high hydrophilicity as well as surface energy commonly promoted fibrin clot attachment, protein absorption, and cell attachment, proliferation as well as osteogenic differentiation, and thereby enhancing the new bone formation.42 In this study, compared with PEEK, both 80FPK and 160FPK with submicro-nano structured surface significantly induced not only the responses (adherence, growth, proliferation and osteogenic differentiation) of MC3T3-E1 cells but also the responses (adherence and proliferation) of GE cells due to the elevated surface performances (e.g., roughness and hydrophilicity). Moreover, compared with 80FPK, 160FPK further enhanced the responses of MC3T3-E1 cells/GE cells because of the elevated surface performances by PSL treatment with higher powder. In short, the FSL treatment created submicro-nano structured surface on PEEK with elevated surface performances, which played pivotal roles in exciting the responses of MC3T3-E1 cells/GE cells in vitro. As a result, 160FPK with submicro-nano structured surface exhibited optimized surface performances and excellent cytocompatibility, which could be a promising candidate as a dental implant for oral applications.
Conclusions
In the present study, to improve the surface biological performances of PEEK, and thereby stimulating cells responses, submicro-nano structures on PEEK surface were fabricated by FSL with power of 80 mW (80FPK) and 160 Mw (160FPK). In comparison with PEEK, both 80FPK and 160FPK with submicro-nano structures significantly improved surface performances (e.g., hydrophilicity, surface energy and roughness). Moreover, compared to 80FPK, the surface performances of 160FPK further enhanced by FSL treatment with higher power. For cell responses to the specimens, in comparison with PEEK, both 80FPK and 160FPK significantly excited adhesion, proliferation and osteogenic differentiation of MC3T3-E1 cells, and remarkably stimulated adhesion and proliferation of GE cells in vitro. Furthermore, 160FPK further excited the responses of MC3T3-E1 cells/GE cells compared to 80FPK. In short, FSL constructed submicro-nano structures on PEEK surface with elevated surface performances, which played pivotal roles in significantly exciting cell responses. Consequently, 160FPK with submicro-nano structures exhibited outstanding surface performances and excellent cytocompatibility, which might have immense potential for dental application.
Acknowledgments
The grants were from Science and Technology Innovation Action Plan of the Science and Technology Commission of Shanghai Municipality (17441900600 and 201409003200), the Pyramid Talent Project of Shanghai Changzheng Hospital in 2020 and the National Natural Science Foundation of China (81771990).
Disclosure
The authors report no conflicts of interest in this work.
References
1. Kurtz SM, Devine JN. PEEK biomaterials in trauma, orthopedic, and spinal implants. Biomaterials. 2007;28(32):4845–4869. doi:10.1016/j.biomaterials.2007.07.013
2. Torstrick FB, Lin ASP, Potter D, et al. Porous PEEK improves the bone-implant interface compared to plasma-sprayed titanium coating on PEEK. Biomaterials. 2018;185:106–116. doi:10.1016/j.biomaterials.2018.09.009
3. Tian Y, Ding SY, Peng H, et al. Osteoblast growth behavior on porous-structure titanium surface. Appl Surf Sci. 2012;261:25–30. doi:10.1016/j.apsusc.2012.07.035
4. Wang CY, Wang SN, Yang YY, et al. Bioinspired, biocompatible and peptide-decorated silk fibroin coatings for enhanced osteogenesis of bioinert implant. J Biomater Sci Polymer Edition. 2018;29:1595–1611. doi:10.1080/09205063.2018.1477316
5. Jung HD, Jang TS, Lee JE, Park SJ, Son Y, Park SH. Enhanced bioactivity of titanium-coated polyetheretherketone implants created by a high-temperature 3D printing process. Biofabrication. 2019;11:045014. doi:10.1088/1758-5090/ab376b
6. Jeon C, Oh KC, Park KH, Moon HS. Effects of ultraviolet treatment and alendronate immersion on osteoblast-like cells and human gingival fibroblasts cultured on titanium surfaces. Sci Rep. 2019;9:2581. doi:10.1038/s41598-019-39355-3
7. Rupp F, Liang L, Geis-Gerstorfer J, Scheideler L, Huttig F. Surface characteristics of dental implants: a review. Dental Materials. 2018;34(1):40–57. doi:10.1016/j.dental.2017.09.007
8. Knaus J, Schaffarczyk D, Colfen H. On the Future Design of Bio-Inspired Polyetheretherketone Dental Implants. Macromol Biosci. 2019;20:1900239. doi:10.1002/mabi.201900239
9. Mahjoubi H, Buck E, Manimunda P, et al. Surface phosphonation enhances hydroxyapatite coating adhesion on polyetheretherketone and its osseointegration potential. Acta Biomaterialia. 2017;47:149–158. doi:10.1016/j.actbio.2016.10.004
10. Raina DB, Larsson D, Sezgin EA, Isaksson H, Tagil M, Lidgren L. Biomodulation of an implant for enhanced bone-implant anchorage. Acta Biomaterialia. 2019;96:619–630. doi:10.1016/j.actbio
11. Xu X, Li YL, Wang LX, et al. Triple-functional polyetheretherketone surface with enhanced bacteriostasis and anti-inflammatory and osseointegrative properties for implant application. Biomaterials. 2019;212:98–114. doi:10.1016/j.biomaterials.2019.05.014
12. Santoro F, Zhao WT, Joubert LM, et al. Revealing the Cell-Material Interface with Nanometer Resolution by Focused Ion Beam/Scanning Electron Microscopy. ACS Nano. 2017;11:8320–8328. doi:10.1021/acsnano.7b03494
13. Lim JY, Donahue HJ. Cell sensing and response to micro- and nanostructured surfaces produced by chemical and topographic patterning. Tissue Eng. 2007;13(8):1879–1891. doi:10.1089/ten.2006.0154
14. Patelli A, Mussano F, Brun P, et al. Nanoroughness, Surface Chemistry, and Drug Delivery Control by Atmospheric Plasma Jet on Implantable Devices. ACS Appl Mater Interfaces. 2018;10:39512–39523. doi:10.1021/acsami.8b15886
15. Cheng QW, Yuan B, Chen XN, et al. Regulation of surface micro/nano structure and composition of polyetheretherketone and their influence on the behavior of MC3T3-E1 pre-osteoblasts. J Mater Chem B. 2019;7(37):5713–5724. doi:10.1039/c9tb00943d
16. Gittens RA, McLachlan T, Olivares-Navarrete R, et al. The effects of combined micron-/submicron-scale surface roughness and nanoscale features on cell proliferation and differentiation. Biomaterials. 2011;32(13):3395–3403. doi:10.1016/j.biomaterials.2011.01.029
17. Lee BEJ, Exir H, Weck A, Grandfield K. Characterization and evaluation of femtosecond laser-induced sub-micron periodic structures generated on titanium to improve osseointegration of implants. Appl Surf Sci. 2018;441:1034–1042. doi:10.1016/j.apsusc.2018.02.119
18. Chen P, Aso T, Sasaki R, et al. Adhesion and differentiation behaviors of mesenchymal stem cells on titanium with micrometer and nanometer-scale grid patterns produced by femtosecond laser irradiation. J Biomed Mater Res A. 2018;106(10):2735–2743. doi:10.1002/jbm.a.36503
19. Hasan A, Saxena V, Pandey LM. Surface Functionalization of Ti6Al4V via Self-assembled Monolayers for Improved Protein Adsorption and Fibroblast Adhesion. Langmuir. 2018;34(11):3494–3506. doi:10.1021/acs.langmuir.7b03152
20. Moon BS, Kim S, Kim HE, Jang TS. Hierarchical micro-nano structured Ti6Al4V surface topography via two-step etching process for enhanced hydrophilicity and osteoblastic responses. Mater Sci Eng C. 2017;73:90–98. doi:10.1016/j.msec.2016.12.064
21. Lee J, Kim G. Three-Dimensional Hierarchical Nanofibrous Collagen Scaffold Fabricated Using Fibrillated Collagen and Pluronic F-127 for Regenerating Bone Tissue. ACS Appl Mater Interfaces. 2018;10(42):35801–35811. doi:10.1021/acsami.8b14088
22. Yuan B, Cheng QW, Zhao R, et al. Comparison of osteointegration property between PEKK and PEEK: effects of surface structure and chemistry. Biomaterials. 2018;170:116–126. doi:10.1016/j.biomaterials.2018.04.014
23. Lee JH, Jang HL, Lee KM, et al. In vitro and in vivo evaluation of the bioactivity of hydroxyapatite-coated polyetheretherketone biocomposites created by cold spray technology. Acta Biomaterialia. 2013;9(4):6177–6187. doi:10.1016/j.actbio.2012.11.030
24. Wu XM, Liu XC, Wei J, Ma J, Deng F, Wei SC. Nano-TiO2/PEEK bioactive composite as a bone substitute material: in vitro and in vivo studies. Int J Nanomedicine. 2012;7:1215–1225. doi:10.2147/IJN.S28101
25. Velasco-Ortega E, Alfonso-Rodriguez CA, Monsalve-Guil L, et al. Relevant aspects in the surface properties in titanium dental implants for the cellular viability. Mater Sci Eng C. 2016;64:1–10. doi:10.1016/j.msec.2016.03.049
26. Andrukhov O, Huber R, Shi B, et al. Proliferation, behavior, and differentiation of osteoblasts on surfaces of different microroughness. Dental Materials. 2016;32:1374–1384. doi:10.1016/j.dental
27. Qiu JJ, Guo JS, Geng H, Qian WH, Liu XY. Three-dimensional porous graphene nanosheets synthesized on the titanium surface for osteogenic differentiation of rat bone mesenchymal stem cells. Carbon. 2017;125:227–235. doi:10.1016/j.carbon.2017.09.064
28. Hotchkiss KM, Reddy GB, Hyzy SL, Schwartz Z, Boyan BD, Olivares-Navarrete R. Titanium surface characteristics, including topography and wettability, alter macrophage activation. Acta Biomaterialia. 2016;31:425–434. doi:10.1016/j.actbio.2015.12.003
29. Chappuis V, Maestre L, Burki A, et al. Osseointegration of ultrafine-grained titanium with a hydrophilic nano-patterned surface: an in vivo examination in miniature pigs. Biomater Sci. 2018;6:2448–2459. doi:10.1039/c8bm00671g
30. Staehlke S, Lehnfeld J, Schneider A, Nebe JB, Muller R. Terminal chemical functions of polyamidoamine dendrimer surfaces and its impact on bone cell growth. Mater Sci Eng C. 2019;101:190–203. doi:10.1016/j.msec.2019.03.073
31. Huang R, Zhang L, Huang L, Zhu JX. Enhanced in-vitro osteoblastic functions on beta-type titanium alloy using surface mechanical attrition treatment. Mater Sci Eng C. 2019;97:688–697. doi:10.1016/j.msec.2018.12.082
32. Fang RH, Jiang Y, Fang JC, Zhang LF. Cell membrane-derived nanomaterials for biomedical applications. Biomaterials. 2017;128:69–83. doi:10.1016/j.biomaterials.2017.02.041
33. Zollinger AJ, Smith ML. Fibronectin, the extracellular glue. Matrix Biology. 2017;60–61:27–37. doi:10.1016/j.matbio.2016.07.011
34. Yuan Z, Liu P, Liang YN, et al. Investigation of osteogenic responses of Fe-incorporated micro/nano-hierarchical structures on titanium surfaces. J Mater Chem B. 2018;6(9):1359–1372. doi:10.1039/c7tb03071a
35. Hunter A, Archer CW, Walker PS, Blunn GW. Attachment and proliferation of osteoblasts and fibroblasts on biomaterials for orthopaedic use. Biomaterials. 1995;16(4):287–295. doi:10.1016/0142-9612(95)93256-D
36. Murphy CM, Haugh MG, O’Brien FJ. The effect of mean pore size on cell attachment, proliferation and migration in collagen-glycosaminoglycan scaffolds for bone tissue engineering. Biomaterials. 2010;31:461–466. doi:10.1016/j.biomaterials.2009.09.063
37. Bagherifard S, Hickey DJ, de Luca AC, et al. The influence of nanostructured features on bacterial adhesion and bone cell functions on severely shot peened 316L stainless steel. Biomaterials. 2015;73:185–197. doi:10.1016/j.biomaterials.2015.09.019
38. Rawadi G, Vayssiere B, Dunn F, Baron R, Roman-Roman S. BMP-2 controls alkaline phosphatase expression and osteoblast mineralization by a Wnt autocrine loop. J Bone Mineral Res. 2003;18(10):1842–1853. doi:10.1359/jbmr.2003.18.10.1842
39. Wang HN, Li YB, Zuo Y, Li JH, Ma SS, Cheng L. Biocompatibility and osteogenesis of biomimetic nano-hydroxyapatite/polyamide composite scaffolds for bone tissue engineering. Biomaterials. 2007;28(22):3338–3348. doi:10.1016/j.biomaterials.2007.04.014
40. Fu C, Bai HT, Hu Q, Gao TL, Bai YS. Enhanced proliferation and osteogenic differentiation of MC3T3-E1 pre-osteoblasts on graphene oxide-impregnated PLGA-gelatin nanocomposite fibrous membranes. RSC Adv. 2017;7:8886–8897. doi:10.1039/c6ra26020a
41. LaPointe VLS, Fernandes AT, Bell NC, Stellacci F, Stevens MM. Nanoscale Topography and Chemistry Affect Embryonic Stem Cell Self-Renewal and Early Differentiation. Adv Healthcare Mater. 2013;2:1644–1650. doi:10.1002/adhm.201200382
42. Kumar G, Waters MS, Farooque TM, Young MF, Simon CG. Freeform fabricated scaffolds with roughened struts that enhance both stem cell proliferation and differentiation by controlling cell shape. Biomaterials. 2012;33(16):4022–4030. doi:10.1016/j.biomaterials.2012.02.048
 © 2021 The Author(s). This work is published and licensed by Dove Medical Press Limited. The full terms of this license are available at https://www.dovepress.com/terms.php and incorporate the Creative Commons Attribution - Non Commercial (unported, v3.0) License.
By accessing the work you hereby accept the Terms. Non-commercial uses of the work are permitted without any further permission from Dove Medical Press Limited, provided the work is properly attributed. For permission for commercial use of this work, please see paragraphs 4.2 and 5 of our Terms.
© 2021 The Author(s). This work is published and licensed by Dove Medical Press Limited. The full terms of this license are available at https://www.dovepress.com/terms.php and incorporate the Creative Commons Attribution - Non Commercial (unported, v3.0) License.
By accessing the work you hereby accept the Terms. Non-commercial uses of the work are permitted without any further permission from Dove Medical Press Limited, provided the work is properly attributed. For permission for commercial use of this work, please see paragraphs 4.2 and 5 of our Terms.