")
Back to Journals » International Journal of Nanomedicine » Volume 11
Fabrication of novel vesicles of triptolide for antirheumatoid activity with reduced toxicity in vitro and in vivo
Authors Zhang L, Wang T, Li Q, Huang J, Xu H, Li J, Wang Y, Liang Q
Received 19 January 2016
Accepted for publication 21 March 2016
Published 8 June 2016 Volume 2016:11 Pages 2663—2673
DOI https://doi.org/10.2147/IJN.S104593
Checked for plagiarism Yes
Review by Single anonymous peer review
Peer reviewer comments 2
Editor who approved publication: Professor Lei Yang
Li Zhang,1,2 Tengteng Wang,1,2 Qiang Li,1,2 Jing Huang,3 Hao Xu,1,2 Jinlong Li,1,2 Yongjun Wang,1,2 Qianqian Liang1,2
1Department of Orthopaedics, Longhua Hospital, 2Institute of Spine, Shanghai University of Traditional Chinese Medicine, 3Biochemistry and Molecular Biology, School of Life Science, East China Normal University, Shanghai, People’s Republic of China
Abstract: Triptolide (TP) displays a strong immunosuppression function in immune-mediated diseases, especially in the treatment of rheumatoid arthritis. However, in addition to its medical and health-related functions, TP also exhibits diverse pharmacological side effects, for instance, liver and kidney toxicity and myelosuppression. In order to reduce the side effects, a nano drug carrier system (γ-PGA-l-PAE-TP [PPT]), in which TP was loaded by a poly-γ-glutamic acid-grafted l-phenylalanine ethylester copolymer, was developed. PPT was characterized by photon scattering correlation spectroscopy and transmission electron microscopy, which demonstrated that the average diameter of the drug carrier system is 98±15 nm, the polydispersity index is 0.18, the zeta potential is –35 mV, and the TP encapsulation efficiency is 48.6% with a controlled release manner. The methylthiazolyldiphenyl-tetrazolium bromide assay and flow cytometry revealed that PPT could decrease toxicity and apoptosis induced by free TP on RAW264.7 cells, respectively. The detection of reactive oxygen species showed that PPT could decrease the cellular reactive oxygen species induced by TP. Compared with the free TP-treated group, PPT improved the survival rate of the mice (P<0.01) and had no side effects or toxic effects on the thymus index (P>0.05) and spleen index (P>0.05). The blood biochemical indexes revealed that PPT did not cause much damage to the kidney (blood urea nitrogen and creatinine), liver (serum alanine aminotransferase and aspartate aminotransferase), or blood cells (P>0.05). Meanwhile, hematoxylin and eosin staining and terminal-deoxynucleotidyl transferase dUTP nick-end labeling staining indicated that PPT reduced the damage of free TP on the liver, kidney, and spleen. Our results demonstrated that PPT reduced free TP toxicity in vitro and in vivo and that it is a promising fundamental drug delivery system for rheumatoid arthritis treatment.
Keywords: triptolide, toxicity, poly-γ-glutamic acid, drug carrier system
Corrigendum for this paper has been published
Introduction
Triptolide (TP),1 extracted from the traditional Chinese medicinal vine Tripterygium wilfordii Hook F, was used as one of the most common systemic treatments for inflammatory and immune disorders in the People’s Republic of China for centuries. TP was demonstrated to be effective for the treatment of rheumatoid arthritis (RA), systemic lupus erythematosus, systemic sclerosis, dermatomyositis, and other immune-mediated inflammatory diseases.2,3 During the past 3 decades, thousands of patients with various autoimmune and inflammatory diseases have been treated with TP or Tripterygium wilfordii Hook F in clinical trials in People’s Republic of China.4–6 Recently, because of the potent immunosuppression activity of TP, research studies on TP for RA treatment have received increased attention.7–9
This compound has been reported to inhibit cell proliferation, induce apoptosis, and cause immunosuppressive activity, but the mechanisms are complicated. TP can interact with potassium channels to reduce the amplitude of inwardly rectifying K+ current in glioma cells and macrophage,10,11 work as an xeroderma pigmentosum group B/transcription factor II H inhibitor to block transcriptional initiation,12,13 and increase the production of reactive oxygen species (ROS).14 It inhibits cell activation and cytokine gene expression and suppresses the expression of genes for transcription factors.15 TP also directly interacts with the p40 promoter to inhibit its transcription in inflammatory macrophages.16
However, when used in the treatment of RA in clinical trials, TP exhibits some disadvantages, such as low solubility in water and various side effects.17,18 It can damage the liver, spleen, circulating blood, kidney, genital systems, and bone marrow.19–22 Delivery systems are innovative ways for administering to alleviate the disadvantages of the drug.23–25 In order to reduce the adverse effects of TP, hydrophilic, biodegradable, and high drug-loading content efficiency drug carriers need to be developed. Among the drug carriers, poly-γ-glutamic acid (γ-PGA) is a very promising one. There are increasing reports on the use of γ-PGA as a drug carrier.26,27 Amphiphilic block copolymers composed of γ-PGA-L-phenylalanine ethylester (L-PAE) are very effective in drug delivery applications.28
In this study, a nano drug carrier system (γ-PGA-L-PAE-TP [PPT]), in which TP was loaded by a γ-PGA-grafted-L-PAE copolymer, was fabricated. A hydrophobic block forms the interior structure that acts as a package site to parcel therapeutic agents, especially hydrophobic drugs. The characterization of PPT was analyzed by light scattering (LS) or photon scattering correlation spectroscopy and transmission electron microscopy (TEM). The control release manner of TP from PPT and its cytotoxicity to RAW264.7 cells were further studied. The acute toxicity effects were carried out eventually to verify the safety features of PPT.
Materials and methods
Drugs and reagents
TP (purity >99%) was supplied by Oriental Pharmaceutical Science and Technology (Shanghai, People’s Republic of China); γ-PGA (molecular weight 300 kD) was purchased from Zijin Harbor Biotechnology Co., Haining, Zhejiang, People’s Republic of China; 1-ethyl-3-(3-dimethyllaminopropyl) carbodiimide hydrochloride was purchased from Medpep Co. Ltd, (Shanghai, People’s Republic of China), L-PAE, and penicillin–streptomycin sulfate were purchased from Sigma-Aldrich Co. (St Louis, MO, USA); 4′,6-diamidino-2-phenylindole was purchased from Roche (Hoffman-La Roche Ltd., Basel, Switzerland); and dimethyl sulfoxide was purchased from Sinopharm Chemical Reagent Co. (Shanghai, People’s Republic of China). Methylthiazolyldiphenyl-tetrazolium bromide (MTT) and trypsin were purchased from Amresco (Solon, OH, USA), fetal calf serum, penicillin and streptomycin, and Dulbecco’s Modified Eagle’s Medium cell culture medium were bought from Thermo Fisher Scientific (Waltham, MA, USA).
Cells and animals
The murine macrophage RAW264.7 cell lines were purchased from the Type Culture Collection of the Chinese Academy of Sciences, Shanghai, People’s Republic of China. Cells were cultured in Dulbecco’s Modified Eagle’s Medium containing 10% fetal calf serum and 1% penicillin and streptomycin in 37°C incubator supplemented with 5% CO2. Three-month-old specific pathogen-free C57/B6 mice (male and female, 20±2 g) were purchased from Slac Laboratory Animal Ltd Co. (Shanghai, People’s Republic of China). All the murine studies were performed according to the Guiding Principles for the Care and Use of Laboratory Animals according to the Regulations of the People’s Republic of China for Administration of Laboratory Animals. And these studies were approved by the East China Normal University of Ethics Committee on Animal Resources.
Preparation of PPT
The copolymers were the amphiphilic complex of γ-PGA and L-PAE, of which γ-PGA worked as the hydrophilic part and L-PAE worked as the hydrophobic part. The γ-PGA-L-PAE-TP (PPT) biopolymer was synthesized by modifying the Akaga method.29 Briefly, 6.24 g of L-PAE was grafted to 4 g small-molecular-weight γ-PGA through amidation with the catalyst 1-ethyl-3-(3-dimethylaminopropyl)carbodiimide for 24 hours at room temperature to form the L-PAE-γ-PGA complex (PP). The PPT complex was produced by mixing 5 mg of TP with 20 mg of PP dimethyl sulfoxide solution, which was dropped into ultrapure water to develop a translucent liquid, under magnetic stirrers with a rotating speed of 60 rpm, following ultracentrifugation to remove the free TP.
Characterization of PPT
To determine the mean particle size and zeta potential of PPT, the LS (Malvern Zetasizer Nano ZS, Malvern Instruments, Malvern, UK) was performed at 25°C in triplicate. The sample was deposited at 4°C. The mean diameter and polydispersity index of the sample were evaluated in order to assess the particle size distribution, and a transmission electron microscope (TEM) was used (JEM-2100, JEOL, Tokyo, Japan) to evaluate the morphology of the PPT.
Encapsulation efficiency
To determine the encapsulation ratio, we performed high-performance liquid chromatography (Agilent 1100, Palo Alto, CA, USA) with a reversed-phase Lichrospher ODS C18 column. TP was released from PPT by depositing 5 mg of PPT into 1 mL of acetone. A rotary evaporator was used to evaporate the solution under reduced pressure at 40°C, followed by the addition of 2 mL of ethanol. The mobile phase was a mixture of acetonitrile–water (30/70, v/v), and the flow rate was controlled at 1.0 mL/min. A variable wavelength detector was used to detect column effluent at 204 nm, by maintaining the column temperature at 30°C. The encapsulation efficiency (EE) of TP in PPT was determined by using the formula EE = M1/M2, where M1 is the amount of TP in PPT, and M2 is the weight of TP applied in the formula.
Release profiles of TP from PPT
The dialysis method was carried out in order to evaluate the TP released from PPT. About 10 mg of PPT was blended into 2 mL of phosphate-buffered saline (PBS) and was placed in a dialysis bag (interception, 8000Da, Spectrum, Rancho Dominguez, CA, USA). The bag was then sealed and steeped into 28 mL of PBS or saline with persistent and mild stirring at 60 rpm at 37°C. At a given time point, 0.5 mL of dialysate was taken and synchronously restored with isometric PBS or saline. Accumulative release profile of TP from the dialysis bag at a given time was drawn.
In vitro cytotoxicity assay
RAW264.7 cells were plated in 96-well plates with a density of 4×10³ per well. The same TP concentrations (200, 100, 50, 25, 12.5, and 6.25 nM) of free TP or PPT were added and cultured for 24, 48, and 72 hours. At every time point, the cell survival rate was examined by MTT. About 20 μL of 5 mg/mL MTT solution was added to each well, and the mixture is incubated for another 3 hours. After the supernatant was wiped out, 100 μL of dimethyl sulfoxide was added into each well. The optical density values of each well were detected by a microplate reader (BioTek, SYNERGY, Winooski, VT, USA) under 570 nm absorption value, which were used to evaluate the cell viability.
Apoptosis detected by flow cytometry
Murine macrophage RAW264.7 cell lines were incubated with 100 nM TP or PPT (TP equivalent to 100 nM) for 24 hours. The cells treated with PBS were used as control group. After incubation, the apoptosis of RAW264.7 cells induced by TP or PPT was detected by flow cytometer. The double-staining of Annexin V-fluorescein isothiocyanate (FITC)/propidium iodide was used to quantify apoptosis. Briefly, after incubation, cells were centrifuged and washed with PBS for three times, incubated in 500 μL of flow cytometric method buffer with 5 μL of PI and 5 μL of Annexin V-FITC for 15 minutes. The apoptosis rate of the different groups was detected by ACCURI C6 (Becton Dickinson, Franklin Lakes, NJ, USA).
Detection of ROS
RAW264.7 cells were seeded in 96-well plates with a density of 4×10³ cells per well, and 100 nM TP or PPT was added and cultured for 24 hours. The control group was treated with PBS. The ROS of RAW264.7 cells were then detected by 2,7-dichlorodihydrofluorescein diacetate kit (DCFH-DA, Beyotime, Shanghai, People’s Republic of China). The cell supernatant of each well was removed and replaced with 100 μL of DCFH-DA (diluted 1,000 times with Dulbecco’s Modified Eagle’s Medium). After a thorough wash, the plate was placed in an incubator at 37°C for 20 minutes. The ROS level was detected by the fluorescence intensity by using a spectrophotometer (BioTek, SYNERGY) with 490 nm excitation wavelength and 520 nm emission wavelength.
In vivo toxicity
C57/B6 mice were used to detect in vivo toxicity of PPT. The mice were divided into six groups randomly (n=10) and were treated with 2 mg/kg TP, 1 mg/kg TP, 0.5 mg/kg TP, 0.5 mg/kg PPT, PP (PP concentration equivalent to PPT), and PBS (named as control), respectively. All the groups were administrated with different drugs by tail vein injection once every 4 days for four times. After the first injection, the livability and body weight were examined every day for 16 days as an indicator of systemic toxicity. On the 16th day after the first injection, the mice were killed to collect the blood samples. The hemocytometer was used to count the red blood cells, white blood cells, and lymphocytes. The renal and hepatic functions were determined by creatinine, blood urea nitrogen, aspartate aminotransferase, and serum alanine aminotransferase by using an autoanalyzer (BM704, Hitachi, Tokyo, Japan). The spleens and thymuses were weighed to determine the spleen index and thymus index, respectively.
Histological examination
The livers, spleens, and kidneys of each group were obtained and fixed with 10% formalin. After dehydration with gradient alcohol, paraffin embedding, and pathological section, hematoxylin and eosin (HE) staining was performed in the paraffin slices for histological examination.
Terminal-deoxynucleotidyl dUTP transferase dUTP nick-end labeling staining
Apoptosis in the livers, spleens, and kidneys was identified by a terminal-deoxynucleotidyl transferase dUTP nick-end labeling (TUNEL) kit (Promega Corporation, Fitchburg, WI, USA). Paraffin sections of kidney, spleen, and liver tissues were deparaffinized with xylene and rehydrated in a series of graded ethanol. Proteinase K (20 mg/mL; Sigma-Aldrich Co., St Louis, MO, USA) was used for cell membrane perforation at 37°C for 30 minutes. The tissue sections were then incubated with a reaction mixture of terminal deoxynucleotidyl transferase at 37°C for 1 hour. Finally, 4′,6-diamidino-2-phenylindole was added to stain the nucleus, and the apoptotic cells were detected by fluorescence microscopy (DM4000B, LEICA, Wetzlar, Germany).
Results and discussion
Characterization of PPT
LS and TEM are conventional methods to detect the size of particles. In particular, LS provides size distribution and surface zeta potential, and TEM provides morphological information. The LS data showed that the size distribution of PPT was almost homogeneous (Figure 1A). The average diameter of PPT was 98±15 nm (polydispersity index =0.18), and the zeta potential was −35 mV. The PPT morphology measured by TEM method was shown in Figure 1B. The average size was 116±27 nm, and the morphology was almost anomalous. The zeta potential magnitude can be used as a stability indicator of a colloidal system. The particles will repel each other if they have strong potential to create dispersion stability. The boundary between the stable and unstable particles in aqueous phase is generally regarded at either +30 or −30 mV.30 RA induces angiogenesis, of which the endothelium is discontinuous with large fenestrations with enhanced permeability and retention effects that can enhance drug retention. Permeability of the blood vessels was enhanced in the inflammatory tissues, which made small long-circulating drug carrier systems to aggregate at the site through enhanced permeability and retention effects.31,32 Eventually, the drugs persisted in extravascular space, mainly devoured by the macrophages in the synovial layer.33–36 The TP encapsulation ratio was detected by high-performance liquid chromatography method, and the EE of TP in PPT was 48.6%. The nano size and the zeta potential make it promising for the treatment of RA.
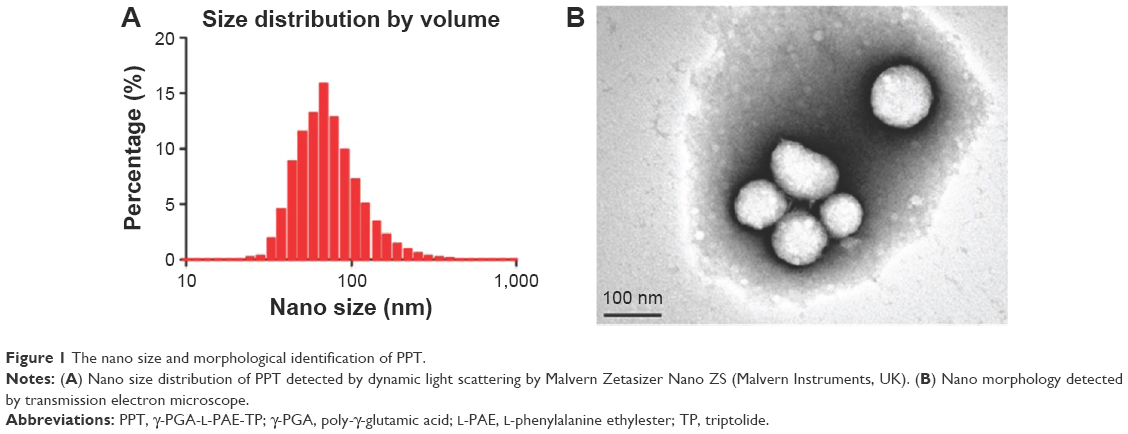 | Figure 1 The nano size and morphological identification of PPT. |
In vitro slow-release profile
Drugs should be released from a slow-release formulation in a sustainable manner rather than in a fast-releasing manner. Figure 2 showed that the free TP released in both PBS and saline out of a dialysis bag revealed a burst-release profile, whereas TP from PPT was released in a sustainable manner. The half-maximal release time (t1/2) of free TP was 1.5 hours. However, the t1/2 was almost 23 hours for PPT. After 6 hours, ~60% of TP was released from the dialysis bag, whereas only ~23% of TP was released from PPT. An 81% released of TP from PPT was observed after 100 hours, which indicated that PPT has sustained-release properties. Compared with the non-slow-release formulation, the slow-release formulation could maintain a suitable blood drug concentration, and because of the small molecule size, free TP could be quickly removed from the body by liver metabolism and the kidneys. PPT as a slow-release formulation could release TP in a sustainable manner; hence, the drug dose and the usage frequency were greatly reduced, which had a better therapeutic effect and had simultaneously increased the compliance of the patients.37
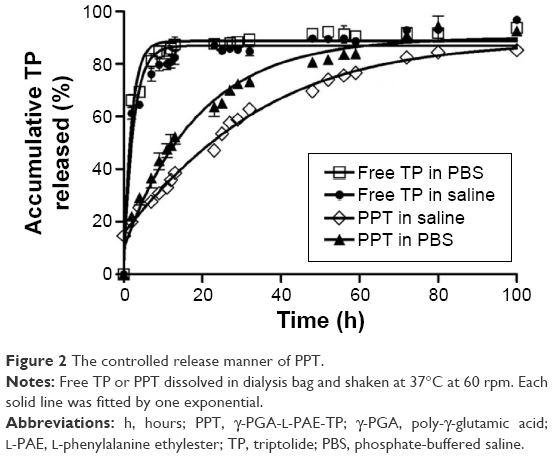 | Figure 2 The controlled release manner of PPT. |
In vitro cytotoxicity assay
Table 1 showed that the half-inhibition concentration of PPT was much higher than that of free TP at 24 hours (367±29.43 nM vs 45±17.45 nM) and 48 hours (89±19.59 nM vs 25±15.23 nM), which could be accounted for the slow release of TP from PPT. However, at 72 hours, the cell survival rates of the TP and PPT (200 nM) treatment groups were nearly the same, which could be the result of the fact that almost all the TPs were eventually released from the PPT (Figure 3). These data suggested that the PPT drug delivery system could reduce cytotoxicity in the early stages and help realize the drug efficacy. RA is a common form of a chronic inflammatory disease of the joints, persistent synovial inflammation, articular damage, and an altered immune response.38 Tumor necrosis factor alpha (TNFα) plays a dominant role in the development of RA.39 There are several theories on how TNFα derives in a disease process.40 In RA patients, the activated macrophages produce the inflammatory cytokine TNFα in abundance.41,42 Several studies have reported that TP can reduce the TNFα expression level in the activated macrophages.43,44 The PPT drug delivery system can inhibit macrophage proliferation with reduced toxicity and decreased side effects.
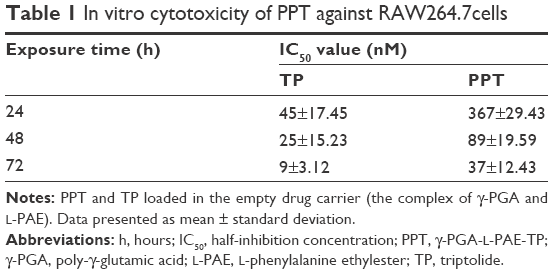 | Table 1 In vitro cytotoxicity of PPT against RAW264.7cells |
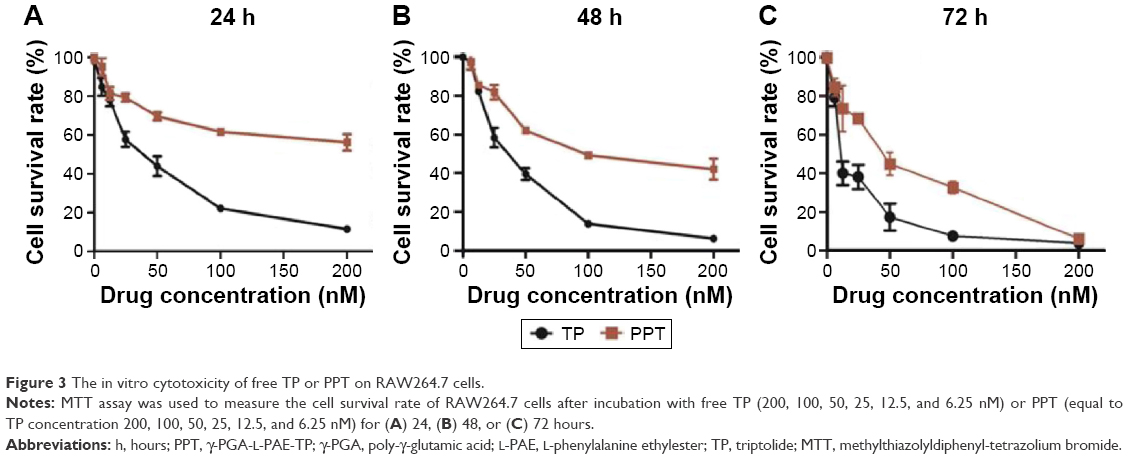 | Figure 3 The in vitro cytotoxicity of free TP or PPT on RAW264.7 cells. |
PPT decreased TP-induced apoptosis detected by a flow cytometric method
Free TP could cause both apoptosis and necrocytosis, which is one of the important mechanisms of TP in the treatment for RA.45 In the current study, we wanted to test the in vitro effect of PPT on apoptosis and necrocytosis of macrophages. The cell survival rate was assessed by a flow cytometric method. Annexin V-FITC staining and PI staining were used to detect the macrophage apoptosis at both early and late apoptotic stages and necrocytosis. Within the 24 hours of incubation, there was no obvious apoptosis phenomenon in the control group (Figure 4A) and the PP-treated group (Figure 4B). However, both TP and PPT treatments induced severe apoptosis of macrophages; the apoptosis rate in free TP treatment group was 2.7% (Figure 4C), and the apoptosis rate in PPT treatment group was 3% (Figure 4D), which suggested that during the early stages of apoptosis, a significant difference between PPT and TP treatment group could not be detected. However, the live cells in the PPT treatment group were 90%, which was much higher than that in the free TP treatment group (78%; Figure 4C). These results showed that PPT treatment significantly increased the cell survival rate compared with TP treatment. The post-apoptosis and death rate (12%) in the free TP treatment group (Figure 4C) were much higher than that in the PPT treatment group (4.7%; Figure 4D). The flow cytometry results revealed that the apoptotic cells at late apoptosis stage were less in PPT group than those in TP group.
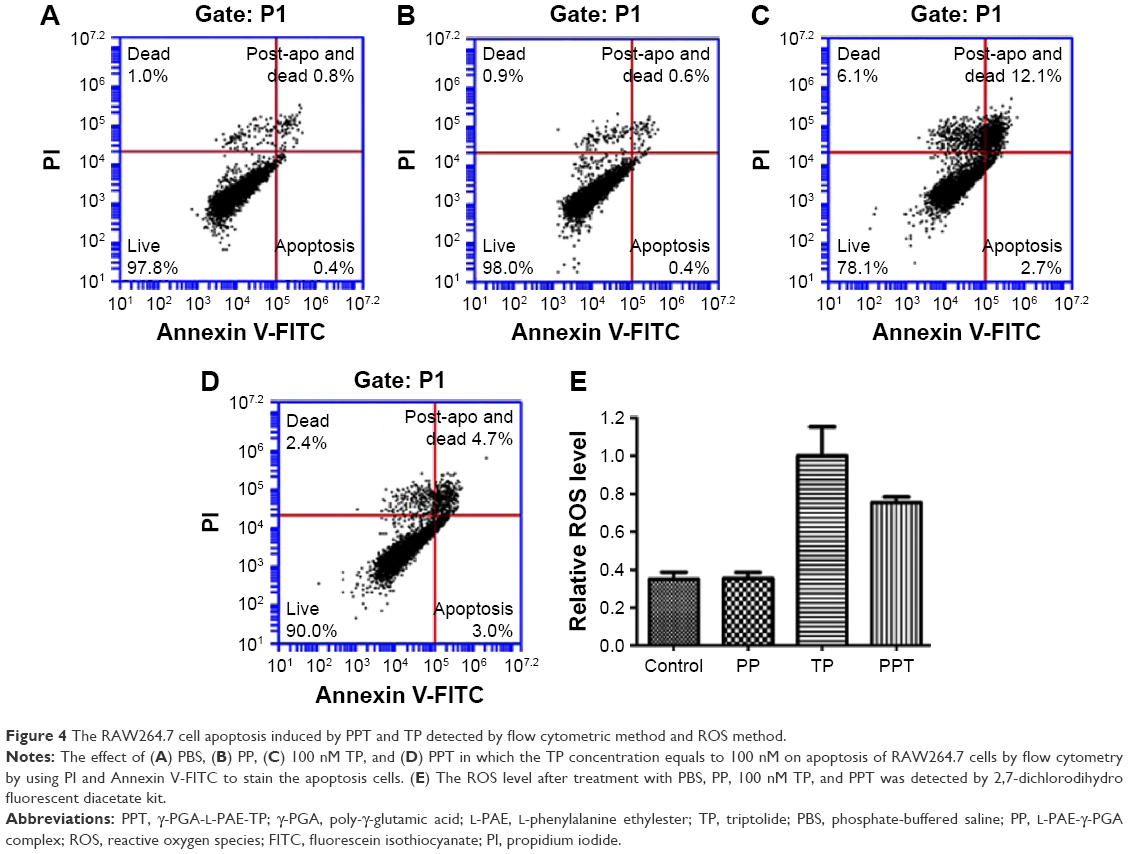 | Figure 4 The RAW264.7 cell apoptosis induced by PPT and TP detected by flow cytometric method and ROS method. |
PPT decreased TP-induced upregulation of cellular ROS
It was reported that TP enhanced the ROS level in order to mediate DNA damage.46 In this study, we determined the effect of PPT on ROS production of macrophage. DCFH-DA is widely used to detect cellular ROS. The DCFH-DA fluorescence intensity is a response to intracellular ROS levels. We found that TP increased the intracellular ROS levels by 2.5-fold compared with the control, whereas PPT decreased the intracellular ROS levels to 80% (Figure 4E). Our study demonstrated that PPT significantly decreased the production of ROS induced by TP, and thus PPT could greatly reduce the toxicity.
PPT decreased in vivo toxicity
The livability was 100% when mice were injected with PBS (Figure 5A), PP (Figure 5B), and PPT (Figure 5C), whereas all mice died on the second day (Figure 5D) when the mice were injected with 2 mg/kg TP, and all mice that were injected with 1 mg/kg TP died on day 7 (Figure 5E). However, the livability was 70% when mice were injected with 0.5 mg/kg of TP (Figure 5F). These results indicated that PPT remarkably protected mice from toxicity injury of TP. In addition, 0.5 mg/kg of TP treatment caused a 20% loss of body weight at the end of the experiment (P<0.001), while the same concentration PPT treatment showed no negative effect on body weight (Figure 6A and B).
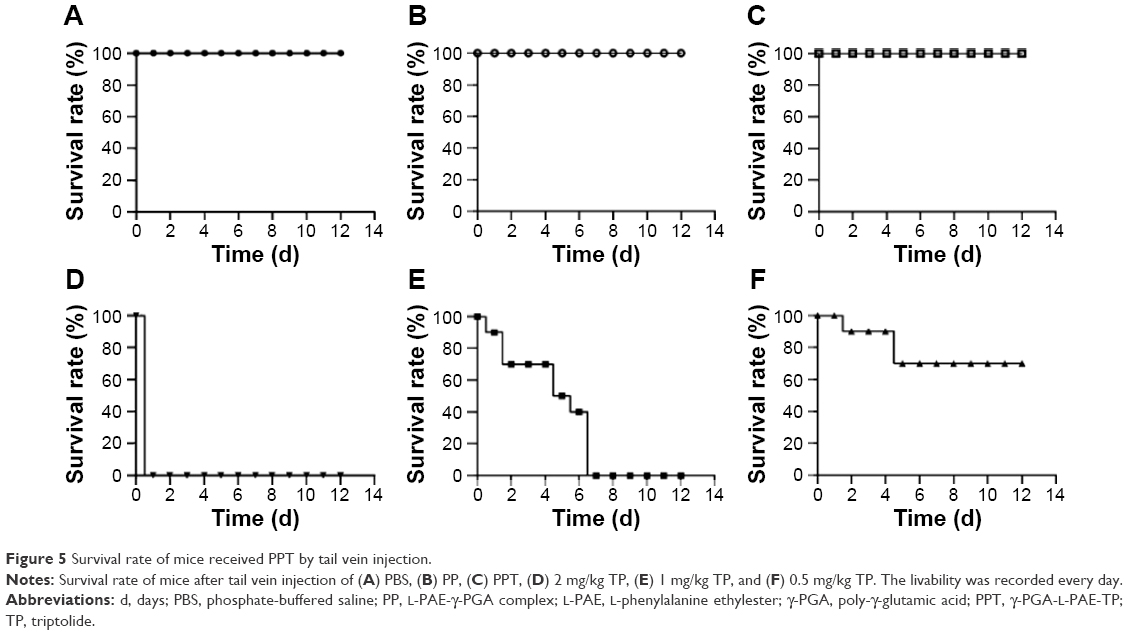 | Figure 5 Survival rate of mice received PPT by tail vein injection. |
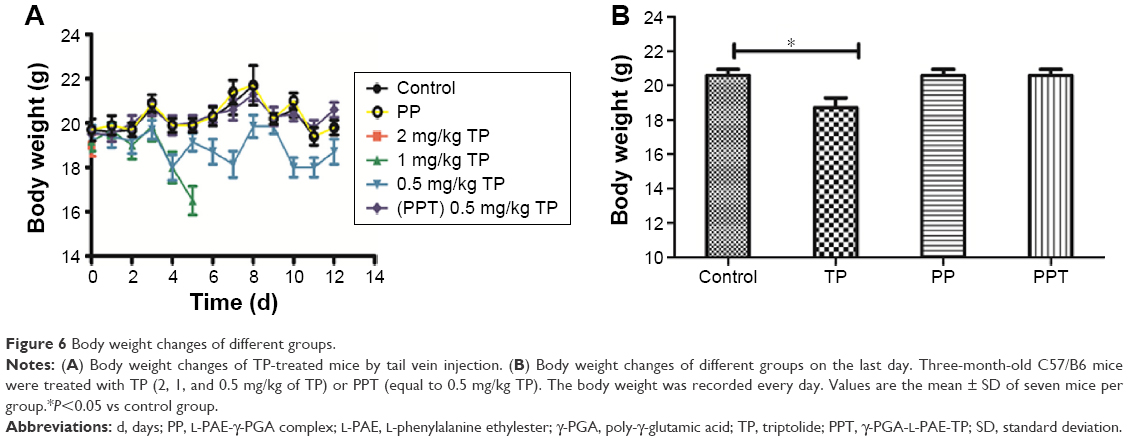 | Figure 6 Body weight changes of different groups. |
On the other hand, there were no significant decreases (P>0.05) in white blood cells, red blood cells, or lymphocytes in PPT, PBS, or PP groups. However, a great reduction (P<0.01) could be detected in free TP-treated group. Serum analysis indicated that only free TP group induced damage to the kidney (blood urea nitrogen and creatinine) and liver (serum alanine aminotransferase and aspartate aminotransferase). And there were no obvious differences between PPT-treated and control groups (P>0.05), which indicated that PPT revealed lower toxicity (Table 2).
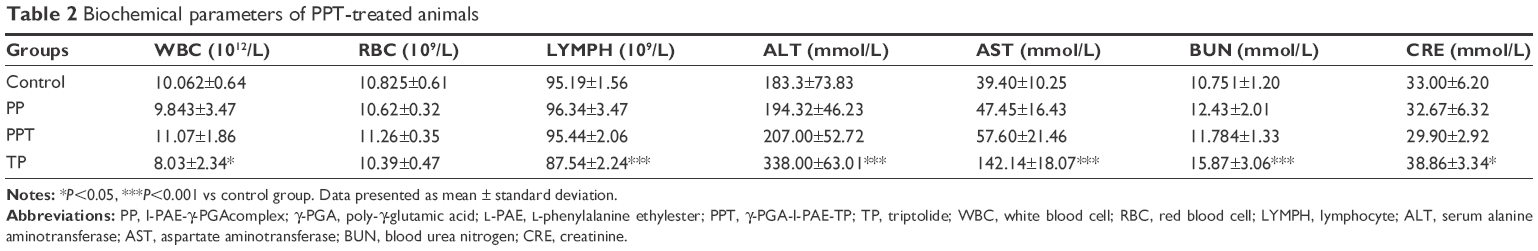 | Table 2 Biochemical parameters of PPT-treated animals |
TP treatment reduced thymus index (P<0.001) and increased spleen index (P<0.01), compared with control group, whereas there were no significant disparity among the PPT, PP, and control groups (P>0.05; Table 3).
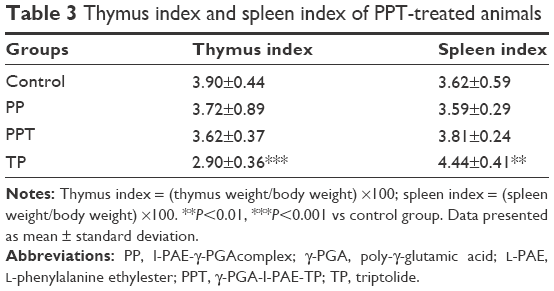 | Table 3 Thymus index and spleen index of PPT-treated animals |
HE staining pathologic analysis
The TP cytotoxicity, including myelosuppression,47 acute nephrotoxicity, and hepatotoxicity,48 severely limits the clinical application. Hence, we performed HE staining to determine the effect of PPT on liver, kidney, and spleen. In the current study, we found that in the control and PP groups, the liver cells maintained a complete structure, with the cell nucleus arranged orderly in the middle and the cytoplasm free of any degeneration or necrosis. The livers of the mice in TP-treated group emerged hyperemic, mottled, and fragile; the cell nuclei showed pyknosis and rupture; portions of the nuclei were gone; the cytoplasmic staining was uneven with slight cell damage; and the morphological structures were fuzzy. In contrast, the livers of the mice in the PPT group did not reveal any great changes, the liver cellular structures were clear, and the cells were arranged in an orderly way.
In control, PP, and PPT groups, the structures of the renal glomerulus, tubule, and interstitium were normal, without blurry boundaries of the epithelial cells of the renal tubule (especially the proximal tubule). However, in TP group, the renal glomerulus was hyperemic, swelling, scattered, and necrotic. The boundaries of renal tubule epithelial cells were blurry. Stenosis or atresia occurred in lumens, and interstitial edema was evident.
In addition, free TP treatment induced spleen edema and increase of spleen red pulp, whereas PPT treatment reduced those damaging effects of TP on spleen (Figure 7).
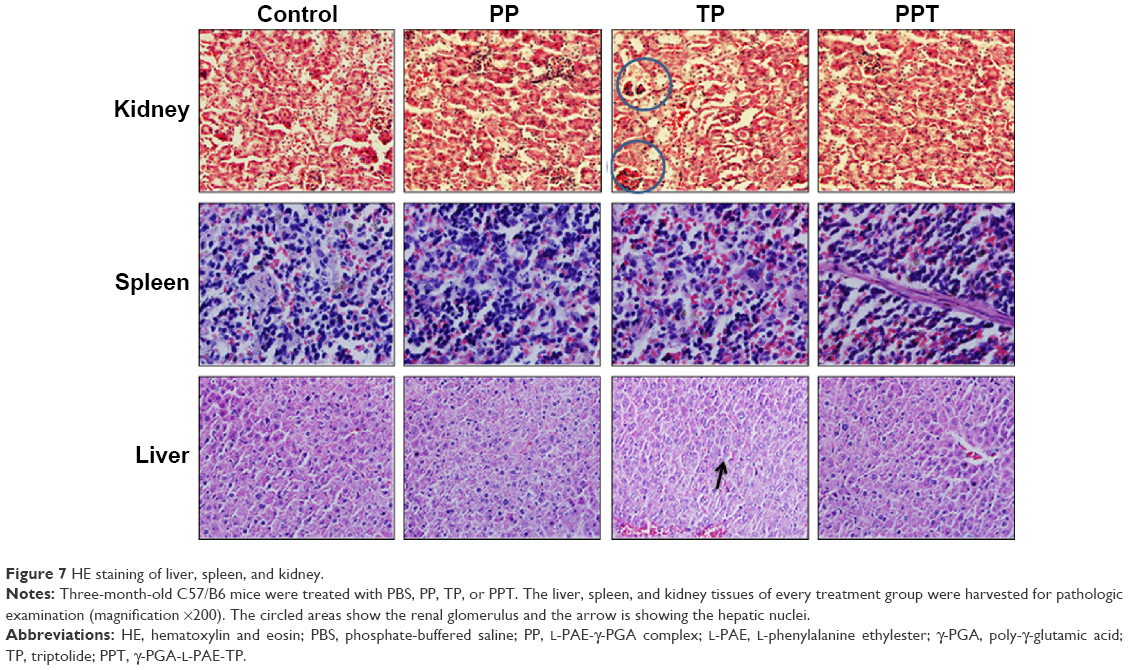 | Figure 7 HE staining of liver, spleen, and kidney. |
TUNEL assay
TUNEL assay is a common method for detecting cell apoptosis in the organs. The TUNEL assay can detect DNA strand breaks as a result of apoptosis. Therefore, TUNEL assay was performed to assess the apoptosis of liver, kidney, and spleen. There was no positive staining in the PP- or PBS-treated samples. But TP induced great apoptosis of kidney, spleen, and liver, whereas only slight positive staining could be observed in the PPT-treated group. Those results indicated that TP exhibited severe in vivo toxicity but that PPT markedly decreased the toxicity of TP on liver, spleen, and kidney (Figure 8).
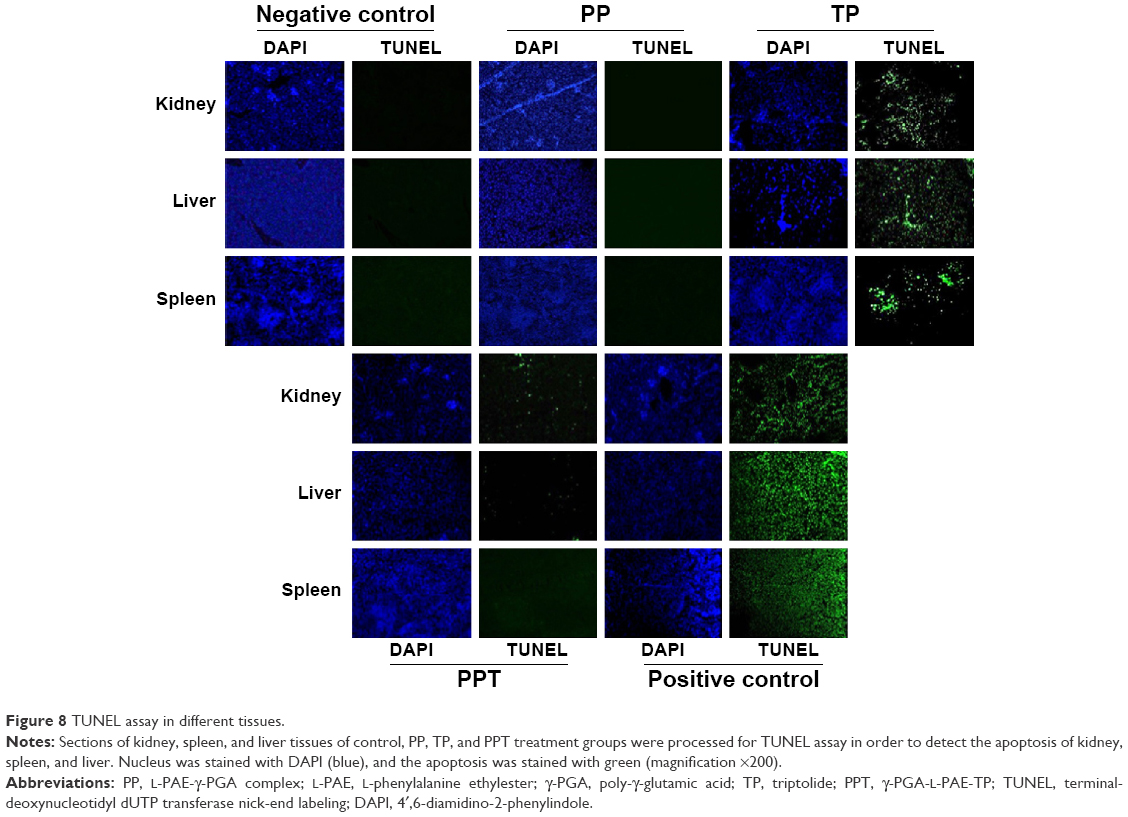 | Figure 8 TUNEL assay in different tissues. |
Conclusion
The results indicated that the average diameter of PPT was 98±15 nm with a polydispersity index =0.18, which is suitable for enhanced permeability and retention effects, the EE was 48.6% with a controlled release manner, and the zeta potential was −35 mV. The MTT assay and flow cytometric methods revealed that PPT could reduce free TP-induced inhibition on RAW264.7 cells and apoptosis, respectively. The ROS method showed that PPT could decrease the TP-induced upregulation of cellular ROS. Compared with the free TP-treated group, PPT increased the survival rate of mice without affecting thymus index, spleen index, or the blood biochemical index. PPT could significantly reduce renal, liver, and kidney toxicity in vivo. HE staining and TUNEL assay suggested that TP induced great damage to the kidney, spleen, and liver, while PPT markedly decreased the toxicity of TP. According to the results of the current study, we believe that PPT is a promising fundamental drug delivery system for RA treatment.
Acknowledgments
This research was supported by the National Natural Science Foundation of China (81220108027, 81403417, 81330085, and 81403418); “Innovation Team” development projects (IRT1270); and special funding for the National Outstanding Doctoral Dissertation (201276).
Disclosure
The authors report no conflicts of interest in this work.
References
Kupchan SM, Court WA, Dailey RG Jr, Gilmore CJ, Bryan RF. Triptolide and tripdiolide, novel antileukemic diterpenoid triepoxides from Tripterygium wilfordii. J Am Chem Soc. 1972;94(20):7194–7195. | ||
Han R, Rostami-Yazdi M, Gerdes S, Mrowietz U. Triptolide in the treatment of psoriasis and other immune-mediated inflammatory diseases. Br J Clin Pharmacol. 2012;74(3):424–436. | ||
Matta R, Wang X, Ge H, Ray W, Nelin LD, Liu Y. Triptolide induces anti-inflammatory cellular responses. Am J Transl Res. 2009;1(3):267–282. | ||
Tao X, Cush JJ, Garret M, Lipsky PE. A phase I study of ethyl acetate extract of the Chinese antirheumatic herb Tripterygium wilfordii hook F in rheumatoid arthritis. J Rheumatol. 2001;28(10):2160–2167. | ||
Cibere J, Deng Z, Lin Y, et al. A randomized double blind, placebo controlled trial of topical Tripterygium wilfordii in rheumatoid arthritis: reanalysis using logistic regression analysis. J Rheumatol. 2003;30(3):465–467. | ||
Tao X, Younger J, Fan FZ, Wang B, Lipsky PE. Benefit of an extract of Tripterygium wilfordii Hook F in patients with rheumatoid arthritis: a double-blind, placebo-controlled study. Arthritis Rheum. 2002;46(7):1735–1743. | ||
Lu Y, Wang WJ, Leng JH, Cheng LF, Feng L, Yao HP. Inhibitory effect of triptolide on interleukin-18 and its receptor in rheumatoid arthritis synovial fibroblasts. Inflamm Res. 2008;57(6):260–265. | ||
Xu L, Pan J, Chen Q, et al. In vivo evaluation of the safety of triptolide-loaded hydrogel-thickened microemulsion. Food Chem Toxicol. 2008;46(12):3792–3799. | ||
Xue M, Zhao Y, Li XJ, et al. Comparison of toxicokinetic and tissue distribution of triptolide-loaded solid lipid nanoparticles vs free triptolide in rats. Eur J Pharm Sci. 2012;47(4):713–717. | ||
Tsai KL, Chang HF, Wu SN. The inhibition of inwardly rectifying K+ channels by memantine in macrophages and microglial cells. Cell Pysiol Biochem. 2013;31(6):938–951. | ||
So EC, Lo YC, Chen LT, Kao CA, Wu SN. High effectiveness of triptolide, an active diterpenoid triepoxide, in suppressing Kir-channel currents from human glioma cells. Eur J Pharmacol. 2014;738:332–341. | ||
Chen F, Gao X, Shilatifard A. Stably paused genes revealed through inhibition of transcription initiation by the TFIIH inhibitor triptolide. Genes Dev. 2015;29(1):39–47. | ||
Titov DV, Gilman B, He QL, et al. XPB, a subunit of TFIIH, is a target of the natural product triptolide. Nat Chem Biol. 2011;7(3):182–188. | ||
Zhou J, Xi C, Wang W, et al. Triptolide-induced oxidative stress involved with Nrf2 contribute to cardiomyocyte apoptosis through mitochondrial dependent pathways. Toxicol Lett. 2014;230(3):454–466. | ||
Park B, Sung B, Yadav VR, Chaturvedi MM, Aggarwal BB. Triptolide, histone acetyltransferase inhibitor, suppresses growth and chemosensitizes leukemic cells through inhibition of gene expression regulated by TNF-TNFR1-TRADD-TRAF2-NIK-TAK1-IKK pathway. Biochem Pharmacol. 2011;82(9):1134–1144. | ||
Zhang Y, Ma X. Triptolide inhibits IL-12/IL-23 expression in APCs via CCAAT/enhancer-binding protein α. J Immunol. 2010;184(7):3866–3877. | ||
Li XJ, Jiang ZZ, Zhang LY. Triptolide: progress on research in pharmacodynamics and toxicology. J Ethnopharmacol. 2014;155(1):67–79. | ||
Jin J, Sun X, Zhao Z, et al. Activation of the farnesoid X receptor attenuates triptolide-induced liver toxicity. Phytomedicine. 2015;22(10):894–901. | ||
Wu SX, Guo NR. Clinical observation on effect of triptolide tablet in treating patients with psoriasis vulgaris. Chin J Integr Med. 2005;11(2):147–148. | ||
Singla N, Challana S. Reproductive toxicity of triptolide in male house rat, Rattus rattus. ScientificWorldJournal. 2014;2014:879405. | ||
Wang X, Jiang Z, Xing M, et al. Interleukin-17 mediates triptolide-induced liver injury in mice. Food Chem Toxicol. 2014;71:33–41. | ||
Li J, Shen F, Guan C, et al. Activation of Nrf2 protects against triptolide-induced hepatotoxicity. PLoS One. 2014;9(7):e100685. | ||
Ling D, Xia H, Park W, et al. pH-sensitive nanoformulated triptolide as a targeted therapeutic strategy for hepatocellular carcinoma. ACS Nano. 2014;8(8):8027–8039. | ||
Hou DZ, Xie CS, Yang XL, Xu HB, Ping QN. [Microstructure of novel solid lipid nanoparticle loaded triptolide]. Yao Xue Xue Bao. 2007;42(4):429–433. | ||
Xu L, Qiu Y, Xu H, Ao W, Lam W, Yang X. Acute and subacute toxicity studies on triptolide and triptolide-loaded polymeric micelles following intravenous administration in rodents. Food Chem Toxicol. 2013;57:371–379. | ||
Zhang L, Geng X, Zhou J, et al. Fabrication of poly(gamma-glutamic acid)-based biopolymer as the targeted drug delivery system with enhanced cytotoxicity to APN/CD13 over-expressed cells. J Drug Target. 2015;23(5):453–461. | ||
Geng X, Ye H, Feng Z, et al. Synthesis and characterization of cisplatin-loaded, EGFR-targeted biopolymer and in vitro evaluation for targeted delivery. J Biomed Mater Res A. 2012;100(10):2839–2848. | ||
Akagi T, Higashi M, Kaneko T, Kida T, Akashi M. Hydrolytic and enzymatic degradation of nanoparticles based on amphiphilic poly(gamma-glutamic acid)-graft-L-phenylalanine copolymers. Biomacromolecules. 2006;7(1):297–303. | ||
Akagi T, Kaneko T, Kida T, Akashi M. Preparation and characterization of biodegradable nanoparticles based on poly(gamma-glutamic acid) with L-phenylalanine as a protein carrier. J Control Release. 2005;108(2–3):226–236. | ||
Mishra PR, Al Shaal L, Müller RH, Keck CM. Production and characterization of Hesperetin nanosuspensions for dermal delivery. Int J Pharm. 2009;371(1–2):182–189. | ||
Duncan R, Vicent MJ, Greco F, Nicholson RI. Polymer-drug conjugates: towards a novel approach for the treatment of endrocine-related cancer. Endocr Relat Cancer. 2005;12(Suppl 1):S189–S199. | ||
Reddy KR. Controlled-release, pegylation, liposomal formulations: new mechanisms in the delivery of injectable drugs. Ann Pharmacother. 2000;34(7–8):915–923. | ||
Pham CT. Nanotherapeutic approaches for the treatment of rheumatoid arthritis. Wiley Interdiscip Rev Nanomed Nanobiotechnol. 2011;3(6):607–619. | ||
van den Hoven JM, Van Tomme SR, Metselaar JM, Nuijen B, Beijnen JH, Storm G. Liposomal drug formulations in the treatment of rheumatoid arthritis. Mol Pharm. 2011;8(4):1002–1015. | ||
Metselaar JM, van den Berg WB, Holthuysen AE, Wauben MH, Storm G, van Lent PL. Liposomal targeting of glucocorticoids to synovial lining cells strongly increases therapeutic benefit in collagen type II arthritis. Ann Rheum Dis. 2004;63(4):348–353. | ||
Hofkens W, Storm G, van den Berg WB, van Lent PL. Liposomal targeting of glucocorticoids to the inflamed synovium inhibits cartilage matrix destruction during murine antigen-induced arthritis. Int J Pharm. 2011;416(2):486–492. | ||
Park K. Drug delivery of the future: chasing the invisible gorilla. J Control Release. 2015;S0168-3659(15):30214–30215. | ||
Choy E. Understanding the dynamics: pathways involved in the pathogenesis of rheumatoid arthritis. Rheumatology. 2012;51(Suppl 5):v3–v11. | ||
Umar S, Hedaya O, Singh AK, Ahmed S. Thymoquinone inhibits TNF-alpha-induced inflammation and cell adhesion in rheumatoid arthritis synovial fibroblasts by ASK1 regulation. Toxicol Appl Pharmacol. 2015;287(3):299–305. | ||
McInnes IB, Schett G. Cytokines in the pathogenesis of rheumatoid arthritis. Nat Rev Immunol. 2007;7(6):429–442. | ||
Ramiro S, Landewe R, van der Heijde D, Harrison D, Collier D, Michaud K. Discontinuation rates of biologics in patients with rheumatoid arthritis: are TNF inhibitors different from non-TNF inhibitors? RMD Open. 2015;1(1):e000155. | ||
Croft M, Benedict CA, Ware CF. Clinical targeting of the TNF and TNFR superfamilies. Nat Rev Drug Discov. 2013;12(2):147–168. | ||
Lu Y, Zhang Y, Li L, et al. TAB1: a target of triptolide in macrophages. Chem Biol. 2014;21(2):246–256. | ||
Park B. Triptolide, a diterpene, inhibits osteoclastogenesis, induced by RANKL signaling and human cancer cells. Biochimie. 2014;105:129–136. | ||
Gali-Muhtasib H, Hmadi R, Kareh M, Tohme R, Darwiche N. Cell death mechanisms of plant-derived anticancer drugs: beyond apoptosis. Apoptosis. 2015;20(12):1531–1562. | ||
Mei Z, Li X, Wu Q, Hu S, Yang X. The research on the anti-inflammatory activity and hepatotoxicity of triptolide-loaded solid lipid nanoparticle. Pharmacol Res. 2005;51(4):345–351. | ||
Fidler JM, Ku GY, Piazza D, Xu R, Jin R, Chen Z. Immunosuppressive activity of the Chinese medicinal plant Tripterygium wilfordii. III. Suppression of graft-versus-host disease in murine allogeneic bone marrow transplantation by the PG27 extract. Transplantation. 2002;74(4):445–457. | ||
Qu L, Qu F, Jia Z, Wang C, Wu C, Zhang J. Integrated targeted sphingolipidomics and transcriptomics reveal abnormal sphingolipid metabolism as a novel mechanism of the hepatotoxicity and nephrotoxicity of triptolide. J Ethnopharmacol. 2015;170:28–38. |
 © 2016 The Author(s). This work is published and licensed by Dove Medical Press Limited. The full terms of this license are available at https://www.dovepress.com/terms.php and incorporate the Creative Commons Attribution - Non Commercial (unported, v3.0) License.
By accessing the work you hereby accept the Terms. Non-commercial uses of the work are permitted without any further permission from Dove Medical Press Limited, provided the work is properly attributed. For permission for commercial use of this work, please see paragraphs 4.2 and 5 of our Terms.
© 2016 The Author(s). This work is published and licensed by Dove Medical Press Limited. The full terms of this license are available at https://www.dovepress.com/terms.php and incorporate the Creative Commons Attribution - Non Commercial (unported, v3.0) License.
By accessing the work you hereby accept the Terms. Non-commercial uses of the work are permitted without any further permission from Dove Medical Press Limited, provided the work is properly attributed. For permission for commercial use of this work, please see paragraphs 4.2 and 5 of our Terms.