")
Back to Journals » OncoTargets and Therapy » Volume 12
Extracellular matrix protein 1 (ECM1) is associated with carcinogenesis potential of human bladder cancer
Authors Wang Z , Zhou Q, Li A, Huang W, Cai Z, Chen W
Received 18 October 2018
Accepted for publication 18 January 2019
Published 20 February 2019 Volume 2019:12 Pages 1423—1432
DOI https://doi.org/10.2147/OTT.S191321
Checked for plagiarism Yes
Review by Single anonymous peer review
Peer reviewer comments 3
Editor who approved publication: Dr William C. Cho
Zhicai Wang,1 Qun Zhou,1 Aolin Li,1 Weiren Huang,1–3 Zhiming Cai,1–3 Wei Chen1
1Key Laboratory of Medical Reprogramming Technology, Shenzhen Second People’s Hospital, First Affiliated Hospital of Shenzhen University, Shenzhen, China; 2Department of Urology, Shenzhen Second People’s Hospital, The First Affiliated Hospital of Shenzhen University, Carson International Cancer Center, Shenzhen University School of Medicine, Shenzhen, China; 3Guangdong Key Laboratory of Systems Biology and Synthetic Biology for Urogenital Tumors, Shenzhen, China
Background: Bladder cancer (BCa) is a common urological malignant tumor worldwide, and recurrence and death still remain high. New therapeutic targets are needed to treat patients who are not sensitive to current therapy. Extracellular matrix protein 1 (ECM1) is a key player in multiple epithelial malignancies. However, the knowledge regarding the expression of ECM1 in BCa and the mechanisms by which ECM1 affects BCa tumor progression is unclear.
Materials and methods: ECM1 expression levels in BCa tissues and cells were detected by quantitative real-time PCR (qRT-PCR), immunohistochemistry and Western blot. ECM1 expression was suppressed by shRNAs. Cell Counting Kit-8 (CCK-8), luminescent cell viability assay and 5-ethynyl-2'-deoxyuridine (EdU) assay were used to detect cell proliferation. Flow cytometry and transwell assay were used to evaluate cell apoptosis and invasion, respectively. All statistical analyses were performed by using the GraphPad Prism 7 software package.
Results: In this study, the expression of ECM1 in BCa specimens and cell lines was examined and displayed a significant increase compared with noncancerous counterparts, while ECM1-knockdown affected not only cell proliferation and migration, but also cell invasion ability and apoptosis potential, corresponding to the finding that ECM1 overexpression in BCa patients was associated with a poor prognosis. Additionally, after suppression of ECM1, the expression of glucose transporter 1 (GLUT1), lactate dehydrogenase (LDHA) and hypoxia-inducible factor 1α (HIF-1α), genes involved in Warburg effect regulation, were significantly decreased, and the lactate production was also obviously reduced in ECM1-silenced cells.
Conclusion: Our investigations revealed that the expression of ECM1 was closely associated with tumor cell growth, migration and apoptosis at least in part through regulation of Warburg effect, defining ECM1 as an effective predictor in the carcinogenesis and postoperative recurrence of human BCa.
Keywords: bladder cancer, extracellular matrix protein 1, proliferation, migration, invasion
Introduction
Bladder cancer (BCa) is one of the most common urological malignant tumors worldwide, especially in elderly men, with almost 386,000 new cases and 150,000 deaths occurring annually.1 The incidence and mortality rate of BCa have the highest and the fifth highest among the urogenital carcinomas in China and the US, respectively. This is largely due to the inefficiency of current therapies for treating advanced BCa.2 Moreover, the molecular mechanism of BCa, involving the activation of proto-oncogenes and the inactivation of tumor suppressor genes in the carcinogenesis is far from clear, and the effective therapeutic targets are still lacking.3–5 Therefore, it is necessary to explore new therapeutic targets for BCa patients who are not sensitive to current therapies, and elucidate the molecular mechanism of BCa carcinogenesis.6,7
Extracellular matrix protein 1 (ECM1) is a glycoprotein expressed in epithelial organs and secreted into the extracellular stroma.8 Increased ECM1 expression has been reported in several malignancies, including invasive ductal breast carcinomas, laryngeal carcinomas, hepatocellular carcinomas, cholangio carcinomas, esophageal squamous cell carcinomas, gastric, colorectal, lung and thyroid cancers.9,10 Moreover, it is involved in various biological processes, such as cell proliferation, angiogenesis, migration and metastasis.11,12 ECM1 was found to promote metastatic progression and invasion in multiple cancer types, and overexpression of ECM1 has been incorporated into scoring models for indicating of poor clinical prognosis and metastatic potential in cancer patients.13,14 Compared with non-lymph node metastases, breast and lung tumors with lymph node metastases were more likely to be ECM1-positive.15 ECM1 overexpression in patients with invasive breast carcinomas confers a worse long-term prognosis.16 Further studies indicated that ECM1 induces tumor growth and metastasis by promoting angiogenesis17 and Warburg effect,8 or by enhancing the EGF signaling11 in breast cancer.
In the current study, we investigated the intracellular mechanisms by which ECM1 regulates metastatic behavior using aggressive BCa cell lines. Our results demonstrate that ECM1 was upregulated in BCa tissues and cell lines. Knockdown of ECM1 by shRNA inhibited cell proliferation, invasion and migration, while promoting the cell apoptosis, which might be mediated through attenuating the Warburg effect. Our findings define the essential role for ECM1 in the metastatic process and provide new insights into the role of ECM1 in BCa carcinogenesis.
Materials and methods
Patients and specimens
A total of 17 fresh primary BCa tissues and noncancerous counterparts were collected from patients and quick-frozen in liquid nitrogen after radical cystectomy. None of the patients had received preoperative treatment and metastatic tumor specimens from other tissue origins were excluded. Written informed consents were obtained from all the patients or their relatives (with power of the attorney of the patient, who cannot read and write). The research protocol using human tissues was reviewed and approved by the Institutional Ethics Committee of the First Affiliated Hospital of Shenzhen University and the study was performed in accordance with the principles of the Declaration of Helsinki.
Cell culture and transfection
Human BCa cell lines (5637, BIU-87, T24 and SW780) and a normal urothelial cell line (SV-HUC-1) were purchased from the Institute of Cell Biology, Chinese Academy of Science (Shanghai, China). The cells were routinely grown as monolayers in phenol-free RPMI-1640 medium (5637 and BIU-87), DMEM (T24 and SW780), or F12K (SV-HUC1) (Gibco; Thermo Fisher Scientific, Waltham, MA, USA) supplemented with 10% charcoal-stripped FBS (Thermo Fisher Scientific), 100 U/mL streptomycin sulfate and 100 U/mL penicillin at 37°C in a humidified chamber containing 5% CO2. ECM1-silenced cells were generated by transfection with targeted ECM1 shRNA (shECM1: 5′-AACGAGGCCAGAGCACTTTCAAGATTCAAGAGATCTTGAAAGTGCTCTGGCCTCTTTTTTGGTACC-3′) and nonspecific control shRNA (NC: 5′-TAATTGTCAAATCAGAGTGCTTCAAGAGAAAGCACTCTGATTTGACAATTA-3′) using lipofectamine 3,000 transfection reagent (Thermo Fisher Scientific) according to manufacturer’s instructions.
cDNA preparation and qRT-PCR
The total RNAs from BCa tissues or cells were homogenized and isolated using the TRIzol reagent (Thermo Fisher Scientific) following the manufacturer’s instructions. Total RNA (1 μg) was converted to cDNA using a Revertra Ace qPCR RT Kit with gDNA Eraser (Toyobo Co Ltd, Japan). Glyceraldehyde 3-phosphate dehydrogenase (GAPDH Forward: 5′-ATGGGGAAGGTGAAGGTCG-3′, Reverse: 5′-TGGAAGATGGTGATGGGATTT-3′) was used as the internal control. Other primers used were listed as follows: ECM1 forward: 5′-TGCTGTGACCTGCCATTTCC-3′, ECM1 reverse: 5′-AAGCAGTTGACCTGTTCATCCC-3′.
Warburg effect associated genes:8 GLUT1 forward: 5′-AAGCTGACGGGTCGCCT CATG-3′; GLUT1 reverse: 5′-CTCTCCCCATAGCGGTGGACC-3′; LDHA forward: 5′-GTGGGTCCTTGGGGAA CATGGAG-3′; LDHA reverse: 5′-GTCCAATAGCCCAGGATGT GTAGCC-3′; HIF-1α forward: 5′-ACCACCTATGACCTGCTTG GTGCTG-3′; HIF-1α reverse: 5′-CATATCCAGGCTGTGTCG ACTGAGG-3′.
Quantitative real-time PCR (qRT-PCR) was performed in the ABI PRISM 7500 Fluorescent Quantitative PCR System (Thermo Fisher Scientific) by using SYBR Green Premix kit (Toyobo Co. Ltd). The reaction system (15 μL) included 7.5 μL of PreMix, 1.5 μL of forward primer (2 μM), 1.5 μL of reverse primer (2 μM), 2 μL of cDNA diluted solution (10×) and 2.5 μL of deionized water. All the indicated samples were normalized to GAPDH and then the relative expression levels were calculated using the 2−ΔΔCt formula.
Cell proliferation assay
Cell proliferation was measured by Cell Counting Kit-8 (CCK-8) assay, luminescent cell viability assay, and 5-ethynyl-2′-deoxyuridine (EdU) labeling assay. In brief, 1×10³ cells were seeded in a 96-well plate. 100 μL fresh medium with 10% CCK-8 reagents (TransGen Biotech Co., Ltd, Beijing, China) was replaced into each well at 0, 24, 48, and 72 hours and incubated for another 2 hours at 37°C. The absorbance at 450 nm was detected by using an ELISA microplate reader (Bio-Rad Laboratories Inc., Hercules, CA, USA). For luminescent cell viability assay, 1×10⁴ cells suspended with 100 μL fresh media were seeded into 96-well plate. 72 hours later, 100 μL luminescent cell viability assay reagents were added into each well and incubated for 10 minutes. The luminescent signals were recorded in a Glo Max Discover system (Promega Corporation, Fitchburg, WI, USA). To directly observe the cell proliferation, EdU incorporation experiments were conducted according to the manufacturer’s specifications. Briefly, 48 hours after transfection, the EdU reagents (RIBOBIO, Guangzhou, China) were added into each well in a final concentration of 50 μM. Two hours later, cells were fixed with 4% paraformaldehyde in PBS at room temperature. Before 1× Apollo solution incubation for half an hour at room temperature in dark, cells were washed three times in PBST (PBS containing 0.1% Triton X-100). After that, cells were subjected to 1× Hoechst nuclear dye staining for 30 minutes and then observed under the fluorescence microscopy (DM IL LED, Leica Microsystems, Wetzlar, Germany). Each experiment was repeated at least three times.
Cell migration assays
Cell migration was evaluated in the ECM1-silenced 5637 and BIU-87 cell lines with the wound healing assay. Cells were seeded in a 6-well plate and grown to confluence (1×10⁶ per well) in 1,640 medium for 24 hours. The monolayer cells were scratched with a sterile 200 μL pipette tip to create clear lines. Cells were washed twice with serum-free 1,640 medium to remove floating cells and then cells were continuously cultured in the medium with 1% FBS for 24 hours. Migrating cells from the edge of the wound were recorded at 0 and 24 hours using an Olympus IX51 inverted fluorescence microscope and digital camera system (Olympus Corporation, Tokyo, Japan). The cell migration was evaluated by comparing the remaining cell-free area with the initial scrape line and calculated using ImageJ software (http://rsbweb.nih.gov/ij/; NIH, Bethesda, MD, USA).
Invasion assay
Transwell assay was conducted to assess cell invasion using 24-well Matrigel pre-coated cell culture inserts (BD Biosciences, San Jose, CA, USA).18 Briefly, cells were detached from the culture plates, washed and re-suspended. 200 μL aliquot (1×10⁵) of cells in 1,640 medium (1% FBS) was plated into the upper chamber of each insert, and filled the lower chamber with 500 μL complete medium. After 24 hours of cultivation, noninvading cells were removed from the upper surface of the insert using a cotton swab, whereas invaded cells on the bottom layer surface were rinsed in 1× PBS, fixed with methanol for 20 minutes, stained with 0.1% crystal violet dye (Sigma-Aldrich Co., St Louis, MO, USA) for 25 minutes, followed by washing three times with 1× PBS. The invaded cells were then observed under an inverted light microscope and photographed after drying. Finally, the chamber inserts with invaded cells were soaked into 1 mL of 33% acetic acid for 10 minutes to wash out the crystal violet. The absorbance at 570 nm was measured using a microplate reader (Bio-Rad Laboratories Inc.). Experiments were performed in triplicate.
Flow cytometry analysis of cell apoptosis
Cell apoptosis was determined using flow cytometry assay. ECM1-silenced cells were harvested and washed with ice-cooled 1× PBS. The cells were then co-mixed with 5 μL annexin V-FITC and 5 μL propidium iodide (TransGene, Beijing, China) in 100 μL annexin V binding buffer and incubated in dark at room temperature for 15 minutes according to the manufacturer’s specifications. The proportion of apoptotic cells was analyzed by flow cytometry (EPICS, XL-4, Beckman Coulter, Inc., Brea, CA, USA). The experiments were performed in triplicate.
Lactate assay
The levels of lactate production were measured with a lactate assay kit (Sigma-Aldrich Co.). 2×10⁶ cells were plated and transfected in 10-cm culture dishes and grown for 24 hours. FBS-free media was replaced into each culture dish for a further incubation of 8 hours. Lactate production was measured with culture media collected from each sample according to the manufacturer’s protocol and the optical density was recorded at 570 nm.
Western blot analysis
Cells were transfected and grown in 6-well plates, harvested and lysed with lysis buffer containing 10 nM Tris-HCl, 5 mM EDTA, 50 nM NaCl, 50 mM sodium fluoride, 30 mM sodium pyrophosphate, 1% Triton-X, 200 μM sodium orthovanadate, 1 mM phenylmethylsulfonyl fluoride, 1 μg/mL pepstatin, 2 μg/mL leupeptin and 5 μg/mL aprotinin. Protein concentration in the cell lysates was determined using the BCA protein assay kit (Thermo Fisher Scientific). Equal amounts of whole protein extracts were separated on 10% SDS-PAGE gels for detecting expression of ECM1 and internal control β-actin, respectively. After transferred to polyvinyl difluoride membranes, samples were blocked in 5% skimmed milk in TBST for 1 hour and then incubated overnight with the specific antibodies (Abnova Corporation, Taipei City, Taiwan). The levels of proteins were detected with horseradish peroxidase-linked secondary antibodies and visualized using the ECL® System (GE Healthcare, Milan, Italy).
Immunohistochemical staining
Tissue specimens were fixed in 10% neutral formalin, embedded in paraffin, and cut into 4-μm sections. The sections were deparaffinized with xylene and alcohol, processed with antigen retrieval by being boiled in citrate buffer (0.01 M, PH 6.0) for 20 minutes and then cooled down at room temperature. After that, the slides were incubated in a 10% hydrogen peroxide solution for 15 minutes and washed with PBS for 5 minutes. The slides were then immunostained with primary antibody of rabbit anti-ECM1 (1:1,000) antibody (Abnova Corporation) at 4°C overnight. After rinsing with PBS for 5 minutes, the sections were incubated with FITC-conjugated secondary antibody and DAPI (Thermo Fisher Scientific) for 30 minutes. Being washed with PBS for three times, the signal was detected under a fluorescent microscope (DM IL LED, Leica Microsystems).
Statistical analyses
The results reported were obtained from at least three independent experiments and the data were expressed as mean ± SD. Statistical tests were performed by Student’s t-test using the GraphPad Prism 7 software package (GraphPad Software, Inc., La Jolla, CA, USA) (www.graphpad.com/) and the significant differences were considered at P<0.05, P<0.01, P<0.001.
Results
The ECM1 level was upregulated in BCa
To explore the effects of ECM1 on BCa development, we first examined the relative expression levels in BCa tissues (from 17 BCa patients, characterized in Table 1) and 2 cell lines by using qRT-PCR and Western blot. The ECM1 levels were separately normalized to pair-matched adjacent noncancerous tissues or control cell lines. The results showed that the expression of ECM1 was upregulated in 82.3% of cancer tissues (14/17) compared with noncancerous counterparts (Figure 1A). We further confirmed the expression pattern by Western blot (Figure 1B) and immunohistochemical staining (Figure 1C) in one patient with low ECM1 mRNA expression and 2 patients with higher mRNA expression of ECM1 as representatives. ECM1 was mainly expressed in the cytoplasm of BCa cells (Figure 1C). In addition, RNA expression data from The Cancer Genome Atlas (TCGA) indicated that patients with higher levels of ECM1 had poorer survival than those with lower expression by using the Kaplan–Meier method (Figure 1D), and that increased ECM1 levels were highly correlated with BCa clinical pathological grading (Figure 1E). We next verified that the expression of ECM1 was increased in 5637 cells and BIU-87 cells in contrast to the normal bladder cell line SV-HUC1 (Figure 1F and G). Together, these results indicate that the expression of ECM1 is significantly elevated in BCa and that ECM1 may play an oncogenic role in BCa progression.
 | Table 1 Characteristics of BCa patients |
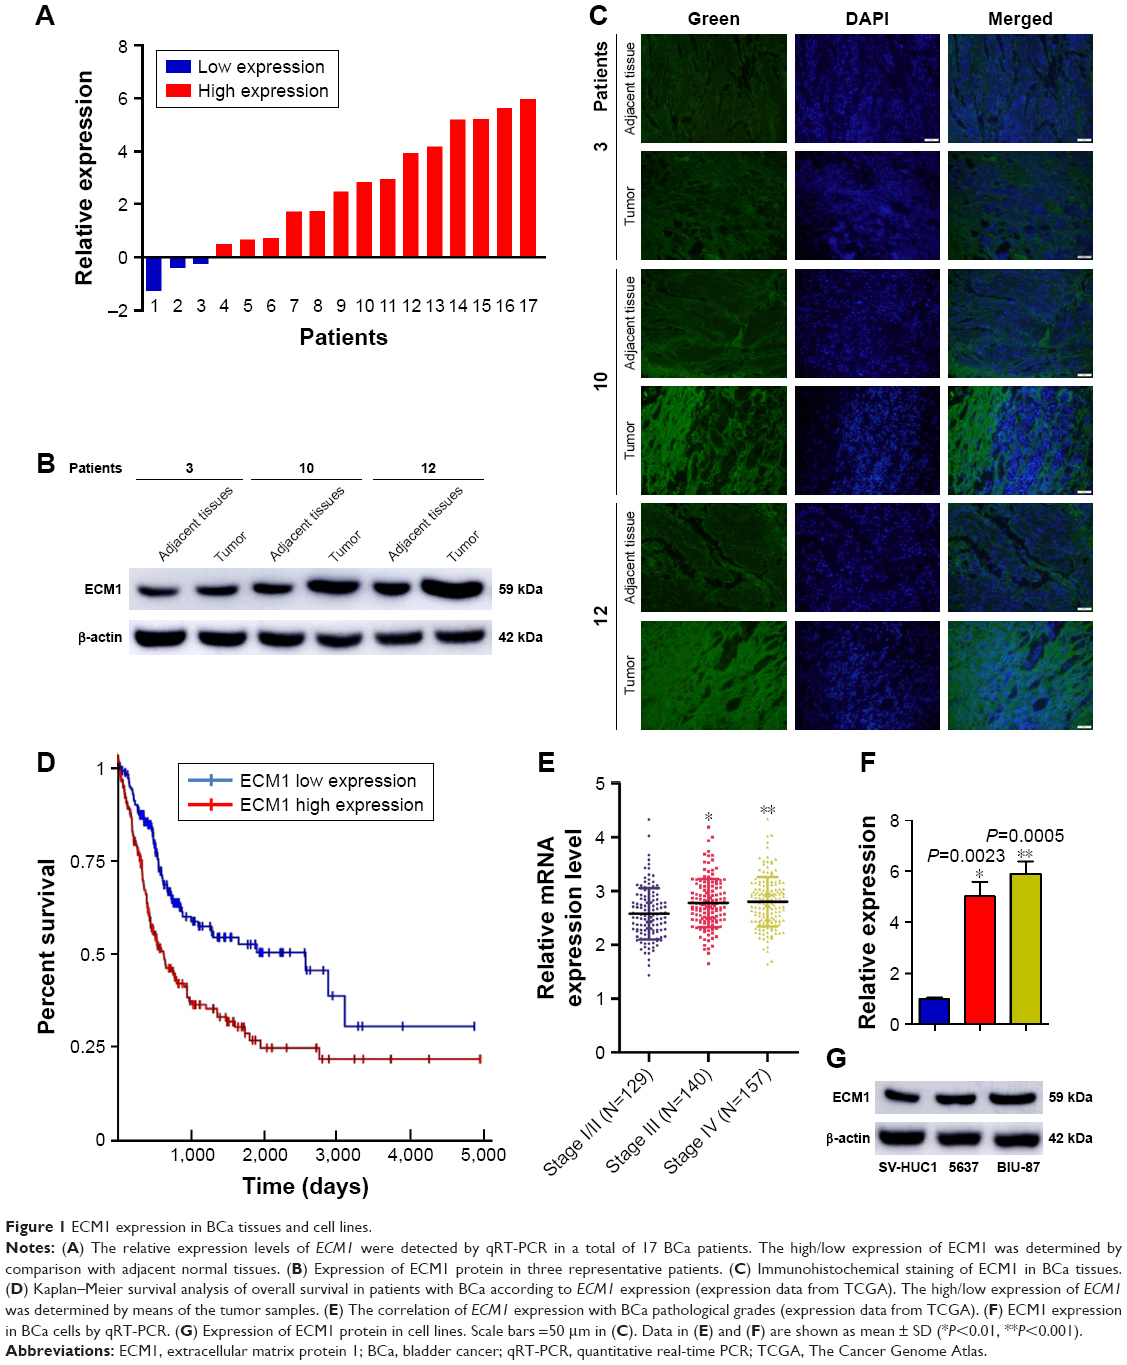 | Figure 1 ECM1 expression in BCa tissues and cell lines. |
Knockdown of ECM1 suppressed BCa cell growth
The functional role of ECM1 on cell proliferation in BCa was tested by CCK-8, luminescent cell viability assay, and EdU incorporation assays. The relative expression levels of ECM1 were obviously decreased in 5637, BIU-87, T24 and SW780 cells by shRNA (Figure 2A and E). The CCK-8 assay and luminescent cell viability assay showed that knockdown of ECM1 significantly suppressed cell proliferation compared with negative controls (Figure 2B, F–I). The EdU assay was conducted to further detect function of ECM1 in promoting cell proliferation. As shown in Figure 2C, in contrast to the NC group, the rate of EdU positive cells was significantly decreased in the shECM1 group. The quantitative results proved that the number of EdU positive cells in the shECM1 group was obviously reduced in 5637 and BIU-87 cells (Figure 2D). These data further support the notion that ECM1 may promote cell proliferation in BCa.
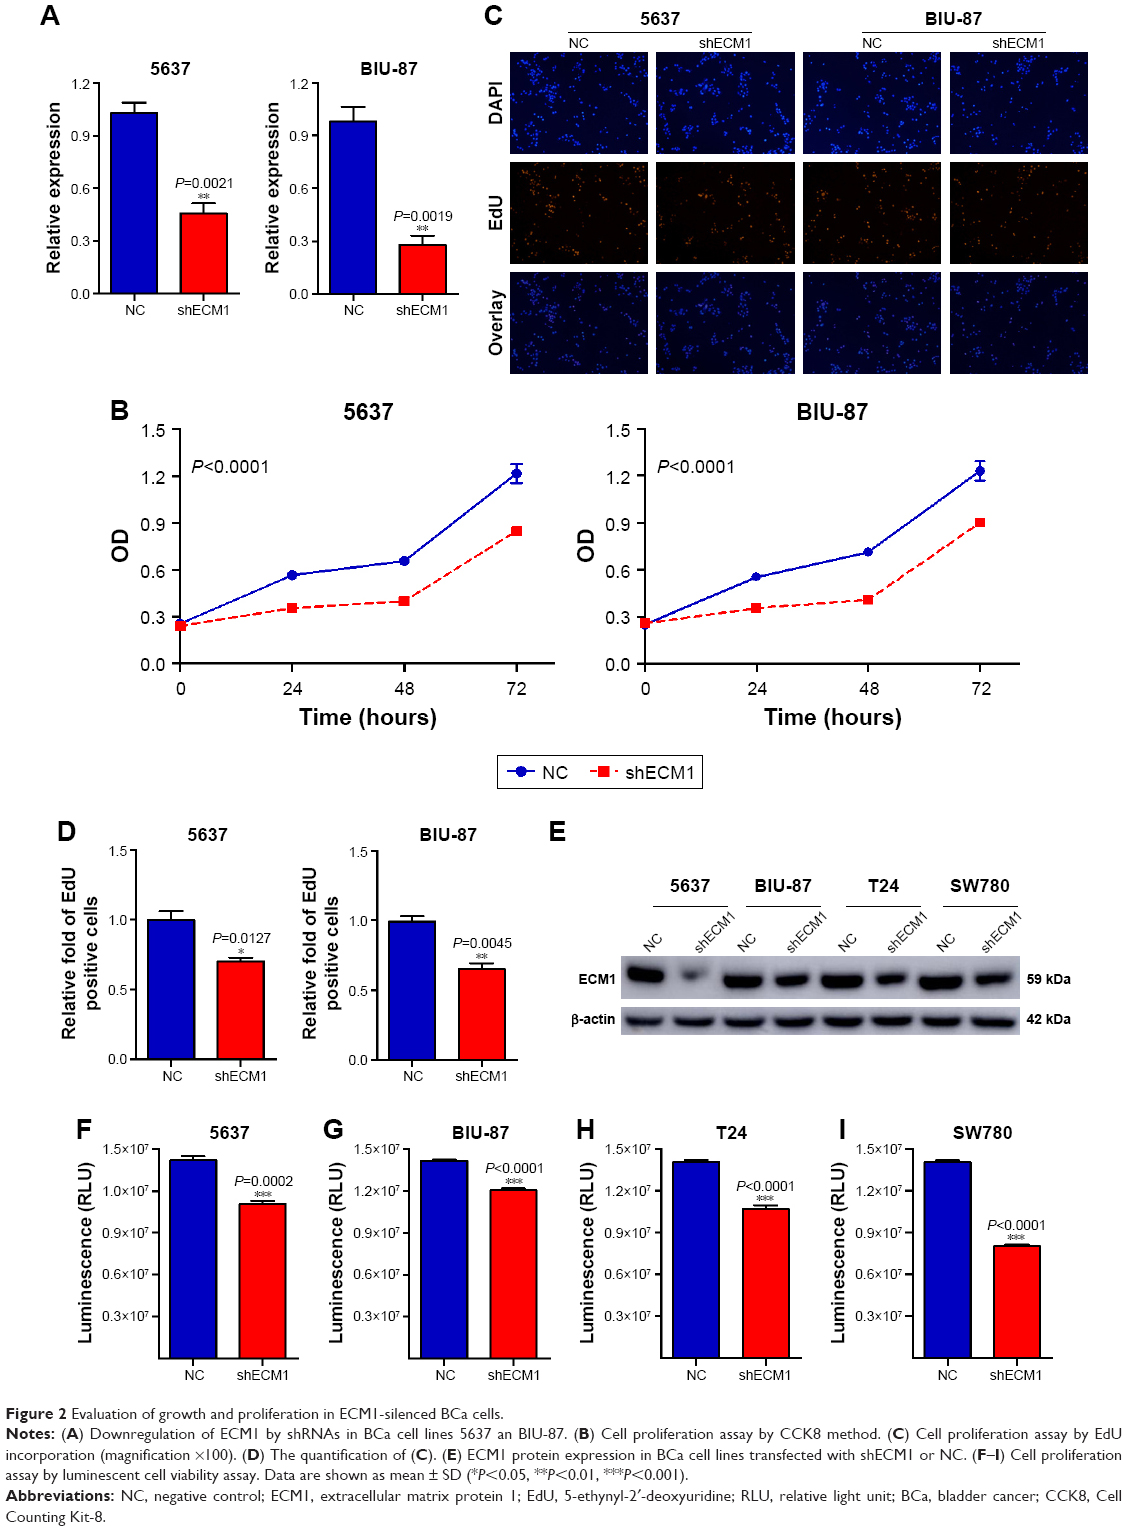 | Figure 2 Evaluation of growth and proliferation in ECM1-silenced BCa cells. |
Knockdown of ECM1 inhibited cell migration and invasion
The impacts of ECM1 on BCa cell migration were investigated by wound-healing assay. The results showed that the migration rates of the cells with silenced-ECM1 were obviously repressed compared with those NC groups (Figure 3A and C). The quantification of cell migration showed a significant diminution in cells treated with ECM1 shRNA compared with negative controls (Figure 3B and D). Subsequently, we assessed the effect of ECM1 on cell invasion with transwell assay. As shown in Figure 3E–G, compared with the control group, knockdown of ECM1 significantly decreased the number of invading cells. These results collectively suggest that ECM1 silencing may affect the metastatic capacity of both cell lines by inhibiting cell migration and invasion.
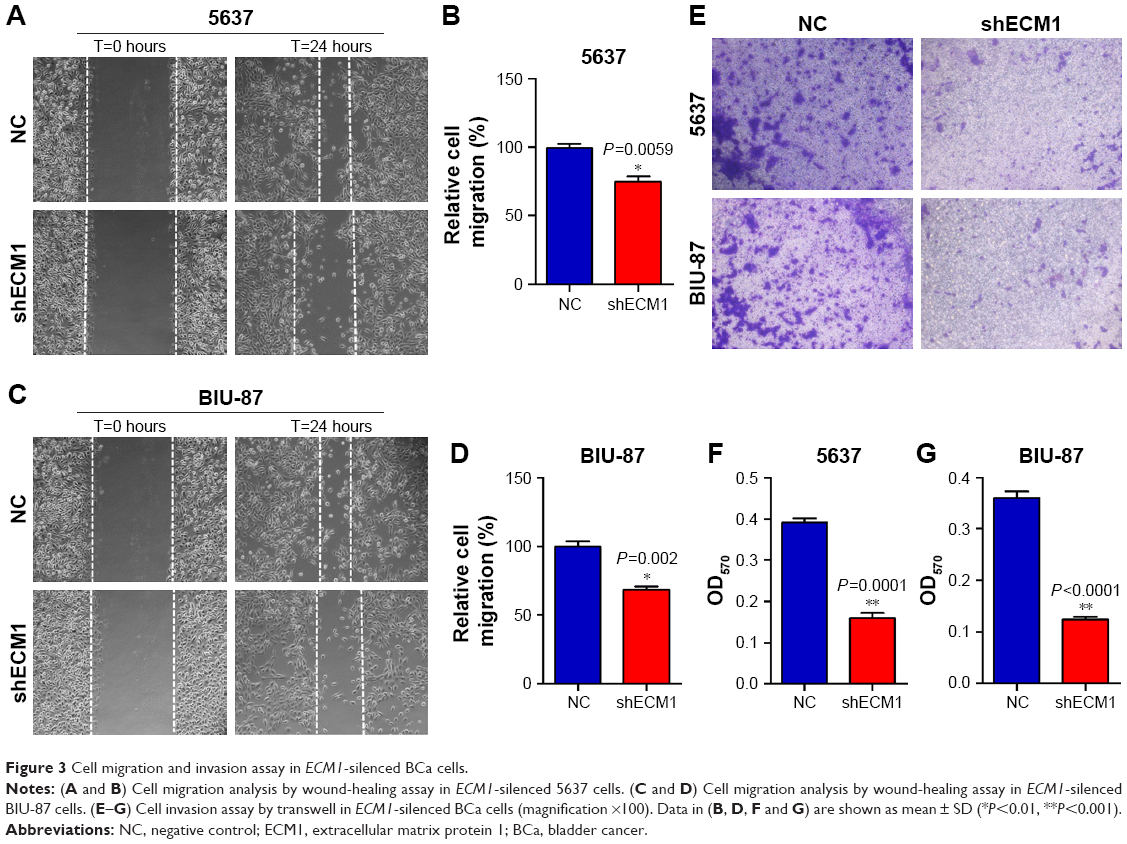 | Figure 3 Cell migration and invasion assay in ECM1-silenced BCa cells. |
Knockdown of ECM1 changed cell apoptosis and gene expression
Flow cytometry assay was performed to detect the cell apoptotic changes caused by knockdown of ECM1 in BCa cells. Our results showed that there was a higher ratio of apoptotic cells in ECM1-silenced 5637 and BIU-87 cells compared with those of negative control cells (Figure 4A and C). The quantitative results also confirmed these results (Figure 4B and D). The Warburg effect is an oncogenic metabolic switch that is commonly observed in cancer cells. We demonstrated that silencing of ECM1 reduced the expression of genes involved in Warburg effect regulation, including GLUT1, LDHA, and HIF-1α (Figure 4E and F). Consistent with this result, we detected lower levels of lactate production in ECM1-silenced cells, further confirming the involvement of Warburg effects (Figure 4G and H). Together, these findings suggest that loss-of-function of ECM1 induced apoptosis of BCa and the Warburg effect might be involved in the development of BCa.
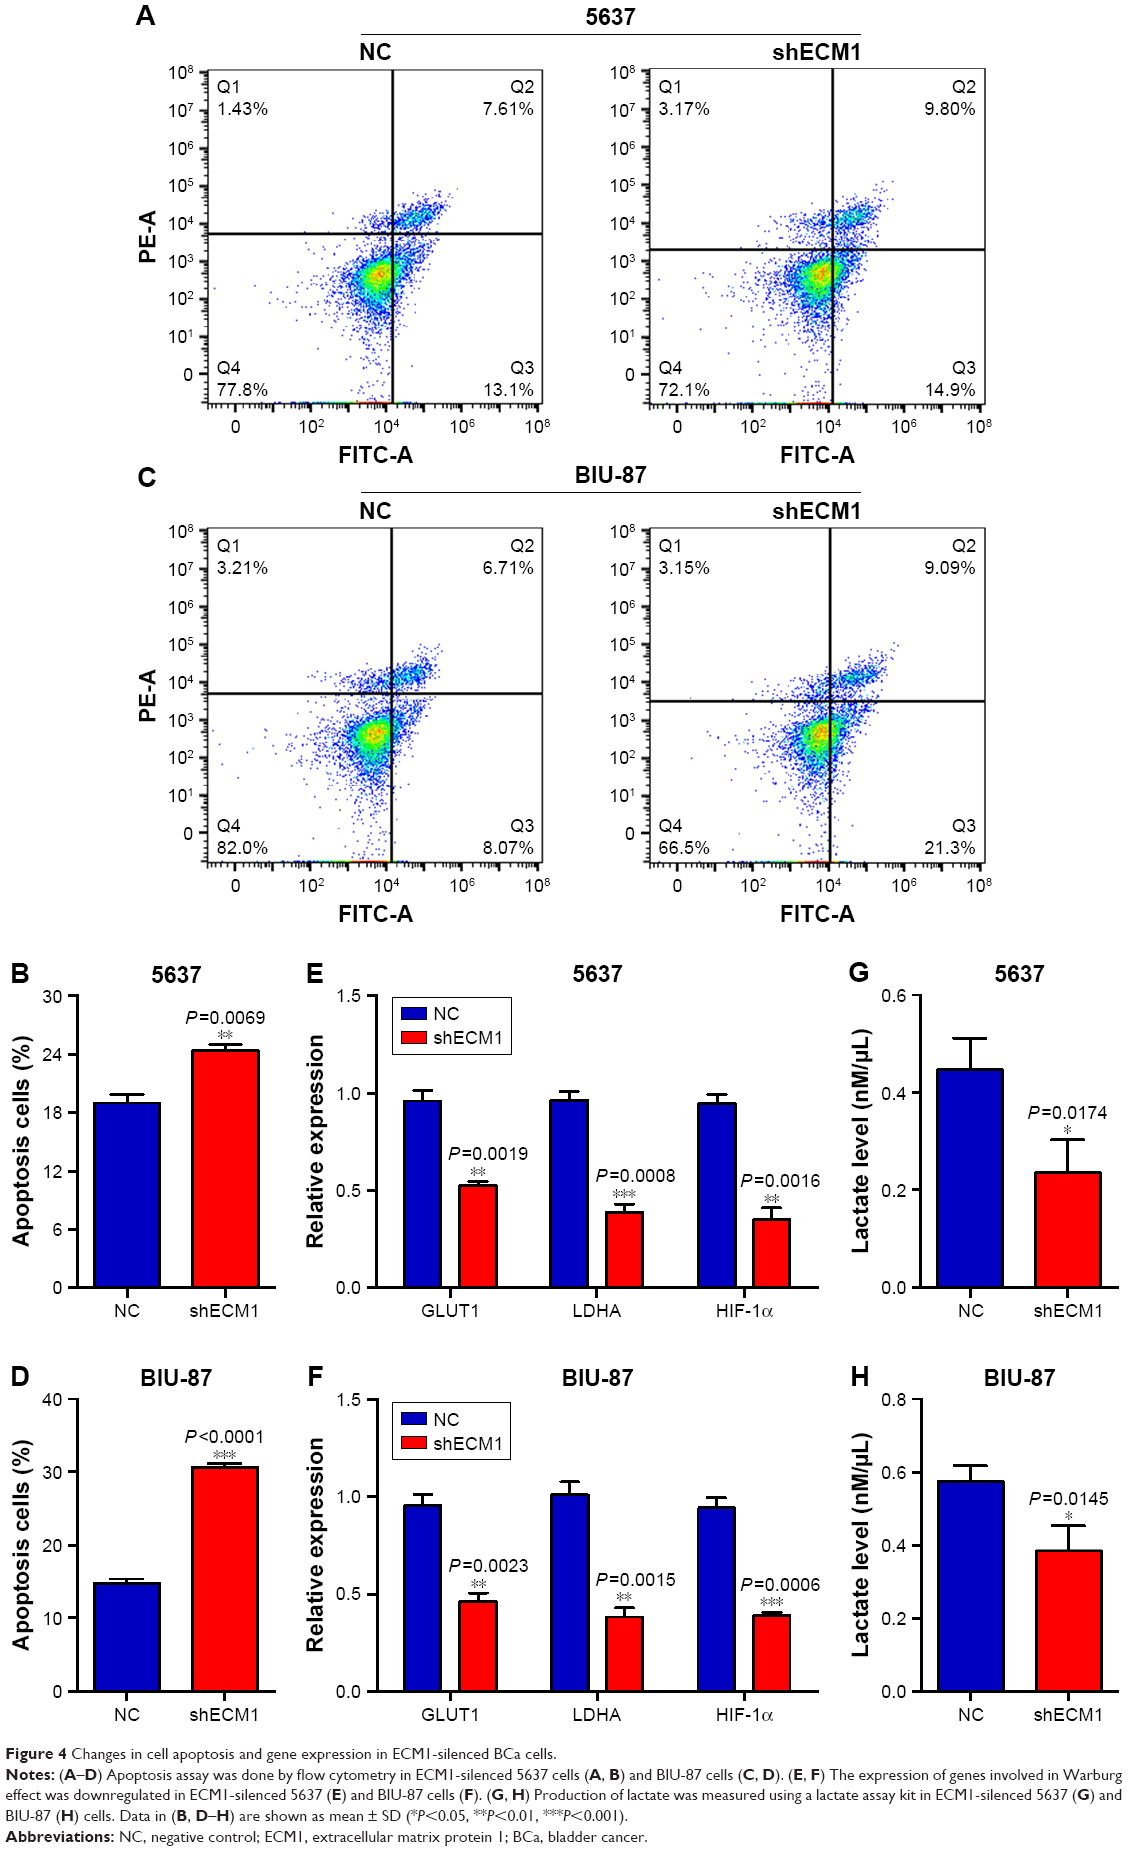 | Figure 4 Changes in cell apoptosis and gene expression in ECM1-silenced BCa cells. |
Discussion
BCa is one of the most common malignancies worldwide, imposing heavy economic burdens on both the society and individuals.19,20 Our study demonstrated that ECM1 was highly expressed in BCa tissues, cell lines, and highly correlated with the histological grades and poor survival in patients with BCa. Knockdown of ECM1 in BCa cells affected not only several cellular characteristics, but also affected the expression of genes involved in the Warburg effect. As such, we propose that ECM1 is a key regulator in the occurrence and progression of BCa. ECM1 overexpression has been correlated with a poor prognosis in patients with breast cancer11,21 and hepatocellular cancer.22 This is consistent with the elevated expression of ECM1 in BCa specimens compared to the normal counterparts from the same patients, suggesting its role in carcinogenesis and invasiveness of BCa cells.
It has been speculated that ECM1 as a “biological glue” binding to components of the dermal-epidermal junction in the framework of normal skin.23 Tumor cell invasion needs several steps, such as extracellular matrix adhesion and degradation, cell migration and detachment. Altered expression of this “glue” in tumor cells might alter attachment and invasion, and subsequently affect metastasis and prognosis. Indeed, our results demonstrated that knockdown of ECM1 by shRNA in 5637 and BIU-87 cells resulted in alterations in cell proliferation, migration, invasion and apoptosis. Similar results have been reported in cholangiocarcinoma cell lines with ECM1 silenced.10,21
Because that one gene is unlikely to be the sole effector in carcinogenesis, we noted that ECM1 does indeed appear to regulate the expression of genes known to be important in Warburg effect regulation. Knockdown of ECM1 reduced cell proliferation and invasiveness by inhibiting the expression of GLUT1, LDHA and HIF-1α. Similar results have been observed in breast cancer cell line BT-474.8 The Warburg effect mediates a metabolic switch for ATP production from oxidative phosphorylation to glycolysis, converting most of the incoming glucose to lactate.24 Just as we expected, the lactate production was significantly decreased in ECM1-silenced cells, confirming the involvement of Warburg effect in the development of BCa.
Conclusion
ECM1 was highly expressed in BCa tissues and cell lines. Downregulation of ECM1 inhibited cell proliferation, migration and invasion by regulating the Warburg effect related genes. Therefore, our findings provide novel insights into the role of ECM1 in BCa development.
Acknowledgments
This work is funded by the China Postdoctoral Science Foundation (2018M633220), the National Key Basic Research Program of China (973 Program; 2014CB745201), the National Natural Science Foundation of China (81772737, 81602224), the National Science Foundation Projects of Guangdong Province (2017B030301015, 2016A030310031), the Shenzhen Municipal Government of China (JCYJ20170413161749433, JSGG20160301161836370), the Sanming Project of Shenzhen Health and Family Planning Commission (SZSM201412018, SZSM201512037), and the High Level University’s Medical Discipline Construction (2016031638).
Disclosure
The authors report no conflicts of interest in this work.
References
Siegel RL, Miller KD, Jemal A. Cancer statistics, 2018. CA Cancer J Clin. 2018;68(1):7–30. | ||
Rose TL, Milowsky MI. Improving systemic chemotherapy for bladder cancer. Curr Oncol Rep. 2016;18(5):27. | ||
Rouanne M, Loriot Y, Lebret T, Soria JC. Novel therapeutic targets in advanced urothelial carcinoma. Crit Rev Oncol Hematol. 2016;98:106–115. | ||
Abbosh PH, McConkey DJ, Plimack ER. Targeting signaling transduction pathways in bladder cancer. Curr Oncol Rep. 2015;17(12):58. | ||
Liu Y, Zhan Y, Chen Z, et al. Directing cellular information flow via CRISPR signal conductors. Nat Methods. 2016;13(11):938–944. | ||
Kurtova AV, Xiao J, Mo Q, et al. Blocking PGE2-induced tumour repopulation abrogates bladder cancer chemoresistance. Nature. 2015;517(7533):209–213. | ||
Cancer Genome Atlas Research Network. Comprehensive molecular characterization of urothelial bladder carcinoma. Nature. 2014;507(7492):315–322. | ||
Lee KM, Nam K, Oh S, Lim J, Lee T, Shin I. ECM1 promotes the Warburg effect through EGF-mediated activation of PKM2. Cell Signal. 2015;27(2):228–235. | ||
Kebebew E, Peng M, Reiff E, McMillan A. Diagnostic and extent of disease multigene assay for malignant thyroid neoplasms. Cancer. 2006;106(12):2592–2597. | ||
Xiong GP, Zhang JX, Gu SP, Wu YB, Liu JF. Overexpression of ECM1 contributes to migration and invasion in cholangiocarcinoma cell. Neoplasma. 2012;59(4):409–415. | ||
Lee KM, Nam K, Oh S, et al. Extracellular matrix protein 1 regulates cell proliferation and trastuzumab resistance through activation of epidermal growth factor signaling. Breast Cancer Res. 2014;16(6):479. | ||
Wu Q, Li X, Yang H, Lu C, You J, Zhang Z. Extracellular matrix protein 1 is correlated to carcinogenesis and lymphatic metastasis of human gastric cancer. World J Surg Oncol. 2014;12:132. | ||
Gu M, Guan J, Zhao L, Ni K, Li X, Han Z. Correlation of ECM1 expression level with the pathogenesis and metastasis of laryngeal carcinoma. Int J Clin Exp Pathol. 2013;6(6):1132–1137. | ||
Wang X, Peng Y, Xie M, et al. Identification of extracellular matrix protein 1 as a potential plasma biomarker of ESCC by proteomic analysis using iTRAQ and 2D-LC-MS/MS. Proteomics Clin Appl. 2017;11(9–10):1600163. | ||
Wang L, Yu J, Ni J, et al. Extracellular matrix protein 1 (ECM1) is over-expressed in malignant epithelial tumors. Cancer Lett. 2003;200(1):57–67. | ||
Lal G, Hashimi S, Smith BJ, et al. Extracellular matrix 1 (ECM1) expression is a novel prognostic marker for poor long-term survival in breast cancer: a hospital-based cohort study in Iowa. Ann Surg Oncol. 2009;16(8):2280–2287. | ||
Han Z, Ni J, Smits P, et al. Extracellular matrix protein 1 (ECM1) has angiogenic properties and is expressed by breast tumor cells. FASEB J. 2001;15(6):988–994. | ||
López-Marure R, Contreras PG, Dillon JS. Effects of dehydroepiandrosterone on proliferation, migration, and death of breast cancer cells. Eur J Pharmacol. 2011;660(2–3):268–274. | ||
Ferlay J, Soerjomataram I, Dikshit R, et al. Cancer incidence and mortality worldwide: sources, methods and major patterns in GLOBOCAN 2012. Int J Cancer. 2015;136(5):E359–E386. | ||
Breyer J, Wirtz RM, Laible M, et al. ESR1, ERBB2, and Ki67 mRNA expression predicts stage and grade of non-muscle-invasive bladder carcinoma (NMIBC). Virchows Arch. 2016;469(5):547–5521. | ||
Lee KM, Nam K, Oh S, et al. ECM1 regulates tumor metastasis and CSC-like property through stabilization of β-catenin. Oncogene. 2015;34(50):6055–6065. | ||
Chen H, Jia WD, Li JS, et al. Extracellular matrix protein 1, a novel prognostic factor, is associated with metastatic potential of hepatocellular carcinoma. Med Oncol. 2011;28(Suppl 1):318–325. | ||
Sercu S, Zhang L, Merregaert J. The extracellular matrix protein 1: its molecular interaction and implication in tumor progression. Cancer Invest. 2008;26(4):375–384. | ||
Semenza GL, Artemov D, Bedi A, et al. The metabolism of tumours: 70 years later. Novartis Found Symp. 2001;240:251–260. |
 © 2019 The Author(s). This work is published and licensed by Dove Medical Press Limited. The full terms of this license are available at https://www.dovepress.com/terms.php and incorporate the Creative Commons Attribution - Non Commercial (unported, v3.0) License.
By accessing the work you hereby accept the Terms. Non-commercial uses of the work are permitted without any further permission from Dove Medical Press Limited, provided the work is properly attributed. For permission for commercial use of this work, please see paragraphs 4.2 and 5 of our Terms.
© 2019 The Author(s). This work is published and licensed by Dove Medical Press Limited. The full terms of this license are available at https://www.dovepress.com/terms.php and incorporate the Creative Commons Attribution - Non Commercial (unported, v3.0) License.
By accessing the work you hereby accept the Terms. Non-commercial uses of the work are permitted without any further permission from Dove Medical Press Limited, provided the work is properly attributed. For permission for commercial use of this work, please see paragraphs 4.2 and 5 of our Terms.