")
Back to Journals » Vascular Health and Risk Management » Volume 11
Extended-release niacin/laropiprant significantly improves lipid levels in type 2 diabetes mellitus irrespective of baseline glycemic control
Authors Bays H, Brinton E, Triscari J, Chen E, Maccubbin D, MacLean AA, Gibson K, Ruck RA, Johnson-Levonas AO, O'Neill EA, Mitchel Y
Received 10 July 2014
Accepted for publication 7 October 2014
Published 24 February 2015 Volume 2015:11 Pages 165—172
DOI https://doi.org/10.2147/VHRM.S70907
Checked for plagiarism Yes
Review by Single anonymous peer review
Peer reviewer comments 3
Editor who approved publication: Dr Daniel Duprez
Harold E Bays,1 Eliot A Brinton,2 Joseph Triscari,3 Erluo Chen,3 Darbie Maccubbin,3 Alexandra A MacLean,3 Kendra L Gibson,3 Rae Ann Ruck,3 Amy O Johnson-Levonas,3 Edward A O’Neill,3 Yale B Mitchel3
1Louisville Metabolic & Atherosclerosis Research Center (L-MARC), Louisville, KY, USA; 2Utah Foundation for Biomedical Research, Salt Lake City, UT, USA; 3Merck & Co, Inc., Whitehouse Station, NJ, USA
Background: The degree of glycemic control in patients with type 2 diabetes mellitus (T2DM) may alter lipid levels and may alter the efficacy of lipid-modifying agents.
Objective: Evaluate the lipid-modifying efficacy of extended-release niacin/laropiprant (ERN/LRPT) in subgroups of patients with T2DM with better or poorer glycemic control.
Methods: Post hoc analysis of clinical trial data from patients with T2DM who were randomized 4:3 to double-blind ERN/LRPT or placebo (n=796), examining the lipid-modifying effects of ERN/LRPT in patients with glycosylated hemoglobin or fasting plasma glucose levels above and below median baseline levels.
Results: At Week 12 of treatment, ERN/LRPT significantly improved low-density lipoprotein cholesterol, high-density lipoprotein cholesterol (HDL-C), non-high-density lipoprotein cholesterol, triglycerides, and lipoprotein (a), compared with placebo, with equal efficacy in patients above or below median baseline glycemic control. Compared with placebo, over 36 weeks of treatment more patients treated with ERN/LRPT had worsening of their diabetes and required intensification of antihyperglycemic medication, irrespective of baseline glycemic control. Incidences of other adverse experiences were generally low in all treatment groups.
Conclusion: The lipid-modifying effects of ERN/LRPT are independent of the degree of baseline glycemic control in patients with T2DM (NCT00485758).
Keywords: lipid-modifying agents, hyperglycemia, LDL, HDL, triglycerides
Introduction
Patients with type 2 diabetes mellitus (T2DM) are at a higher risk of cardiovascular disease than patients without T2DM,1 and this is related in part to a characteristic dyslipidemia consisting of elevated triglyceride (TG) and decreased high-density lipoprotein cholesterol (HDL-C) levels.2–4 Statin therapy substantially reduces low-density lipoprotein cholesterol (LDL-C) levels but has modest effects on HDL-C levels. In contrast, niacin (nicotinic acid) modestly lowers LDL-C but decreases TG and lipoprotein (a) (Lp[a]), and significantly raises HDL-C levels.5–9 Widespread use of niacin is hindered by poor tolerability, primarily due to flushing symptoms (that is, redness, warmth, itching, and tingling of the skin).10–14 Laropiprant (LRPT), a flushing pathway inhibitor, reduces the incidence and intensity of niacin-induced flushing when combined with extended-release niacin/laropiprant (ERN/LRPT; Merck & Co, Inc.), without compromising the beneficial lipid effect of niacin.15,16
Niacin monotherapy trials supported a decrease in atherosclerotic cardiovascular disease events; but the relevance of these findings when used with statins was unclear.17,18 Two recent clinical outcomes trials, however, failed to demonstrate a benefit when niacin was added to aggressive LDL-C lowering with statin treatment.19–21 The larger of these was the Heart Protection Study 2–Treatment of HDL to Reduce the Incidence of Vascular Events (HPS2-THRIVE) trial,20 wherein the addition of ERN/LRPT to statin-treated patients with low baseline LDL-C levels failed to provide any further reduction in atherosclerotic coronary heart disease (CHD), compared to statin without ERN/LRPT.21
Approximately one-third of HPS2-THRIVE subjects had a history of both T2DM and cardiovascular disease. In the cohort with T2DM, similar to the entire cohort, ERN/LRPT did not reduce cardiovascular events. Further, niacin increased glucose levels in patients with T2DM and increased T2DM in those without the diagnosis at study entry.21 Given that hyperglycemia is often associated with dyslipidemia and that each may exacerbate the other,22 the current study is a post hoc analysis of data from an earlier ERN/LRPT trial23 examining the potential influence of baseline glycemic control on the effects of ERN/LRPT on lipids, lipoproteins, and high-sensitivity C-reactive protein (hs-CRP) in patients with T2DM.
Methods
Study design
This is a post hoc analysis of the lipid-modifying efficacy of (ERN/LRPT) in subgroups of patients with T2DM with better or poorer glycemic control. The data for this analysis were collected from a worldwide, multicenter (32 sites in the United States and 62 international sites), double-blind, randomized, placebo-controlled, parallel group study of dyslipidemic patients with T2DM (MK-0524A-069; NCT00485758).23 The study included a 4-week lipid-modifying run-in period (if needed to attain LDL-C <115 mg/dL), followed by a 36-week double-blind treatment period. Eligible patients were randomized 4:3 to ERN/LRPT 1 g/20 mg (1 tablet) or placebo. After 4 weeks of double-blind treatment, doses were doubled, increasing the ERN/LRPT to 2 g/40 mg (2 tablets) for the remainder of the study. No adjustments to background lipid-modifying regimens were made for the first 12 weeks of the study. The study was conducted under the guidelines of Good Clinical Practice and approved by the appropriate institutional review boards and regulatory agencies. Written consent was obtained from all patients prior to the conduct of any study-related procedures.
Patients
Patients were ≥18 and ≤80 years of age, with a confirmed diagnosis of T2DM, LDL-C ≥60 and <115 mg/dL (>1.55 and <2.95 mmol/L), and TG ≤500 mg/dL (≤5.65 mmol/L). If taking antidiabetes mellitus medication, the dose must have been stable for at least 3 months prior to Visit 1. Patients were excluded if they had the following laboratory values at Visit 1: creatinine >2.0 mg/dL, creatine kinase >2× upper limit of normal (ULN), alanine aminotransferase and aspartate aminotransferase >1.5× ULN, or an abnormal thyroid-stimulating hormone level (>20% above the ULN). Other exclusion criteria included glycosylated hemoglobin (HbA1c) >8.5% at screening visit or Visit 1, recent diagnosis of T2DM or initiation of antiobesity therapy within 3 months of Visit 1, use of systemic corticosteroids, and use of cyclical hormone contraceptives or other intermittent hormone therapies in female patients.
Permitted lipid-altering therapies included fish oils, 3-hydroxy-3-methylglutaryl-coenzyme A (HMG-CoA) reductase inhibitors (“statins”), fibrates (gemfibrozil, fenofibrate), ezetimibe, ezetimibe/simvastatin combination tablet, and bile acid sequestrants. Patients on therapies including niacin (>50 mg/day), Cholestin™, and fibrates in combination with a statin were excluded from the study.
Efficacy endpoints
The endpoints in this analysis were percent change from baseline in LDL-C, HDL-C, TG, total cholesterol, non–HDL-C, Apo B, Apo A-I, Lp(a) and hs-CRP, compared to placebo, at Week 36.
Statistical methods
Efficacy analyses
The analysis was performed on data from the population of patients who received at least one dose of study medication, had a baseline HbA1c or fasting plasma glucose (FPG) value, had baseline lipid efficacy measurements, and had at least one postrandomization efficacy measurement. Missing data were imputed using the last-observation-carried forward method.
The lipid-modifying effects of ERN/LRPT versus placebo were compared across subgroups defined by baseline HbA1c (above and below median) and baseline FPG (above and below median).
Continuous efficacy results for mean percent change (95% confidence interval [CI]) from baseline at Week 12 in normally distributed parameters (that is, LDL-C, HDL-C, non–HDL-C, Apo B, Apo A-I, and total cholesterol) were analyzed using a parametric analysis of variance model with terms for treatment, sex, baseline efficacy variable as a covariate in each of the subgroups. Least squares means and 95% CI within each subgroup were computed and used to quantify the differences between treatment groups. P-values for the treatment-by-subgroup interaction term were used to test the consistency of the treatment effect across the subgroups.
Continuous efficacy results for median percent change from baseline (95% CI) in nonnormally distributed parameters (that is, TG, Lp[a], hs-CRP) were analyzed using an analysis of variance model on ranks of these efficacy variables with terms for treatment, sex, and baseline efficacy variable as a covariate in each of the subgroups. Differences between treatment groups were quantified as differences in medians and 95% CIs using Hodges–Lehmann estimates within each patient subgroup. P-values for the treatment-by-subgroup interaction term were used to test the consistency of the treatment effect across the subgroups.
No multiplicity adjustments were applied because of the exploratory nature of this post hoc analysis. Between-group differences and treatment-by-subgroup interaction tests with a P-value <0.050 were considered statistically significant.
Safety analyses
Safety analyses were performed on all randomized patients who received at least one dose of study medication.
Selected safety endpoints (worsening of diabetes [defined as experiencing an investigator-reported diabetes-related adverse experience and/or requiring intensification of antidiabetes medication], intensification of antihyperglycemic medication, worsening of glycemic control [by HbA1c or FPG levels], hepatitis-related adverse events, consecutive aspartate aminotransferase and/or alanine aminotransferase elevations ≥3× ULN, confirmed adjudicated cardiovascular events, and creatine kinase elevations ≥10× ULN [with or without muscle symptoms]) were summarized by patient subgroups defined by baseline HbA1c and baseline FPG, through Week 36.
The changes from baseline in HbA1c (%) and in FPG (mg/dL) at Week 36 were summarized by treatment arm or group in each subcategory of the subgroups.
Results
Efficacy
With regard to patient demographics and baseline laboratory results, other than the anticipated differences in HbA1c and FPG, the patient subgroups selected for lower or higher HbA1c and lower or higher FPG appeared similar (Table 1). In addition, the ERN/LRPT and placebo treatment groups within the below-median (≤6.8%) HbA1c subgroup were similar with regard to baseline demographics and efficacy parameters, as were the treatment groups in the above-median (>6.8%) subgroup (Table 1). The treatment groups within the below-median (≤129 mg/dL) or above-median (>129 mg/dL) FPG subgroups were also similar (Table 2).
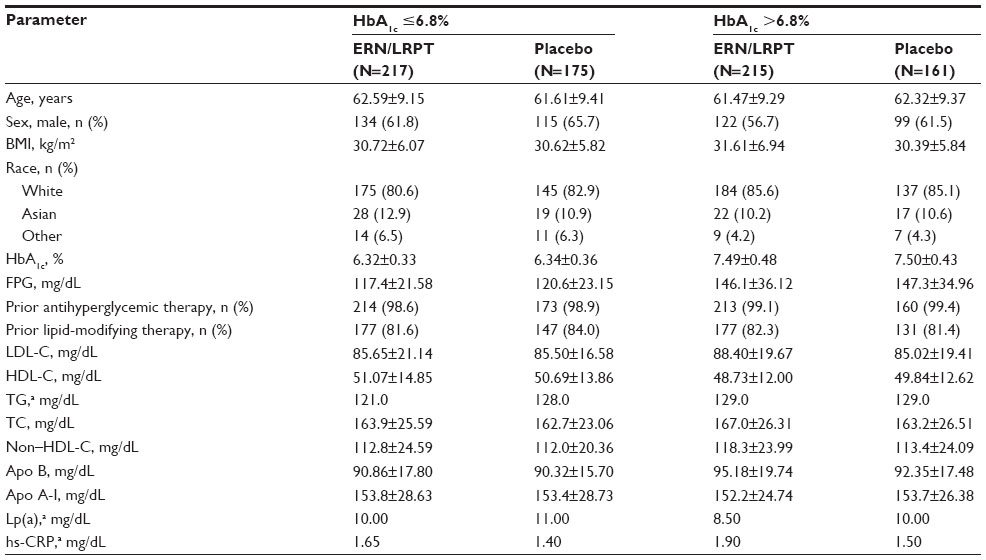 | Table 1 Demographic and baseline characteristics of study population by HbA1c subgroups |
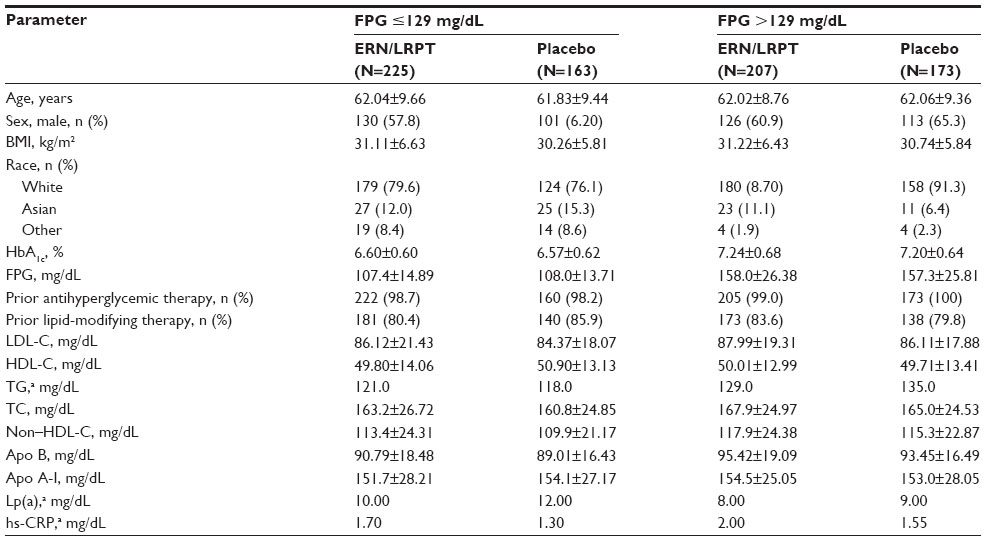 | Table 2 Demographic and baseline characteristics of study population by FPG subgroups |
All lipid efficacy endpoints evaluated demonstrated significant improvements from baseline in patients with T2DM irrespective of higher or lower baseline glycemia (P<0.05 or P<0.001), with the exception of hs-CRP in the HbA1c >6.8% subgroup (Table 3). The differences in magnitude or direction of the between-subgroup differences in lipid and apolipoprotein parameters were similar across patient subgroups defined by baseline glycemic control. The placebo-adjusted increases from baseline in HDL-C and Apo A-1 in patients with FPG >129 mg/dL were somewhat less compared with those observed in patients with FPG ≤129 mg/dL, though these differences were not statistically significant (P=0.089 and 0.052, respectively).
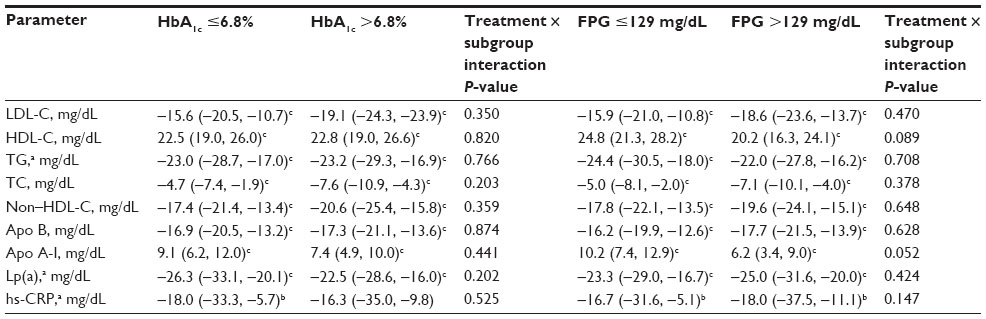 | Table 3 Between-group differences (95% CI) in LS mean percentage changes from baseline in plasma lipids and proteins at Week 12 (extended-release niacin/laropiprant–placebo) |
Safety
Over 36 weeks of treatment, the incidences of liver, muscle, and cardiovascular adverse events were generally low in both treatment groups regardless of baseline glycemic control (Table 4). The incidences of consecutive elevations ≥3× ULN in alanine aminotransferase and/or aspartate aminotransferase (all asymptomatic and resolved with treatment cessation) were low in the ERN/LRPT and placebo groups regardless of baseline glycemic control. The only hepatitis-related AE occurred in the placebo group. No subject had myopathy or rhabdomyolysis, and there were no clinically meaningful increases in creatine kinase (that is, ≥10× ULN). The incidences of confirmed adjudicated cardiovascular adverse events were similarly low in both treatment groups in all patient subgroups (Table 4).
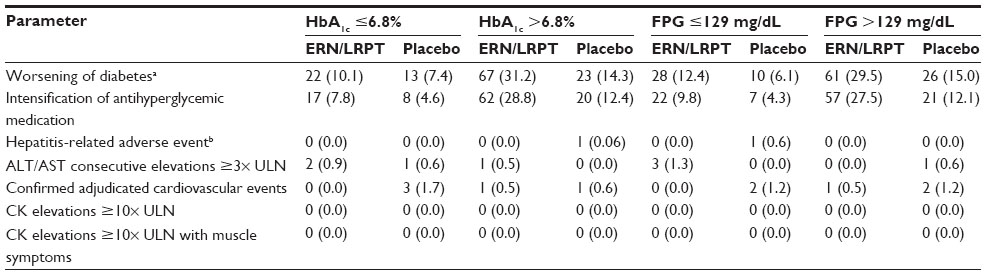 | Table 4 Summary of selected safety parameters at Week 36 |
Patients with T2DM treated with ERN/LRPT showed a greater incidence of worsened glucose control and greater intensification of antihyperglycemia medication than placebo-treated patients in both subgroups (Table 4).Worsening of T2DM and intensification of antihyperglycemic medication appeared to be greater in the ERN/LRPT-treated subgroup with higher baseline HbA1c and FPG (Table 4). Compared with the placebo-treated subjects in the subgroup with lower baseline HbA1c and FPG, worsening of glucose control and intensification of antihyperglycemic medication also occurred more frequently in the placebo-treated subjects with higher baseline HbA1c and FPG (Table 4).
With the exception of FPG in the subgroup with baseline FPG >129 mg/dL, both FPG and HbA1c increased from baseline in both placebo and active treatment groups at Week 36, irrespective of baseline glycemic control (Table 5). The ERN/LRPT-treated subgroups tended to exhibit increased mean values of HbA1c and FPG compared with the placebo-treated subgroups (Table 5). The magnitude of the between-group differences in FPG and HbA1c was generally consistent across patient subgroups defined by baseline glycemic control. There were small mean decreases in FPG in the ERN/LRPT and placebo groups in the subgroup of patients with baseline FPG values >129 mg/dL.
 | Table 5 Summary of mean change ± standard deviation from baseline in glucose-related parameters at Week 36 |
Discussion
Because of the improvements in multiple lipid and nonlipid parameters thought to be favorable,5–9 and because these lipid benefits were complementary to those of statins (further reductions in LDL-C, TG, and Lp[a] levels, as well as increases in HDL-C), and most importantly, because of CHD reduction in niacin monotherapy trials,17,18 the addition of niacin to statin therapy seemed likely to provide additional benefit in reducing CHD events.24 Clinical trials using validated flushing scales supported LRPT plus extended-release niacin as causing less flushing than extended-release niacin alone, which was of clinical importance because flushing was the most troubling adverse experience with niacin. Unfortunately, while the very large HPS2-THRIVE did report some additional lipid improvements with ERN/LRPT in statin-treated patients with low baseline LDL-C levels, the study failed to show that ERN/LRPT added any additional benefit in reducing risk of a major vascular event compared to statins alone.21 This result confirmed that of Atherothrombosis Intervention in Metabolic Syndrome with Low HDL/High Triglycerides: Impact on Global Health Outcomes (AIM-HIGH), another prior study wherein extended-release niacin without LRPT, also failed to add CHD outcomes benefits beyond statin alone, in patients with low baseline LDL-C levels.19
Prior to the results of these CVD endpoint studies, an emphasis was placed on determining the effects of ERN/LRPT in patients with T2DM, because while flushing was the most common and troubling symptomatic adverse experience, an increase in glucose level was among the most common adverse laboratory experiences. In a previous study of patients with T2DM, treatment with ERN/LRPT significantly increased HbA1c and FPG compared with placebo.23 Because elevated glucose levels are often associated with dyslipidemia, the present analysis examined the lipid efficacy and safety of ERN/LRPT in patients with T2DM who had baseline HbA1c and FPG above or below the median.
This is the first report to our knowledge assessing the lipid efficacy of niacin in patients with T2DM and differing levels of glycemic control. In this analysis of patients with T2DM, treatment with ERN/LRPT led to intensification of antidiabetes medication both with higher and lower baseline glycemia, and to a greater extent in patients with poorer baseline glucose control. Nonetheless, patients with higher or lower glycemic control did not differ with regard to the lipid effects of ERN/LRPT. As with efficacy, other than with regard to “Worsening of diabetes” and “Intensification of antidiabetic hyperglycemic medication”, safety and tolerability appeared to be generally similar irrespective of the level of baseline glycemic control. Consistent with observations in the current analysis, a previous report of the effects of ERN/LRPT on the entire cohort in this study observed that baseline HbA1c, glucose, insulin use, and sex were strong predictors of intensification of antidiabetic hyperglycemic medication, regardless of treatment.23 The absence of major between-group differences in treatment arm–associated changes in HbA1c or FPG, despite relatively large between-group differences in above-noted diabetes-related safety parameters, suggests that intensification of antihyperglycemic medication was generally effective at controlling any subgroup differential in ERN/LRPT treatment–associated loss of glycemic control.
One of the limitations of this trial is that while it evaluated patients with glycemia above or below the median, it did not specifically examine patients with truly low or high glycemia. Another limitation is that this was not a CHD outcomes trial. Therefore, it was impossible to determine if ERN/LRPT could reduce CHD in patients with T2DM, with either higher or lower glycemic parameters. After the failure of HPS2-THRIVE, the development of the ERN/LRPT combination agent was discontinued. Whether ERN without LRPT (as currently marketed) provides CHD benefits in patient with less-aggressive statin treatment, such as with LDL-C levels above the 50 to 70 mg/dL range, as suggested above (or with TG >200 mg/dL and HDL-C <32 mg/dL as suggested in a post hoc analysis of AIM-HIGH25), remains to be tested prospectively. The potential benefits of niacin also is largely unknown among patients with CHD or at CHD risk, who are also being treated with current standard-of-care antithrombotics, beta-blockers, and other antihypertensive agents, smoking cessation, improved diabetes mellitus management, and nutritional and physical activity intervention.
Thus, until further clinical trial data become available, clinicians must use their best judgment as to when niacin may be appropriate to add to statins for dyslipidemia treatment in the presence or absence of T2DM. The current study, however, suggests that in patients with T2DM, the clinician can have some assurance that niacin administered to patients with either higher or lower baseline glycemic control will receive similar improvements in lipid levels.
Conclusion
The lipid-modifying effects and short-term safety of ERN/LRPT are independent of the degree of baseline glycemic control in patients with T2DM.
Acknowledgments
This analysis was funded by Merck & Co, Inc., Whitehouse Station, NJ, USA. The authors gratefully acknowledge the assistance of Kristen Lewis and Kathleen Newcomb of Merck & Co, Inc., Whitehouse Station, NJ, USA, in the production and submission of the manuscript.
Disclosure
JT, EC, DM, AAM, KLG, RAR, AOJ-L, EAO and YBM are current or former employees of Merck & Co, Inc., Whitehouse Station, NJ, USA, and may own stock and/or hold stock options in the company. HEB has received research grants as investigator and honoraria as a consultant and has served on advisory board and speaker’s bureau for Merck & Co, Inc. EAB has received research grants and honoraria from Merck & Co, Inc.
References
Haffner SM. Dyslipidemia management in adults with diabetes. Diabetes Care. 2004;27(Suppl 1):S68–S71. | |
Gotto AM Jr. High-density lipoprotein cholesterol and triglycerides as therapeutic targets for preventing and treating coronary artery disease. Am Heart J. 2002;144:S33–S42. | |
Manzato E, Zambon A, Lapolla A, et al. Lipoprotein abnormalities in well-treated type II diabetic patients. Diabetes Care. 1993;16:469–475. | |
Mora S, Otvos JD, Rosenson RS, Pradhan A, Buring JE, Ridker PM. Lipoprotein particle size and concentration by nuclear magnetic resonance and incident type 2 diabetes in women. Diabetes. 2010;59: 1153–1160. | |
National Cholesterol Education Program (NCEP) Expert Panel on Detection, Evaluation, and Treatment of High Blood Cholesterol in Adults (Adult Treatment Panel III). Third Report of the National Cholesterol Education Program (NCEP) Expert Panel on Detection, Evaluation, and Treatment of High Blood Cholesterol in Adults (Adult Treatment Panel III) Final Report. Circulation. 2002;106:3143–3421. | |
Bays HE, Ballantyne C. What’s the deal with niacin development: is laropiprant add-on therapy a winning strategy to beat a straight flush? Curr Opin Lipidol. 2009;20:467–476. | |
Guyton JR, Blazing MA, Hagar J, et al. Extended-release niacin vs gemfibrozil for the treatment of low levels of high-density lipoprotein cholesterol. Niaspan-Gemfibrozil Study Group. Arch Intern Med. 2000;160:1177–1184. | |
McKenney JM, McCormick LS, Schaefer EJ, Black DM, Watkins ML. Effect of niacin and atorvastatin on lipoprotein subclasses in patients with atherogenic dyslipidemia. Am J Cardiol. 2001;88:270–274. | |
Morgan JM, Capuzzi DM, Baksh RI, et al. Effects of extended-release niacin on lipoprotein subclass distribution. Am J Cardiol. 2003;91: 1432–1436. | |
Birjmohun RS, Hutten BA, Kastelein JJ, Stroes ES. Increasing HDL cholesterol with extended-release nicotinic acid: from promise to practice. Neth J Med. 2004;62:229–234. | |
Illingworth DR, Stein EA, Mitchel YB, et al. Comparative effects of lovastatin and niacin in primary hypercholesterolemia. A prospective trial. Arch Intern Med. 1994;154:1586–1595. | |
Kamal-Bahl SJ, Burke TA, Watson DJ, Wentworth CE. Dosage, titration, and gaps in treatment with extended release niacin in clinical practice. Curr Med Res Opin. 2008;24:1817–1821. | |
Knopp RH, Ginsberg J, Albers JJ, et al. Contrasting effects of unmodified and time-release forms of niacin on lipoproteins in hyperlipidemic subjects: clues to mechanism of action of niacin. Metabolism. 1985;34:642–650. | |
Mills E, Prousky J, Raskin G, et al. The safety of over-the-counter niacin. A randomized placebo-controlled trial [ISRCTN18054903]. BMC Clin Pharmacol. 2003;3:4. | |
Paolini JF, Mitchel YB, Reyes R, et al. Effects of laropiprant on nicotinic acid-induced flushing in patients with dyslipidemia. Am J Cardiol. 2008;101:625–630. | |
Sturino CF, O’Neill G, Lachance N, et al. Discovery of a potent and selective prostaglandin D2 receptor antagonist, [(3R)-4-(4-chloro-benzyl)-7-fluoro-5-(methylsulfonyl)-1,2,3,4-tetrahydrocy clopenta[b]indol-3-Yl]-acetic acid (MK-0524). J Med Chem. 2007;50:794–806. | |
Berge KG, Canner PL. Coronary drug project: experience with niacin. Coronary Drug Project Research Group. Eur J Clin Pharmacol. 1991; 40(Suppl 1):S49–S51. | |
Brown G, Albers JJ, Fisher LD, et al. Regression of coronary artery disease as a result of intensive lipid-lowering therapy in men with high levels of apolipoprotein B. N Engl J Med. 1990;323:1289–1298. | |
Boden WE, Probstfield JL, Anderson T, et al. Niacin in patients with low HDL cholesterol levels receiving intensive statin therapy. N Engl J Med. 2011;365:2255–2267. | |
HPS2-THRIVE Collaborative Group. HPS2-THRIVE randomized placebo-controlled trial in 25 673 high-risk patients of ER niacin/laropiprant: trial design, pre-specified muscle and liver outcomes, and reasons for stopping study treatment. Eur Heart J. 2013;34:1279–1291. | |
Landray MJ, Haynes R, Hopewell JC, et al. Effects of extended-release niacin with laropiprant in high-risk patients. N Engl J Med. 2014;371: 203–212. | |
Beckman JA, Creager MA, Libby P. Diabetes and atherosclerosis: epidemiology, pathophysiology, and management. JAMA. 2002;287: 2570–2581. | |
MacLean A, McKenney JM, Scott R, et al. Efficacy and safety of extended-release niacin/laropiprant in patients with type 2 diabetes mellitus. Br J Cardiol. 2011;18:37–45. | |
Jellinger PS, Smith DA, Mehta AE, et al. American association of clinical endocrinologists’ guidelines for management of dyslipidemia and prevention of atherosclerosis. Endocr Pract. 2012;18(Suppl 1):1–78. | |
Guyton JR, Slee AE, Anderson T, et al. Relationship of lipoproteins to cardiovascular events: the AIM-HIGH trial (atherothrombosis intervention in metabolic syndrome with low HDL/high triglycerides and impact on global health outcomes). J Am Coll Cardiol. 2013;62:1580–1584. |
 © 2015 The Author(s). This work is published and licensed by Dove Medical Press Limited. The full terms of this license are available at https://www.dovepress.com/terms.php and incorporate the Creative Commons Attribution - Non Commercial (unported, v3.0) License.
By accessing the work you hereby accept the Terms. Non-commercial uses of the work are permitted without any further permission from Dove Medical Press Limited, provided the work is properly attributed. For permission for commercial use of this work, please see paragraphs 4.2 and 5 of our Terms.
© 2015 The Author(s). This work is published and licensed by Dove Medical Press Limited. The full terms of this license are available at https://www.dovepress.com/terms.php and incorporate the Creative Commons Attribution - Non Commercial (unported, v3.0) License.
By accessing the work you hereby accept the Terms. Non-commercial uses of the work are permitted without any further permission from Dove Medical Press Limited, provided the work is properly attributed. For permission for commercial use of this work, please see paragraphs 4.2 and 5 of our Terms.