")
Back to Journals » Journal of Inflammation Research » Volume 16
Expression Profile of Pyroptosis-Related Genes and the Associated Regulatory Axis in Primary Gout Patients
Authors Niu S, Lei TY, Dai F, Xie H, Yu X, Zhang Q, Qing Y
Received 5 February 2023
Accepted for publication 12 April 2023
Published 19 April 2023 Volume 2023:16 Pages 1711—1725
DOI https://doi.org/10.2147/JIR.S407359
Checked for plagiarism Yes
Review by Single anonymous peer review
Peer reviewer comments 2
Editor who approved publication: Dr Adam D Bachstetter
Shaowei Niu,1– 3,* Tian-Yi Lei,2,3,* Fei Dai,2,3,* Hongyuan Xie,2,3 Xiang Yu,2,3 Quanbo Zhang,1,2,4 Yufeng Qing1– 3
1The First Affiliated Hospital, Jinan University, Guangzhou, People’s Republic of China; 2Research Center of Hyperuricemia and Gout, Affiliated Hospital of North Sichuan Medical College, Nanchong, People’s Republic of China; 3Department of Rheumatology and Immunology, Affiliated Hospital of North Sichuan Medical College, Nanchong, People’s Republic of China; 4Department of Geriatrics, Affiliated Hospital of North Sichuan Medical College, Nanchong, People’s Republic of China
*These authors contributed equally to this work
Correspondence: Yufeng Qing; Quanbo Zhang, Research Center of Hyperuricemia and Gout, Affiliated Hospital of North Sichuan Medical College, Nanchong, Sichuan Province, People’s Republic of China, Tel/Fax +86 08172282131, Email [email protected]; [email protected]
Purpose: Analyzed the expression characteristics of pyroptosis-related genes (PRGs) in peripheral blood mononuclear cells (PBMCs) of gout patients by microarray, and constructed ceRNA network to explore the molecular mechanism of RNA-mediated pyroptosis regulation.
Patients and Methods: Human mRNA, lncRNA, circRNA microarray data were used to identify differentially expressed in PBMCs from patients with primary gout and healthy controls. Differential PRGs in PBMCs of gout patients identified by Genecard database and mRNA microarray data. GO and KEGG enrichment analyses of these genes were then conducted. Protein-protein interaction networks and cytoHubba were used to identify hub genes. Combining the lncRNA and circRNA microarray data, a ceRNA network was constructed by Cytoscape to screen out key non-coding RNA molecules that can regulate target PRGs. Finally, the relative expression levels of target miRNA and circRNA in 60 gout patients and 40 healthy subjects were detected by qRT-PCR.
Results: The results revealed 30 differentially expressed PRGs. GO and KEGG analysis of these genes were mainly concentrated in the production and regulation of cytokines, NOD-like receptor signaling pathway and so on. Nine hub genes were screened by PPI network, including IL1B, DDX3X, NLRP3, NLRP9, AIM2, CASP8, P2XR7, CARD8 and IFI16. The has_circRNA_102906\hsa_circRNA_102910\hsa_circRNA_102911-hsa-miR-129-5p-DDX3X\NLRP3\NLRP9 regulatory network was constructed. The expression of has_circRNA_102906, hsa_circRNA_102910, hsa_circRNA_102911 were up-regulated and hsa-miR-129-5p down-regulated in PBMCs of gout patients. The relative expression of hsa_circRNA_102911 was positively correlated with clinical inflammatory indicators associated with gout, and the area under the curve of hsa_circRNA_102911 for gout diagnosis was 0.85 (95% CI: 0.775– 0.925; p < 0.001).
Conclusion: There are several differentially expressed PRGs in PBMCs of gout patients, which are involved in the regulation of gout inflammation through multiple pathways. hsa_circRNA_102911-hsa-miR-129-5p-DDX3X\NLRP3\NLRP9 may be the key regulatory pathway for pyroptosis to regulate gout inflammation, and hsa_circRNA_102911 may be a potential biomarker for the diagnosis of primary gout.
Keywords: gout, pyroptosis, endogenous competitive RNA, peripheral blood mononuclear cells, bioinformatics
Introduction
Gout is an inflammatory disease caused by the deposition of monosodium urate (MSU) crystals in joints and other non-joint tissues. The main clinical manifestations of gout include recurrent joint redness, swelling, heat and pain, and even joint mutilation, urinary acid nephropathy and renal failure.1,2 The incidence and prevalence of gout appear to be increasing globally, seriously affecting people’s lives and imposing a significant economic burden on society and families.3 Studies have found that acute and chronic inflammation and immune disorders play an important role in the occurrence and development of gout, but the specific pathogenesis is not fully understood, especially the molecular mechanism of acute and spontaneous remission of gouty arthritis is still a hot issue in the field of gout inflammation.4–6 Therefore, further study on the regulation mechanism of gout inflammation has clinical significance for its prevention, diagnosis and treatment.
Pyroptosis is a programmed cell death that occurs when cells are stimulated by signals associated with infectious or endogenous damage. It can cause cell swelling and destruction of cell membrane integrity, resulting in the release of cellular metabolites and inflammatory factors, which in turn trigger cascade amplification of body inflammation.7 Pyroptosis in cancer and inflammatory diseases has been widely studied, but the current research in gout is very limited. MSU crystals were used to construct gout models at the cellular or animal level to study the role of burnt classical pathways in gout.8–10 At the same time, NLRP3, caspase-1, IL-1β, IL-18 are the main genes involved in the regulation of gout. In gout inflammation, the MSU crystal, as an endogenous injury-related factor, leads to the assembly of NLRP3 inflammatory bodies and the activation of caspase-1, an activated caspase-1, which then cleaves the precursor IL-1β and IL-18 produced by the Toll-like receptor protein 4 signaling pathway, induces maturation and secretion of NLRP3 inflammatory bodies into the extracellular environment, triggering cascade amplification of inflammation.11 However, more than 200 genes are involved in pyroptosis, and 216 encode proteins.12 The expression profile of pyroptosis-related genes (PRGs) in gout patients is not clear, and its value in gout inflammation needs further clarification.
Transcriptome and microarray analysis have been widely used to identify new biomarkers for improved diagnosis and treatment of various diseases, including gout.13–15 In addition, the competitive endogenous RNA (ceRNA) network can elucidate new mechanisms for promoting disease development in transcriptional regulatory networks.16 Therefore, in this study, differential expression of mRNAs in peripheral blood mononuclear cells (PBMCs) between primary gout patients and healthy controls (HC) detected by microarray technology. PRGs were screened by GeneCards. Then, Gout-related PRGs (Gout-PRGs) were determined by the intersection of differential mRNA in gout patient and PRGs. Finally, combined with microarray data, bioinformatics analysis and real-time quantitative PCR (RT-qPCR) amplification assay, this research has demonstrated, for the first time, the specific profile of PRGs in PBMCs of gout patients and explored the potential key genes and pathway network related to gout pathology, which may provide a new theoretical basis for the molecular mechanism of gout.
Materials and Methods
Microarray Data Acquisition, Differential Gene Identification
The design and results of microarray data were based on previous reports.13,14 Arraystar Human LncRNA Microarray V4.0 (Arraystar, Rockville, MD, USA) examined mRNA and lcnRNA expression in PBMCs of 6 primary gout patients and 6 HC matched by age and sex. Arraystar Human circRNA Array v2 (8 × 15K) (Arraystar, Rockville, MD, USA) examined circRNA expression in PBMCs from the peripheral blood of 5 age-and sex-matched patients with primary gout and 3 HC. The microarray data can detect about 15644 mRNAs, 14360 lncRNAs and 13618 circRNAs. Sample markers and microarray hybridization were based on the Agilent Monochromatic Microarray Gene Expression Analysis Protocol, and data normalization was performed by the Gene Spring GX V12.1 package (Agilent Technologies). Subsequently, we used the R (version 4.1.0) software package limma (version 3.40.6) to analyze the difference of microarray data between the gout and HC groups. The differentially expressed genes in gout were screened by fold change (FC) > 1.5, p < 0.05, and the heatmap and Volcano plot were drawn by using the ggplot2 package.
Gout-PRGs Determination
A total of 254 PRGs were extracted from Genecard (https://www.genecards.org/). Using “pyroptosis” as the keyword, the PRGs that encode proteins was searched in Genecard database. Subsequent analysis included 127 protein-coding PRGs with a correlation score greater than 0.6. Next, we cross-analyzed the protein-coding PRGs and differentially expressed mRNAs (DEmRNAs) using jvenn (http://www.bioinformatics.com.cn/static/others/jvenn/example.html).17 To better analyze the Gout-PRGs, we used ggplot2 packets to plot the expression of these genes in gout.
GO and KEGG Enrichment Analysis of Gout- PRGs
For Gout-PRGs functional enrichment analysis, we used the GO annotations for genes in R package org.Hs.eg.db (version 3.1.0), and the KEGG REST API (https://www.kegg.jp/kegg/rest/keggapi.html) to obtain the latest gene annotation for KEGG Pathway as the background, map the genes to the background set, and use R package clusterProfiler (version 3.14.3) to conduct enrichment analysis to obtain the results of gene enrichment. The minimum gene set was 5 and the maximum gene set was 5000, p < 0.05 and FDR < 0.10.
Construction of PPI Network
Based on differential expression of Gout-PRGs, protein-protein interaction information was downloaded through the online tool STRING (https://string-db.org/), filtering conditions (Overall score > 0.4). The PPI network was optimized with Cytoscape software (v3.7.2) for better visualization. We used cytoHubba’s three algorithms, Degree, Maximal Clique Centrality (MCC), and Maximum Neighborhood Component (MNC), to calculate the top 10 hub genes. Finally, the final hub gene was obtained by jvenn cross analysis.
Mechanism of Non-Coding RNA (ncRNA) Regulating Gout-PRGs
Construction of ceRNA Network
Five online miRNA databases, DIANA-TarBase v8, miRWalk, miRDB, miRcode and Targetscan, were used to predict miRNAs targeting the hub gene.18–22 The co-expression network of mRNA-miRNA was constructed using Cytoscape, and target miRNAs were identified as predictable miRNAs in at least two databases. Then the expression of miRNAs predicted by RT-qPCR was tested in 100 subjects. Only those miRNAs with different expression in gout and HC groups were selected for further analysis.
StarBase V3.0 (http://starbase.sysu.edu.cn/index.php) and lncBase V.3 (https://diana.e-ce.uth.gr/lncbasev3) was used to predict lncRNAs. Starbase V3.0 screened for mammalian, human h19 genome, strict CLIP-Data (> = 5), and data with or without degradome. LncRNA microarray data were used to detect the target lncRNA. The up-regulation of differentially expressed LncRNAs (DElncRNAs) and lncBase V3.0, lncBase V.3 predicted lncRNA cross analysis to obtain the target lncRNA.
The circRNA microarray data was used to filter the intended circRNA. Arraystar predicted the circRNA most likely to be combined with circRNA in circRNA microarray data by using TargetScan and miRanda homemade microRNAs (microRNA, miRNA) target prediction software to predict the differentially expressed circRNAs (DEcircRNAs), the first five miRNAs with higher matching values, and then determined the target circRNAs that can interact with the target miRNA.22,23
Finally, Cytoscape was used to build a ceRNA network based on the interactions between mRNAs and ncRNAs.
Clinical Samples and Data Collection
This stage included 30 patients with patients with acute gout flare (AG), 30 patients with patients with intercritical gout (IG) and 40 HC. Their target miRNA and circRNA genes predicted in the ceRNA network were detected using their peripheral venous blood, and their clinical data were collected (Table 1), including sex, age, and laboratory indicators. The samples were collected from gout patients in the Rheumatology and Immunology Department of the Affiliated Hospital of North Sichuan Medical College from February 2021 to February 2022. The laboratory indicators, including hypersensitive-c-reactive-protein (hsCRP), erythrocyte sedimentation rate (ESR), white blood cell counts (WBC), neutrophile granulocytecounts (GR), lymphocyte counts (LY), monocyte counts (Mo), serum albumin (ALB), serum globulin (GLOB), serum uric acid (sUA), serum urea (Urea), serum creatinine (Crea), estimated glomerular filtration rate (eGFR), was completed by the laboratory department of the Affiliated Hospital of North Sichuan Medical College. All gout patients met the American Rheumatic Society/European Alliance against Rheumatism 2015 Gout Classification Criteria, and were subdivided into AG and IG groups according to their clinical manifestations.24 Specifically, gout patients with joint swelling, fever, and pain symptoms over the past 3 days were classified as AG, while those without joint symptoms for at least 2 weeks and with normal ESR, hsCRP, and WBC counts were classified as IG. Hyperuricemia, metabolic syndrome or other chronic diseases were excluded in the healthy controls as HC. All subjects were male, and there was no significant difference in age composition between the 3 groups (F = 0.029, P > 0.05). The study was approved by the Ethics Committee of the Northern Sichuan Medical College and was conducted in accordance with the ethical norms of the 1975 Helsinki Declaration. All patients signed informed consent following institutional guidelines.
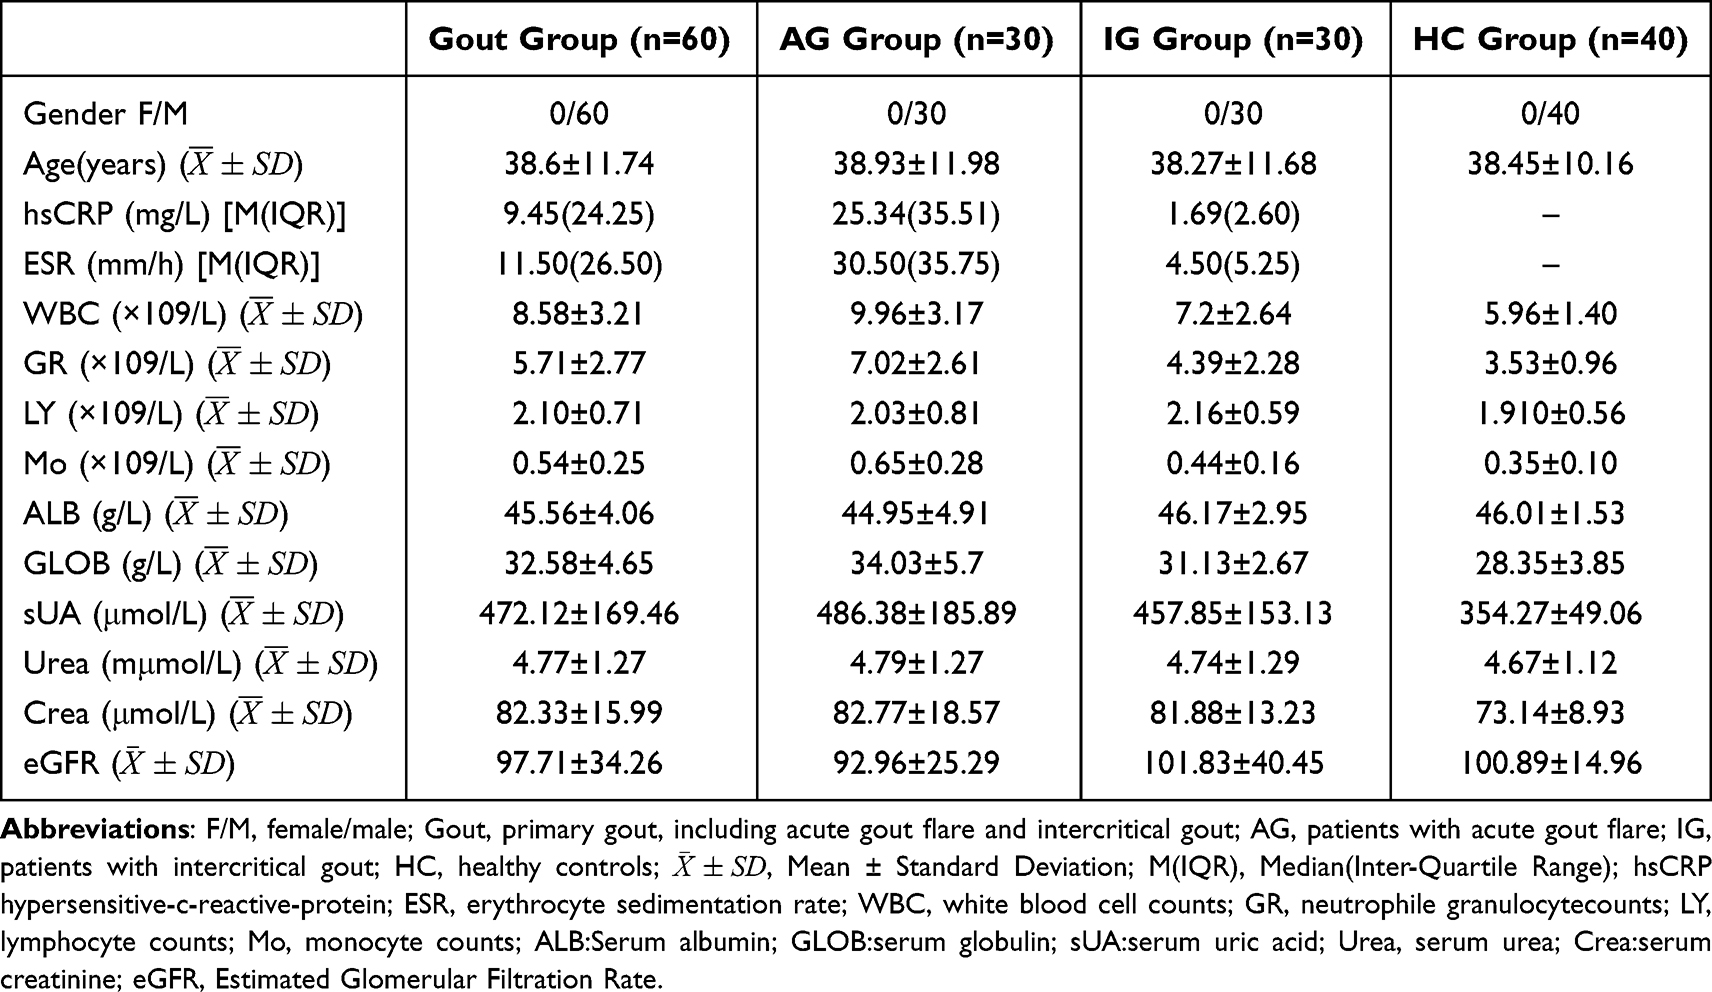 |
Table 1 Clinical and Laboratory Data of Subjects Studied |
RNA Extraction and RT-qPCR Detection
Heparin anticoagulation tubes were used to collect 4mL of early morning fasting peripheral venous blood from all subjects. PMBCs were isolated by Ficoll density gradient centrifugation. Total RNA was extracted from PMBCs according to the Trizol kits (Invitrogen, United States) instructions. For miRNAs, reverse transcription and quantification of miRNAs from the extracted samples was performed using the All-in-One ™ miRNA qPCR kit (Gene Copoeia, Rockville, Md, USA). RT-qPCR based on instructions from Gene Copoeia kit. U6 snRNA is used as an internal control. For circRNA, the total RNA of 2μL is taken from the reverse transcription kit (TaKaRa, Japan) to synthesize cDNA. The reaction system included TB Green Premix Ex Taq II (Takara Bio, Inc): 5 microlitres, positive primers: 0.1 microlitres (10pmol/L), reverse primers: 0.1 microlitres (10pmol/L), cDNA: 1.0 microlitres, ddH20: 3.8 microlitres. The thermal cycling conditions are as follows. At 95 °C for 10 minutes, then denatured for 40 cycles at 95 °C for 10 seconds, annealed at 60 °C for 1 minute longer. The expression of the housekeeper gene (β-actin) is used as an internal control. All the reactions had multiple pores, and the relative level of RNA of each gene was 2-ΔCT. Table 2 lists the β-actin and 7 circRNA primer sequences for RT-qPCR (Shanghai Bioengineering Co, Ltd, Shanghai, China).
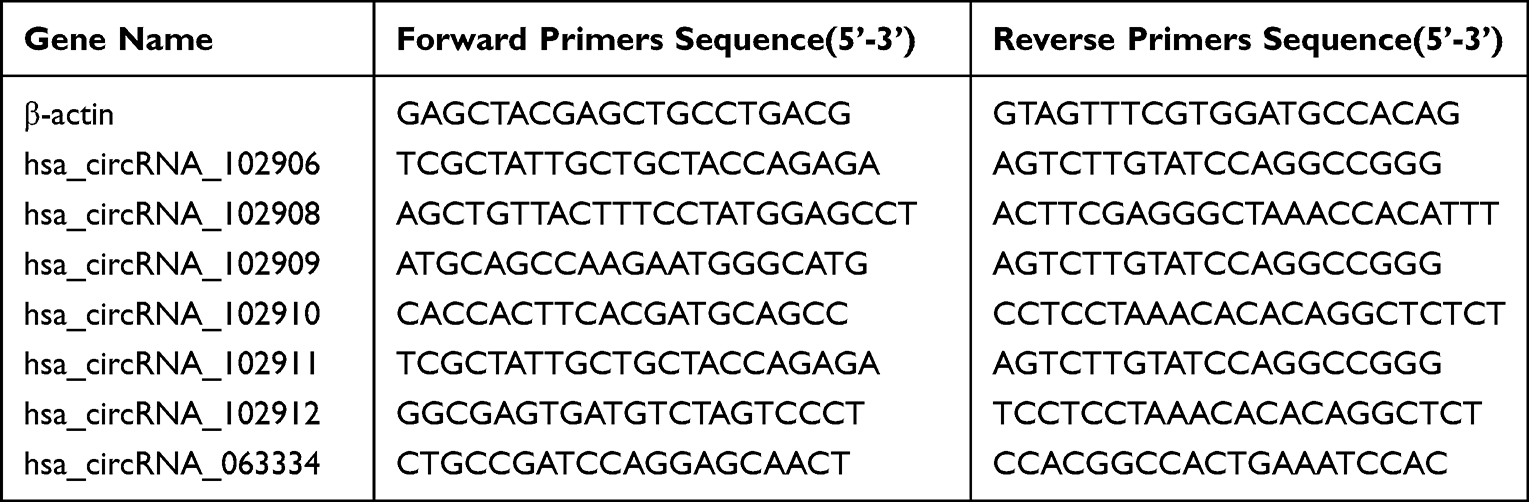 |
Table 2 RT-qPCR Primers Used in This Study |
Statistical Analysis
IBM SPSS Statistics 26 (SPSS, Inc, Chicago, IL, USA) was used to analyze data. The continuous variables were described by mean ± standard deviation (x ± s), and the comparison between groups was made by t-test or one-way ANOVA. The non-normal distribution was described by median (quartile interval) [M (IQR)], the comparison between groups was made by Mann–Whitney U or Krusk al-Wallis H-test, the correlation among variables was made by Spearman correlation analysis, and the diagnostic efficacy of circRNA on gout was analyzed by receiver operating characteristic (ROC) curve. Statistical significance was defined as p < 0.05.
Results
Data Normalization and Differential Gene Identification
mRNA, lncRNA microarray data sets (6 gout patients, 6 HC) were normalized (Figure 1A and B). A total of 3036 DEmRNAs were identified on mRNA microarray data, including 1040 up-regulated and 1996 down-regulated mRNAs. A total of 3533 DElncRNAs were identified on lncRNA microarray data, including 2022 up-regulated and 1511 down-regulated lncRNAs. Heatmap and Volcano plot analyses show these results (Figure 1C–E. Differential identification of circRNA microarray data sets was consistent with our previous study (13), in which there were 279 DEcircRNAs, including 238 up-regulated and 41 down-regulated circRNAs.
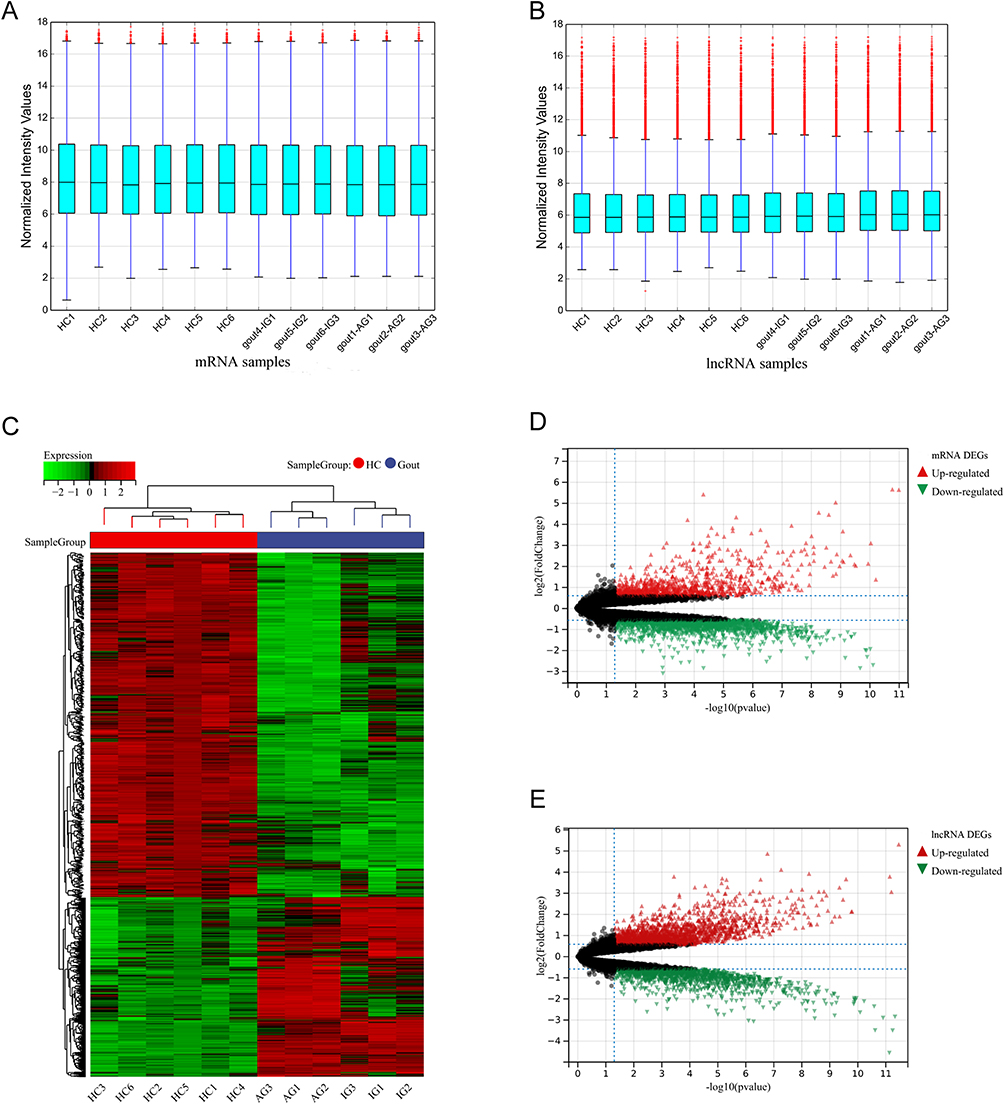 |
Figure 1 Data normalization, mRNAs, lncRNAs difference analysis. (A) Normalized box diagram of mRNAs microarray data. (B) Normalized box diagram of lncRNAs microarray data. (C) Heatmap of differential expression of mRNAs. Red rectangles represent high expression and green ones represent low expression. (D) Volcano plot of differential expression of mRNAs. (E) Volcano plot of differential expression of lncRNAs. The red plots represent up-regulated genes, the black plots represent nonsignificant genes, and the green plots represent down-regulated genes. Abbreviations: Gout, primary gout, including acute gout flare and intercritical gout; AG, patients with acute gout flare; IG, patients with intercritical gout; HC, healthy controls. |
Expression of PRGs in PBMCs of Gout Patients
Cross analysis of DEmRNAs and 127 PRGs yielded 32 Gout-PRGs (Figure 2A). The box chart (Figure 2B) shows the differential expression of 32 Gout- PRGs in the gout and HC groups, with only 30 Gout- PRGs showing statistical differences (p < 0.05).
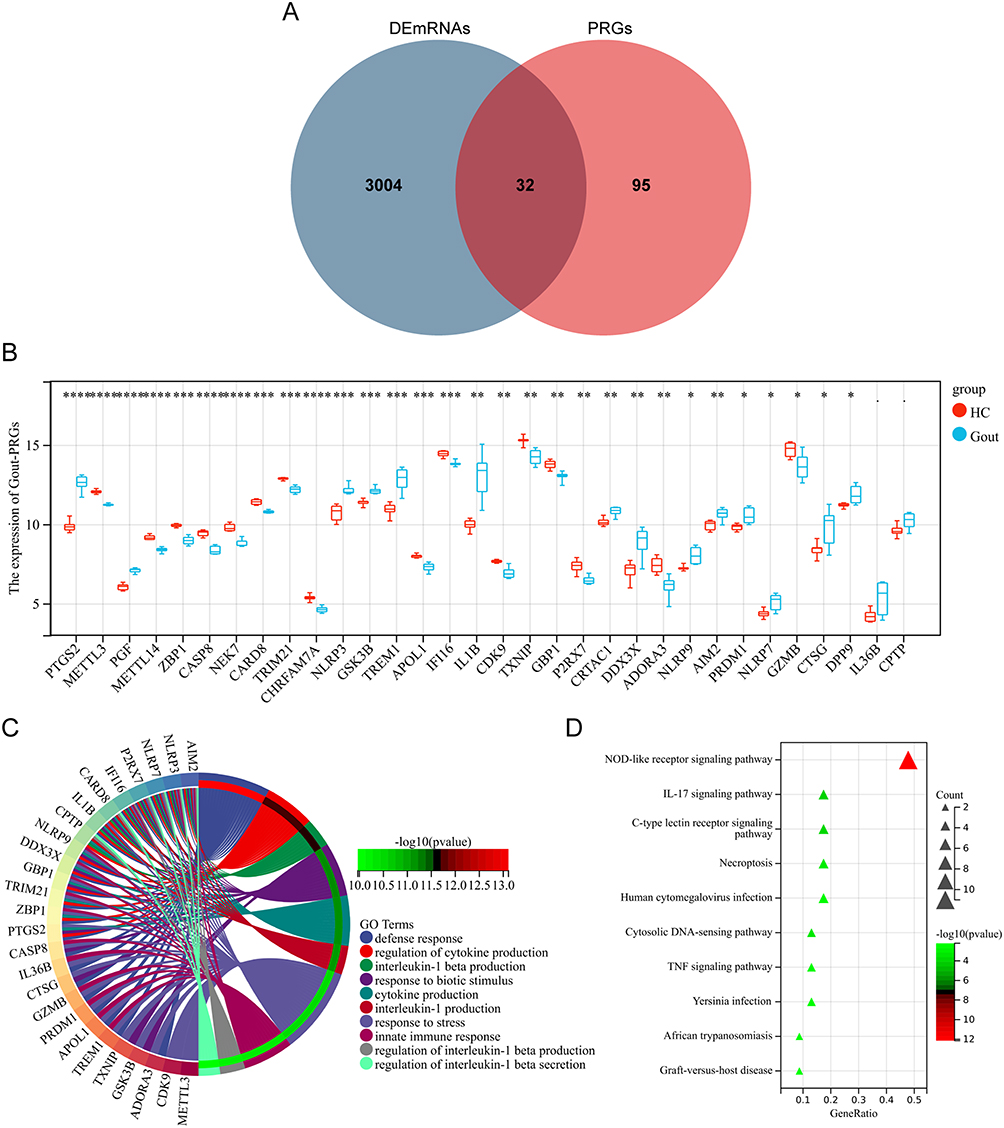 |
Figure 2 Identifies Gout-PRGs and functional enrichment analysis. (A) Venn diagram between DEmRNAs and PRGs. The coincidence part represents 32 genes shared by the two series. (B) Differential expression of Gout-PRGs in microarray data, gout, red; healthy, blue. The top and bottom of the box represent a range of quartile values. The line in the box represents the median. ****p < 0.0001, ***p < 0.001, **p < 0.01, *p < 0.05. (C) Gout-PRGs GO annotation visualization (TOP 10). (D) Gout-PRGs KEGG annotation visualization (Top10). Abbreviations: Gout, primary gout, including acute gout flare and intercritical gout; HC, healthy controls. |
GO and KEGG Enrichment Analysis
To further explore the function of Gout-PRGs, we performed GO and KEGG enrichment analysis on 30 Gout-PRGs with statistically significant differences. GO enrichment analysis showed that Gout-PRGs was mainly enriched in the production and regulation of cytokines, production, regulation and secretion of IL-1β, defense response. Figure 2C shows the biological processes of the first 10 GO enrichment analyses. KEGG pathway enrichment analysis showed enrichment in NOD-like receptor signaling pathway, IL-17 signaling pathway, C-type lectin receptor signaling pathway, cytoplasmic DNA sensing pathway, TNF signaling pathway and Necroptosis. Figure 2D shows the top 10 KEGG paths.
PPI Network and Hub Gene Difference Analysis
Based on Gout-PRGs, a PPI network was constructed with STRING, which consists of 30 nodes and 59 edges. And we used cytoscape to optimize and visualize the PPI network (Figure 3A). CytoHubba’s three algorithms were used to compute the top 10 hub genes, as shown in Figures 3B–D. The cross analysis resulted in the identification of nine hub genes (Figure 3E). Details of these hub genes are shown in Table 3, They are the most important in the PPI network and may play an important role in the pathogenesis of gout. In addition, we compared hub genes in mRNA microarrays data with samples from AG, IG, and HC groups. IL1B, DDX3X, NLRP3, NLRP9, AIM2 were mainly up-regulated (p < 0.05), CASP8, P2RX7, CARD8, IFI16 were down-regulated (p < 0.05). In particular, DDX3X was low in the AG group (p < 0.05) and NLRP9 was high in the AG group (p < 0.05) as shown in Figure 3F–N.
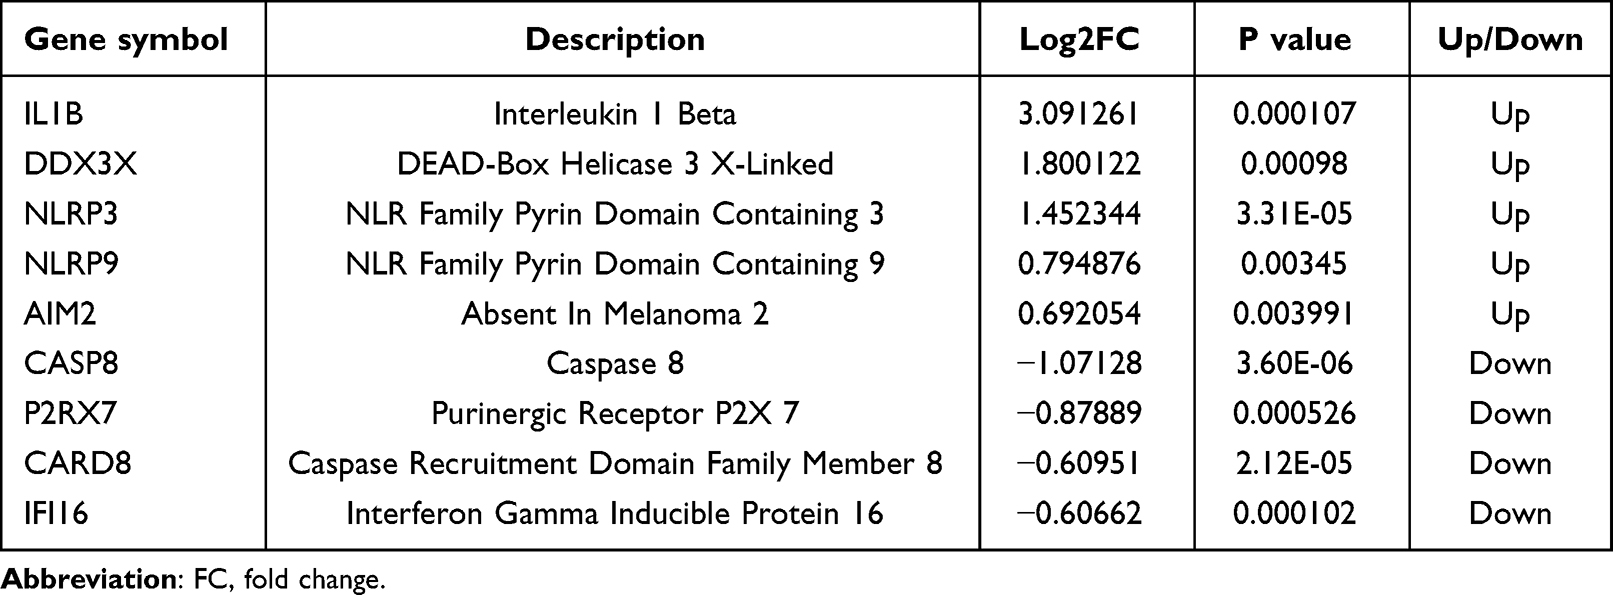 |
Table 3 Hub Genes |
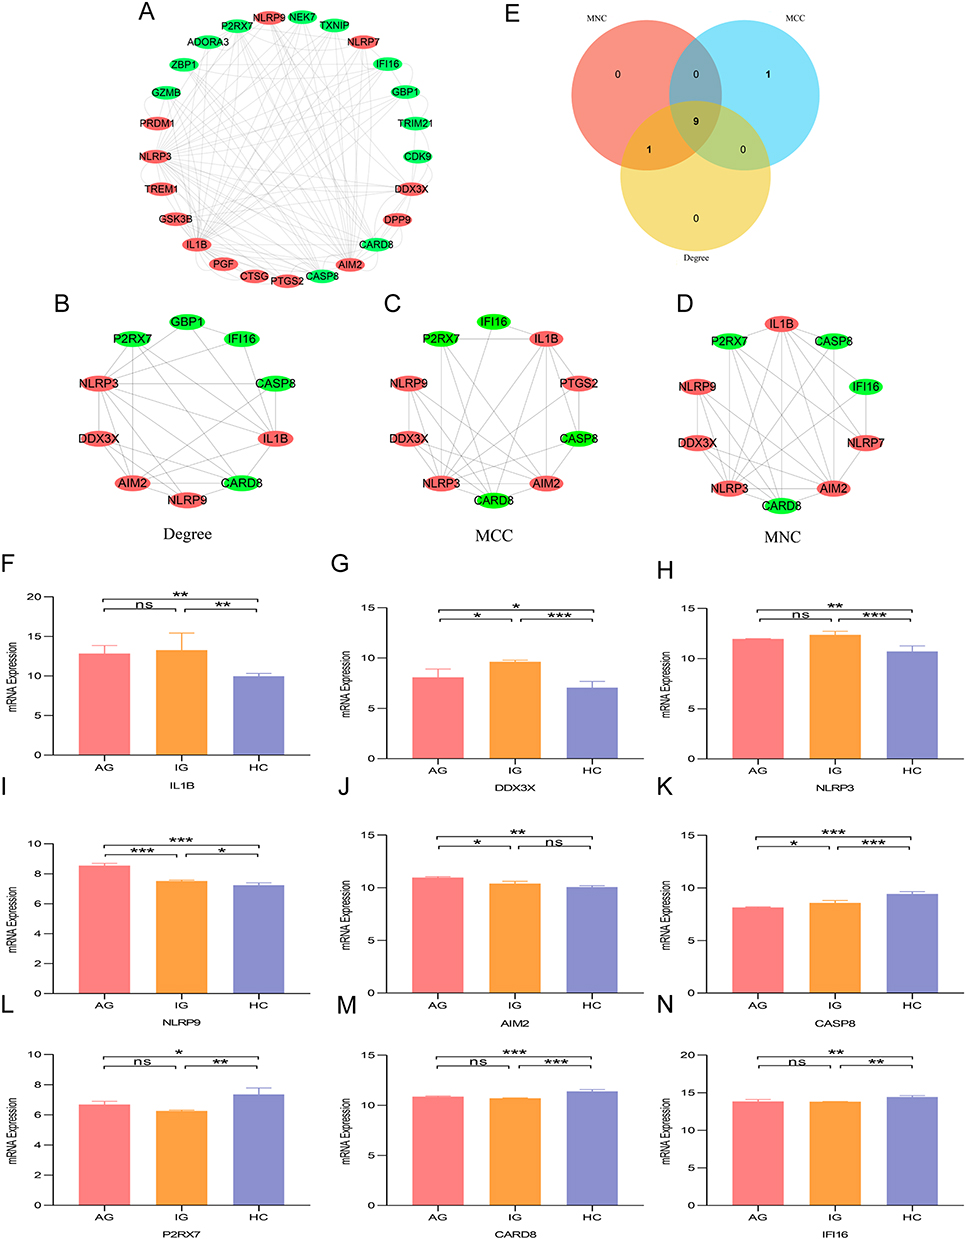 |
Figure 3 PPI network analysis and hub genes differential expression of Gout-PRGs. (A) The interaction network between proteins coded by Gout-PRGs was comprised of 25 nodes and 58 edges.Each node represents a protein, while each edge represents a protein-protein association. Red circle represent the up-regulated genes. And green circle represent the down-regulated genes. (B) Top 10 hub genes calculated using Degree. (C) Top 10 hub genes calculated using MCC. (D) Top 10 hub genes calculated using MNC. (E) Venn diagram of the three cluster models extracted by CytoHubba, the overlap being the hub gene. (F–N) Differential expression of hub genes in AG, IG and HC groups. ***p < 0.001, **p < 0.01, *p < 0.05. Abbreviations: ns, no significant difference; Gout, primary gout, including acute gout flare and intercritical gout; AG, patients with acute gout flare; IG, patients with intercritical gout; HC, healthy controls. |
ncRNA Regulates the Gout-PRGs Mechanism
Determination of Hsa-miR-129-5p
Studies have shown that pyroptosis is a pro-inflammatory form of programmed cell death, which has been confirmed in gout research.8–11 Therefore, we chose IL-1Β, DDX3X, NLRP3, NLRP9, AIM2 to further study. Considering that IL-1B is a downstream target.11,25 In the mechanism of gout inflammation and pyroptosis, thus it was not included in the study. Next, we predicted the miRNAs associated with DDX3X, NLRP3, NLRP9, and AIM2 from five databases and found 191 mRNA-miRNAs (Figure 4A). At the same time, miRNA that target three or more of the Gout-PRGs were selected. Finally, hsa-miR-129-5p, hsa-miR-24-3p, hsa-miR-338-3p were determined. Then RT-qPCR was used to verify the miRNA expression level in 100 subjects (30AG, 30IG, 40HC) PBMCs. Only has-miR-129-5p showed significant difference between gout and HC groups. In gout group, it was significantly lower than that in HC group (p < 0.05), and there was no significant difference between AG and IG groups (Figure 4B–G).
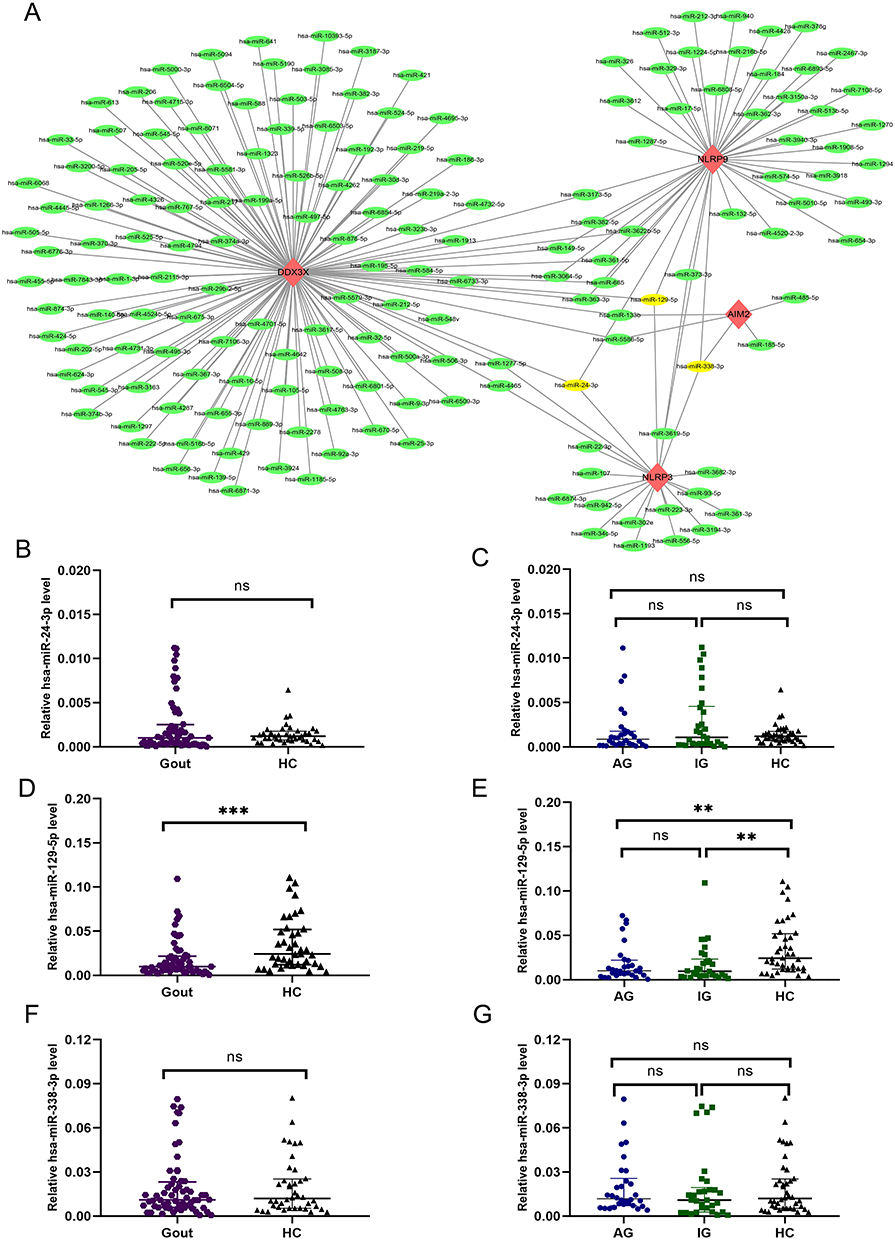 |
Figure 4 mRNA-miRNA co-expressed networks and co-targeted miRNAs differentially. (A) The mRNA-miRNA co-expression network is built by Cytoscape and consists of 181 nodes and 191 edges. DDX3X has 122 target miRNAs, NLRP3 has 20 target miRNAs, NLRP9 has 44 target miRNAs, and AIM2 has only 5 target miRNAs. One node represents an mRNA or miRNA, and one edge represents an interaction between an mRNA and miRNA. Red diamonds represent hub genes, green circles represent miRNAs, and yellow circles represent co-targeting miRNAs (three hub genes targeted). (B–G) Differential expression of co-targeted miRNA between Gout and HC groups or between AG, IG and HC groups. ***p < 0.001, **p < 0.01. Abbreviations: ns, no significant difference; Gout, primary gout, including acute gout flare and intercritical gout; AG, patients with acute gout flare; IG, patients with intercritical gout; HC, healthy controls. |
LncRNAs and circRNAs Interacting with Hsa-miR-129-5p
Next, we use the online databases StarBase V3.0 and Lncbase V. 3 to screen for lncRNAs that interact with has-miR-129-5p and can appear in the up-regulated DElncRNAs, culminating in one target lncRNA_MALAT1 (Figure 5A). The differential expression was compared using lncRNA microarray data (Figure 5B and C). Combined with the results of DEcircRNAs, there were 7 circRNAs that could be targeted by has-miR-129-5p, including hsa_circRNA_102906, hsa_circRNA_102908, hsa_circRNA_102909, hsa_circRNA_102910, hsa_circRNA_102911, hsa_circRNA_102912, hsa_circRNA_063334. Considering that LncRNA and mRNA came from the same sample and the same microarray chip, and circRNA was different from them, we conducted RT-qPCR detection of circRNA that might be related to hsa-miR-129-5p. The expression of circRNAs was detected in 100 subjects (30AG, 30IG, 40HC) PBMCs (Figure 5D–I). Hsa_circRNA_102906, hsa_circRNA_102910, hsa_circRNA_102911 were found to be significantly higher in all gout patients (p < 0.05). In addition, the relative expressions of hsa_circRNA_102906, hsa_circRNA_102910, hsa_circRNA_102911 in AG and IG subgroups were significantly higher than those in HC groups (p < 0.05), and the relative expressions of hsa_circRNA_102906, hsa_circRNA_102911 in AG subgroups were significantly higher than those in IG subgroups (p < 0.05).
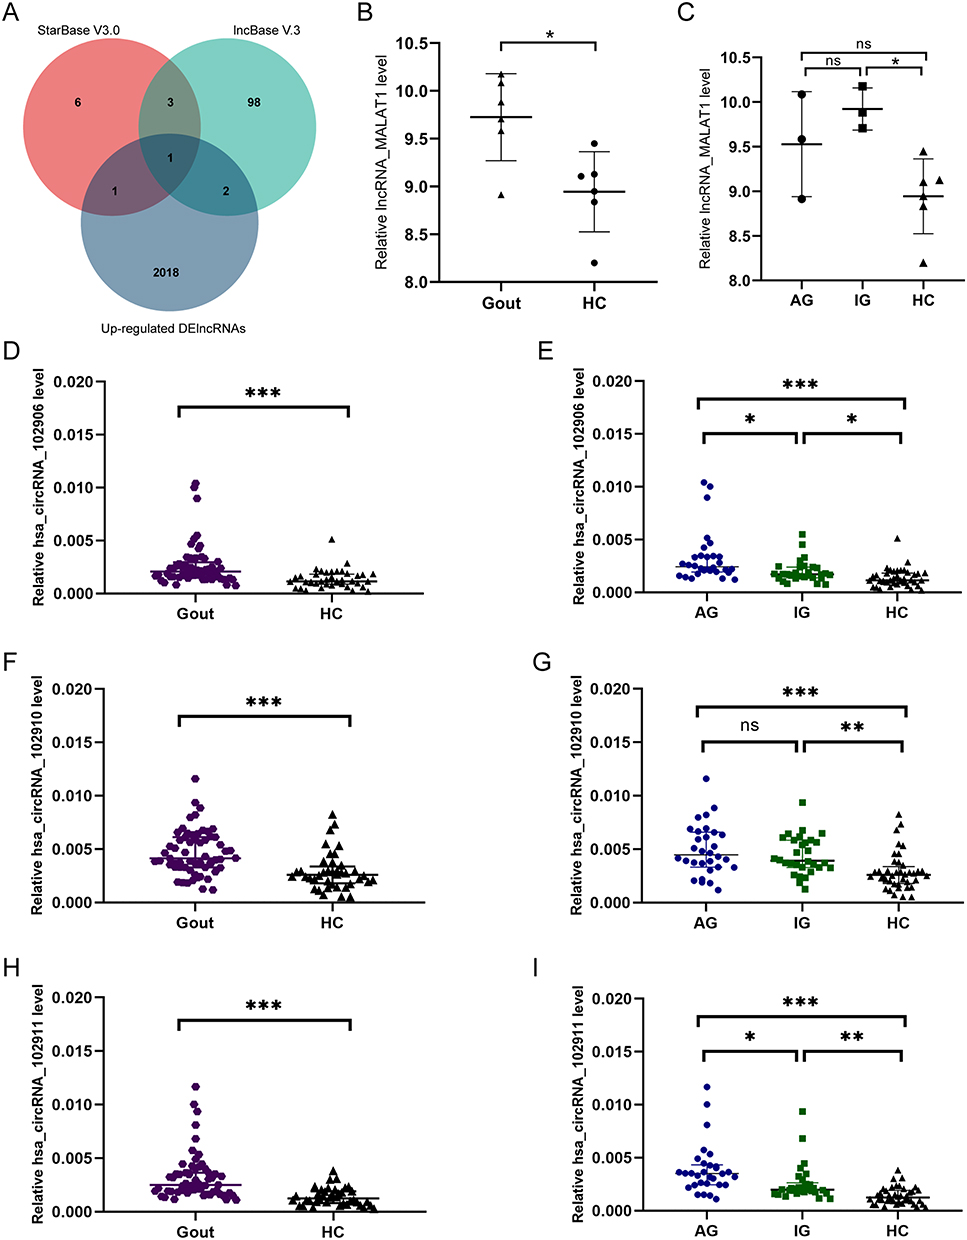 |
Figure 5 Differential expression of lncRNAs and circRNAs targeted. (A) Venn diagram between aStarBase V3.0, lncBase V.3 and up-regulated DElncRNAs targeting lncRNAs, the overlap being the common expression of lncRNA _ MALAT1. (B and C) Differential expression of lncRNA _ MALAT1 in Gout and HC groups or AG, IG, HC groups. (D–I) Differential expression of has_circRNA_102906, has_circRNA_102910, has_circRNA_102911 in Gout and HC groups or AG, IG, HC groups.***p < 0.001, **p < 0.01, *p < 0.05. Abbreviations: ns, no significant difference; Gout, primary gout, including acute gout flare and intercritical gout; AG, patients with acute gout flare; IG, patients with intercritical gout; HC, healthy controls. |
Construction and Analysis of circRNAs-Hsa-miR-129-5p-NLRP3\NLRP9\DDX3X Regulatory Network
Literature search showed that lncRNA_MALAT1 was involved in the occurrence and development of gout in MSU stimulated THP1 models, so our study does not consider lncRNA_MALAT1 regulatory network.26 Thus, a circRNA-miRNA-mRNA regulatory network is constructed on the basis of ceRNA hypothesis (16) for the target gene. (Figure 6A)
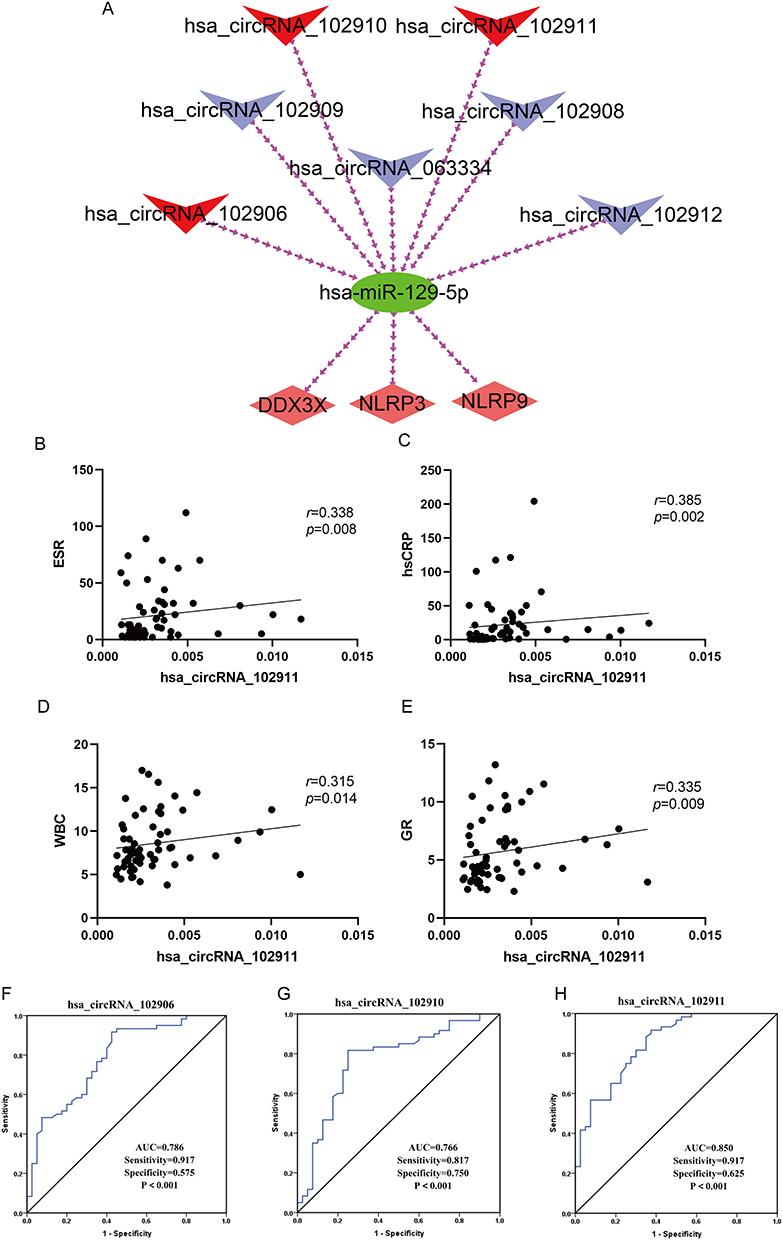 |
Figure 6 ceRNA networks, correlation analysis, and ROC diagrams. (A) ceRNA network. Red diamonds represent hub genes, green circles for miRNAs, blue V for circRNAs, and red V for circRNAs. (B–E) Correlation analysis between hsa_circRNA_102911 and ESR, hsCRP, WBC, GR inflammatory index. (F–H) Receiver operating characteristic (ROC) of differentially expressed circRNAs Between Gout and HC group. Abbreviations: ESR, erythrocyte sedimentation rate; hsCRP, hypersensitive C reactive; WBC, white blood cell counts; GR, neutrophile granulocytecounts; AUC, The surface area under the ROC curve; Gout, primary gout, including acute gout flare and intercritical gout; HC, healthy controls. |
In addition, in order to further understand the possible mechanism of action of circRNAs in gout, the correlation between hsa_circRNA_102906, hsa_circRNA_102910, hsa_circRNA_102911 and clinical laboratory indicators was analyzed. The expression of hsa_circRNA_102911 in gout patients PBMCs was found to be positively correlated with ESR (r = 0.338, p = 0.008), hsCRP (r = 0.385, p = 0.002), WBC (r = 0.315, p = 0.014) and GR (r = 0.335, p = 0.009). (Figure 6B–E) The remaining two circRNAs were not found to be clinically relevant.
At the same time, the diagnostic efficacy of three circRNAs for gout was examined and the ROC curves were analyzed. The area under curve (AUC) of hsa_circRRNA_102906 were 0.786 (95% confidence interval (CI), 0.695–0.877; p<0.001; sensitivity=91.7%, specificity=57.5%), the AUC of hsa_circRNA_102910 were 0.766 (95% CI, 0.667–0.865; p<0.001; sensitivity=81.7%, specificity=75.0%) and the AUC of hsa_circRNA_102911 were 0.850 (95% CI, 0.775–0.925; p<0.001; sensitivity=91.7%, specificity=62.5%). (Figure 6F–H)
Discussion
As a newly recognized type of programmed cell death, pyroptosis is a hot topic in various diseases, especially in tumor and inflammatory diseases.27,28 Studies have shown that pyroptosis can play a dual role in cancer progression. Cell burnout releases inflammatory cytokines, stimulates normal cells, and leads to the transformation into tumor cells, and promotes cell death.29,30 However, current knowledge of pyroptosis in gout are limited. The research on the mechanism of pyroptosis involved in gout mainly focuses on the NLRP3/caspase-1/GSDMD pathway, which activates Caspase-1 through the NLRP3 inflammasome, cleaves the downstream GSDMD protein, induces pyroptosis, and releases IL-1β and IL-18 cytokines to exacerbate inflammation.11 However, the expression of several PRGs in gout and its mechanism are still not clear. GO and KEGG analysis showed that these Gout-PRGs were involved in the production and regulation of cytokines, IL-1β-production, regulation and secretion, defense response, NOD-like receptor signaling pathway, IL-17 signaling pathway, C-type lectin receptor signaling pathway, cytoplasmic DNA sensing pathway, TNF signaling pathway and Necroptosis. Previous studies have reported that these pathways play an important role in the regulation of gout inflammation.31,32 These results suggest that these Gout-PRGs may be involved in the pathogenesis of gout through multiple signaling pathways.
By constructing a PPI network, we identified nine key PRGs, including five up-regulated genes in gout (IL1B, DDX3X, NLRP3, NLRP9, AIM2) and four down-regulated genes (CASP8, P2RX7, CARD8, IFI16). Among them, NLRP3 and IL-1B have been identified in previous studies as involved in gout inflammation by regulating pyroptosis. As a typical representative of the NOD-like receptor protein family, NLRP3 is not only one of the most studied pattern recognition receptors in gout, but also one of the important molecules of the classical activation pathway of pyroptosis.1,11 The inflammatory corpuscle complex is activated after sensing the signal of pathogen and manifests as perforation of cell membrane and release of inflammatory cell contents, mediating the production of a series of inflammatory factors, including IL-1β, IL-18, TNF-α, etc. Of these cytokines, IL-1β is the most closely related to gout.33 Activated IL-1β activates chemokines and other inflammatory regulators by activating IL-1R, causing neutrophils to enter joints and other urate deposits, exacerbating the gout response.4 About CASP8, Liu et al predicted it to be the core target of plantain active compounds in the treatment of gout and hyperuricemia based on network pharmacology.34 A Korean study suggests that genetic variability in the P2X7R rs3751142 and CARD8 rs2043211 genes may be involved in the development of gout.35 In addition, regarding our predictions of AIM2, DDX3X, NLRP9, IFI16, they are all related to the process of pyroptosis.36–39 However, no studies have been reported on gout, and the mechanism of its involvement in gout is unclear. This provides a new way for us to further study the mechanism of pyroptosis in gout inflammation.
NcRNAs, such as miRNA, LncRNA, cirRNA, are a class of RNAs that do not encode proteins and have crucial roles in human health and disease, including gout.13–15 Current studies have shown that lncRNA and circRNA can act as a kind of ceRNA to regulate target gene expression by competing with related mRNAs to bind to the same miRNA through miRNA response elements.16 Our team has long worked on ncRNA’s role in gout. Previous work identified 3522 DElncRNAs and 279 DEcircRNAs in gout patients using microarray data. To further investigate the role of these different ncRNAs regulatory downstream PRGs in gout, we selected three up-regulated PRGs (DDX3X\NLRP3\NLRP9) in PBMCs of gout patients to construct ceRNA networks with microarray data. In 100 patients (30AG, 30IG, 40HC), RT-qPCR was used to detect the predicted miRNAs and circRNAs, and it was found that has-miR-129-5p was down-regulated and has_circRNA_102906, has_circRNA_102910, and has_circRNA_102911 were up-regulated in gout patients. We speculate that has_circRNA_102906, has_circRNA_102910, has_circRNA_102911 may act as a spongy molecule of has-miR-129-5p and competitively combined with DDX3X\NLRP3\NLRP9 to regulate the Gout-PRGs. Gout is an inflammatory disease in which pyroptosis plays an important role in cascading reactions that lead to acute inflammatory injury.4 So We took the predicted upstream molecules that regulate the Gout-PRGs, analyzed the association between circRNAs and clinical indicators. Only found has_circRNA_102911 was positively correlated with the inflammatory markers of gout patients. In combination with the ceRNA hypothesis, we first proposed an RNA regulatory pathway in which PRGs participates in the mechanism of gout inflammation, has_circRNA_102911-hsa-miR-129-5p-DDX3X\NLRP3\NLRP9.16 In addition, as a class of ncRNA with a closed loop structure, circRNA is widely and stably distributed in the human body, with certain tissue, time sequence and disease specificity, and can be used as a new ideal diagnostic biomarker for diseases.40–42 In this study, the ROC curve analysis found that the AUC of has_circRNA_102911 for distinguishing gout from healthy people was 0.85, indicating that it has good diagnostic performance and may be a potential biomarker for the diagnosis of primary gout, which indicated that has_circRNA_102911 was a potential biomarker for the diagnosis of primary gout.
Of course, this study also has some limitations. On the one hand, the sample size used for analysis and verification is relatively small. Therefore, future studies need to increase the sample size and at different biological levels to further support our view. On the other hand, although we suggest that the has_circRNA_102911-hsa-miR-129-5p-DDX3X\NLRP3\NLRP9 pathway may play an important role in the regulation of gout inflammation, further functional experiments are needed.
Conclusion
Our work, for the first time, elucidated the expression profile of Gout-PRGs and identified nine hub genes specifically expressed in PBMCs of gout patients, especially the DDX3X\NLRP3\NLRP9 up-regulated in gout. By constructing a ceRNA network, the regulation mechanism of pyroptosis in gout was explored from the transcriptome level, and the regulatory network of has_circRNA_102906\hsa_circRNA_102910\hsa_circRNA_102911-hsa-miR-129-5p- DDX3X\NLRP3\NLRP9 was initially found. Furthermore, has_circRNA_102911-hsa-miR-129-5p-DDX3X\NLRP3\NLRP9 may be a key regulatory pathway for Gout-PRGs and has_circRNA_102911 may be a potential biomarker for the diagnosis of primary gout.
Acknowledgments
This work was supported by funding from the National Natural Science Foundation of China (81974250); Science and Technology Project of Nanchong City (20SXCXTD0002, 2022JB004). The study was approved (NO: 2022-14) by the Ethics Committee of the Northern Sichuan Medical College and was conducted in accordance with the ethical norms of the 1975 Helsinki Declaration.
Disclosure
The authors report no conflicts of interest in this work.
References
1. Dalbeth N, Gosling AL, Gaffo A, et al. Gout [published correction appears in Lancet. Lancet. 2021;397(10287):1843–1855. doi:10.1016/S0140-6736(21)00569-9
2. Bardin T, Nguyen QD, Tran KM, et al. A cross-sectional study of 502 patients found a diffuse hyperechoic kidney medulla pattern in patients with severe gout. Kidney Int. 2021;99(1):218–226. doi:10.1016/j.kint.2020.08.024
3. Kuo CF, Grainge MJ, Zhang W, et al. Global epidemiology of gout: prevalence, incidence and risk factors. Nat Rev Rheumatol. 2015;11(11):649–662. doi:10.1038/nrrheum.2015.91
4. So AK, Martinon F. Inflammation in gout: mechanisms and therapeutic targets. Nat Rev Rheumatol. 2017;13(11):639–647. doi:10.1038/nrrheum.2017.155
5. Cabău G, Crișan TO, Klück V, et al. Urate-induced immune programming: consequences for gouty arthritis and hyperuricemia. Immunol Rev. 2020;294(1):92–105. doi:10.1111/imr.12833
6. Wang Z, Zhao Y, Phipps-Green A, et al. Differential DNA methylation of networked signaling, transcriptional, innate and adaptive immunity, and osteoclastogenesis genes and pathways in gout. Arthritis Rheumatol. 2020;72(5):802–814. doi:10.1002/art.41173
7. Man SM, Karki R, Kanneganti TD. Molecular mechanisms and functions of pyroptosis, inflammatory caspases and inflammasomes in infectious diseases. Immunol Rev. 2017;277(1):61–75. doi:10.1111/imr.12534
8. Lin Y, Luo T, Weng A, et al. Gallic acid alleviates gouty arthritis by inhibiting NLRP3 inflammasome activation and pyroptosis through enhancing Nrf2 signaling. Front Immunol. 2020;11:580593. doi:10.3389/fimmu.2020.580593
9. Hao K, Jiang W, Zhou M, et al. Targeting BRD4 prevents acute gouty arthritis by regulating pyroptosis. Int J Biol Sci. 2020;16(16):3163–3173. doi:10.7150/ijbs.46153
10. Li H, Jiang W, Ye S, et al. P2Y14 receptor has a critical role in acute gouty arthritis by regulating pyroptosis of macrophages. Cell Death Dis. 2020;11(5):394. doi:10.1038/s41419-020-2609-7
11. Vande Walle L, Lamkanfi M. Pyroptosis. Curr Biol. 2016;26(13):R568–R572. doi:10.1016/j.cub.2016.02.019
12. Safran M, Rosen N, Twik M, et al. The genecards suite. In: Practical Guide to Life Science Databases. Springer; 2021:27–56.
13. Dai F, Zhang QB, Tang YP, et al. Expression profile and potential function of circular RNAs in peripheral blood mononuclear cells in male patients with primary gout. Front Genet. 2021;12:728091. doi:10.3389/fgene.2021.728091
14. Qing YF, Zheng JX, Tang YP, et al. LncRNAs Landscape in the patients of primary gout by microarray analysis. PLoS One. 2021;16(2):e0232918. doi:10.1371/journal.pone.0232918
15. Bohatá J, Horváthová V, Pavlíková M, et al. Circulating microRNA alternations in primary hyperuricemia and gout. Arthritis Res Ther. 2021;23(1):186. doi:10.1186/s13075-021-02569-w
16. Salmena L, Poliseno L, Tay Y, et al. A ceRNA hypothesis: the Rosetta Stone of a hidden RNA language? Cell. 2011;146(3):353–358. doi:10.1016/j.cell.2011.07.014
17. Bardou P, Mariette J, Escudié F, et al. jvenn: an interactive Venn diagram viewer. BMC Bioinform. 2014;15(1):293. doi:10.1186/1471-2105-15-293
18. Karagkouni D, Paraskevopoulou MD, Chatzopoulos S, et al. DIANA-TarBase v8: a decade-long collection of experimentally supported miRNA-gene interactions. Nucleic Acids Res. 2018;46(D1):D239–D245. doi:10.1093/nar/gkx1141
19. Sticht C, De La Torre C, Parveen A, et al. miRWalk: an online resource for prediction of microRNA binding sites. PLoS One. 2018;13(10):e0206239. doi:10.1371/journal.pone.0206239
20. Chen Y, Wang X. miRDB: an online database for prediction of functional microRNA targets. Nucleic Acids Res. 2020;48(D1):D127–D131. doi:10.1093/nar/gkz757
21. Jeggari A, Marks DS, Larsson E. miRcode: a map of putative microRNA target sites in the long non-coding transcriptome. Bioinformatics. 2012;28(15):2062–2063. doi:10.1093/bioinformatics/bts344
22. McGeary SE, Lin KS, Shi CY, et al. The biochemical basis of microRNA targeting efficacy. Science. 2019;366(6472):eaav1741. doi:10.1126/science.aav1741
23. Pasquinelli AE. MicroRNAs and their targets: recognition, regulation and an emerging reciprocal relationship. Nat Rev Genet. 2012;13(4):271–282. doi:10.1038/nrg3162
24. Neogi T, Jansen TL, Dalbeth N, et al. Gout classification criteria: an American College of Rheumatology/European league against rheumatism collaborative initiative [published correction appears in arthritis rheumatol. Arthritis Rheumatol. 2015;67(10):2557–2568. doi:10.1002/art.39254
25. Dalbeth N, Merriman TR, Stamp LK. Gout. Lancet. 2016;388(10055):2039–2052. doi:10.1016/S0140-6736(16)00346-9
26. Meng Q, Meng W, Bian H, et al. Total glucosides of paeony protects THP-1 macrophages against monosodium urate-induced inflammation via MALAT1/miR-876-5p/NLRP3 signaling cascade in gouty arthritis. Biomed Pharmacother. 2021;138:111413. doi:10.1016/j.biopha.2021.111413
27. Hou J, Hsu JM, Hung MC. Molecular mechanisms and functions of pyroptosis in inflammation and antitumor immunity. Mol Cell. 2021;81(22):4579–4590. doi:10.1016/j.molcel.2021.09.003
28. Loveless R, Bloomquist R, Teng Y. Pyroptosis at the forefront of anticancer immunity. J Exp Clin Cancer Res. 2021;40(1):264. doi:10.1186/s13046-021-02065-8
29. Karki R, Kanneganti TD. Diverging inflammasome signals in tumorigenesis and potential targeting. Nat Rev Cancer. 2019;19(4):197–214. doi:10.1038/s41568-019-0123-y
30. Ruan J, Wang S, Wang J. Mechanism and regulation of pyroptosis-mediated in cancer cell death. Chem Biol Interact. 2020;323:109052. doi:10.1016/j.cbi.2020.109052
31. Dalbeth N, Choi HK, Joosten LAB, et al. Gout. Nat Rev Dis Primers. 2019;5(1):69. doi:10.1038/s41572-019-0115-y
32. Bodofsky S, Merriman TR, Thomas TJ, Schlesinger N. Advances in our understanding of gout as an auto-inflammatory disease. Semin Arthritis Rheum. 2020;50(5):1089–1100. doi:10.1016/j.semarthrit.2020.06.015
33. Chauhan D, Vande Walle L, Lamkanfi M. Therapeutic modulation of inflammasome pathways. Immunol Rev. 2020;297(1):123–138. doi:10.1111/imr.12908
34. Liu P, Xu H, Shi Y, Deng L, Chen X. Potential molecular mechanisms of plantain in the treatment of gout and hyperuricemia based on network pharmacology. Evid Based Complement Alternat Med. 2020;2020:3023127. doi:10.1155/2020/3023127
35. Lee SW, Lee SS, Oh DH, et al. Genetic Association for P2X7R rs3751142 and CARD8 rs2043211 Polymorphisms for Susceptibility of Gout in Korean Men: multi-Center Study. J Korean Med Sci. 2016;31(10):1566–1570. doi:10.3346/jkms.2016.31.10.1566
36. Samir P, Kesavardhana S, Patmore DM, et al. DDX3X acts as a live-or-die checkpoint in stressed cells by regulating NLRP3 inflammasome. Nature. 2019;573(7775):590–594. doi:10.1038/s41586-019-1551-2
37. Marleaux M, Anand K, Latz E, et al. structure of the human NLRP9 pyrin domain suggests a distinct mode of inflammasome assembly. FEBS Lett. 2020;594(15):2383–2395. doi:10.1002/1873-3468.13865
38. Zhu S, Ding S, Wang P, et al. Nlrp9b inflammasome restricts rotavirus infection in intestinal epithelial cells. Nature. 2017;546(7660):667–670. doi:10.1038/nature22967
39. Veeranki S, Duan X, Panchanathan R, Liu H, Choubey D. IFI16 protein mediates the anti-inflammatory actions of the type-I interferons through suppression of activation of caspase-1 by inflammasomes. PLoS One. 2011;6(10):e27040. doi:10.1371/journal.pone.0027040
40. Wang J, Zhang Y, Liu L, Yang T, Song J. Circular RNAs: new biomarkers of chemoresistance in cancer. Cancer Biol Med. 2021;18(2):421–436. doi:10.20892/j.issn.2095-3941.2020.0312
41. Ward Z, Pearson J, Schmeier S, Cameron V, Pilbrow A. Insights into circular RNAs: their biogenesis, detection, and emerging role in cardiovascular disease. RNA Biol. 2021;18(12):2055–2072. doi:10.1080/15476286.2021.1891393
42. Li ML, Wang W, Jin ZB. Circular RNAs in the Central Nervous System. Front Mol Biosci. 2021;8:629593. doi:10.3389/fmolb.2021.629593
 © 2023 The Author(s). This work is published and licensed by Dove Medical Press Limited. The full terms of this license are available at https://www.dovepress.com/terms.php and incorporate the Creative Commons Attribution - Non Commercial (unported, v3.0) License.
By accessing the work you hereby accept the Terms. Non-commercial uses of the work are permitted without any further permission from Dove Medical Press Limited, provided the work is properly attributed. For permission for commercial use of this work, please see paragraphs 4.2 and 5 of our Terms.
© 2023 The Author(s). This work is published and licensed by Dove Medical Press Limited. The full terms of this license are available at https://www.dovepress.com/terms.php and incorporate the Creative Commons Attribution - Non Commercial (unported, v3.0) License.
By accessing the work you hereby accept the Terms. Non-commercial uses of the work are permitted without any further permission from Dove Medical Press Limited, provided the work is properly attributed. For permission for commercial use of this work, please see paragraphs 4.2 and 5 of our Terms.