")
Back to Journals » OncoTargets and Therapy » Volume 13
Expression Profile of GINS Complex Predicts the Prognosis of Pancreatic Cancer Patients
Authors Bu F, Zhu X , Yi X , Luo C, Lin K, Zhu J , Hu C, Liu Z, Zhao J, Huang C, Zhang W, Huang J
Received 5 August 2020
Accepted for publication 30 September 2020
Published 6 November 2020 Volume 2020:13 Pages 11433—11444
DOI https://doi.org/10.2147/OTT.S275649
Checked for plagiarism Yes
Review by Single anonymous peer review
Peer reviewer comments 2
Editor who approved publication: Dr Leo Jen-Liang Su
Fanqin Bu,1,2,* Xiaojian Zhu,3,* Xuan Yi,2,4,* Chen Luo,1,2 Kang Lin,1,2 Jinfeng Zhu,1,2 Cegui Hu,1,2 Zitao Liu,1,2 Jiefeng Zhao,1,2 Chao Huang,1,2 Wenjun Zhang,1,2 Jun Huang1
1Department of Gastrointestinal Surgery, Second Affiliated Hospital of Nanchang University, Nanchang, Jiangxi Province 330006, People’s Republic of China; 2Jiangxi Medical College of Nanchang University, Nanchang, People’s Republic of China; 3The Seventh Affiliated Hospital of Sun Yat-sen University, Shenzhen, People’s Republic of China; 4Department of Orthopedics, Second Affiliated Hospital of Nanchang University, Nanchang, Jiangxi Province 330006, People’s Republic of China
*These authors contributed equally to this work
Correspondence: Jun Huang Email [email protected]
Background: The GINS complex has been implicated in the prognosis of various cancers. It comprises four subunits, encoded by GINS1, GINS2, GINS3, and GINS4 genes. Based on the current understanding, no report exists on the role of the GINS complex in pancreatic cancer.
Methods: We employed various bioinformatics databases including GEPIA, UALCAN, GEPIA2, and Kaplan Meier Plotter to identify the expression profile of the four genes (GINS1, GINS2, GINS3, and GINS4), their correlation with pancreatic cancer grade as well as their prognostic value of in pancreatic cancer. Western blotting and qRT-PCR analyses were conducted to verify the expression profiles of the four genes in pancreatic cancer. CCK8 and EdU cell experiments were conducted to reveal the role played by the four genes in pancreatic cancer cell proliferation.
Results: Based on GEPIA, Western blotting, and qRT-PCR analyses, all the four genes in the GINS complex were overexpressed in pancreatic cancer. Notably, the expression of each member was significantly associated with pancreatic cancer grade. The prognostic analysis revealed that not only the whole GINS complex but also each individual were prognostic biomarkers for pancreatic cancer. CCK8 and EdU experiments demonstrated that inhibition of the expression of each GINS member lowered pancreatic cancer cell proliferation.
Conclusion: This work implicated GINS1, GINS2, GINS3, and GINS4 genes as critical prognostic markers for pancreatic cancer.
Keywords: GINS complex, pancreatic cancer, prognostic biomarker, pancreatic cancer cell proliferation
Introduction
Pancreatic cancer (PC) is considered among the most lethal malignancies, with its global incidence expected to rise to approximately 420,000 cases by the year 2020. Unfortunately, the 5-year survival rate of patients ranges between 5% and 10%, while the median survival time is 5–6 months, post-diagnosis.1,2 At present, cases of obesity and diabetic diseases are on the rise, which increases the risk of pancreatic cancer.3 Pancreatic cancer is mainly treated with surgery. However, surgical treatment for patients with advanced pancreatic cancer is poor.4 Also, the anatomical location of the pancreas is deep in the abdomen, thus most patients are diagnosed with advanced stages of pancreatic cancer.5 It is, therefore, fairly vital to uncover new biomarkers for early diagnosis and targeted therapy for pancreatic cancer patients.
The GINS complex comprises four subunits encoded by GINS1, GINS2, GINS3, and GINS4 genes. Every subunit has a helical bundle that functions as the main domain. Notably, the crystal structure of GINS has been reported to correlate with the initiation and progression of DNA replication.6 Following reports from previous studies, the dysregulation of the members in the GINS complex was revealed to correlate with the progression and prognosis in diverse cancers, including breast cancer, adrenal cortex adenocarcinoma, hepatocellular carcinoma, cervical cancer, lung adenocarcinoma, uterine endometrial carcinomas, and bladder cancer.7–13 However, no published findings have detected any member of the GINS complex in pancreatic cancer.
The emergence of bioinformatics tools has provided convenient, credible, and comprehensive methods to analyze the expression profiles, potential functions, and prognostic value of a diverse group of molecules. For instance, previous researchers adopted bioinformatic methods to identify TYMS as a prognostic biomarker in pancreatic cancer based on its expression profile, correlation with clinical parameters, and prognostic value.14 In our study, we employed several bioinformatics tools to identify the expressions of GINS1, GINS2, GINS3, and GINS4 genes and the prognostic value of the GINS complex in pancreatic cancer. Further, we conducted in vitro experiments to validate results generated from bioinformatics analyses and reveal the association between GINS expression and pancreatic cancer cell proliferation.
Methods
Ethics Approval and Consent to Participate
This study was approved by the Ethics Commitment of the Second Affiliated Hospital of Nanchang University (Nanchang, China). All experiments were performed according to relevant guidelines. We obtained informed consent each patient.
GEPIA Database
GEPIA (http://gepia.cancer-pku.cn/), a multifunctional molecular analysis platform based on TCGA data and GETx data containing 179 pancreatic cancer samples and 171 normal samples altogether,15 was employed to compare the mRNA expressions of GINS1, GINS2, GINS3, and GINS4 between pancreatic cancer and adjacent normal tissues. P-values were generated using the Student’s t-test. P-value <0.05 and |Log2FC| >1 signified differential expression of a gene in the two sets of tissues.
UALCAN Database
Here, we employed UALCAN (http://ualcan.path.uab.edu/index.html), an effective cancer data online analysis and mining website, mainly based on the relevant cancer data in the TCGA database,16 to compare the expression profiles of GINS1, GINS2, GINS3, and GINS4 in different pancreatic cancer grades. The amount of pancreatic cancer samples in different grades were 31 (grade1), 95 (grade2), 48 (grade3), and 2 (grade4). P-values were generated using the Student’s t-test. P-value <0.05 signified differential expression of a gene in different grades.
Human Protein Atlas
Human Protein Atlas (HPA) provides information on the tissue and cell distribution of 26,000 human proteins. Using highly specific antibodies, one can examine the expression of each protein in cell lines, human normal tissues, and tumor tissues via immunoassay techniques.17 We employed HPA to compare the protein expression of each member in the GINS complex in pancreatic cancer and pancreatic normal tissues. The incubation of each gene in pancreatic cancer and pancreatic normal tissues are using the same antibody. The patients selected for the comparing are the same gender of similar ages.
Prognostic Analysis via GEPIA2 and the Kaplan Meier Plotter
Similar to the GEPIA database, GEPIA2 (http://gepia2.cancer-pku.cn/) is an updated version that provides insights with higher resolution and more features.18 Pancreatic cancer patients were categorized into high-GINS expression and low-GINS expression groups based on the median expression values of the GINS complex, each group contained 89 samples. Subsequently, we compared the overall survival (OS) and disease-free survival (DFS) difference between the two groups using the Kaplan Meier survival plot. This procedure was purposed to identify whether the whole GINS complex could be considered as a prognostic signature in pancreatic cancer. We employed the Kaplan Meier Plotter (www.kmplot.com), an online prognostic analysis platform which analyzes the prognostic value of genes in 21 common cancer categories,19 to analyze the prognostic value of each individual in the GINS complex in pancreatic cancer following the results obtained by the OS and recurrence-free survival (RFS) difference. Using the median expression value, we categorized pancreatic cancer patients into high or low expression group. This procedure aimed to identify the prognostic value of each individual in the GINS complex in pancreatic cancer. Hazard ratio (HR) and p-value were depicted in every single plot.
cBioportal
cBioportal (https://www.cbioportal.org/) is an online database used to explore, visualize and analyze a variety of cancer genomics data.20 Herein, we employed (TCGA, PanCancer Atlas) dataset in cBioportal platform to analyze the genetic alterations of each member in the GINS complex in pancreatic cancer.
STRING and DAVID Database
The STRING (https://string-db.org/) database is widely used for the construction of interaction networks in more than 2000 organisms.21 Whereas, DAVID (https://david.ncifcrf.gov/) is a comprehensive database widely used for gene functional classification, annotation, and ID conversion.22 In this experiment, we used the STRING database to obtain 50 tightly associated co-expressed genes of the GINS complex. Subsequently, we employed the DAVID database to perform functional enrichment analysis of these genes. We comprehensively performed genetic classification of GINS1, GINS2, GINS3 and GINS4 and their 50 tightly associated co-expressed genes based on their associated biological process (BP), cell component (CC), molecular function (MF) and Kyoto Encyclopedia of Genes and Genomes (KEGG) pathways.
Tissues and Cell Lines
Pancreatic cancer and adjacent normal tissues (46 cases each) were collected from the Second affiliated hospital of Nanchang University. The pancreatic cancer cell lines (PANC-1, AsPC-1) were purchased from the Shanghai Cell Biobank of the Chinese Academy of Sciences. All pancreatic cancer cell lines were cultured in Dulbecco’s modification of Eagle’s medium Dulbecco (Gibco, USA). We supplemented all media with 10% fetal bovine serum (Gibco, USA), 1% penicillin, and streptomycin. All cell lines were incubated at 37°C with 5% CO2 and 95% humidity.
Cell Transfection
GINS1, GINS2, GINS3, GINS4 silencing plasmids (short hairpin GINS1-4, shGINS1-4), and silencing negative control plasmids (shNC) were synthesized and purchased from GenePharma Co., Ltd. (Shanghai, China). Briefly, the shRNA and shNC plasmids were transiently transfected into PANC-1 and AsPC-1 cells using Lipofectamine 3000 (Invitrogen, USA) according to the manufacturer’s instructions. After transfection, complete medium was replaced and incubated for 48h, we verified the effect of transfection and use it for subsequent experiments. Then, the multiplicity of infection (MOI) of the pancreatic cancer cell lines was evaluated according to the manufacturer’s instructions, after which we employed the green fluorescent shRNA plasmid and shNC plasmid packaged with lentivirus for stable transfection. We further observed the expression efficiency after 72 hours, using a fluorescence microscope. Subsequently, an appropriate amount of puromycin (0.5–2μg/mL, Sigma, USA) was used for cell clone screening for one week. Then, we conducted qRT-PCR and Western blot analysis to detect the gene silencing effect.
Western Blotting
In this assessment, we aimed to compare the protein level of each GINS member between pancreatic cancer tissues and adjacent normal tissues. Also, the efficiency of gene transfection was detected. Proteins from pancreatic cancer tissues, adjacent normal tissues, and those correspondingly processed pancreatic cancer cells were extracted using the RIPA lysate. The protein concentration was determined via the BCA assay. Briefly, an equal amount of protein was loaded onto a sodium dodecyl sulfate (SDS) gel. Then, protein bands on the gel were transferred onto a polyvinylidene difluoride membrane, the membrane was blocked for 2 hours using 5% skim milk powder at room temperature. Thereafter, we incubated the membrane for 24 hours at 4°C with primary antibody for GINS1 (ab181112, 1:10,000, Abcam), GINS2 (ab197123, 1:1000, Abcam), GINS3 (ab177515, 1:2000, Abcam), GINS4 (ab139683, 1:1000, Abcam), respectively. Subsequently, the membrane was incubated for 1h at room temperature (RT) with secondary antibodies of the same species. Notably, GAPDH was used as the house-keeping gene. The blotting patterns were detected using ECL (Millipore) and visualized under an X-ray film.
Quantitative Real-Time PCR
The purpose of the qRT-PCR experiment was to compare the transcriptional level of each GINS member between pancreatic cancer tissues and adjacent normal tissues. Furthermore, we evaluated the efficiency of gene transfection. Using the TRIzol reagent (Invitrogen, USA), total RNA was extracted from human pancreatic cancer tissues, adjacent normal tissues, and correspondingly processed pancreatic cancer cells following the manufacturer’s instructions. The concentration and purity of the extracted RNA were then tested. We used Prime Script RT Reagent kit (TaKaRa, Japan) to reverse transcribe RNA of high quality and quantity, whereby the PCR program was set according to the amplification steps in the SYBR Premix Ex Taq II kit (TaKaRa, Japan) manual, and run on real-time fluorescent quantitative PCR on the 7500 Model Real-Time PCR machine (Applied Biosystems, CA, USA). Subsequently, we performed a statistical analysis on the values. The primer sequences used in this study are shown in (Table 1).
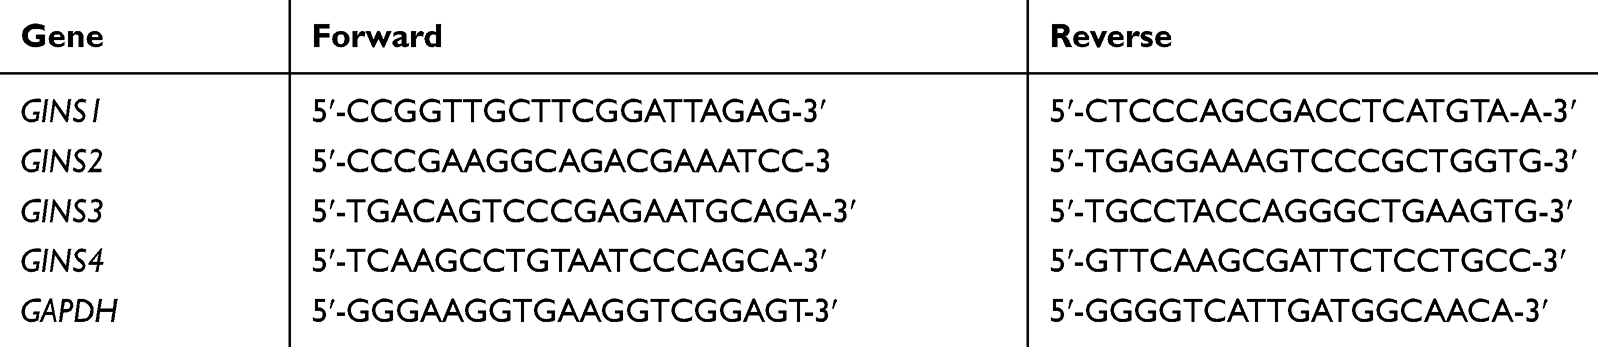 |
Table 1 The Primer Pairs Used for qRT-PCR in This Study |
Cell Growth Assays
EdU experiment detects cell proliferation. PANC-1 and AsPC-1 cells were digested with trypsin and centrifuged (1000 RPM) to obtain a suspension for counting. After proper dilutions, we transferred the complete medium containing pancreatic cancer cells into a 96-well plate (5000 cells/200μL) for pre-incubation at 37°C, 5% CO2 for 24h. Subsequently, cells in each well were respectively treated and incubated for the corresponding time, washed twice with pre-cooled PBS, then fixed with 4% paraformaldehyde. Further, we performed corresponding operations following the instructions stipulated the Edu kit (Ribobio, Guangzhou, China). Cell proliferation was assessed in each treatment group and the control group using a fluorescence microscope. Using the CCK-8 experiment, we could detect and analyze cell viability and proliferation ability. Each well of a 96-well plate was inoculated with 100μL suspension of PANC-1 and AsPC-1 cells (1×10⁴) and incubated at 37°C, 5% CO2. After incubation at different durations (1, 2, 3, 4, and 5 days), we processed the cells using the CCK-8 kit (Ribobio, Guangzhou, China) as per the manufacturer’s instructions. Subsequently, a microplate reader (Bio-Rad, USA) was used to measure the absorbance of each well at 450nm wavelength, then we calculated the average measurement for the absorbance.
Statistical Analysis
All experiments were performed triplicate. Statistical data were analyzed using SPSS 24.0 and GraphPad Prism7. Unpaired Student or one-way analysis of variance (ANOVA) was used to compare the differences between groups. P-value <0.05 was considered statistically significant.
Results
Both mRNA and GINS Complex Proteins are Upregulated in Pancreatic Cancer
Analysis of data in GEPIA database revealed an over expression of mRNA for each member of GINS complex in pancreatic cancer tissues compared to normal paired tissues (p-value <0.05) (Figure 1A-D). In particular, HPA showed GINS1, GINS2, GINS3 and GINS4 proteins were overexpressed in pancreatic cancer tissues (Figure 2). Western blotting and qRT-PCR tests showed comparable findings (Figure 3).
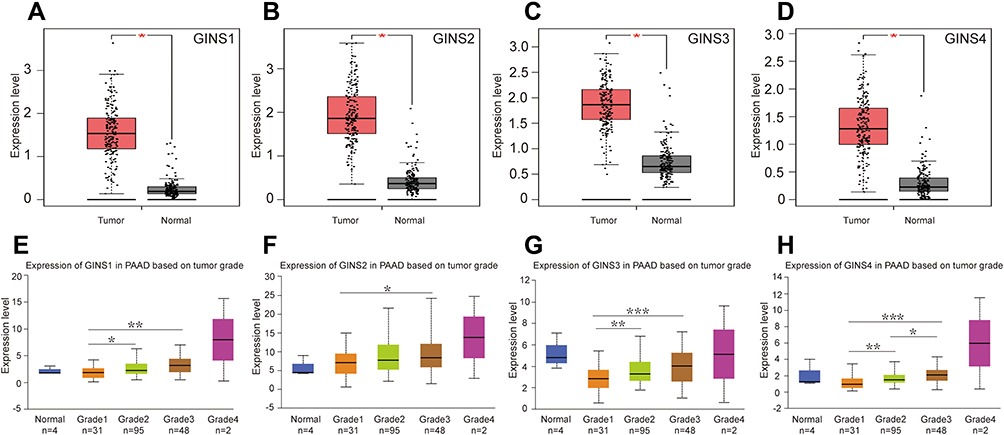 |
Figure 1 The mRNA expression of GINS complex and the correlation between GINS expression and pancreatic cancer grade.Notes: Comparative expressions of (A) GINS1, (B) GINS2, (C) GINS3 and (D) GINS4 in pancreatic cancer and adjacent normal pancreatic tissues by GEPIA. *p-value < 0.05. Correlations between (E) GINS1, (F) GINS2, (G) GINS3 and (H) GINS4 expressions and pancreatic tumor grade by UALCAN. *p-value < 0.05, ** p-value < 0.01, *** p-value < 0.001. |
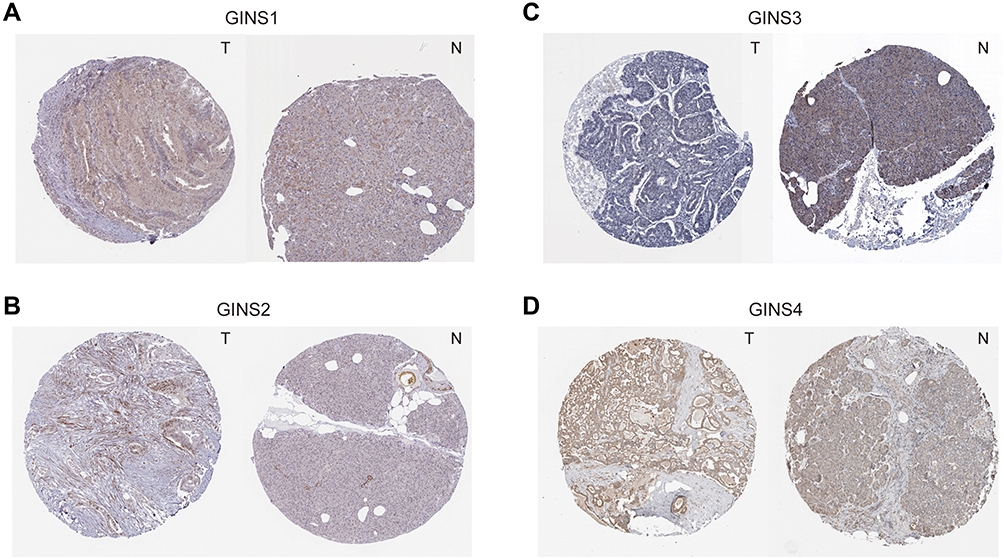 |
Figure 2 Immunohistochemistry test results for comparative expression of GINS complex proteins.Notes: Comparison of protein levels of (A) GINS1, (B) GINS2, (C) GINS3 and (D) GINS4 between pancreatic cancer and pancreatic tissues by Human Protein Atlas database. T: pancreatic cancer tissue, N: pancreatic tissue. |
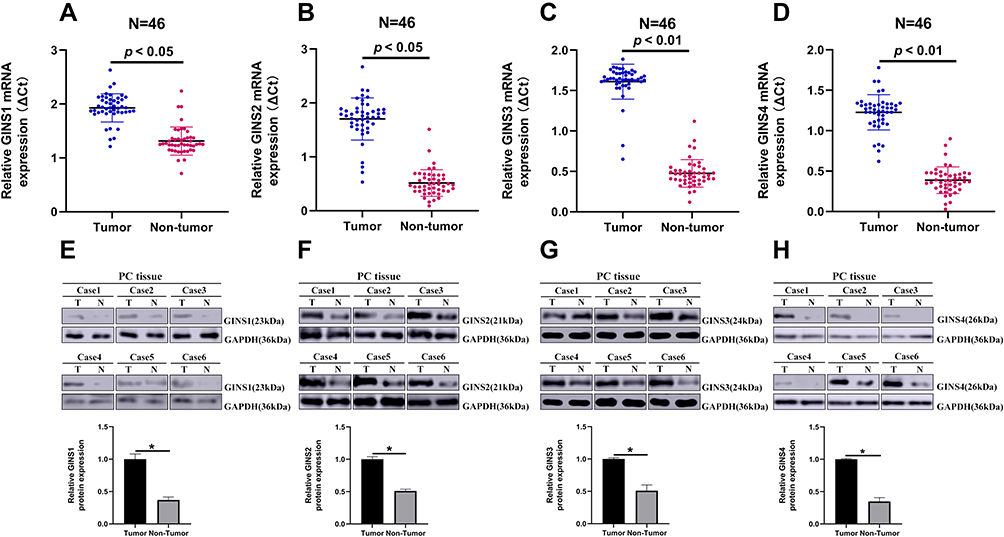 |
Figure 3 The expression of GINS1, GINS2, GINS3 and GINS4 in pancreatic cancer tissues.Notes: Relative expression levels of (A) GINS1, (B) GINS2, (C) GINS3 and (D) GINS4 in 46 paired pancreatic cancer tissues (T) and the corresponding non-tumor tissues (N) following qRT-PCR analysis. Representative Western blot images for the level of expression of (E) GINS1, (F) GINS2, (G) GINS3 and (H) GINS4 proteins in pancreatic cancer tissues. * p-value < 0.05. |
Expression Profile of Each Member in GINS Complex Correlates with Unique Clinical Presentation in Pancreatic Cancer
Analysis of data in UALCAN database uncovered an intriguing correlation between mRNA expressions signature for members of GINS complex and pancreatic cancer grade (Figure 1E-H), however, because of few grade4 pancreatic cancer samples together with their corresponding normal samples, we could not make meaningful statistically significant deductions. Notably, with the increasing of pancreatic cancer grade, the expression level of each GINS gene also increased. Among them, the difference in GINS1 expression between grade1 and grade3 (p-value <0.01), and between grade1 and grade2 (p-value <0.05) was statistically significant (Figure 1E). Meanwhile, GINS2 mRNA was higher upregulated in grade3 than in grade1 PC (p-value <0.05) (Figure 1F). On the other hand, the difference in GINS3 expression between grade1 and grade3 (p-value <0.001), and between grade1 and grade2 (p-value <0.01) was statistically significant (Figure 1G). Regarding GINS4, the difference in GINS4 expression between grade1 and grade3 (p-value <0.001), between grade1 and grade2 (p-value <0.01) and between grade2 and grade3 (p-value <0.05) was statistically significant (Figure 1H).
The Expression Level of GINS Complex Correlated with Poor Prognosis in Pancreatic Cancer Patients
Analysis of data from GEPIA 2 revealed that patients with high-GINS expression exhibited poor OS (Figure 4A) and DFS (Figure 4B) (p-value <0.05), implying that the whole GINS complex can predict the prognosis of pancreatic cancer patients. Kaplan Meier Plotter analysis revealed that the upregulation of any member of the GINS complex correlated with poor OS and RFS in pancreatic cancer patients (p-value <0.05) (Figure 4C-J).
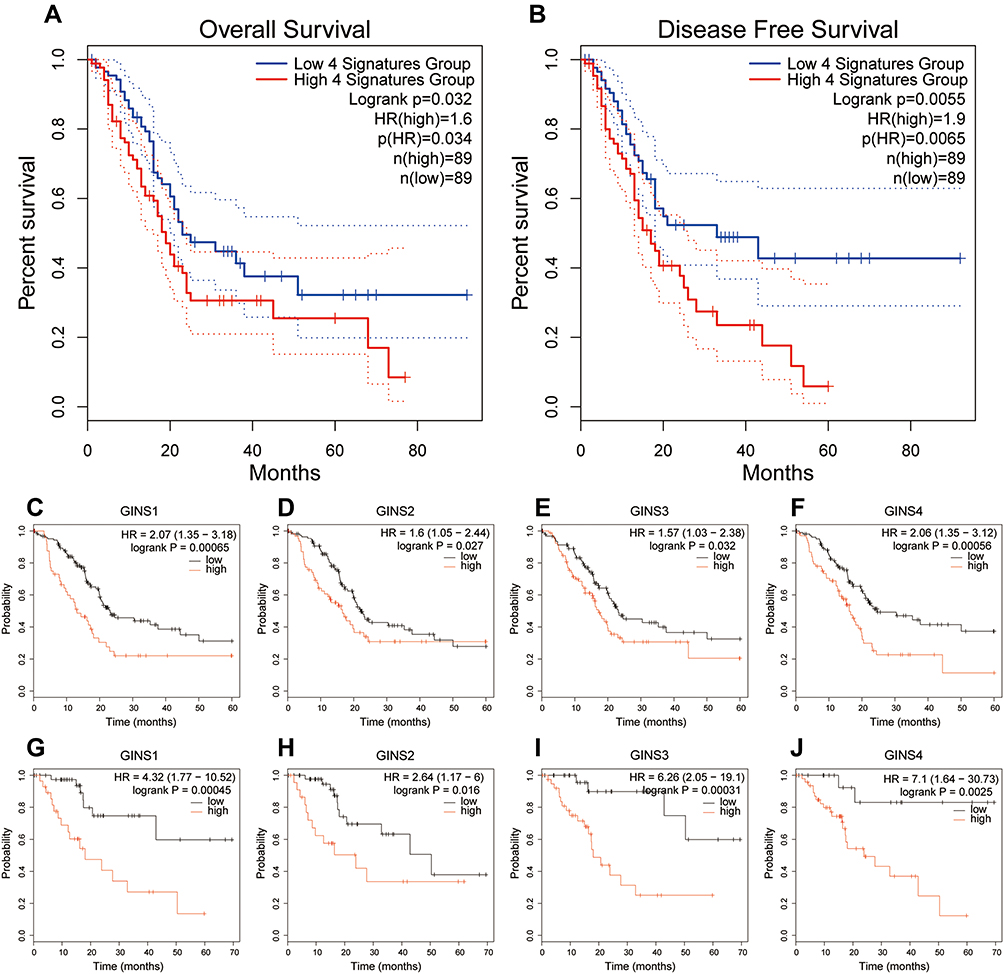 |
Figure 4 Prognostic value of GINS complex in pancreatic cancer.Notes: Difference in (A) Overall survival (OS) and (B) disease-free survival (DFS) between the high-GINS expression and low-GINS expression pancreatic cancer patients. The prognostic value of (C) GINS1, (D) GINS2, (E) GINS3 and (F) GINS4 based on overall survival of patients with pancreatic cancer. The prognostic value of (G) GINS1, (H) GINS2, (I) GINS3 and (J) GINS4 based on recurrence-free survival of pancreatic cancer patients. |
Genetic Alteration of Each Member in the GINS Complex
Meanwhile, analysis of data extracted from the cBioportal database showed that 35 of 168 samples for pancreatic cancer patients exhibited genetic alterations in the GINS complex, at 8% for (GINS1), 7% for (GINS2), 8% for (GINS3) and 10% for (GINS4Figure 5A). The most common genetic alteration in the four genes was mRNA high (Figure 5A).
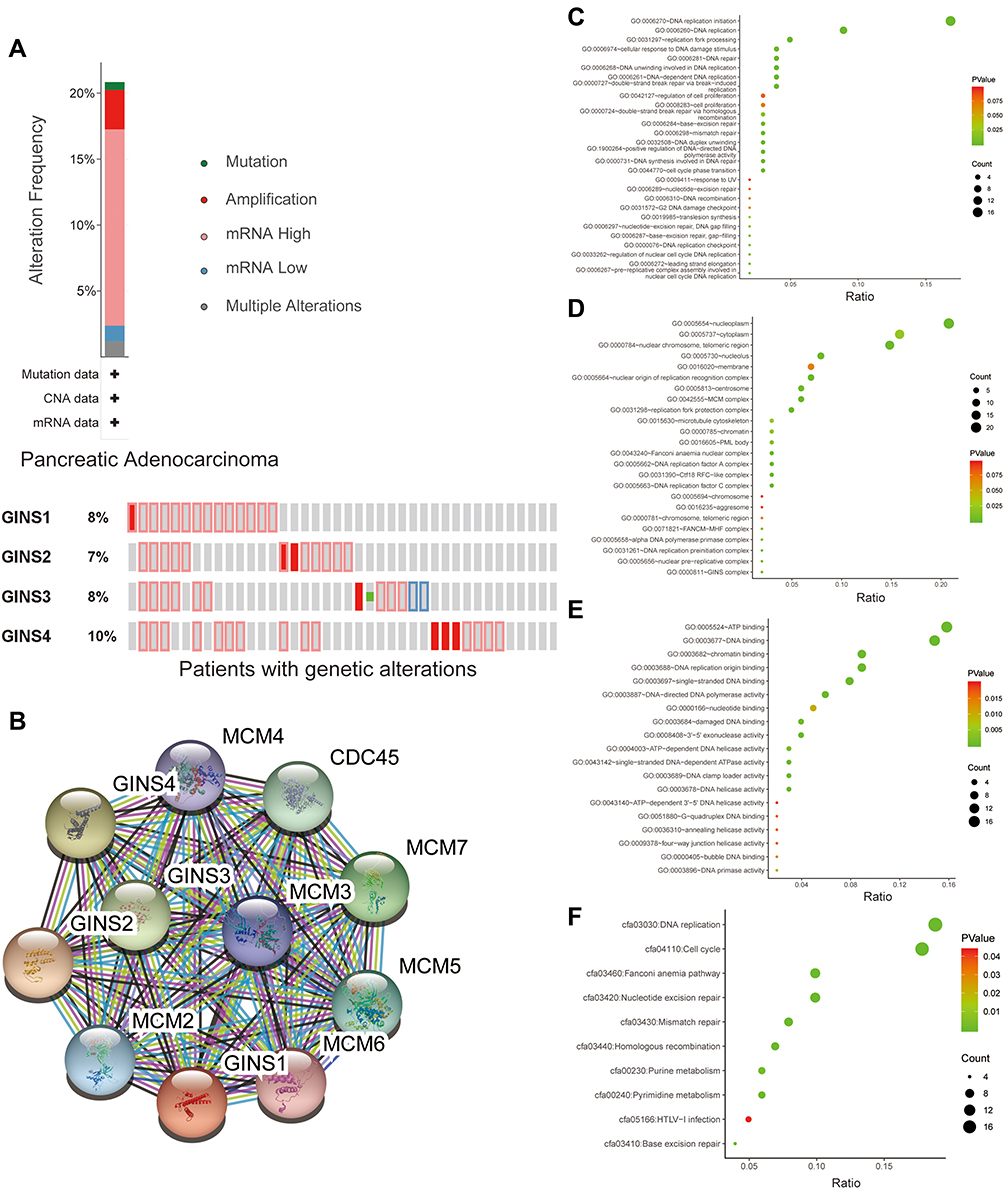 |
Figure 5 Genetic alteration analysis and functional enrichment analysis of GINS complex.Notes:(A) Molecular alteration of GINS complex in pancreatic cancer patients. (B) Genes closely co-expressed with GINS complex. Genetic classification of GINS and 50 closely associated co-expressed genes based on (C) biological process, (D) cell component, (E) molecular function and (F) Kyoto Encyclopedia of Genes and Genomes (KEGG) pathways. |
GINS Family and the Tightly Associated Genes are Mainly Enriched in DNA Replication
Further analysis of STRING database data uncovered MCM2, MCM3, MCM4, MCM5, MCM6, MCM7 and CDC45 (Figure 5B) as that the genes closely associated with GINS family. Subsequently, we performed functional enrichment analyses, including Gene ontology (GO) and KEGG (Kyoto Encyclopedia of Genes and Genomes) pathway analysis for 50 genes closely associated with GINS. GO analyses encompassed biological process (BP), cellular component (CC) and molecular function (MF) assessment. With regard to BP, the above genes participated in the DNA replication initiation and DNA replication (Figure 5C). On CC, these genes were enriched in nucleoplasm and cytoplasm (Figure 5D). Pertaining MF, these genes aided in ATP binding and DNA binding (Figure 5E). KEGG pathway analysis further revealed the enrichment of the above genes in DNA replication and progression of cell cycle (Figure 5F). In general, both BP and KEGG analyses revealed that GINS and their close associate genes influence DNA replication.
Down-Regulation of GINS Inhibits the Proliferation of Pancreatic Cancer Cells
We further validated the effect of down regulating GINS family on proliferation of pancreatic cancer cells. Western blot and qRT-PCR for the relative under-expression of each member in GINS family in PANC-1 and AsPC-1 cells is shown in (Figure 6A-D). Both CCK8 (Figure 6E-H) and EdU (Figure 7A-H) experiments showed the down regulation of any member in the GINS family significantly decreased the proliferation of pancreatic cancer cells (p-value <0.01).
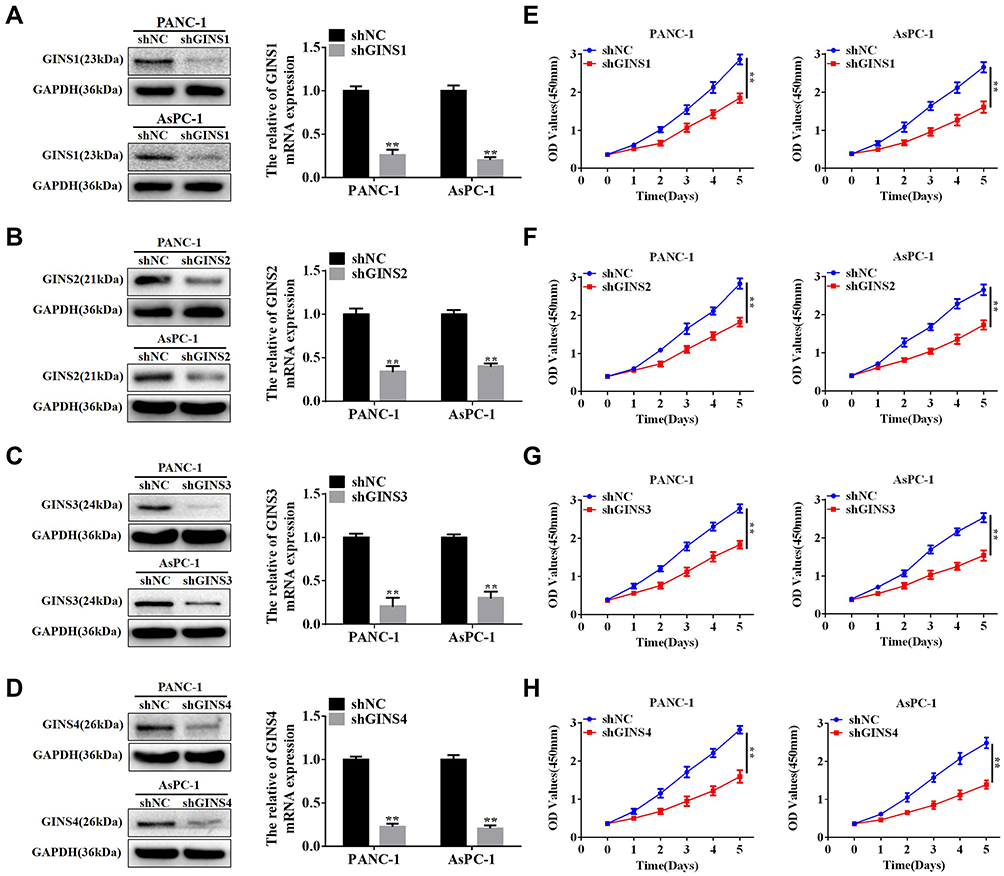 |
Figure 6 The relationship between down-regulation of GINS complex proteins and inhibition of proliferation for pancreatic cancer cells.Notes: Western blot and qRT-PCR assays for protein levels and mRNA expression for (A) GINS1, (B) GINS2, (C) GINS3 and (D) GINS4 in PANC-1 and AsPC-1 after shRNA transfection. **p-value <0.01. CCK8 assay for the correlation between down-regulation of (E) GINS1, (F) GINS2, (G) GINS3 and (H) GINS4 and the growth of pancreatic cancer cells. **p-value <0.01. |
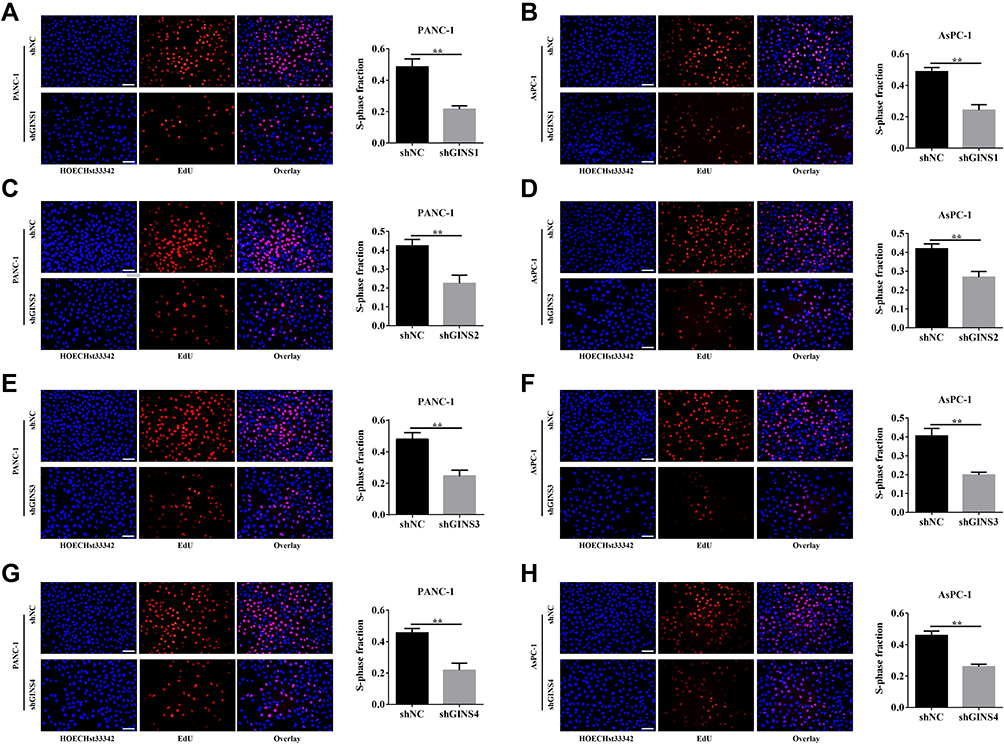 |
Figure 7 Effect of down-regulating GINS on the proliferation of pancreatic cancer cells.Notes: EdU assay for the correlation between down-regulations of (A,B) GINS1, (C,D) GINS2, (E,F) GINS3 and (G,H) GINS4 and the growth of pancreatic cancer cells. **p-value <0.01. |
Discussion
In general, dysregulation of any members of the GINS complex has been shown to be associated with the progression of cancers and affected prognosis of patients with varied tumors.7–13 However, to the best of our knowledge, no study on has evaluated the role of GINS complex on pancreatic cancer. Accordingly, we sought to explore molecular GINS signatures with potential diagnostic and prognostic value in patients with PC. We combined several bioinformatic tools and molecular analyses to comprehensively analyze the expression profiles, correlations with clinical parameters, prognostic value and functions associated with GINS complex in pancreatic cancer. Finding of this study will deepen our understanding of GINS complex with regard to pancreatic cancer. This can potentially enhance the clinical prognosis of patients with PC.
Although the role of GINS complex has not been extensively studied in pancreatic cancer, previous studies have implicated these genes in the progression of multiple cancer types.
In particular, studies show that GINS1, regulated by miR-101-5p, is over-expressed in breast cancer, promoting proliferation of breast cancer cells. Consequently, upregulation of GINS1 correlates with poor prognosis of breast cancer patients.7 A separate study also found GINS1 to be upregulated in synovial sarcoma, and this correlated with poor prognosis. As such, inhibition of GINS1 expression significantly impairs in vitro proliferation but promote apoptosis of cancer cells. Therefore, GINS1 has been targeted in osteosarcoma.23 Moreover, expression of GINS1 has been reported to correlate with the development of liver cancer adrenal cortex adenocarcinoma, non-small cell lung cancer and colorectal cancer.8,24–26 In our study, we demonstrated the transcription of GINS1 mRNA and the corresponding GINS1 proteins were upregulated in pancreatic cancer tissues compared to normal tissues. As is depicted in Figure 1E, expression of GINS1 correlated with pancreatic cancer grade, where the mRNA expression of GINS1 was higher in grade2 than in grade1 (p-value <0.05), and significantly higher in grade3 than in grade1 (p-value <0.01). Overexpression of GINS1 was also associated with poor OS and RFS for patients with pancreatic cancer. Accordingly, GINS1 knock-down inhibited the proliferation of pancreatic cancer cells. As such, GINS1 is a potential biomarker for the prognosis of pancreatic cancer.
GINS2 has been found to be dysregulated in multiple malignant tumors such as breast, cervical and liver cancers.9,10,27,28 Moreover, GINS2 expression was associated with deep matrix infiltration, recurrence and metastasis of pelvic lymph node and poor prognosis of cervical cancer patients.10 In our study, we found GINS2 to be over expressed in pancreatic cancer than paired normal tissues. In addition, GINS2 expression correlated with pancreatic cancer grade, with higher GINS2 mRNA expression closely associated with grade3 than grade1 PC (Figure 1F). Overexpression of GINS2 was further associated with poor OS and RFS of patients with PC. CCK-8 and EdU analyses further demonstrated the inhibition of pancreatic cancer cells proliferation following down-regulation of GINS2. Accordingly, GINS2 is a potential diagnostic and prognostic biomarker for pancreatic cancer.
GINS3 has also been found to be overexpressed in multiple cancers including lung adenocarcinoma, colorectal cancer and non-small cell lung cancer.11,29,30 In a related study, the level of GINS3 expression was correlated with proliferation of colorectal cancer. Conversely, GINS3 gene knockdown in human colon cancer cell lines inhibited proliferating of these cells, characterized by delayed progression of S-phase.29 In our study, we believe GINS3 is a potential target biomarker for pancreatic cancer based on its expression profile and its impact on the prognosis of pancreatic cancer patients. Moreover, GINS3 expression correlated with pancreatic cancer grade. Here, expression of GINS3 mRNA was upregulated in grade2 than in grade1 PC (p-value <0.01), and higher in grade3 than in grade1 PC cancer tissues (p-value <0.001). GINS3 expression additionally influenced the proliferation of pancreatic cancer cells.
On the other hand, one study revealed GINS4 was overexpressed in bladder cancer and gastric cancer.13,14 The expression of GINS4 further correlated with differentiation, tumor stage, invasion depth and lymph node metastasis of gastric cancer patients. Mechanistically, overexpressed GINS4 enhances cell proliferation by activating Rac1 and CDC42.31 In this study, GINS4 expression was upregulated in pancreatic cancer, and its expression strongly correlated with pancreatic cancer grade. As is shown in Figure 1H, the expression of GINS4 mRNA was higher in grade3 than in grade2 PC (p-value <0.05), its expression was higher in grade2 than in grade1 PC (p-value <0.01), and higher in grade3 than in grade1 PC (p-value <0.001). Also, in pancreatic cancer, GINS4 displayed the highest genetic alterations among the GINS members. The most common molecular alteration was the over-expression of mRNA. Moreover, overexpression of GINS4 was associated with poor prognosis of pancreatic cancer patients. In vitro experiments demonstrated down-regulation of GINS4 prohibited the proliferation of pancreatic cancer cells. Therefore, like other members of GINS, GINS4 is a potential biomarker for multiple parameters in pancreatic cancer.
In conclusion, all members of GINS complex were upregulated in pancreatic cancer. Notably, not only the whole GINS complex, overexpression of each individual in GINS family was correlated with poor prognosis in pancreatic cancer patients. Down-regulation of each GINS gene inhibited the proliferation of pancreatic cancer cells. Therefore, each member in the GINS complex is a unique biomarker in pancreatic cancer.
Data Sharing Statement
The data is available at request, subject to adhering to relevant guidelines.
Ethics Approval and Consent to Participate
This study was approved by the Ethics Commitment of the Second Affiliated Hospital of Nanchang University (Nanchang, China). All experiments were performed according to relevant guidelines, whereas all participants consented to the research.
Consent for Publication
Not applicable.
Funding
This study was funded by Jiangxi key research and development plan project of Jun Huang, No.20181BBG70019 and the National Natural Science Foundation of Jun Huang, No.82060445.
Disclosure
The authors report no conflicts of interest for this work.
References
1. Kamisawa T, Wood LD, Itoi T, et al. Pancreatic cancer. Lancet. 2016;388(10039):73–85. doi:10.1016/S0140-6736(16)00141-0
2. Rawla P, Sunkara T, Gaduputi V. Epidemiology of pancreatic cancer: global trends, etiology and risk factors. World J Oncol. 2019;10(1):10–27. doi:10.14740/wjon1166
3. Paternoster S, Falasca M. The intricate relationship between diabetes, obesity and pancreatic cancer. Biochim Biophys Acta Rev Cancer. 2020;1873(1):188326. doi:10.1016/j.bbcan.2019.188326
4. Lai E, Puzzoni M, Ziranu P, et al. New therapeutic targets in pancreatic cancer. Cancer Treat Rev. 2019;81:101926. doi:10.1016/j.ctrv.2019.101926
5. Halbrook CJ, Lyssiotis CA. Employing metabolism to improve the diagnosis and treatment of pancreatic cancer. Cancer Cell. 2017;31(1):5–19. doi:10.1016/j.ccell.2016.12.006
6. Chang YP, Wang G, Bermudez V, et al. Crystal structure of the GINS complex and functional insights into its role in DNA replication. Proc Natl Acad Sci U S A. 2007;104(31):12685–12690. doi:10.1073/pnas.0705558104
7. Toda H, Seki N, Kurozumi S, et al. RNA-sequence-based microRNA expression signature in breast cancer: tumor-suppressive miR-101-5p regulates molecular pathogenesis. Mol Oncol. 2020;14(2):426–446. doi:10.1002/1878-0261.12602
8. Xing Z, Luo Z, Yang H, et al. Screening and identification of key biomarkers in adrenocortical carcinoma based on bioinformatics analysis. Oncol Lett. 2019;18(5):4667–4676. doi:10.3892/ol.2019.10817
9. Lian YF, Li SS, Huang YL, et al. Up-regulated and interrelated expressions of GINS subunits predict poor prognosis in hepatocellular carcinoma. Biosci Rep. 2018;38:6. doi:10.1042/BSR20181178
10. Ouyang F, Liu J, Xia M, et al. GINS2 is a novel prognostic biomarker and promotes tumor progression in early-stage cervical cancer. Oncol Rep. 2017;37(5):2652–2662. doi:10.3892/or.2017.5573
11. Hokka D, Maniwa Y, Tane S, et al. Psf3 is a prognostic biomarker in lung adenocarcinoma. Lung Cancer. 2013;79(1):77–82. doi:10.1016/j.lungcan.2012.10.001
12. Park JK, Otsuka N, Tomaru U, et al. Clinicopathological significance of PSF3 expression in uterine endometrial carcinomas. Hum Pathol. 2018;80:104–112. doi:10.1016/j.humpath.2018.06.010
13. Yamane K, Naito H, Wakabayashi T, et al. Regulation of SLD5 gene expression by miR-370 during acute growth of cancer cells. Sci Rep. 2016;6:30941. doi:10.1038/srep30941
14. Fu Z, Jiao Y, Li Y, et al. TYMS presents a novel biomarker for diagnosis and prognosis in patients with pancreatic cancer. Medicine (Baltimore). 2019;98(51):e18487. doi:10.1097/MD.0000000000018487
15. Tang Z, Li C, Kang B, et al. GEPIA: a web server for cancer and normal gene expression profiling and interactive analyses. Nucleic Acids Res. 2017;45(W1):W98–W102. doi:10.1093/nar/gkx247
16. Chandrashekar DS, Bashel B, Balasubramanya S, et al. UALCAN: a portal for facilitating tumor subgroup gene expression and survival analyses. Neoplasia. 2017;19(8):649–658. doi:10.1016/j.neo.2017.05.002
17. Uhlen M, Zhang C, Lee S, et al. A pathology atlas of the human cancer transcriptome. Science. 2017;357:6352. doi:10.1126/science.aan2507
18. Tang Z, Kang B, Li C, et al. GEPIA2: an enhanced web server for large-scale expression profiling and interactive analysis. Nucleic Acids Res. 2019;47(W1):W556–W560. doi:10.1093/nar/gkz430
19. Hou GX, Liu P, Yang J, et al. Mining expression and prognosis of topoisomerase isoforms in non-small-cell lung cancer by using Oncomine and Kaplan-Meier plotter. PLoS One. 2017;12(3):e174515. doi:10.1371/journal.pone.0174515
20. Jiao XD, Qin BD, You P, et al. The prognostic value of TP53 and its correlation with EGFR mutation in advanced non-small cell lung cancer, an analysis based on cBioPortal data base. Lung Cancer. 2018;123:70–75. doi:10.1016/j.lungcan.2018.07.003
21. Szklarczyk D, Morris JH, Cook H, et al. The STRING database in 2017: quality-controlled protein-protein association networks, made broadly accessible. Nucleic Acids Res. 2017;45(D1):D362–D368. doi:10.1093/nar/gkw937
22. Li GM, Zhang CL, Rui RP, et al. Bioinformatics analysis of common differential genes of coronary artery disease and ischemic cardiomyopathy. Eur Rev Med Pharmacol Sci. 2018;22(11):3553–3569. doi:10.26355/eurrev_201806_15182
23. Tang L, Yu W, Wang Y, et al. Anlotinib inhibits synovial sarcoma by targeting GINS1: a novel downstream target oncogene in progression of synovial sarcoma. Clin Transl Oncol. 2019;21(12):1624–1633. doi:10.1007/s12094-019-02090-2
24. Zhou L, Sun XJ, Liu C, et al. Overexpression of PSF1 is correlated with poor prognosis in hepatocellular carcinoma patients. Int J Biol Markers. 2015;30(1):e56–e64. doi:10.5301/jbm.5000105
25. Kanzaki R, Naito H, Kise K, et al. PSF1 (Partner of SLD Five 1) is a prognostic biomarker in patients with non-small cell lung cancer treated with surgery following preoperative chemotherapy or chemoradiotherapy. Ann Surg Oncol. 2016;23(12):4093–4100. doi:10.1245/s10434-016-5392-z
26. Wei HB, Wen JZ, Wei B, et al. [Expression and clinical significance of GINS complex in colorectal cancer]. Zhonghua Wei Chang Wai Ke Za Zhi. 2011;14(6):443–447. Chinese.
27. Peng L, Song Z, Chen D, et al. GINS2 regulates matrix metallopeptidase 9 expression and cancer stem cell property in human triple negative breast cancer. Biomed Pharmacother. 2016;84:1568–1574. doi:10.1016/j.biopha.2016.10.032
28. Yan T, Liang W, Jiang E, et al. GINS2 regulates cell proliferation and apoptosis in human epithelial ovarian cancer. Oncol Lett. 2018;16(2):2591–2598. doi:10.3892/ol.2018.8944
29. Nagahama Y, Ueno M, Haraguchi N, et al. PSF3 marks malignant colon cancer and has a role in cancer cell proliferation. Biochem Biophys Res Commun. 2010;392(2):150–154. doi:10.1016/j.bbrc.2009.12.174
30. Tane S, Sakai Y, Hokka D, et al. Significant role of Psf3 expression in non-small-cell lung cancer. Cancer Sci. 2015;106(11):1625–1634. doi:10.1111/cas.12770
31. Zhu Z, Yu Z, Rong Z, et al. The novel GINS4 axis promotes gastric cancer growth and progression by activating Rac1 and CDC42. Theranostics. 2019;9(26):8294–8311. doi:10.7150/thno.36256
 © 2020 The Author(s). This work is published and licensed by Dove Medical Press Limited. The full terms of this license are available at https://www.dovepress.com/terms.php and incorporate the Creative Commons Attribution - Non Commercial (unported, v3.0) License.
By accessing the work you hereby accept the Terms. Non-commercial uses of the work are permitted without any further permission from Dove Medical Press Limited, provided the work is properly attributed. For permission for commercial use of this work, please see paragraphs 4.2 and 5 of our Terms.
© 2020 The Author(s). This work is published and licensed by Dove Medical Press Limited. The full terms of this license are available at https://www.dovepress.com/terms.php and incorporate the Creative Commons Attribution - Non Commercial (unported, v3.0) License.
By accessing the work you hereby accept the Terms. Non-commercial uses of the work are permitted without any further permission from Dove Medical Press Limited, provided the work is properly attributed. For permission for commercial use of this work, please see paragraphs 4.2 and 5 of our Terms.