")
Back to Journals » Cancer Management and Research » Volume 9
Expression profile analysis of long noncoding RNA in ER-positive subtype breast cancer using microarray technique and bioinformatics
Authors Peng J, Zhang L , Yuan CW, Zhou LH , Xu SG, Lin YP, Zhang J, Yin WJ, Lu JS
Received 7 September 2017
Accepted for publication 1 November 2017
Published 14 December 2017 Volume 2017:9 Pages 891—901
DOI https://doi.org/10.2147/CMAR.S151120
Checked for plagiarism Yes
Review by Single anonymous peer review
Peer reviewer comments 2
Editor who approved publication: Professor Harikrishna Nakshatri
Jing Peng,* Lei Zhang,* Chenwei Yuan, Liheng Zhou, Shuguang Xu, Yanping Lin, Jie Zhang, Wenjin Yin, Jinsong Lu
Department of Breast Surgery, Renji Hospital, School of Medicine, Shanghai Jiaotong University, Shanghai, People’s Republic of China
*These authors contributed equally to this work
Background: The estrogen receptor (ER)-positive subtype of breast cancer (BC) is the most common type of BC. A number of long noncoding RNAs (lncRNAs) play critical roles in cancer biology, including BC. Previous lncRNA profiling studies have focused only on triple-negative BC and HER 2-positive BC, and no studies have specifically focused on lncRNAs in ER-positive BC. In this study, we analyzed the expression profile of the lncRNAs and mRNAs found in this particular subtype of BC for the first time.
Methods: We evaluated lncRNA microarray data from four pairs of primary BC and adjuvant nontumor breast tissues. Then, we screened out the differently expressed genes and measured the correlation of the expression levels of lncRNAs and ERalpha by Pearson’s correlation coefficient analysis. We also performed classification and length distribution of the dysregulated lncRNAs. KEGG pathway analysis was used to understand the biological roles of these differently expressed genes. lncRNA–mRNA coexpression networks were constructed. Finally, RT-PCR was employed to validate the microarray analysis findings.
Results: We screened out 2,178 differently expressed lncRNAs, and 13 lncRNAs were found to be associated with the ER expression level. Classification analysis showed that most lncRNAs belonged to intergenic lncRNA and were from 400 to 800 nt in length. Chromosome distribution showed that many of the lncRNAs were mapped to chromosome 1. In the pathway analysis, most of the genes were related to cancer-associated behaviors, such as p53 signaling pathway, cell cycle, focal adhesion, and ECM–receptor interaction. lncRNA–mRNA coexpression networks were constructed, and the lncRNAs related to ESR1, BRCA1, and BRCA2 in the two groups were significantly different. The RT-PCR results were consistent with the data obtained from the microarrays.
Conclusion: These results provide useful information for exploring potential novel biomarkers as diagnosis and therapy targets for the clinical treatment of ER-positive BC.
Keywords: breast cancer, long noncoding RNA, estrogen receptor
Background
Breast cancer (BC) is the most common malignant tumor and one of the leading causes of death in female patients. Approximately 70% of all breast cancers express estrogen receptor (ER) alpha protein and belong to the luminal A or luminal B subtype BC. Although ER-positive BC patients always have a better prognosis than ER-negative patients do, many patients who are treated with endocrine therapy eventually develop resistance, leading to disease progression and death.1 Thus, early diagnosis and effective therapies for ER-positive BC are imperative. Plenty of evidence in recent years has demonstrated that lncRNAs act as crucial regulators in BC development and progression.2,3 For example, the lncRNA HOTAIR is increased in expression in primary breast tumors and tamoxifen-resistant BC, and the HOTAIR expression level in primary tumors is a powerful predictor of eventual metastasis.4,5
lncRNAs are RNA molecules longer than 200 nucleotides that lack a significant protein coding region. lncRNAs modulate gene transcription by rearranging chromatin via chromosomal looping and by affecting the binding of transcription factors. lncRNAs also affect miRNA functions by controlling pre-miRNA splicing or as miRNA sponges.6 Although they were first thought to be “transcription noise,” lncRNAs are increasingly being recognized as key regulators of fundamental biological processes. Accumulating reports of dysregulation of lncRNA across numerous cancer types suggest that aberrant lncRNA expression may be a major contributor to tumorigenesis, including that of breast cancer.7,8 Although microarray and RNA-sequencing data indicated that thousands of lncRNAs have been discovered in TNBC9–12 and HER2-positive BC,13 very few have been studied in detail in ER-positive BC, and the underlying pathways regulating ER-positive BC remain poorly understood.
Therefore, to identify novel therapeutic targets to combat BC, especially ER-positive BC, we analyzed the expression patterns of lncRNAs and mRNAs in ER-positive BC tissues and compared them with the corresponding patterns in adjacent nontumorous tissues. We identified more than 2180 unique lncRNAs and 2200 mRNAs that were significantly differentially expressed between BC samples and adjacent nontumorous samples using microarray technology. GO and pathway analyses were used to understand the biological roles of these differentially expressed genes. Gene coexpression network identified many lncRNAs that potentially play a key role in ER-positive BC pathogenesis. ER-related lncRNAs were also selected for further study. Finally, eight of the differentially expressed lncRNAs were verified by RT-PCR in another 12 pairs of tissue samples. Our results suggest that the lncRNA expression patterns may provide new molecular biomarkers for the diagnosis of ER-positive BC.
Methods
Tissue collection
Samples of BC tissues, consisting of tumors and adjacent sections from patients who had invasive BC were collected consecutively between November 2015 and March 2016 at Shanghai Renji Hospital, Shanghai, People’s Republic of China. All procedures that were performed in studies involving human participants were in accordance with the ethical standards of the institutional research committee and with the Helsinki Declaration and its later amendments or comparable ethical standards. Written informed consent was obtained from all patients before screening. The study was approved by the independent ethics committee of Renji Hospital, Shanghai Jiao Tong University. For consent for publication, informed consent was obtained from all individual participants included in the study. All patients were diagnosed with ER-positive subtype BC, both clinically and pathologically. Immunohistochemical staining of ER/progesterone receptor (PR) and florescence in situ hybridization of HER2 after surgery was used. There was no radiotherapy or chemotherapy prior to surgery. Primary BC tissues and their adjacent normal breast tissues were snap-frozen in liquid nitrogen immediately after resection and then stored at –80°C before RNA extraction.
RNA extraction and purification
Total RNA was extracted using TAKARA RNAiso Plus (Applied TAKARA, DaLian, People’s Republic of China), following the manufacturer’s instructions and checked for a RIN number to inspect the RNA integrity by an Agilent Bioanalyzer 2100 (Agilent technologies, Santa Clara, CA, USA). Qualified total RNA was further purified with RNeasy micro kit and RNase-Free DNase Set (QIAGEN, GmBH, Germany). Total RNA was amplified and labeled by Low Input Quick Amp WT Labeling Kit (Agilent Technologies), following the manufacturer’s instructions. Labeled cRNA were purified with RNeasy mini kit (QIAGEN).
Microarray
The labeled cRNAs were hybridized onto the Human lncRNA array V6.0 (4×180 K, Agilent, ID: 74348), including the global profiling of 77,103 human lncRNAs and 18,853 coding transcripts. Each slide was hybridized with 1.65 μg of Cy3-labeled cRNA using Gene Expression Hybridization Kit in Hybridization Oven (Agilent Technologies), according to the manufacturer’s instructions. After 17 hours of hybridization, slides were washed in staining dishes (Thermo Shandon, Waltham, MA, USA) with Gene Expression Wash Buffer Kit (Agilent Technologies), following the manufacturer’s instructions.
Slides were scanned by Agilent Microarray Scanner with default settings, Dye channel: Green, Scan resolution =3 μm, PMT 100%, 20 bit. Data were extracted with Feature Extraction software 10.7. Raw data were normalized using the Quantile algorithm and limma packages in R. The lncRNAs were obtained from authoritative databases (RefSeq, Ensembl, LNCipedia v3.1, UCSC_knowngenes, GENCODE v21). The mRNAs were collected from RefSeq and GENCODE. The lncRNA microarray analysis was performed by the Shanghai Biotechnology Corporation, Shanghai, People’s Republic of China.
Identification of differently expressed genes
Differentially expressed lncRNAs and mRNAs were then identified through fold change and p-values calculated using a independent-samples t-test. The threshold set for up- and downregulated genes was fold change (FC) ≥2.0 and p-value ≤0.05. A volcano plot was drawn by the R based on the differentially expressed gene analysis, and the color was determined by the filtering criteria. Then, hierarchical clustering was performed to display the distinguishable lncRNA and mRNA expression patterns among the samples.
GO Enrichment and pathway analysis
GO analysis and KEGG analysis were applied to determine the biological roles of these differentially expressed mRNAs, based on the latest GO database http://www.geneontology.org and KEGG database (http://www.genome.jp/kegg/). GO categories were considered to be significantly enriched only if the Fishers exact probability p-value <0.05.
Construction of pathway act network and coexpression network
To identify the interactions between mRNAs and lncRNAs, we constructed coexpression networks. We chose genes that were enriched in significant biological pathways (p<0.05) and used Cytoscape (V3.2.0; Institute of Systems Biology, Seattle, WA, USA) to construct a pathway act network for graphical representations of central pathways. A coexpression network based on the correlation analysis between the differentially expressed lncRNAs and mRNAs associated with cancer was constructed. lncRNAs and mRNAs with Pearson’s correlation coefficients 0.99 were used to construct the network.
Quantitative real-time reverse-transcription PCR
The total RNA of sample tissues was extracted and reverse transcribed into cDNA with random primers with a Reverse Transcription Kit (Takara, Naha, Japan), according to the manufacturer’s instructions. Standard qRT-PCR was performed to confirm the expression levels of differentially expressed lncRNAs with the Applied Biosystems step one plus System (ABI, Waltham, MA, USA) following the manufacturer’s guidelines. Briefly, the mixture of samples was incubated at 95°C for 10 min for an initial denaturation, followed by 40 PCR cycles of incubation at 95°C for 15 s, 60°C for 30 s, and 72°C for 30 s. Each sample analysis was performed in triplicate. The expression levels of lncRNAs were normalized to internal control GAPDH and then calculated with the 2-ΔΔCT method.
Statistical analysis
The data were analyzed using SPSS 20.0 software package (SPSS, Chicago, IL, USA). Differential expression levels of lncRNAs were compared by independent-samples t-test between the groups. Fisher’s exact test was used in GO and pathway analyses. All values are expressed as mean ± standard error of the mean. All experiments were repeated at least three times. Significance was accepted for p<0.05.
Results
Microarray expression profiles of lncRNAs in human ER-positive subtype BC
ER-positive subtype BC was identified by immunohistochemistry staining of ER, PR, and Her2, and fluorescence in situ hybridization was performed to confirm the expression level of Her2 (Figure 1). The results showed that the tissues we used were all ER- and PR-positive and HER2-negative.
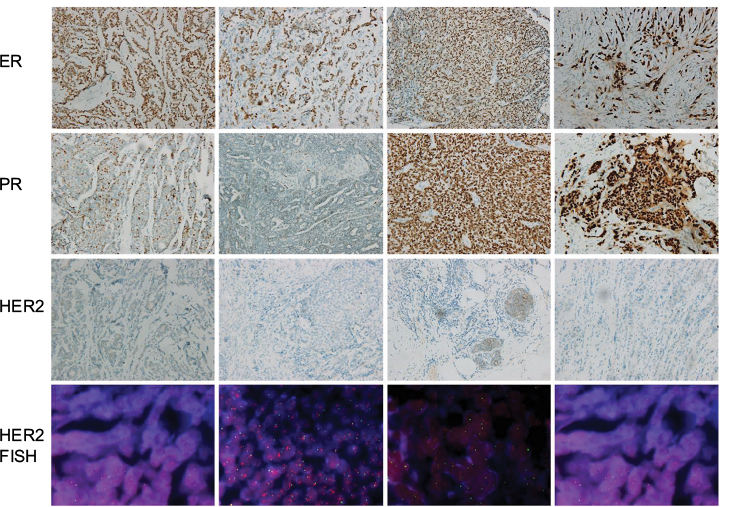 | Figure 1 IHC staining of ER/PR and FISH of HER2 (200×). Notes: The status of HER-2 expression level was evaluated by the ratio of Her2: centromere of chromosome 17 (red dots: green dots). The status of Her2 was defied as negative when the ratio of red dots: green dots <2. Abbreviations: ER, estrogen receptor; FISH, fluorescence in situ hybridization; IHC, immunohistochemistry; PR, progesterone receptor. |
Volcano and scatter plots were used to assess the gene expression variation between the ER-positive subtypes BC and adjuvant nontumor breast tissue (BN), and the heterogeneity between the groups was demonstrated clearly (Figure 2). The red and blue points on this graph represent lncRNAs that were upregulated or downregulated in BC tissues, respectively (FC >2 and p<0.05), and the gray points represent the remaining lncRNAs (FC <2 or p>0.05). The size of the red area corresponds to the number of differentially expressed lncRNAs; the larger the red area is, the more significant the heterogeneity is between samples.
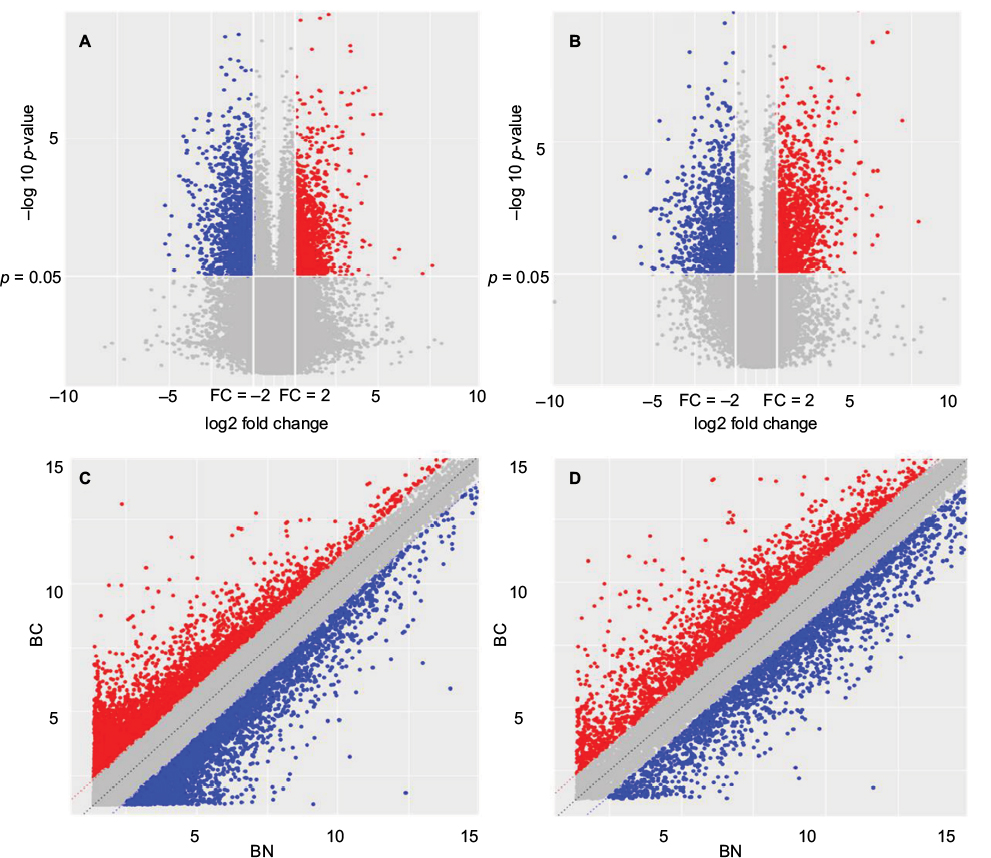 | Figure 2 Volcano plots and scatter plots demonstrating the heterogeneity between samples. (A, B) Volcano plots. The negative log of the p-value (base 10) was plotted on the Y-axis, and the log of the FC (base 2) was plotted on the X-axis. (C, D) Scatter plots. The values of the X and Y axes in the scatter plot are the averaged normalized signal values of the group (log2 scaled). The dash lines are FC lines. Red dots mean upregulated genes and blue dots mean downregulated genes. Abbreviations: BC, breast cancer; BN, adjuvant nontumor breast tissue; FC, fold change. |
According to the microarray expression profiling data, 91,007 lncRNA and 29,857 mRNA probes were detected. Genes with fFC >2 and p<0.05 were identified as significantly differentially expressed. Compared to the normal breast tissues, 2,178 lncRNAs displayed differential expression in tumor tissues, including 500 upregulated and 584 downregulated lncRNAs. We also found 2,225 differentially expressed mRNAs, of which 962 were upregulated and 836 were downregulated (Figure 3A). Hierarchical clustering was performed to show the systematic variations in the expression of lncRNAs and mRNAs in the ER-positive subtype BC samples using cluster 3.0.2 (Figure 3B and C). The top 50 up- and downregulated lncRNAs and mRNAs are shown in Table S1.
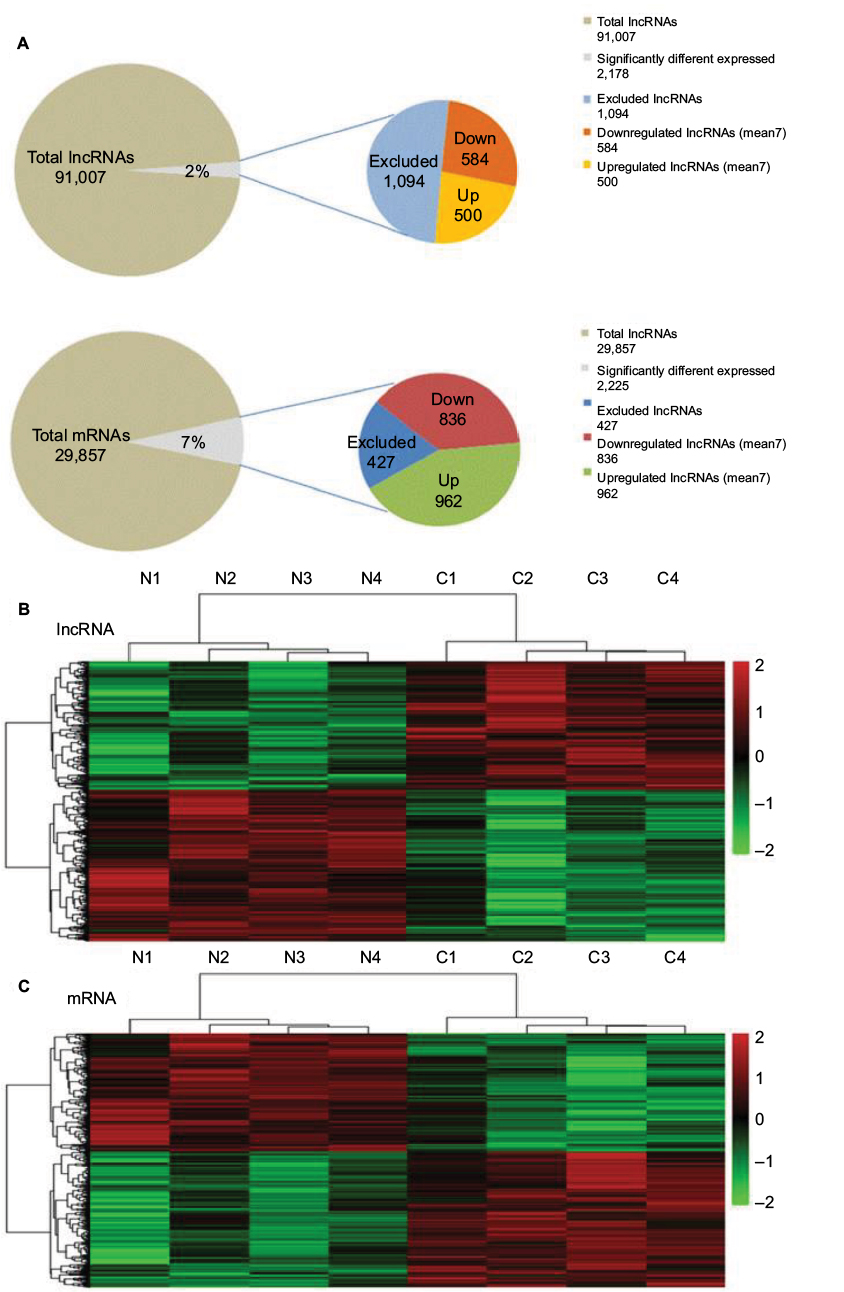 | Figure 3 Summary of microarray results. Notes: (A) A total of 91,007 lncRNAs and 29,857 mRNAs were detected, of which 2,178 lncRNAs and 2,225 mRNAs were differentially expressed between two groups (FC >2 and p<0.05). (B, C) Hierarchical clustering map. Differentially expressed lncRNAs(B) and mRNAs(C)in BC and its paired adjacent tissues were analyzed using hierarchical clustering. Each row represents one lncRNA or mRNAs, and each column represents one tissue sample. The relative lncRNA expression is depicted according to the color scale. Red indicates upregulation; green indicates downregulation. Abbreviations: BC, breast cancer; FC, fold change; lncRNA, long noncoding RNA. |
Differential lncRNA expression characteristics between BC and BN tissues
To further study the lncRNA expression patterns in BC tissues, we investigated the general signatures of the significantly altered lncRNAs, including their lncRNA classification, length distribution, and chromosome distribution (Figure 4). According to lncRNA position on the genome, we attributed lncRNAs to six categories (bidirectional, exonic antisense, exonic sense, intergenic, intronic antisense, and intronic sense). Classification analysis showed that most lncRNAs in our research belonged to intergenic lncRNAs and ranged from 400 to 800 nt in length. Chromosome distribution showed that a large amount of lncRNAs were mapped to chromosome 1, suggesting that chromosome 1 has a significant role in the development and/or progression of ER-positive BC.
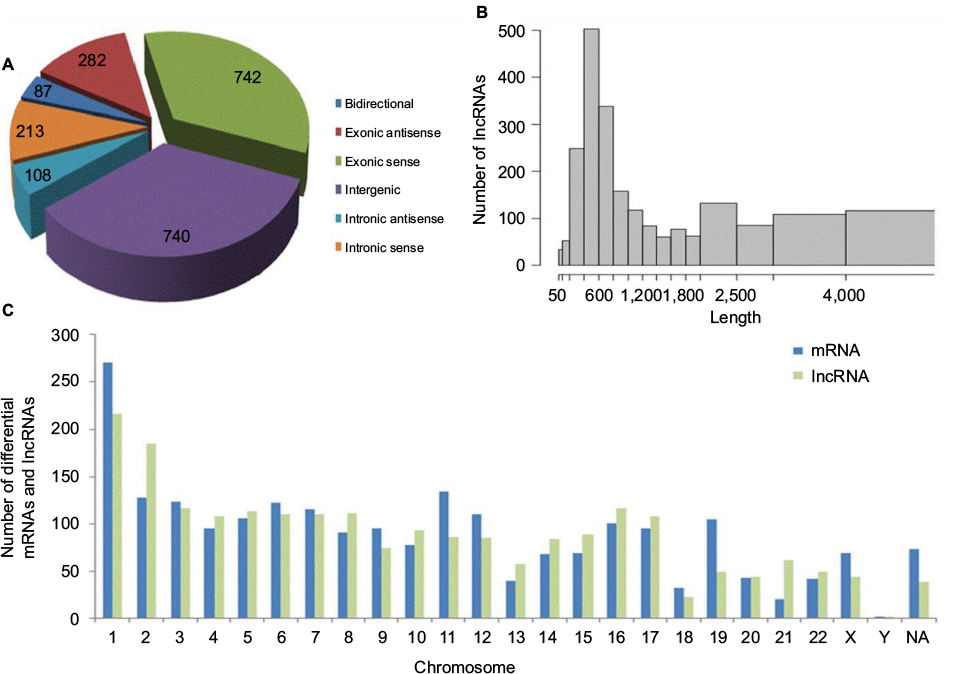 | Figure 4 General signatures of the significantly altered lncRNAs. Notes: (A) Classification of deregulated lncRNAs. The lncRNAs are mainly intergenic. (B) Length distribution of the dysregulated lncRNAs. The lncRNAs are mainly between 400 and 800 bp in length. (C) Chromosomal locations of variably expressed lncRNAs and mRNAs. A lot of lncRNAs were mapped to chromosome 1. Abbreviations: lncRNA, long noncoding RNA; NA, not annotated. |
GO and KEGG pathway analysis
The functional roles of most lncRNAs have not yet been identified, so their functions can be only indirectly predicted by analyzing the functions of their coexpressed mRNAs. We therefore performed GO analysis and KEGG pathway analysis (Figure 5) to explore the functional roles of dysregulated mRNAs. We included all differentially expressed mRNAs for GO analysis and found that the most enriched GO in the biological process domain included chromatin assembly, nucleosome assembly, mesenchymal cell proliferation, and DNA methylation on cytosine. Further, the most enriched GO in the cellular component GO domain included DNA packaging complex, nucleosome, and condensed chromosome kinetochore. In the KEGG pathway analysis, most of the genes that were assessed were proven to be related to cancer-associated behaviors, such as p53 signaling pathway, cell cycle, focal adhesion, and ECM–receptor interaction. Collectively, our data suggest that the differentially expressed lncRNAs and mRNAs are involved in the development of ER-positive BC.
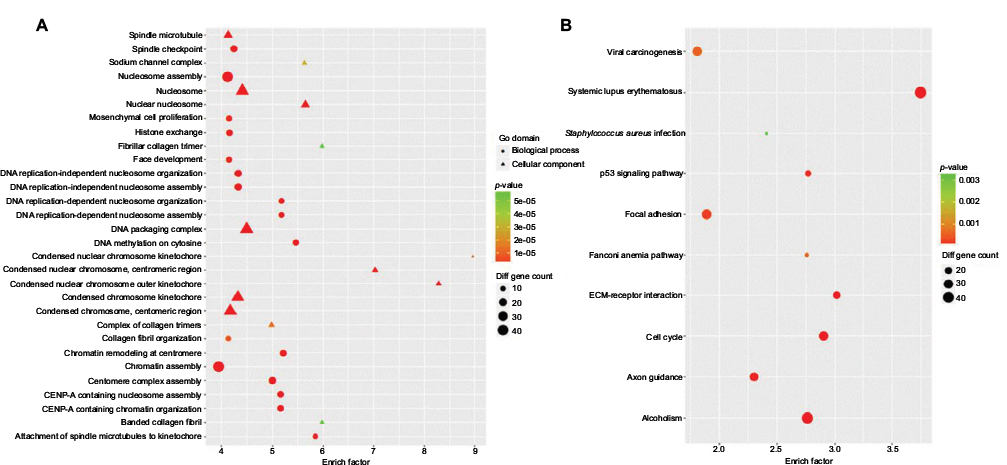 | Figure 5 GO and pathway analysis. Note: The top 30 GO terms (A) and top 10 KEGG pathway (B) of differently expressed mRNAs are shown. |
Differentially expressed lncRNAs associated with ER expression
We performed Pearson’s correlation coefficient analysis to assess the correlation between the expression levels of dysregulated lncRNAs and mRNAs. A correlation coefficient of >0.99 and p<0.05 were chosen as the cut-off. Thirteen lncRNAs were found to be associated with the ER mRNA expression level, and these lncRNAs may have important roles in the regulation of ER-positive BC (Table 1).
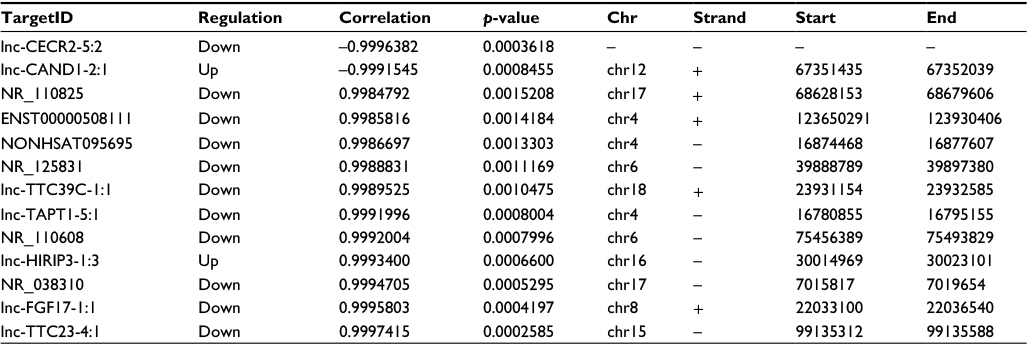 | Table 1 Dysregulated lncRNAs associated with ER expression Abbreviations: ER, estrogen receptor; lncRNA, long noncoding RNA. |
lncRNAs-mRNAs coexpression network
We constructed a coexpression network based on the correlation analysis between the differentially expressed lncRNAs and mRNAs. lncRNAs and mRNAs with Pearson’s correlation coefficients no less than 0.99 were used to construct the network. This result demonstrated that there were obviously different coexpression patterns between the tumor group and the normal group; BC and BN lncRNA–mRNA network data are shown in Table S2. lncRNAs related to ESR1, BRCA1, and BRCA2 in BC and BN groups were selected for further study. As shown in Figure 6, many more lncRNAs were involved in the BC group (Figure 6A) than in the BN group (Figure 6B), which means that the lncRNAs that relate to these three important genes may play a critical role in BC development. Thus, more detailed experiments need to be done to verify the biological function of these special lncRNAs.
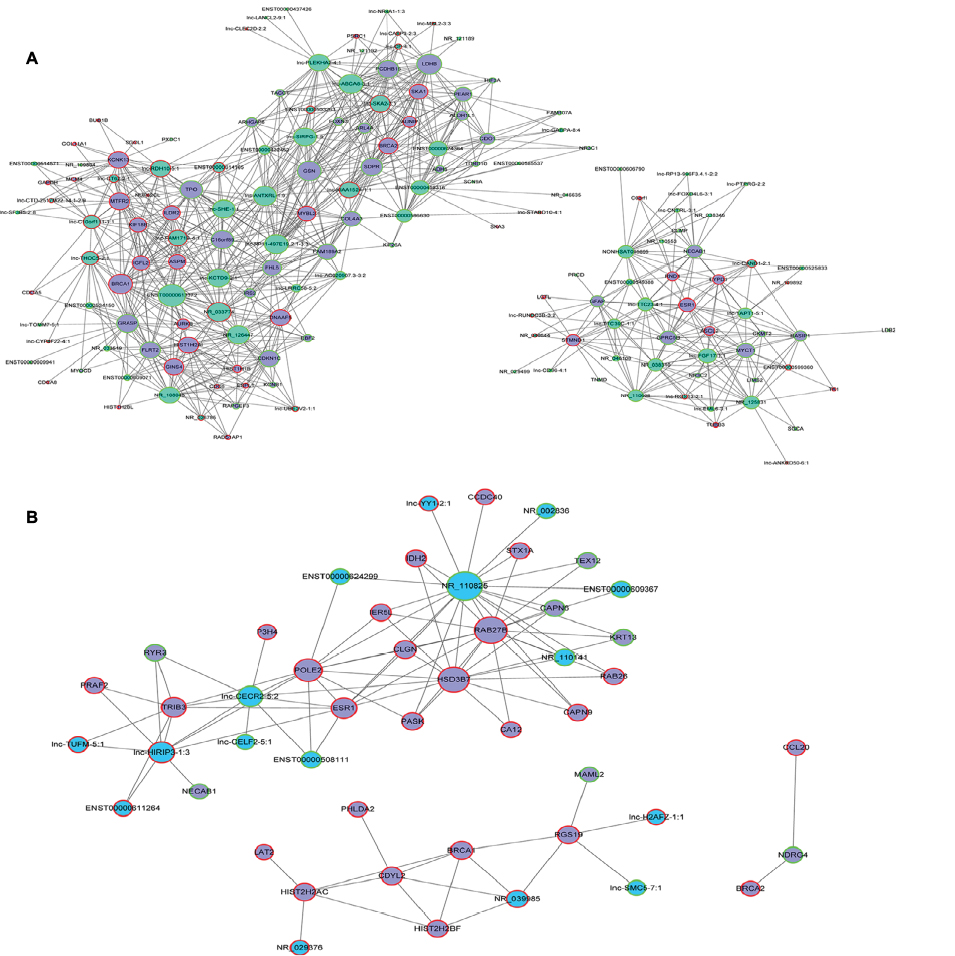 | Figure 6 lncRNA–mRNA coexpression network of ESR1, BRCA1, and BRCA2. Note: (A) Network of BC group and (B) network of BN group. Abbreviations: BC, breast cancer; BN, adjuvant nontumor breast tissue; lncRNA, long noncoding RNA. |
Verification of microarray profiling data using qRT-PCR
We then chose 8 candidate lncRNAs (4 upregulated and 4 downregulated) randomly and used qRT-PCR to analyze their expression patterns in 12 pairs of BC subtype tissues and corresponding nontumor tissues. As shown in Figure 7, the qRT-PCR results (black histogram) and microarray data (blue histogram) are consistent, which means that the microarray results that we used were reliable and represent the real expression pattern.
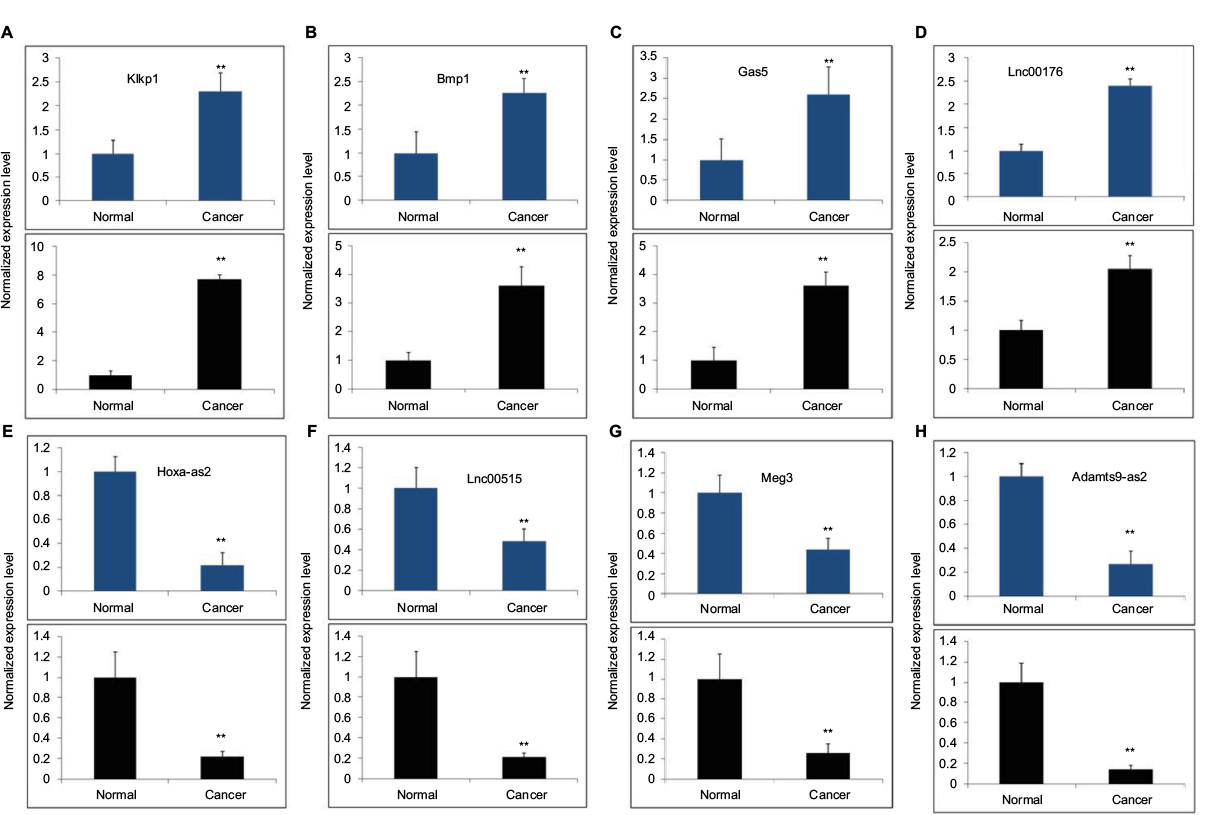 | Figure 7 Validation of the microarray data (blue) using qRT-PCR (black). Notes: Four upregulated lncRNAs: (A) Klkp1, (B) Bmp1, (C) Gas 5, and (D) Lnc00176, and four downregulated LncRNAs: (E) Hoxa-as2, (F) Lnc00515, (G) Meg3, and (H) Adamts9-as2 were determined to be differentially expressed in NC samples compared with BN samples were validated by qRT-PCR in 12 paired tissues. (**mean p<0.01). Abbreviations: BC, breast cancer; BN, adjuvant nontumor breast tissue; lncRNA, long noncoding RNA; NC, normal control. |
Discussion
To the best of our knowledge, our study is the first comprehensive description of differentially expressed lncRNAs in ER-positive subtype BC. Compared to adjacent BC tissues, we found that the lncRNA expression levels were altered; 790 upregulated and 637 downregulated lncRNAs were identified in BC tissues. We also performed a classification and length distribution of the dysregulated lncRNAs. ER expression-related lncRNAs were listed in our study, and these ER-associated genes may play important roles in the development of BC. Furthermore, the functions of these genes were analyzed by bioinformatics. The KEGG pathway network showed that the p53 signaling pathway, cell cycle, focal adhesion, and ECM–receptor interaction were the most involved pathways in the development of ER-positive BC. Coexpression network showed a comprehensive relationship between lncRNAs and mRNAs; the three genes ESR1, BRCA1, and BRCA2 and had the most different coexpression patterns between the tumor group and the normal group. Thirteen dysregulated lncRNAs were associated with ER expression, with a correlation coefficient of >0.99 and p<0.05. These lncRNAs may be crucial genes in ER-positive BC tumorigenesis and have not been reported previously.
Previous lncRNA profiling studies have focused only on TNBC and HER2-positive BC. Lv, Shen, and Chen researched the lncRNA expression patterns in TNBC and found that many lncRNAs were differentially expressed. Chen found that 10% of the dysregulated lncRNAs were mapped to chromosome 1.9 In our study, chromosome 1 also contained the most lncRNAs, which suggests that chromosome 1 has a significant role in the development of both TNBC- and ER-positive BC. The signaling pathway analysis in Lv’s study showed that PPAR pathway was the core pathway, but in our study, the p53 pathway was the most significant, and this difference may be due to the different subtypes of BC.11 Yang13 analyzed the expression profile of lncRNAs and mRNAs in HER-2-enriched subtype of breast cancer using next-generation sequencing and bioinformatics. AFAP1-AS1 was the most dysregulated lncRNA in HER-2-positive BC, with an FC of 9.79, whereas AC093850.2 was the most dysregulated lncRNA in our ER-positive BC, with an FC of 34.95. Taken together, we can see that different lncRNAs and signaling pathways play specific roles in different subtypes of BC. We verified the microarray profiling by using qRT-PCR. The qRT-PCR results and microarray data were consistent. Among these differentially expressed lncRNAs, some have been well studied, but others have not yet been reported. For example, Wan identified the differentially expressed androgen-responsive lncRNAs in prostate cancer patients using microarray analysis, and KLKP1 was validated as a directly AR-targeted lncRNA by chromatin immunoprecipitation-PCR.14 Li15 showed GAS5 to be a novel prognostic marker and candidate drug target for HER2-positive BC. Xie16 investigated lncRNA HOXA cluster antisense RNA2 (HOXA-AS2) expression, which is upregulated in human gastric cancer tissues, and the overexpression of HOXA-AS2 is associated with tumor size, TNM stage, and poor prognosis of gastric cancer. In our study, HOXA-AS2 was downregulated in ER-positive BC tissue, which may have been due to the different tumor types. MEG3 was also downregulated in our study, and a previous study reported that the decreased expression of lncRNA MEG3 acts as a potential predictor biomarker of the progression and poor prognosis of osteosarcoma.17 ADAMTS9 antisense RNA 2 (ADAMTS9-AS2), with an unknown function, is the antisense transcript of tumor suppressor ADAMTS9 and was downregulated in colorectal cancer tissue samples.18 Lnc00176, BMP1, and lnc00515 were first found to be dysregulated in BC in our study, and further studies must be done to better understand their detailed functions.
Limitations
Our study still has several limitations. Our sample size of sequenced tissues was very limited. Therefore, our results might not represent all lncRNA expression patterns in ER-positive BC. Another limitation is that the functions of these lncRNAs have not been determined. Further, in vitro and in vivo experiments are currently being conducted by our group to investigate the biological effects of the lncRNAs.
Conclusion
The dysregulated lncRNAs and mRNA expression profiles were sequenced and analyzed in ER-positive subtype BC in this study. These results analyzed the potential functions of lncRNAs and provide useful information for exploring candidate therapeutic targets and new molecular biomarkers for ER-positive enriched subtype BC.
Acknowledgments
This work is supported by grants from the National Natural Science Foundation of China [grant numbers 81172505 and 81302302], the Shanghai Municipal Commission of Health and Family Planning [grant numbers 20144Y0218, 201640006], the Science and Technology Commission of Shanghai Municipality [grant number 14411950202, 15JC1402700], the Medical School Foundation of Shanghai Jiaotong University [grant number 16XJ21002], and the Clinical Research Plan of SHDC [grant number SHDC 12016231].
Disclosure
The authors report no conflicts of interest in this work.
References
Hayes EL, Lewis-Wambi JS. Mechanisms of endocrine resistance in breast cancer: an overview of the proposed roles of noncoding RNA. Breast Cancer Res. 2015;17:40. | ||
Hansji H, Leung EY, Baguley BC, Finlay GJ, Askarian-Amiri ME. Keeping abreast with long non-coding RNAs in mammary gland development and breast cancer. Front Genet. 2014;5:379. | ||
Piao HL, Ma L. Non-coding RNAs as regulators of mammary development and breast cancer. J Mammary Gland Biol Neoplasia. 2012;17(1):33–42. | ||
Sun J, Chen X, Wang Z, et al. A potential prognostic long non-coding RNA signature to predict metastasis-free survival of breast cancer patients. Sci Rep. 2015;5:16553. | ||
Gupta RA, Shah N, Wang KC, et al. Long non-coding RNA HOTAIR reprograms chromatin state to promote cancer metastasis. Nature. 2010;464(7291):1071–1076. | ||
Guttman M, Amit I, Garber M, et al. Chromatin signature reveals over a thousand highly conserved large non-coding RNAs in mammals. Nature. 2009;458(7235):223–227. | ||
Vikram R, Ramachandran R, Abdul KS. Functional significance of long non-coding RNAs in breast cancer. Breast Cancer. 2014;21(5):515–521. | ||
Qi P, Du X. The long non-coding RNAs, a new cancer diagnostic and therapeutic gold mine. Mod Pathol. 2013;26(2):155–165. | ||
Chen C, Li Z, Yang Y, Xiang T, Song W, Liu S. Microarray expression profiling of dysregulated long non-coding RNAs in triple-negative breast cancer. Cancer Biol Ther. 2015;16(6):856–865. | ||
Liu YR, Jiang YZ, Xu XE, et al. Comprehensive transcriptome analysis identifies novel molecular subtypes and subtype-specific RNAs of triple-negative breast cancer. Breast Cancer Res. 2016;18(1):33. | ||
Lv M, Xu P, Wu Y, et al. LncRNAs as new biomarkers to differentiate triple negative breast cancer from non-triple negative breast cancer. Oncotarget. 2016;7(11):13047–13059. | ||
Shen X, Xie B, Ma Z, et al. Identification of novel long non-coding RNAs in triple-negative breast cancer. Oncotarget. 2015;6(25):21730–21739. | ||
Yang F, Lyu S, Dong S, Liu Y, Zhang X, Wang O. Expression profile analysis of long noncoding RNA in HER-2-enriched subtype breast cancer by next-generation sequencing and bioinformatics. Onco Targets Ther. 2016;9:761–772. | ||
Wan X, Huang W, Yang S, et al. Identification of androgen-responsive lncRNAs as diagnostic and prognostic markers for prostate cancer. Oncotarget. 2016,7(37):60503–60518. | ||
Li W, Zhai L, Wang H, et al. Downregulation of LncRNA GAS5 causes trastuzumab resistance in breast cancer. Oncotarget. 2016;7(19):27778–27786. | ||
Xie M, Sun M, Zhu YN, et al. Long noncoding RNA HOXA-AS2 promotes gastric cancer proliferation by epigenetically silencing P21/PLK3/DDIT3 expression. Oncotarget. 2015;6(32):33587–33601. | ||
Tian ZZ, Guo XJ, Zhao YM, Fang Y. Decreased expression of long non-coding RNA MEG3 acts as a potential predictor biomarker in progression and poor prognosis of osteosarcoma. Int J Clin Exp Pathol. 2015;8(11):15138–15142. | ||
Li Q, Dai Y, Wang F, Hou S. Differentially expressed Long non-coding RNAs and the prognostic potential in colorectal cancer. Neoplasma. 2016;6(36):977–983. |
 © 2017 The Author(s). This work is published and licensed by Dove Medical Press Limited. The full terms of this license are available at https://www.dovepress.com/terms.php and incorporate the Creative Commons Attribution - Non Commercial (unported, v3.0) License.
By accessing the work you hereby accept the Terms. Non-commercial uses of the work are permitted without any further permission from Dove Medical Press Limited, provided the work is properly attributed. For permission for commercial use of this work, please see paragraphs 4.2 and 5 of our Terms.
© 2017 The Author(s). This work is published and licensed by Dove Medical Press Limited. The full terms of this license are available at https://www.dovepress.com/terms.php and incorporate the Creative Commons Attribution - Non Commercial (unported, v3.0) License.
By accessing the work you hereby accept the Terms. Non-commercial uses of the work are permitted without any further permission from Dove Medical Press Limited, provided the work is properly attributed. For permission for commercial use of this work, please see paragraphs 4.2 and 5 of our Terms.