")
Back to Journals » OncoTargets and Therapy » Volume 9
Expression of MECOM is associated with unfavorable prognosis in glioblastoma multiforme
Authors Hou A , Zhao L, Zhao F, Wang W, Niu J, Li B, Zhou Z, Dongyuan Z
Received 6 September 2015
Accepted for publication 5 November 2015
Published 13 January 2016 Volume 2016:9 Pages 315—320
DOI https://doi.org/10.2147/OTT.S95831
Checked for plagiarism Yes
Review by Single anonymous peer review
Peer reviewer comments 3
Editor who approved publication: Professor Daniele Santini
Aiwu Hou,1,* Lizhen Zhao,1,* Fuzhen Zhao,2 Weiliang Wang,3 Jianyi Niu,1 Bingxuan Li,1 Zhongjin Zhou,1 Dongyuan Zhu4
1Department of Neurology, Yidu Central Hospital of Weifang City, 2Department of Orthopedics, People’s Hospital of Qingzhou City, 3Department of Psychiatrics, People’s Third Hospital of Weifang City, Weifang, 4Department of Medical Oncology, Shandong Cancer Hospital and Institute, Shandong Academy of Medical Sciences
*These authors contributed equally to this work
Background: MDS1 and EVI1 complex locus protein EVI1 (MECOM) is an oncogenic transcription factor in several kinds of cancers. However, the clinical significance of MECOM in glioblastoma multiforme (GBM) has not been well elucidated.
Patients and methods: Our study enrolled 86 resected samples of GBM in three medical centers. We detected the expression of MECOM in all the 86 samples by immunohistochemistry and compared the difference of MECOM mRNA between tumor tissues and adjacent tissues with real-time polymerase chain reaction. With immunoblotting, we detected the MECOM expression in different GBM cell lines. Moreover, we analyzed the correlation between MECOM expression and clinicopathologic factors with chi-square test, and evaluated the prognostic value of MECOM with univariate and multivariate analysis.
Results: In GBM tissue, the percentage of MECOM high expression is 41.9% (36/86). The mRNA of MECOM in tumor tissues is remarkably higher than that in adjacent tissues, indicating the oncogenic role of MECOM in GBM. MECOM exists in all the detected cell lines with different abundance. Moreover, MECOM is correlated with poorer overall survival rate (P=0.033) and can be identified as an independent prognostic factor in GBM (P=0.042).
Conclusion: MECOM could be considered as an independent prognostic factor in GBM, predicting it as a potential and promising molecular drug target.
Keywords: MECOM, glioblastoma multiforme, progression, prognosis
Introduction
Glioblastoma multiforme (GBM) is a grade IV astrocytoma and the most lethal primary brain tumor. Approximately 12,000 new GBM patients are diagnosed annually in the USA, encompasses more than 50% of all detected malignant primary brain cancers.1 Astrocytomas are graded based on nuclear atypia, mitosis, vascular endothelial proliferation and necrosis, which define the diagnosis criteria of GBM.2 GBM is featured with a large degree of tumor heterogeneity and easy invasion into surrounding tissues.3 As recommended by Stupp et al, the standard of GBM treatment includes maximal safe surgical resection followed by radiotherapy and maintenance chemotherapy based on temozolomide.4 Along with decades of improvements in surgery methods and adjuvant therapies, the survival rate and postoperational survival time have been elevated to some degree but are still unsatisfactory. The median survival time for GBM is only 14.6 months with a 2-year survival rate of 26%, although they have been remarkably improved.5 Although some potential drug targets have been discovered, including transforming growth factor-β, epidermal growth factor receptor, phosphatase and tensin homolog (PTEN) etc, the lethality of GBM is not significantly changed due to the efforts.6,7 Thus, there is still much urgency for new and effective biomarkers to help find more therapeutic targeted drugs.
MDS1 and EVI1 complex locus protein EVI1 (MECOM), also known as ecotropic virus integration site 1 protein homolog (EVI1), is a nuclear zinc finger transcription factor involved in many signaling pathways including cell cycle, proliferation, and differentiation. MECOM has been described as a proto-oncogene since it was first discovered in 1988.8 MECOM exhibits antiapoptotic effects by suppressing the JNK1-mediated phosphorylation of c-Jun.9 The oncogenic and prognostic role of MECOM is mainly studied in myeloproliferative neoplasms, especially in leukemia.10 A chromosomal aberration involving EVI1 is considered as a cause of chronic myelogenous leukemia, which is translocation t(3;21)(q26;q22). The correlation between MECOM and solid cancer progression has been reported sporadically, such as in breast cancer and ovarian cancer.11,12 As a transcriptional factor, MECOM regulates the expression of several target genes by directly binding DNA through its proximal zinc finger domain and recognizing a consensus sequence containing GA(C/T)AAGA(T/C)AAGATAA-like or GACAAGATA-like motifs.13,14
Our study enrolled 86 patients who suffered from GBM and had undergone surgical resection in three medical centers. We detected the expression of MECOM in all the 86 samples by immunohistochemistry, compared the difference of MECOM mRNA level between tumor tissues and adjacent tissues by real-time polymerase chain reaction (RT-PCR), and detected MECOM expression in different GBM cell lines with immunoblotting. Moreover, we analyzed the correlation between MECOM expression and clinicopathologic factors with chi-square test, and the prognostic value of MECOM with univariate and multivariate analysis.
Patients and methods
Patients and follow-up
The primary cohort consists of a total of 190 cases of patients who were diagnosed as GBM and underwent the surgery at three clinical centers (Central Hospital of Jinan City, Yidu Central Hospital of Weifang City, People’s Hospital of Qingzhou City) from 2003 to 2014. This study was reviewed and approved by the Institutional Clinical Ethics Review Boards of Central Hospital of Jinan City, Yidu Central Hospital of Weifang City, and Peoples Hospital of Qingzhou City, People’s Republic of China. Written informed consent was obtained from patients. The validation cohort consisting of 86 cases was selected from the primary cohort based on the following criteria: 1) no preoperational or postoperational adjuvant therapy including radio- or chemotherapy; 2) available follow-up and samples; 3) postoperational survival time was more than 1 month.
All the patients in the validation cohort underwent macroscopic total or near-total tumor resection and underwent the evaluation of Karnofsky Performance Scale. The overall survival time was calculated from the operation to the date of death or censored at the date of the last follow-up examination. The protocol of current study was managed as per the requirement of Reporting Recommendations for Tumor Marker Prognostic Studies.
Cell culture and reagents
Human glioma cell line U251MG, human glioblastoma cell lines U118MG and U87MG, A172 were purchased from Cell Bank of the Chinese Academy of Sciences (Shanghai, People’s Republic of China). All these cells were cultured in Dulbecco’s Modified Eagle’s Medium containing 10% fetal bovine serum supplemented with streptomycin (100 μg/mL) and penicillin (100 U/mL). MECOM primary antibody (Cat. 28100002) was from Novus Biologicals (Littleton, CO, USA). Lamin-A antibody (sc-6214) was purchased from Santa Cruz Biotechnology (Santa Cruz, CA, USA).
RNA extraction and RT-PCR
Fifteen pairs of glioma specimens and corresponding adjacent tissues were collected and contained in liquid nitrogen until RNA extraction. Total RNAs were extracted with TRIzol reagent (Invitrogen, Foster City, CA, USA) and RNeasy protect mini kit (Qiagen, Hilden, Germany) according to the manual of TRIzol. Levels of mRNAs were quantified by one-step RT-PCR with SYBR-Green PCR Master Mix (Applied Biosystems, Foster City, CA, USA). All tests were made in duplicate. The mean expression levels of 18S were used as the internal control for normalization. The primers of human MECOM were as follows: forward: tgaggatgactatgaagaaaccagt; reverse: gcagaaagtccacttttatattcttcc. The primers of 18S were: forward: cagccacccgagattgagca; reverse: tagtagcgacgggcggtgtg.
Immunohistochemistry and evaluation
The streptavidin–biotin immunoperoxidase assay was used to detect formalin-fixed and paraffin-embedded samples by immunohistochemical (IHC) staining. Briefly, slides were incubated in 3% hydrogen peroxide for endogenous peroxidase inactivation, in citrate buffer (pH =6.0) for immunoreactivity enhancement and in 5% bovine serum albumin for unspecific binding exclusion. After that, the samples were incubated in primary antibody at 1:200 dilution, secondary antibodies and streptavidin peroxidase complex reagent successively, and finally the staining was visualized in 3,3′-diaminobenzidine solution. Slides were blindly scored by two independent pathological investigators unaware of the clinical information.
The results of IHC included two aspects: the staining intensity and the proportion of positively-stained tumor cells. The score of positively-stained tumor cells was defined as: 0, less than 5% positive tumor cells; 1, 6%–30% positive tumor cells; 2, 31%–50% positive tumor cells; 3, more than 50% positive tumor cells. The staining intensity was defined as: 0 (no staining), 1 (weak staining, light yellow), 2 (moderate staining, yellowish brown), 3 (strong staining, brown). The final score was the product of the score of staining intensity multiplied by the score of positively-stained tumor cells. High MECOM expression was identified as score ≥4 and low MECOM expression was identified as score <4.
Statistical analysis
SPSS17.0 software (SPSS Inc., Chicago, IL, USA) was used to make statistical analysis. The difference between MECOM mRNA in the adjacent tissues and tumor tissues was compared by Student’s t-test. The relationships between the MECOM expression and clinicopathologic features were analyzed by chi-square test. The overall survival rate was evaluated by the Kaplan–Meier method, and the difference in survival curves was analyzed by the log-rank test. Independent prognostic factors were identified by the Cox proportional hazards regression model. P<0.05 was considered statistically significant.
Results
MECOM expression in GBM tissue and cell lines
The expression of MECOM was detected by IHC in GBM tissues as described in “Patients and materials” section. According to the IHC score criteria, 41.9% (36/86) of the cohort was classified as the high-MECOM group, and 58.1% (50/86) of the cohort was classified as the low-MECOM group. MECOM was mainly observed in the nucleus of GBM cells, which was predictable because MECOM mainly functions as a transcription factor (Figure 1A).
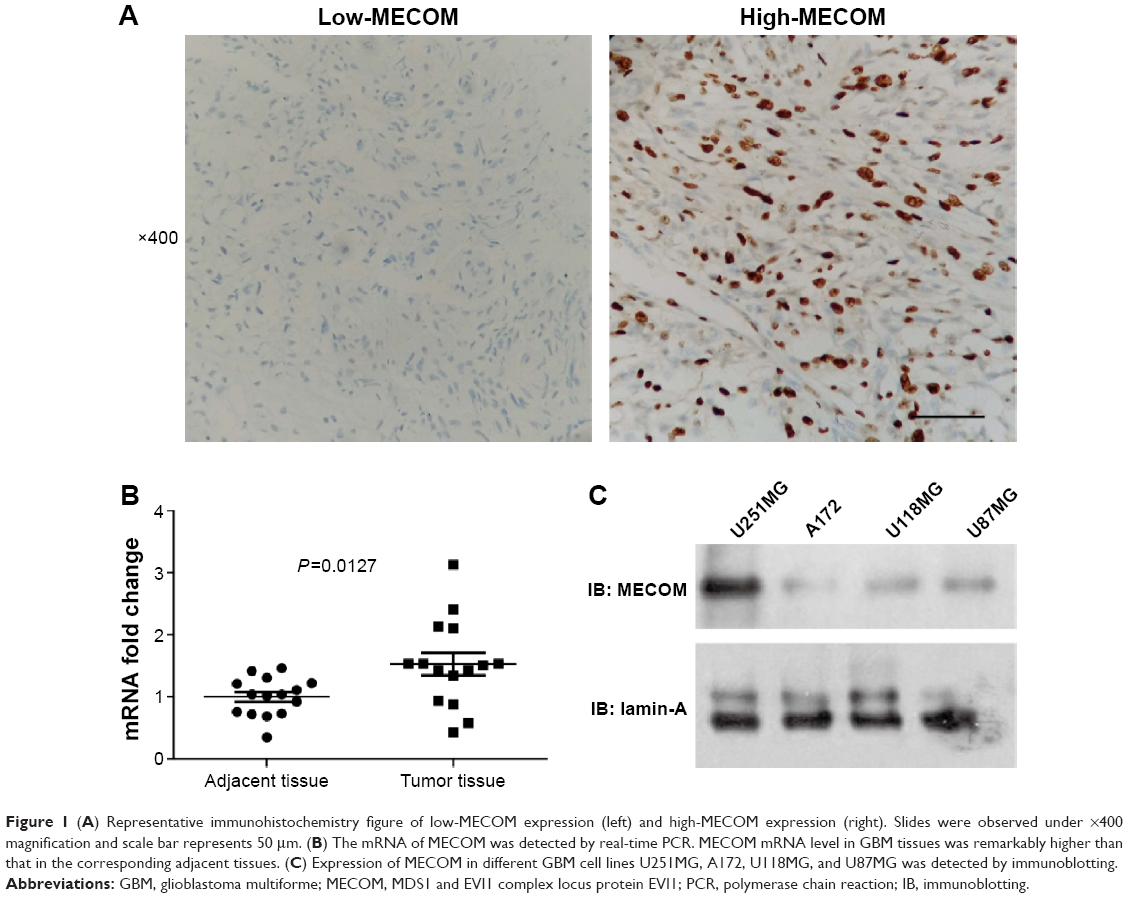 | Figure 1 (A) Representative immunohistochemistry figure of low-MECOM expression (left) and high-MECOM expression (right). Slides were observed under ×400 magnification and scale bar represents 50 μm. (B) The mRNA of MECOM was detected by real-time PCR. MECOM mRNA level in GBM tissues was remarkably higher than that in the corresponding adjacent tissues. (C) Expression of MECOM in different GBM cell lines U251MG, A172, U118MG, and U87MG was detected by immunoblotting. |
Moreover, to confirm the results observed by IHC, we further compared the mRNA levels of MECOM in 15 pairs of frozen GBM tissues and the corresponding adjacent tissues (Figure 1B). The mRNA level of MECOM in GBM tissues was significantly higher than that in the adjacent tissues (P=0.0127), suggesting that MECOM may play a driving role in GBM oncogenesis. In addition, four cell lines of GBM were selected to detect MECOM expression, including U251MG, A172, U118MG, and U87MG. U251MG had the relatively highest MECOM expression in all the four detected cell lines, followed by U118MG and U87MG, which had similar MECOM expression level, and A172 had the lowest level of MECOM (Figure 1C).
Correlation between MECOM expression and clinicopathologic parameters
Chi-square test was performed to evaluate the correlation between MECOM expression and clinicopathologic parameters of GBM, including age, sex, Karnofsky Performance Scale, and extent of resection (Table 1). However, no significant correlation between MECOM and these factors was observed.
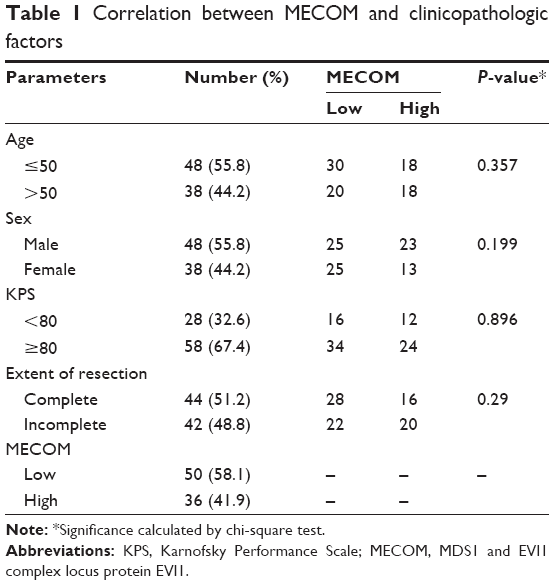 | Table 1 Correlation between MECOM and clinicopathologic factors |
Prognostic value of MECOM
Prognostic significance of MECOM expression was evaluated by univariate analysis with the Kaplan–Meier method, and multivariate analysis with the Cox-regression model (Table 2). In univariate analysis, high MECOM expression was significantly associated with poorer prognosis (P=0.033) (Figure 2), and 1-year survival rate of high and low MECOM was 64.7% and 20.6%, respectively. Moreover, the extent of resection was also defined as a prognostic factor (P=0.028). Incomplete surgical resection was demonstrated to have more unfavorable prognosis than complete resection. Multivariate analysis was performed to identify the independent prognostic factor with Cox-regression model. In the multivariate analysis, MECOM expression and extent of resection were confirmed as independent prognostic factors (P=0.042 and 0.020, respectively) in GBM.
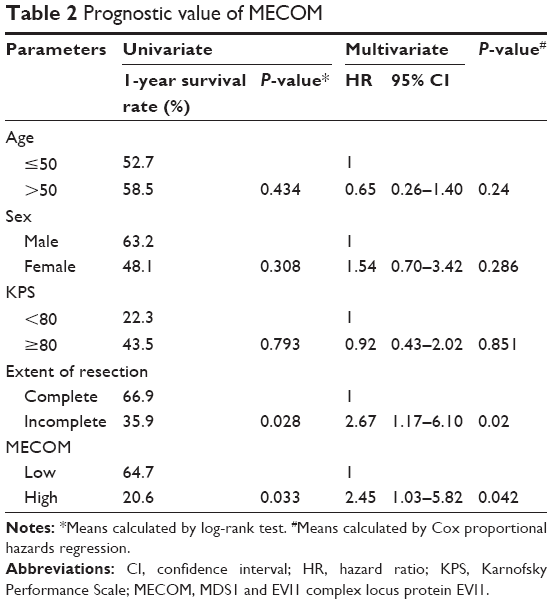 | Table 2 Prognostic value of MECOM |
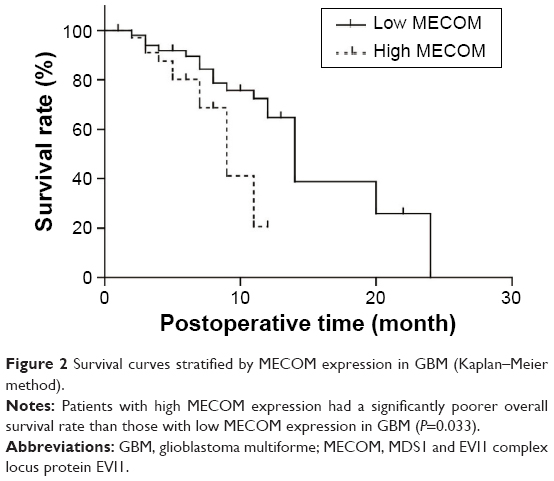 | Figure 2 Survival curves stratified by MECOM expression in GBM (Kaplan–Meier method). |
Discussion
GBM is one of the most deadly diseases of intracranial tumors, featured with a highly angiogenic and invasive phenotype, which implies the promising role of therapy targeting at angiogenic and invasive signaling pathways. Although standard treatments including resection, radiation, and chemotherapy got prominent progress such as the application of temozolomide in chemotherapy, the prognosis of GBM remains poor. Nowadays, the novel therapies, especially the molecular-targeted agents, are increasing remarkably thanks to the exploration of new biomarkers and the broader understanding of molecular pathogenesis of GBM. One effective biomarker may suggest one signaling pathway in tumor progression and could predict one promising drug target, which could help improve the survival time of patients.
Meanwhile, very little research has been done in an attempt to target MECOM in cancer treatment, although MECOM has been proven to play an oncogenic role in several cancers, especially myelogenous leukemia. A MECOM antagonist may aid in increasing lifespan or preventing relapse, but the specific MECOM antagonist has still not been found. More in-depth research on MECOM biological functions and inhibitors are urgently required. The significance of MECOM in GBM may get more attention with the gradual exploration of the oncogenic mechanism and inhibitors of MECOM.
Moreover, MECOM attracted the focus of scientists partially because it functions as a transcription factor, which may regulate downstream gene transcription. However, the downstream target gene of MECOM is not well elucidated. Very few genes have been identified as direct targets of MECOM thus far despite the increasing clinical significance of MECOM. The candidate targeting genes of MECOM include Gata1, Gata2, Mpl, Jag2, Pbx1, Setbp1, Itga2b and Itgb3 and such, but whether these are truly regulated by MECOM has yet to be demonstrated.15 Among the downstream genes and proteins regulated by MECOM, PTEN is an attractive target because it is widely expressed throughout the body and generally acknowledged as a tumor suppressor.16 In astrocytomas, previous studies have proven that MECOM could repress glioma progression and lead to better prognosis. The correlation between PTEN and MECOM was explored in the hematopoietic system. Yoshimi et al16 demonstrated that MECOM can suppress PTEN expression and activate PI3K/AKT/mTOR in leukemia. However, whether MECOM leads to poor prognosis via repressing PTEN in GBM should be explored by further study. In GBM, the exploration of MECOM-targeted gene is urgently needed since we found that MECOM is an independent prognostic factor of GBM. Unfortunately, no relevant exploration of MECOM transcription profile has been reported in GBM. So screening with high-throughput technique, such as microarray, may be a relevant approach to solve this problem. Additionally, there are still many basic experiments to analyse the underlying mechanisms of why MECOM is associated with poor prognosis of GBM, including experiments both in vivo and in vitro.
In our study, we, for the first time, demonstrated that MECOM is significantly associated with unfavorable survival rate (P=0.033) and could be considered an independent prognostic factor in GBM (P=0.042) in a large cohort with 86 cases enrolled in three medical centers. We hope our findings of the prognostic value of MECOM can trigger the enthusiasm of more scientists on basic and clinical research of MECOM, thus helping elucidate the underlying mechanism of MECOM-induced poorer prognosis, and in finding a new chemical therapy. Based on our experiments, we boldly believe that MECOM could be a promising and potential drug target, which can hasten a new chemical drug therapy for GBM, improving the survival time and life quality of GBM patients.
Disclosure
The authors report no conflicts of interest in this work.
References
Van Meir EG, Hadjipanayis CG, Norden AD, Shu HK, Wen PY, Olson JJ. Exciting new advances in neuro-oncology: the avenue to a cure for malignant glioma. CA Cancer J Clin. 2010;60:166–193. | ||
Omuro A, DeAngelis LM. Glioblastoma and other malignant gliomas: a clinical review. JAMA. 2013;310:1842–1850. | ||
Denysenko T, Gennero L, Roos MA, et al. Glioblastoma cancer stem cells: heterogeneity, microenvironment and related therapeutic strategies. Cell Biochem Funct. 2010;28:343–351. | ||
Weller M, van den Bent M, Hopkins K, et al. EANO guideline for the diagnosis and treatment of anaplastic gliomas and glioblastoma. Lancet Oncol. 2014;15:e395–e403. | ||
Comprehensive genomic characterization defines human glioblastoma genes and core pathways. Nature. 2008;455:1061–1068. | ||
Joseph JV, Balasubramaniyan V, Walenkamp A, Kruyt FA. TGF-β as a therapeutic target in high grade gliomas – promises and challenges. Biochem Pharmacol. 2013;85:478–485. | ||
Nicolaidis S. Biomarkers of glioblastoma multiforme. Metabolism. 2015;64:S22–S27. | ||
Morishita K, Parker DS, Mucenski ML, Jenkins NA, Copeland NG, Ihle JN. Retroviral activation of a novel gene encoding a zinc finger protein in IL-3-dependent myeloid leukemia cell lines. Cell. 1988;54:831–840. | ||
Kurokawa M, Mitani K, Yamagata T, et al. The evi-1 oncoprotein inhibits c-Jun N-terminal kinase and prevents stress-induced cell death. EMBO J. 2000;19:2958–2968. | ||
Lavallee VP, Gendron P, Lemieux S, D’Angelo G, Hebert J, Sauvageau G. EVI1-rearranged acute myeloid leukemias are characterized by distinct molecular alterations. Blood. 2015;125:140–143. | ||
Wang TY, Huang YP, Ma P. Correlations of common polymorphism of EVI-1 gene targeted by miRNA-206/133b with the pathogenesis of breast cancer. Tumour Biol. 2014;35:9255–9262. | ||
Dutta P, Bui T, Bauckman KA, Keyomarsi K, Mills GB, Nanjundan M. EVI1 splice variants modulate functional responses in ovarian cancer cells. Mol Oncol. 2013;7:647–668. | ||
Yatsula B, Lin S, Read AJ, et al. Identification of binding sites of EVI1 in mammalian cells. J Biol Chem. 2005;280:30712–30722. | ||
Yuasa H, Oike Y, Iwama A, et al. Oncogenic transcription factor Evi1 regulates hematopoietic stem cell proliferation through GATA-2 expression. EMBO J. 2005;24:1976–1987. | ||
Shimabe M, Goyama S, Watanabe-Okochi N, et al. Pbx1 is a downstream target of Evi-1 in hematopoietic stem/progenitors and leukemic cells. Oncogene. 2009;28:4364–4374. | ||
Yoshimi A, Goyama S, Watanabe-Okochi N, et al. Evi1 represses PTEN expression and activates PI3K/Akt/mTOR via interactions with polycomb proteins. Blood. 2011;117:3617–3628. |
 © 2016 The Author(s). This work is published and licensed by Dove Medical Press Limited. The full terms of this license are available at https://www.dovepress.com/terms.php and incorporate the Creative Commons Attribution - Non Commercial (unported, v3.0) License.
By accessing the work you hereby accept the Terms. Non-commercial uses of the work are permitted without any further permission from Dove Medical Press Limited, provided the work is properly attributed. For permission for commercial use of this work, please see paragraphs 4.2 and 5 of our Terms.
© 2016 The Author(s). This work is published and licensed by Dove Medical Press Limited. The full terms of this license are available at https://www.dovepress.com/terms.php and incorporate the Creative Commons Attribution - Non Commercial (unported, v3.0) License.
By accessing the work you hereby accept the Terms. Non-commercial uses of the work are permitted without any further permission from Dove Medical Press Limited, provided the work is properly attributed. For permission for commercial use of this work, please see paragraphs 4.2 and 5 of our Terms.