")
Back to Journals » Vascular Health and Risk Management » Volume 16
Expression of Hypoxia-Inducible Factor-1α (HIF1A) and Lp-PLA2 in Low, Intermediate, and High Cardiovascular Disease Risk Population
Authors Heriansyah T , Chomsy IN , Kumboyono K , Pratiwi PA, Wihastuti TA
Received 22 September 2020
Accepted for publication 19 November 2020
Published 1 December 2020 Volume 2020:16 Pages 507—513
DOI https://doi.org/10.2147/VHRM.S283367
Checked for plagiarism Yes
Review by Single anonymous peer review
Peer reviewer comments 2
Editor who approved publication: Dr Konstantinos Tziomalos
Teuku Heriansyah,1 Indah Nur Chomsy,2 Kumboyono Kumboyono,3 Pinandita Annisa Pratiwi,4 Titin Andri Wihastuti5
1Department of Cardiology and Vascular Medicine, Syiah Kuala University, Banda Aceh 23111, Indonesia; 2Master Program in Biomedical Science, Faculty of Medicine, Brawijaya University, Malang 65145, Indonesia; 3Nursing Department, Faculty of Medicine, University of Brawijaya, Malang 65145, Indonesia; 4Medical Study Program, Faculty of Medicine, Brawijaya University, Malang 65145, Indonesia; 5Department of Biomedicine, Faculty of Medicine, Brawijaya University, Malang 65145, Indonesia
Correspondence: Teuku Heriansyah
Department of Cardiology and Vascular Medicine, Syiah Kuala University, Banda Aceh 23111, Indonesia
Email [email protected]
Background: The pathomechanism of CVD is a complex and multifactorial process. The primary mechanism of CVD is atherosclerosis. Inflammation in atherogenesis raises the risk of hypoxia, which will activate hypoxia-inducible factor-1α (HIF1A). Also, together with lipoprotein-associated phospholipase A2 (Lp-PLA2), an inflammatory mediator for atherogenesis.
Purpose: This study aims to measure the hypoxia-inducible factor-1α (HIF1A) expression and its correlation to Lp-PLA2 expression at low-risk, intermediate, and high-risk CVD populations.
Patients and Methods: The study used a correlational analysis method with a total sampling technique in 160 individuals in the risk population. The atherosclerosis risk group was analyzed using the Framingham Risk Score and categorized into low, intermediate, and high-risk groups. Venous blood samples taken from respondents were measured using the ELISA method with Lp-PLA2 and HIF-1α as parameters. Data were analyzed using normality test, homogeneity test, one-way ANOVA, post hoc–Tukey HSD, and Pearson correlation.
Results: The concentration of HIF1A had a very strong correlation with Lp-PLA2 expression, both in the low-risk group (r = 0.512), intermediate (r = 0.512), and high (r = 0.715) (P < 0.05). However, the concentrations of Lp-PLA2 did not match the FRS.
Conclusion: HIF1A expression increased with increasing risk, while Lp-PLA2 expression decreased with increasing risk of atherosclerosis based on the FRS category. There is a significant correlation between HIF1A expression and Lp-PLA2 expression based on FRS.
Keywords: cardiovascular disease, atherosclerosis, HIF1A, Lp-PLA2, Framingham Risk Score
Introduction
Cardiovascular Disease (CVD) is one of the main causes of mortality in the world in the last 15 years, and the incidence rate is predicted to continuously increase.1,2 More than 36 million people die every day in Indonesia, mainly due to CVD. CVD is a disease caused by several major risk factors, including dyslipidemia (high levels of LDL and low HDL), hypertension, smoking, diabetes mellitus, obesity, lack of physical activity, age, and a family history of heart disease.3,4
The mechanism that underlies the occurrence of CVD is atherosclerosis. Atherosclerosis is a chronic inflammatory reaction of blood vessel walls, which respond to dyslipidemia and endothelial dysfunction involving leukocytes and endothelial cells.5 During the inflammatory process, there is also an active cell metabolism, which causes an increase in oxygen demand and a reduction in oxygen supply, which causes hypoxia.6,7 This hypoxic effect occurs because it is mediated by macrophages that can change anaerobic and aerobic metabolism, leads to an increase in oxygen demand.8 In the human body, there is an integrated role, which is a response to low oxygen concentrations through activation of hypoxia-inducible factor-1α (HIF1A).9,10 The progression of atherosclerotic lesions leads to angiogenesis vasa vasorum, which causes atherosclerotic plaques to become expanded, brittle, and unstable.11 This study aims to measure the hypoxia-inducible factor-1α (HIF1A) expression and its correlation to Lp-PLA2 expression at low-risk, intermediate, and high-risk CVD populations. Besides, there is a role for phospholipids, namely lipoprotein-associated phospholipase A2 (Lp-PLA2). Lp-PLA2 hydrolyzes the short-chain–oxidized LDL (oxLDL), which then produces Lysophopshatidylclcholine (LysoPC) as well as nonesterified fatty acid (OxNEFA) oxidation. OxNEFA has potent chemotactic activity, while LysoPC acts to upregulate inflammatory mediators, such as cytokines, adhesion molecules, and MCP-1 chemotactic mediators.12 These inflammatory mediators are expressed on the necrotic core of atherosclerotic plaque and areas rich in macrophages. Lp-PLA2 can also be a biomarker for the development of atherogenesis.13
FRS is an instrument used to categorize the risk of CVD in the future. FRS is classified into low, intermediate, and high risk. Until now, there are very few studies that analyze the expression of HIF-1a and its correlation of Lp-PLA2 in the early stages of atherosclerosis pathomechanism. The clarity of the disease’s pathomechanism is essential for clinicians to determine the right target therapy.
Patients and Methods
Research Subjects
This study used a descriptive correlational analytic method using venous blood samples taken from a population with a risk of atherosclerosis. The population in the study involved 160 people who were present at heart health checks. The inclusion criteria for atherosclerosis risk samples are age >30 years, obesity, smoking, total cholesterol >200 mg/dL, HDL cholesterol <40 mg/dL, and systolic blood pressure ≥140 mmHg, and a history of families with cardiovascular disease. Furthermore, the samples were grouped based on the Framingham Risk Score (FRS) into three categories: low, intermediate, and high risk.
Measurement Expression of HIF1A and Lp-PLA2
A complete blood count was carried out at the Central Laboratory of the Saiful Anwar Malang Hospital. Analysis of blood samples to determine the concentration of HIF1A and Lp-PLA2 using ELISA at the Biosciences Laboratory of Brawijaya University follows the manufacturer’s protocol. The blood plasma dissolved in a coating buffer (1:50), then added to the well by 50 µL on each well. Incubation was carried out overnight at 4° C in dark conditions. After a night, incubated wells and antigen washed with 0.05% PBS–Tween 20, each well 50 µL, three times with each incubation for 3 minutes. The subsequent incubation with PBS-BSA 2% as buffer coating 50 µL for each well for 2 hours at room temperature. Buffer coating was then discarded and washed using PBS–Tween 20 0.05% three times with each incubation for 3 minutes. Incubation of the diluted primary antibody in PBS-BSA 1% (1: 200–1: 500) is 2 hours at room temperature. Primary antibodies washed PBS–Tween 20 0.05%, each well 50 µL, three times each for 3 minutes. Incubation of the diluted secondary antibodies in PBS-BSA 1% (1: 1000–1: 2500) 50 µL each well, then washed. Incubation of the diluted strepavidin–horseradish peroxidase (SA-HRP) (1: 1000) carried out for 40–60 minutes at room temperature, then rinsed. Incubation of BCIP/NBT carried on 30 minutes at room temperature. A stop reaction buffers 3M HCl solution added for each well, then immediately measured at 450 nm using a micropipette reader.
Ethical Clearance
This experimental design has approved by the Ethics Committee of the Faculty of Medicine, Brawijaya University, Malang, Indonesia, by registered number: 149/EC/KEPK/08/2020. All of the patients provided informed consent to participate in this study, and that it was conducted in accordance with the Declaration of Helsinki.
Statistical Analysis
Data analysis used the IBM SPSS v.17 application with a confidence level of 95% (P < 0.05). Normality test with Kolmogorov–Smirnov, followed by one-way ANOVA to determine the mean difference among categories of risk CVD. Correlations between variables were analyzed using Pearson’s correlation test.
Results
Baseline Characteristics of Respondents
The respondents’ characteristics in this study shown in Table 1. The percentage of women is more significant than men in the low-risk group. Meanwhile, for the intermediate and high-risk groups, the percentage of men was greater than that of women. Male has a higher risk of developing cardiovascular disease in the next 10 years than women. There is also an increase in the prevalence and progression of atherosclerotic lesions by age. Similarly, the recapitulation of the data in this study shows that the age range of 50–69 years in each risk group has the highest percentage.
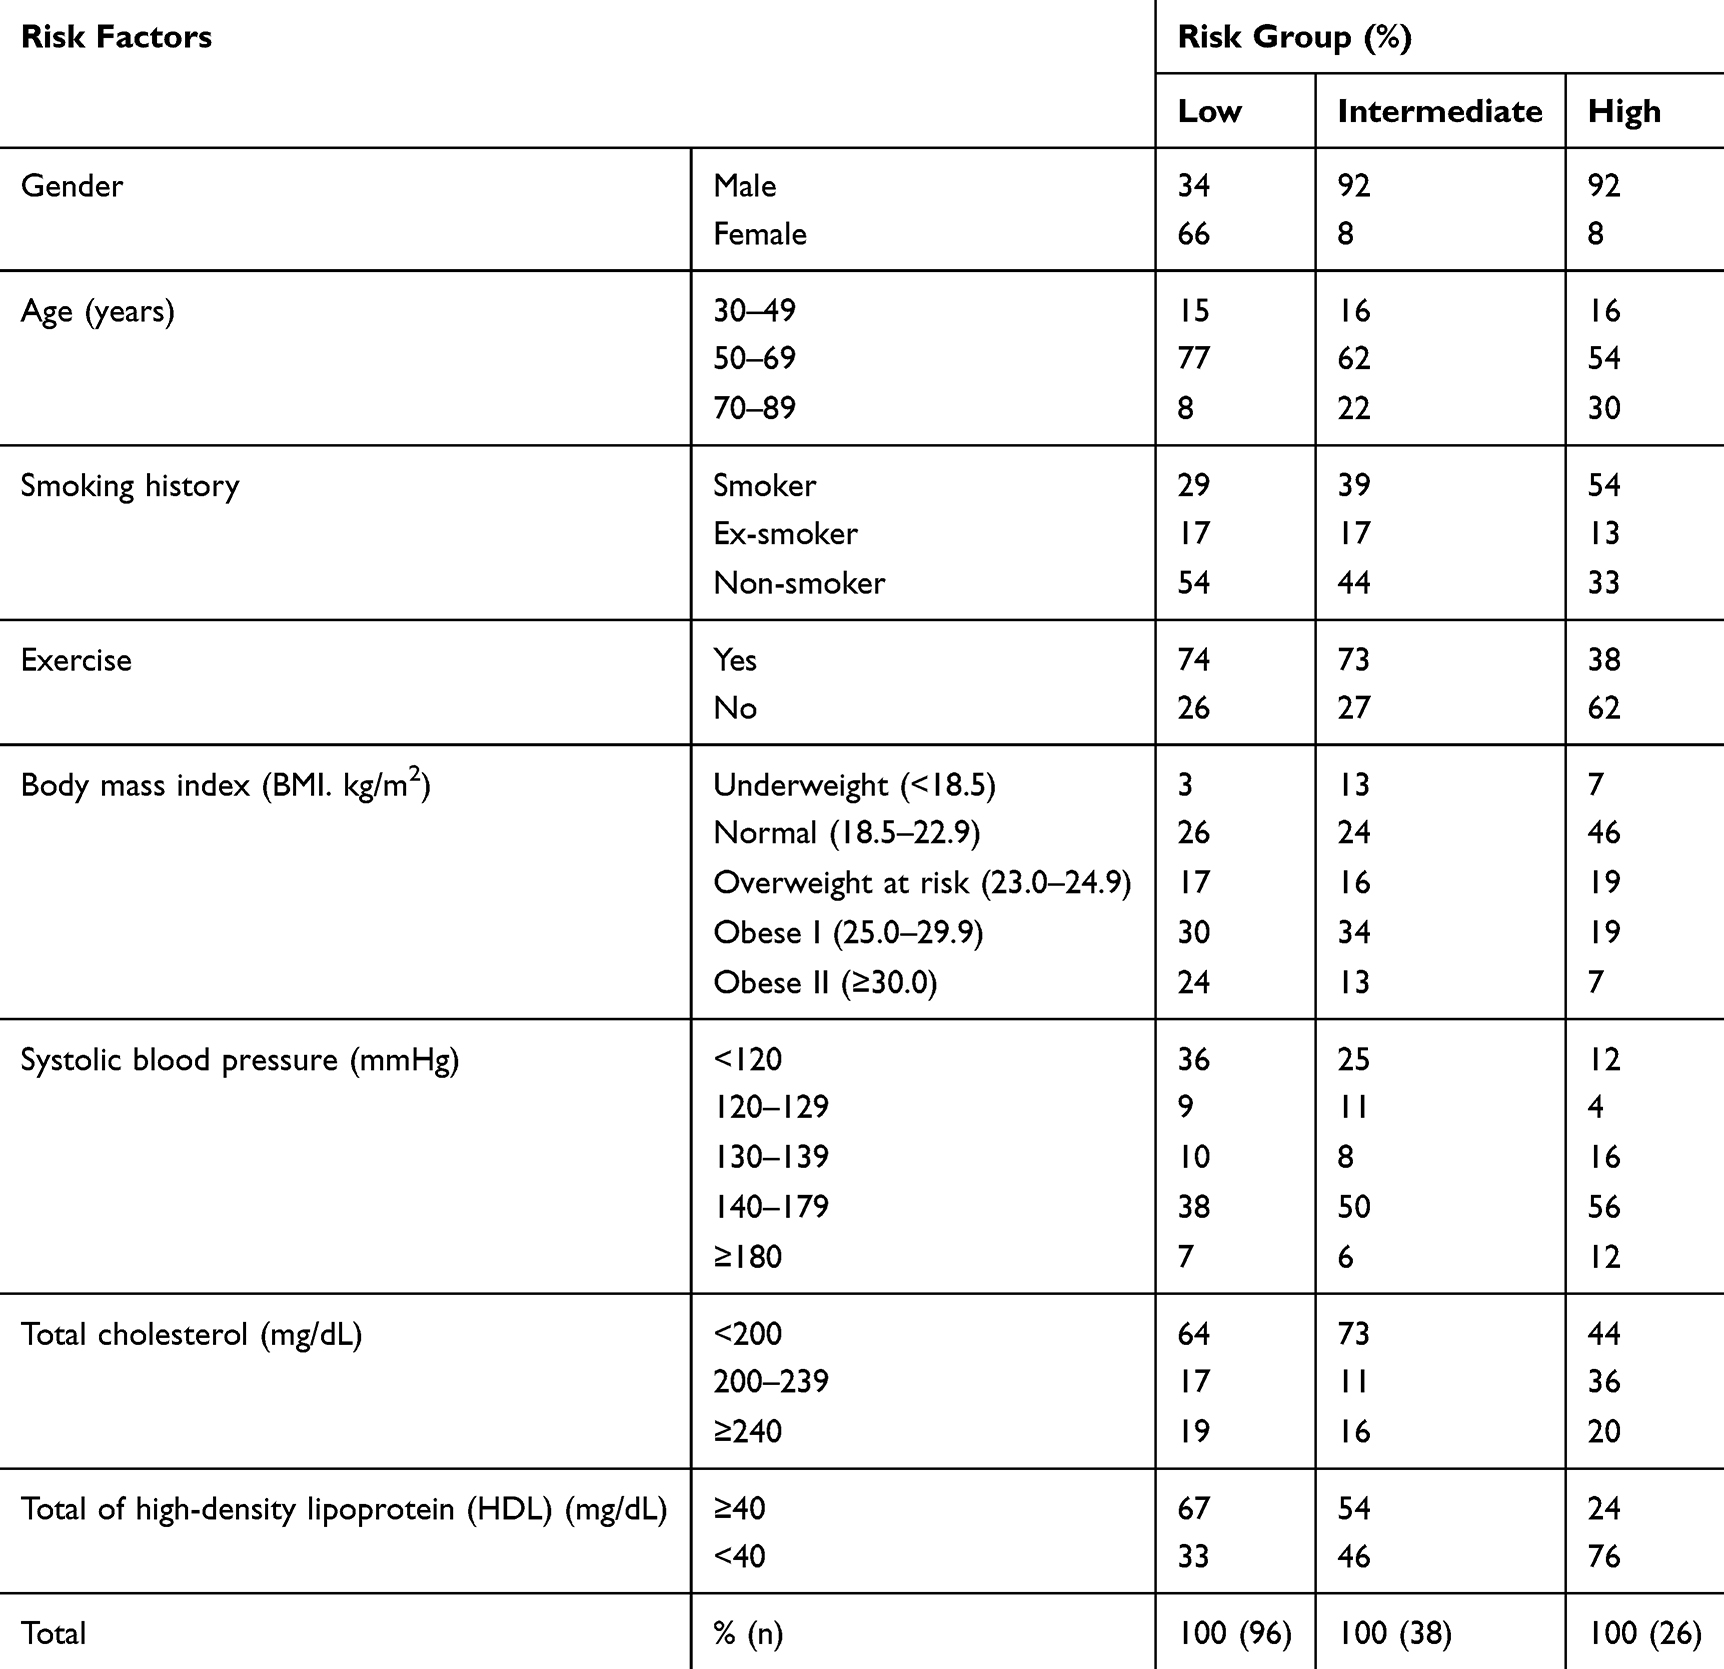 |
Table 1 Baseline Characteristics of Respondents |
In the low-risk and intermediate-risk groups, the percentage of respondents who did not smoke was more significant than those who smoked and quit smoking. Whereas in the high-risk group, the presentation of smoking was more significant than those who did not smoke and quit smoking. In the low-risk and intermediate-risk groups, the percentage of respondents who exercise regularly is greater than those who do not exercise regularly. Whereas in the high-risk group, a higher percentage of individuals did not exercise. Risk factors based on the body mass index, in the low-risk and intermediate-risk groups, the percentage of the Obese I group was the greatest. Whereas in the high-risk group, the highest group presentation was normal, and the lowest group presentation was obesity II. In the systolic pressure grouping, all risk groups had the highest pressure of 140–179 mmHg. For total cholesterol, the highest risk percentage was 200–239 mg/dL, while the other group had a high presentation at <200 mg/dL. In total HDL, the low-risk and intermediate-risk groups had a high presentation at more than equal to 40 mg/dL, while the high-risk groups were <40 mg/dL.
Levels of HIF1A and Lp-PLA2 Based on FRS Stratification
Based on the study results, it shows that the highest average expression of HIF1A is in the high-risk group with a value of 0.287 ng/dL, while for the average expression, the lowest is in the intermediate-risk group with a value of 0.2774 ng/dL. Meanwhile, the highest average expression of Lp-PLA2 was in the low-risk group with a value of 0.1008 ng/dL, while the lowest average expression was in the high-risk group with a value of 0.095 ng/dL (Table 2).
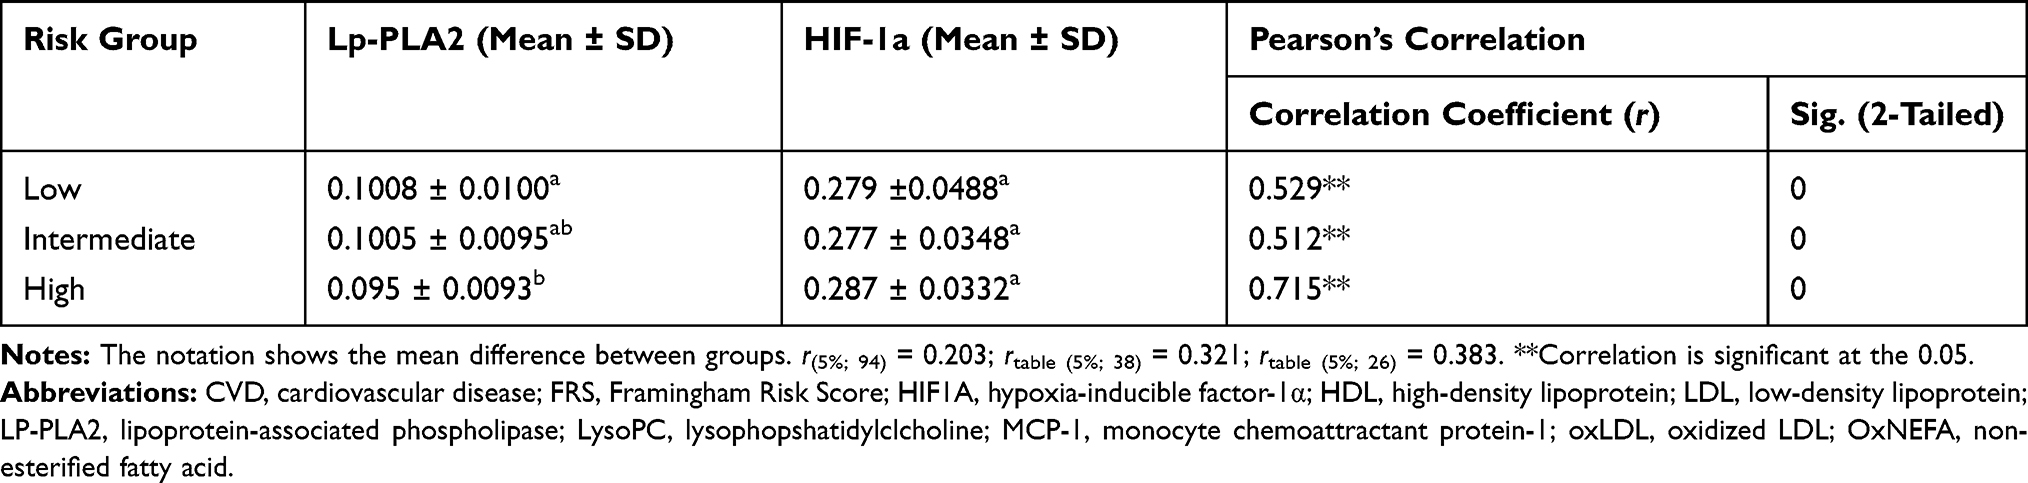 |
Table 2 Levels of HIF1A Dan Lp-PLA2 Based on FRS |
From the results of the analysis test using the One-Way ANOVA test on Lp-PLA2, it was obtained a significance value of 0.019 (p <0.05) means that there are significant differences between risk groups. While the One-Way ANOVA test on HIF1A got that there is no significant difference between risk groups, with a significance value of 0.651 (p> 0.05).
Correlation of HIF1A and Lp-PLA2 Based on FRS Category
Analysis of the relationship between the HIF1A concentration and the Lp-PLA2 expression in the low group, the positive correlation coefficient indicates that the relationship between the HIF1A concentration and the Lp-PLA2 concentration is directly proportional. The Lp-PLA2 expression, the HIF1A concentration will increase, vice versa (Table 2). In the intermediate group, the correlation coefficient is positive. The correlation coefficient category is r = 0.512. In the high-risk group, the correlation coefficient is also positive. The correlation coefficient category is known to be r = 0.715, which shows a strong correlation.
Discussion
Hypoxia-inducible factor-1α (HIF1A) is a transcription factor (protein complex) that acts as a response to low oxygen levels (hypoxia). HIF1A plays a role in the homeostasis process, which causes increased vascularity in hypoxic areas.8,14,15 This protein is related to the progression of atherosclerotic plaque, along with the growth of mature plaques, which will lead to protrusion into the blood vessels, which will reduce blood circulation and can cause cells not to get the oxygen or nutrients needed. When this happens, the cells will fall into a hypoxic state.16 Based on the results of data analysis, the intermediate-risk group has the lowest average, followed by low and high groups. From the results of statistical analysis, the One-Way ANOVA difference test, it was found that there was no significant difference in HIF1A expression for each group.
The low-risk group had a mean of 0.2795 ng/mL. This low expression is influenced by the age factor, most of which is 50–69 years. According to the results of research by Rohrbach et al found that in conditions where oxygen levels are sufficient, HIF1A destruction is initiated by prolyl-4-hydroxylation.17 Study revealed that HIF1A activity increases by adipogenesis, insulin, and hypoxia in obese individuals.18,19
HIF-1a is a regulator of vasa-vasorum angiogenesis, and in this study, it was measured using ELISA. Meanwhile, HIF-1a is mostly expressed in the network. Considering that this research is clinical research, a feasible and efficient measurement method with minimum possible harm to respondents. In this study, we found that the HIF1A expression in the intermediate-risk group had an average of 0.2774 ng/mL. This value is the lowest expression of HIF1A compared to other risk groups. According to the results of a study by Rohrbach et al, there was a decrease in age-dependent HIF1A due to decreased hypoxic adaptability in ageing animal and human models.17 Besides, the low expression in this group might be influenced by male gender characteristics. According to research by Casey et al, compensation in vasodilation response to women is better than men.20 Based on research, patients with endurance training will increase the HIF pathway activity in human skeletal muscles in a hypoxic state due to an increase in oxygen transport and metabolism.19 HIF1A expression in the high-risk group has an average of 0.287 ng/mL, which is the highest average compared to other groups. With the lowest expression of 0.259 ng/mL, this is influenced by the age range 50–69 years, which also occurs in the low and intermediate groups.
People with risk of atherosclerosis that being grouped by FRS stratification showing a significant level of Lp-PLA2. The results showed that the highest average expression of Lp-PLA2 was in the low-risk group, followed by intermediate risk, and the lowest in the high-risk group. Based on Post Hoc test-Tukey HSD, there is a significant result on low- and intermediate-risk group. Low expression is influenced by one characteristic data and a history of not smoking (54%).
In the low-risk group, it is a risk group with 77% of the respondents aged 50–69 years, 54% of the respondents also do not smoke, and have regular exercise habits. Meanwhile, in the high-risk group, most of the respondents were men who did not exercise and smoke. Based on research conducted by Gong et al, 2011, it is known that Lp-PLA expression has a positive correlation with risk factors for metabolic syndrome. In addition, in the high-risk group, it was found that most respondents had cholesterol levels <200 mg/dL. Meanwhile, research by Keleşoğlu et al showed that a significant increase in Lp-PLA2 activity was followed by the rise in total cholesterol, apo-B, sdLDL, body weight, BMI, body fat percentage, and a decrease in paraoxonase-1.21,22 Lp-PLA2 is a predictor of coronary disease that along with CRP, fibrinogen levels, white blood cell count, age, systolic blood pressure, plasma triglycerides, HDL and LDL cholesterol.23 Subjects with LDL levels below the median (130 mg/dl) have significantly in Lp-PLA2 and CRP expression. This correlation is associated with the incidence of coronary heart disease.24 Increased expression of Lp-PLA2, especially those that bind to LDL, is a marker of cardiovascular risk alone (independent) and in addition to traditional risk factors.12,25,26
Lp-PLA2, which has the highest expression in the low and intermediate-risk groups, indicates that it may be a very early marker, making sense increases in the low factor because its primary role is to initiate inflammation.27
This study shows that Lp-PLA2 plays a vital role in the acute phase, so it appears at the beginning with high expression to initiate inflammation. This inflammation’s product is hypoxia, which is indicated by the appearance of higher HIF-1a expression and increased risk. Based on the correlation between Lp-PLA2 and HIF1A, the three groups showed a strong and positive correlation. This indicates that the higher the risk of atherosclerosis, which is characterized by Lp-PLA2 biomarkers, the increase in HIF1A also occurs. Research by Lanman et al showed that the expression of Lp-PLA2 increased in samples with an atherosclerotic plaque in blood vessels that tended to rupture. HIF1A also plays a role in angiogenesis.28 So that the development of plaque increases the risk of plaque rupture of atherosclerotic plaque.29,30 Thus, the increase of the expression of Lp-PLA2 and HIF1A will be followed by the risk that is analyzed using FRS. However, the strong correlation between HIF-1a and Lp-PLA2 indicates that the inflammatory process is strongly associated with angiogenesis in the population exposed to risk factors.
Conclusion
Based on this study, HIF1A expression increased with increasing risk, while Lp-PLA2 expression decreased with increasing risk of atherosclerosis based on the FRS category. There is a significant and strong correlation between HIF1A expression and Lp-PLA2 expression in the risk group categorized using the FRS. The process of angiogenesis is closely related to inflammation in the population with risk factors for atherosclerosis. Explaining this pathomechanism is very important for clinicians to determine the appropriate therapeutic targets to prevent further pathogenesis of atherosclerosis.
Acknowledgments
This study was supported by Medical Faculty of Brawijaya University, Indonesia. The authors are grateful to the Syiah Kuala University for its participation and the Ministry of Research, Technology and Higher Education of the Republic of Indonesia for funding this experiment. We gratefully acknowledge all participants of this study.
Disclosure
The authors report no conflicts of interest in this work.
References
1. World Health Organization. The Top 10 Causes of Death, 2014. Vols. 1–9; 2015.
2. Ohira T, Iso H. Cardiovascular disease epidemiology in Asia: an overview. Circ J. 2013;77(7):1646–1652. doi:10.1253/circj.cj-13-0702.
3. Wihastuti TA, Sargowo D, Agoes. A, Satuman S, Heriansyah T. Level of circulating endothelial cells and expression of nuclear factor kappa beta of human’s peripheral blood mononuclear cells in subjects with certain conditions. Acta Med Indones. 2014;46:1.
4. National Heart Lung and Blood Institute (NHLBI). Atherosclerosis. 2015; 7. doi:10.1042/EBC20150004.
5. Riccioni G, Sblendorio V. Atherosclerosis: from biology to pharmacological treatment. J Geriatr Cardiol. 2012;9(3):305–317. doi:10.3724/SP.J.1263.2012.02132
6. Murdoch C, Muthana M, Lewis CE. Hypoxia regulates macrophage functions in inflammation. J Immunol. 2005;175(10):6257–6263. doi:10.4049/jimmunol.175.10.6257.
7. Sadiku P, Walmsley SR. Hypoxia and the regulation of myeloid cell metabolic imprinting: consequences for the inflammatory response. EMBO Rep. 2019;20(5):e47388. doi:10.15252/embr.201847388
8. Mayr M, Sidibe A, Zampetaki A. The paradox of hypoxic and oxidative stress in atherosclerosis. J Am Coll Cardiol. 2008;51(13):1266–1267. doi:10.1016/j.jacc.2008.01.005
9. Cramer T, Yamanishi Y, Clausen BE, et al. HIF-1alpha is essential for myeloid cell-mediated inflammation [published correction appears in Cell. 2003 May 2;113(3):419]. Cell. 2003;112(5):645–657. doi:10.1016/s0092-8674(03)00154-5
10. Gultice AD, Kulkarni-Datar K, Brown TL. Hypoxia-inducible factor 1alpha (HIF1A) mediates distinct steps of rat trophoblast differentiation in gradient oxygen. Biol Reprod. 2009;80(1):184–193. doi:10.1095/biolreprod.107.067488
11. Virmani R, Kolodgie FD, Burke AP, et al. Atherosclerotic plaque progression and vulnerability to rupture: angiogenesis as a source of intraplaque hemorrhage. Arterioscler Thromb Vasc Biol. 2005;25(10):2054–2061. doi:10.1161/01.ATV.0000178991.71605.18.
12. Carlquist JF, Muhlestein JB, Anderson JL. Lipoprotein-associated phospholipase A 2: a new biomarker for cardiovascular risk assessment and potential therapeutic target. Expert Rev Mol Diagn. 2007;7(5):511–517. doi:10.1586/14737159.7.5.511
13. McIntyre TM, Prescott SM, Stafforini DM. The emerging roles of PAF acetylhydrolase. J Lipid Res. 2009;50(Supplement):S255–S259. doi:10.1194/jlr.R800024-JLR200
14. Wihastuti TA, Tjokoprawiro A, Soeharto S, Widodo MA, Sargowo D, Permatasari N. Vasa vasorum anti-angiogenesis through H2O2, HIF-1α, NF-κB, and iNOS inhibition by mangosteen pericarp ethanolic extract (Garcinia mangostana Linn) in hypercholesterol-diet-given Rattus norvegicus Wistar strain. Vasc Health Risk Manag. 2014;10:523–531. doi:10.2147/VHRM.S61736
15. Ziello JE, Jovin IS, Hypoxia-Inducible Factor HY. HIF-1 regulatory pathway and its potential for therapeutic intervention in malignancy and ischemia. Yale J Biol Med. 2007;80(2):51–60.
16. Krock BL, Skuli N, Simon MC. Hypoxia-induced angiogenesis: good and evil. Genes Cancer. 2011;2(12):1117–1133. doi:10.1177/1947601911423654
17. Rohrbach S, Simm A, Pregla R, Franke C, Katschinski DM. Age-dependent increase of prolyl-4-hydroxylase domain (PHD) 3 expression in human and mouse heart. Biogerontology. 2005;6(3):165–171. doi:10.1007/s10522-005-7950-9
18. He Q, Gao Z, Yin J, Zhang J, Yun Z, Ye J. Regulation of HIF-1α activity in adipose tissue by obesity-associated factors: adipogenesis, insulin, and hypoxia. Am J Physiol Endocrinol Metab. 2011;300(5):E877–E885. doi:10.1152/ajpendo.00626.2010
19. Nagahisa H, Mukai K, Ohmura H, Takahashi T, Miyata H. Effect of High-Intensity Training in Normobaric Hypoxia on Thoroughbred Skeletal Muscle. Oxid Med Cell Longev. 2016;2016:1535367. doi:10.1155/2016/1535367
20. Casey DP, Shepherd JRA, Joyner MJ. Sex and vasodilator responses to hypoxia at rest and during exercise. J Appl Physiol. 2014;116(7):927–936. doi:10.1152/japplphysiol.00409.2013
21. Tibuakuu M, Kianoush S, DeFilippis AP, et al. Usefulness of lipoprotein-associated phospholipase A 2 activity and C-reactive protein in identifying high-risk smokers for atherosclerotic cardiovascular disease (from the Atherosclerosis Risk in Communities Study). Am J Cardiol. 2018;121(9):1056–1064. doi:10.1016/j.amjcard.2018.01.020
22. Keleşoğlu M, Kızılay F, Barutçuoğlu B, et al. The relationship between lipoprotein-associated phospholipase A2 with cardiovascular risk factors in testosterone deficiency. Turk J Urol. 2018;44(2):103–108. doi:10.5152/tud.2017.30633
23. Nelson TL, Biggs ML, Kizer JR, et al. Lipoprotein-associated phospholipase A 2 (Lp-PLA 2) and future risk of type 2 diabetes: results from the Cardiovascular Health Study. J Clin Endocrinol Metab. 2012;97(5):1695–1701. doi:10.1210/jc.2011-3026
24. Brilakis ES, Mcconnell JP, Lennon RJ, Elesber AA, Meyer JG, Berger PB. Association of lipoprotein-associated phospholipase A2 levels with coronary artery disease risk factors, angiographic coronary artery disease, and major adverse events at follow-up. Clin Biochem. 2005;26(2):137–144.
25. Lavi S, McConnell JP, Rihal CS, et al. Local production of lipoprotein-associated phospholipase A 2 and lysophosphatidylcholine in the coronary circulation. Circulation. 2007;115(21):2715–2721. doi:10.1161/CIRCULATIONAHA.106.671420
26. Tellis CC, Tselepis AD. Τhe role of lipoprotein-associated phospholipase A2 in atherosclerosis may depend on its lipoprotein carrier in plasma. Biochim Biophys Acta. 2009;1791(5):327–338. doi:10.1016/j.bbalip.2009.02.015
27. Zhuo S, Wolfert RL, Yuan C. Biochemical differences in the mass and activity tests of lipoprotein-associated phospholipase A 2 explain the discordance in results between the two assay methods. Clin Biochem. 2017;50(18):1209–1215. doi:10.1016/j.clinbiochem.2017.08.019
28. Lanman RB, Wolfert RL, Fleming JK, et al. Lipoprotein-associated phospholipase A 2: review and recommendation of a clinical cut point for adults. Prev Cardiol. 2006;9(3):138–143. doi:10.1111/j.1520-037x.2006.05547.x
29. Sluimer JC, Daemen MJ. Novel concepts in atherogenesis: angiogenesis and hypoxia in atherosclerosis. J Pathol. 2009;218(1):7–29. doi:10.1002/path.2518.
30. Costopoulos C, Huang Y, Brown AJ, et al. Plaque rupture in coronary atherosclerosis is associated with increased plaque structural stress. JACC Cardiovasc Imaging. 2017;10(12):1472–1483. doi:10.1016/j.jcmg.2017.04.017
 © 2020 The Author(s). This work is published and licensed by Dove Medical Press Limited. The full terms of this license are available at https://www.dovepress.com/terms.php and incorporate the Creative Commons Attribution - Non Commercial (unported, v3.0) License.
By accessing the work you hereby accept the Terms. Non-commercial uses of the work are permitted without any further permission from Dove Medical Press Limited, provided the work is properly attributed. For permission for commercial use of this work, please see paragraphs 4.2 and 5 of our Terms.
© 2020 The Author(s). This work is published and licensed by Dove Medical Press Limited. The full terms of this license are available at https://www.dovepress.com/terms.php and incorporate the Creative Commons Attribution - Non Commercial (unported, v3.0) License.
By accessing the work you hereby accept the Terms. Non-commercial uses of the work are permitted without any further permission from Dove Medical Press Limited, provided the work is properly attributed. For permission for commercial use of this work, please see paragraphs 4.2 and 5 of our Terms.