")
Back to Journals » International Journal of General Medicine » Volume 12
Expression levels of complement regulatory proteins (CD35, CD55 and CD59) on peripheral blood cells of patients with chronic kidney disease
Authors Eldewi DM , Alhabibi AM , El Sayed HME , Mahmoud SAK , El Sadek SM , Gouda RM, Hassan MAEM , Ibrahim AH , Abd El Haliem NF
Received 25 May 2019
Accepted for publication 19 July 2019
Published 16 September 2019 Volume 2019:12 Pages 343—351
DOI https://doi.org/10.2147/IJGM.S216989
Checked for plagiarism Yes
Review by Single anonymous peer review
Peer reviewer comments 2
Editor who approved publication: Dr Scott Fraser
Dalia Mahmoud Eldewi,1 Alshaymaa M Alhabibi,1 Hanaa Mohammed Eid El Sayed,2 Sammar Ahmed Kasim Mahmoud,2 Sanaa Mohammed El Sadek,3 Rasha Mahmoud Gouda,3 Mohammed Abd El Malik Hassan,4 Amal H Ibrahim,2 Naglaa F Abd El Haliem5
1Clinical Pathology Department, Faculty of Medicine for Girls, Al-Azhar University, Cairo, Egypt; 2Internal Medicine Department, Faculty of Medicine for Girls, Al-Azhar University, Cairo, Egypt; 3Pediatric Department, Faculty of Medicine for Girls, Al-Azhar University, Cairo, Egypt; 4Pediatric Department, Faculty of Medicine for Boys, Al-Azhar University, Cairo, Egypt; 5Medical Microbiology and Immunology Department, Faculty of Medicine for Girls, Al-Azhar University, Cairo, Egypt
Correspondence: Alshaymaa M Alhabibi
Clinical Pathology Department, Faculty of Medicine for Girls, Al-Azhar University, Cairo 11765, Egypt
Tel +20 100 289 4075
Email [email protected]
Background: Altered regulation of the complement system is associated with multiple kidney diseases. CD35, CD55 and CD59 regulate the complement system, and changes in their expression have previously been linked with kidney disease. This study assessed whether changes in the expression levels of these proteins are associated specifically with chronic kidney disease (CKD) to understand its pathogenesis.
Materials and methods: Sixty CKD patients and 60 age-matched controls were enrolled and divided into two groups: Group I (n=30 pediatric patients and n=30 controls) and Group II (n=30 adult patients and n=30 controls). The expression of CD35, CD55 and CD59 on peripheral blood cells was evaluated by flow cytometry as the proportion of positive cells expressing the marker and mean fluorescence intensity (MFI), also the relation of these markers to the stage of CKD was also evaluated.
Results: Pediatric and adult CKD patients had significantly lower proportion of erythrocytes expressing CD35, CD55 and CD59 than healthy controls (P<0.001). In pediatric CKD patients, there was no significant difference in the three studied markers on neutrophils, lymphocytes and monocytes. The changes in expression of CD35, CD55 and CD59 on leukocytes were more pronounced in adult patients, who had lower proportion of CD59-positive neutrophils, CD35- and CD59-positive lymphocytes, and CD59-positive monocytes, as well as lower expression of CD59 on neutrophils and monocytes than adult controls (P<0.001, P=0.019, P<0.001, P=0.026, P<0.001 and P=0.003, respectively). The eGFR directly correlated with the proportion of positivity of some of those markers on peripheral leukocytes while there was inverse correlation between the disease stage and the same markers.
Conclusion: There are alterations in the patterns of expression of complement regulatory proteins CD35, CD55 and CD59 on peripheral blood cells of patients with CKD compared with healthy controls.
Keywords: complement regulatory proteins, CD35, CD55, CD59, chronic kidney disease
Introduction
The complement system is a component of the innate immunity that provides host defense against pathogens and is also important for the clearance of immune complexes and damaged cells, and for immunoregulation.1 However, excessive complement activation or insufficient regulation causes tissue injury in many autoimmune or inflammatory diseases.2
The kidney is subjected to significant stress from exogenous factors filtered from the bloodstream (eg, pathogens and toxins). Consequently, renal function is dependent on a finely calibrated immune response, including proper complement activation and regulation, to eliminate pathogens and toxins without producing excess of inflammatory cytokines.3
A critical determinant in complement- mediated kidney injury is the expression and function of complement regulatory proteins.3 The kidney is normally protected from complement-mediated damage by circulating and membrane-bound regulatory proteins, including: decay-accelerating factor (DAF or CD55), which inhibits complement activation by accelerating the dissociation of all convertases; complement receptor 1 (CR1 or CD35), which has both decay-accelerating and cofactor activity; and CD59, which prevents the formation of complement component C5b-9.4
Alterations in the expression of CD35, CD55 and CD59 has been observed in a range of disorders with a kidney damage component, highlighting their crucial role in this context.5–7
Different sites of defective complement regulation or deficiencies of particular components lead to various manifestations of complement-related chronic kidney disease (CKD) and influence its outcome. Previous work had identified a pathogenic role for the complement cascade in CKD, including autoantibody-mediated forms of glomerulonephritis, C3 glomerulopathy, atypical forms of hemolytic uremic syndrome, ischemic-reperfusion injury of transplanted kidneys, and antibody-mediated renal allograft rejection.8
CKD is an emerging global public health problem and its complications represent a considerable burden on global healthcare resources and only a few countries have sufficiently robust economies to meet the challenge posed by this disease.9
This study aimed to determine the expression of complement regulatory proteins (CD35, CD55 and CD59) in CKD patients excluding what had already been identified by other studies to assess if the pathogenesis of CKD is associated with immune dysregulation or not.
Subjects and methods
Study design and subjects
This was case control study. Sixty patients with CKD were selected from our university hospital between March 2018 and August 2018. The subjects were categorized into the following two groups: Group I (n=30), which consisted of pediatric CKD patients, and Group II (n=30), which consisted of adult CKD patients. Sixty samples were collected from age- and gender-matched apparently healthy individuals, who served as controls.
Inclusion criteria
CKD patients were anemic and were selected with the estimated glomerular filtration rate (eGFR) categories G3a–G5 (ie GFR <60 mL/min/1.73 m2), according to the 2012 Kidney Disease Improving Global Outcomes (KDIGO) guidelines for the evaluation and management of CKD. The different pathologies resulting in CKD in pediatric and adult patients are shown in Table 1.
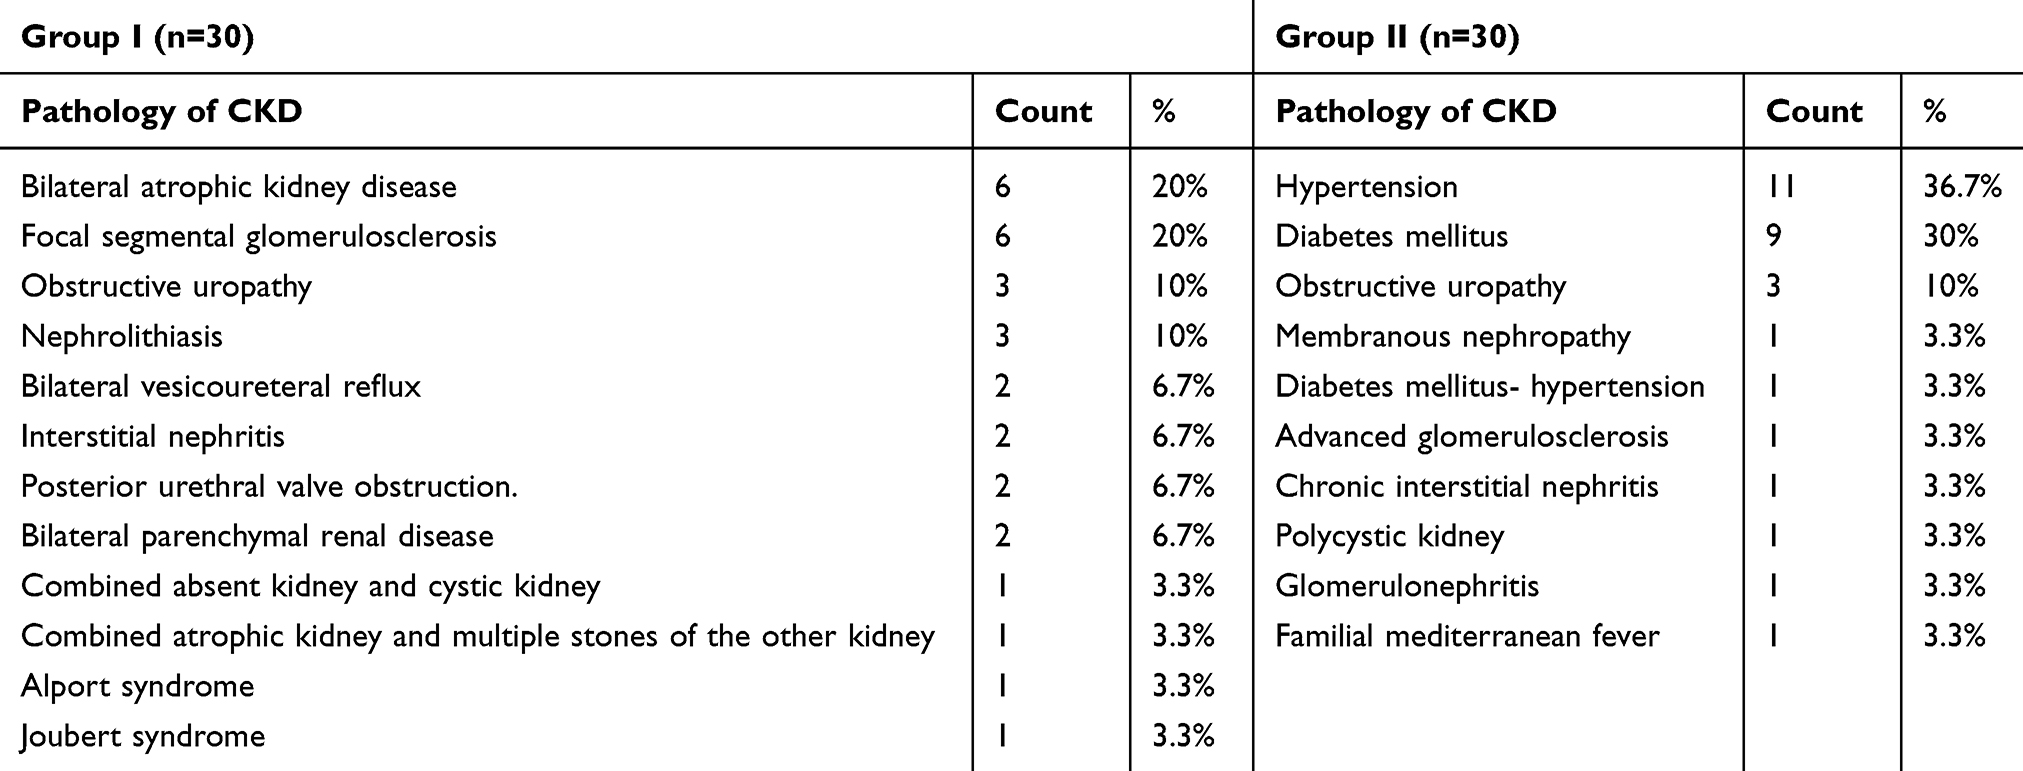 |
Table 1 Different pathologies resulting in chronic kidney disease (CKD) in pediatric and adult patients |
Exclusion criteria
None of the patients had received blood transfusions in the last 3 months before sample collection or had a history of autoimmune diseases [systemic lupus erythematosus (SLE), rheumatoid arthritis, autoantibody-mediated forms of glomerulonephritis, C3 glomerulopathy and hemolytic uremic syndrome].
Ethical consideration
The study was conducted according to the guidelines of the World Medical Association Helsinki declaration for studies on human subjects. It was approved by the Institutional Review Board (IRB) of our university hospital (Al-Zahraa Hospital), and written informed consent was obtained from the children’s guardians and the adult patients.
Procedures and variable assessments
All studied individuals were subjected to a comprehensive history-taking, and detailed clinical examination including anthropometric measurements with calibrated measuring equipment and the following laboratory investigations.
- A complete blood count (CBC) was performed with the automated hematology analyzer Sysmex KX 21N (Japan), and biochemical analyses were performed with the Cobas c311 system (Germany) of kidney function parameters and lactate dehydrogenase (LDH) levels, the Cobas e411 system (Germany) of ferritin and the Cobas Integra 400 plus of C-reactive protein (CRP).
- eGFR was calculated using the EPI formula.10
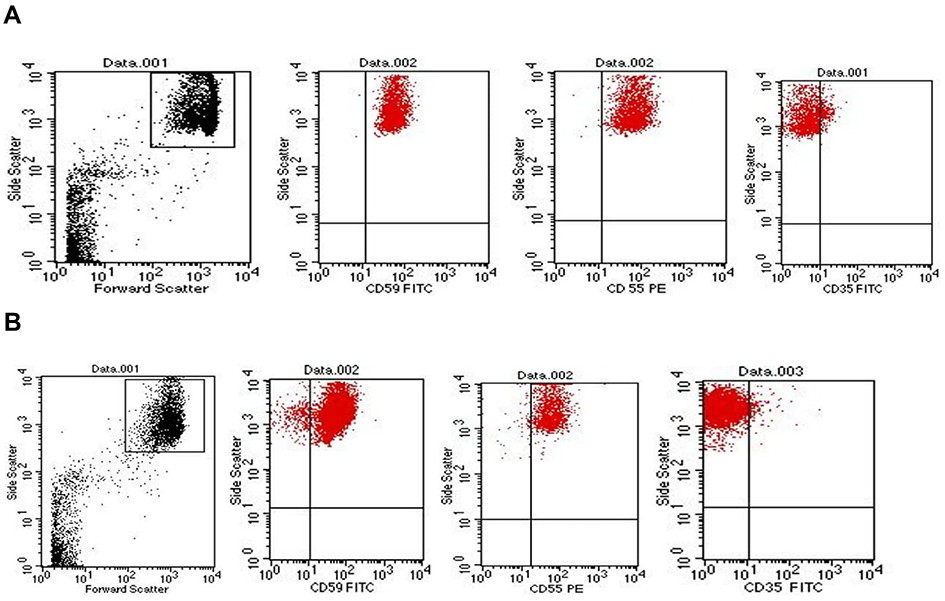
- Flow cytometric analyses were performed for CD35, CD55 and CD59 on erythrocytes as follows:EDTA-treated blood samples were processed within 1 hr of collection. Samples were diluted with phosphate buffered saline (PBS) to reach a concentration of 10,000 red blood cells (RBCs)/µL. Then 50 µL from each dilution was mixed with the following monoclonal antibodies: phycoerythrin (PE)-conjugated anti-human CD55 (Lot NO. 40), fluorescence iso-thiocyanate (FITC)-conjugated anti-human CD59 (Lot NO. 40) and FITC – conjugated anti-human CD35 (Lot NO.30). All monoclonal antibodies were obtained from Immunotech, Beckman Coulter, Marseille, France. These samples were incubated at room temperature in the dark for 30 mins and then washed twice with PBS. The pellets were suspended in sheath fluid. The optimal concentration for each antibody was determined by titration experiments.11Gating of RBCs: With the use of logarithmic amplification, RBCs were identified using the forward scatter (FSC)/side scatter (SSC) characteristics as shown in Figure 1.
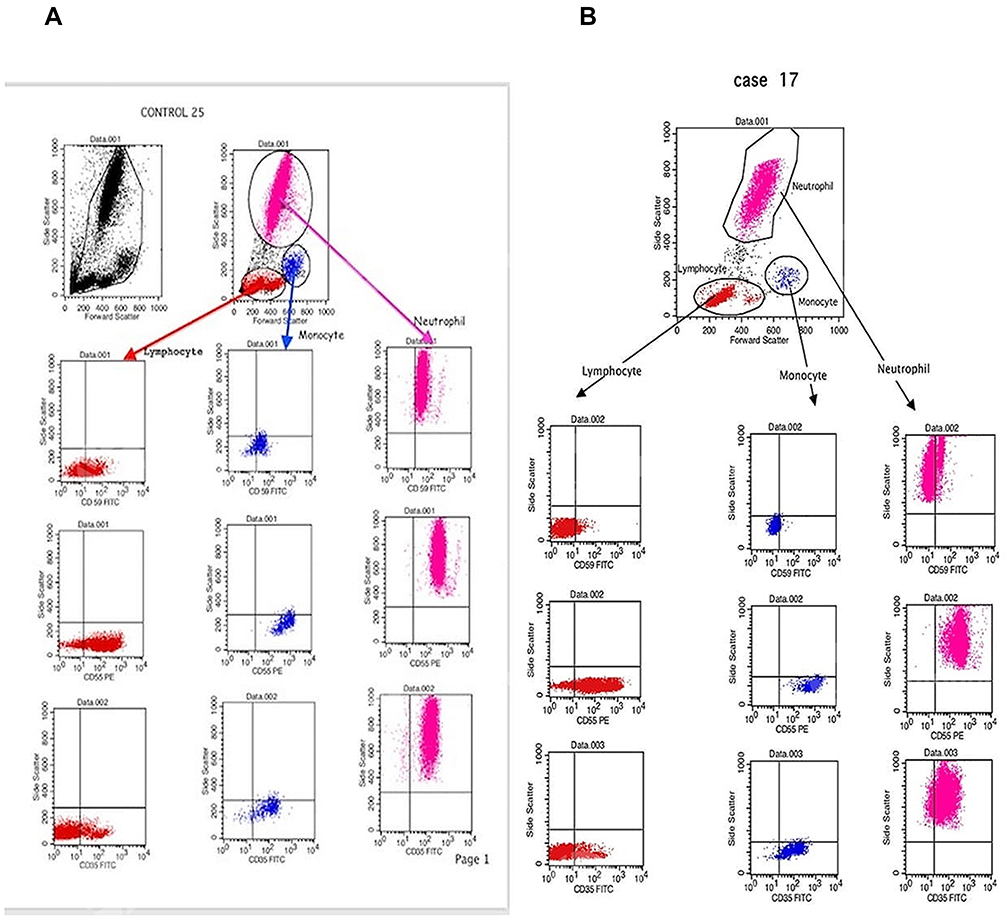
- Flow cytometric analyses of CD35, CD55 and CD59 on leukocytes:EDTA-treated blood was mixed with the following monoclonal antibodies; FITC-conjugated CD35, PE-conjugated CD55 and FITC-conjugated CD59; the samples were incubated for 20 mins in the dark at room temperature. Then, the samples were washed with PBS, incubated with lysing solution for 8 mins in the dark, centrifuged, washed again and suspended in sheath fluid.Gating of white blood cells (WBCs):With the use of linear amplification, different types of WBCs were identified using the FSC/SSC characteristics, as shown in Figure 2.
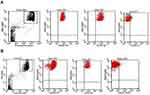
Figure 1 Representative dot plot showing red blood cells (RBCs) distribution and gating by forward scatter/side scatter characteristics. (A) Dot plots showing the expression of CD59, CD55 and CD35 on the gated RBCs of healthy controls. (B) Dot plots showing the expression of CD59, CD55 and CD35 on the gated RBCs of chronic kidney disease patients.
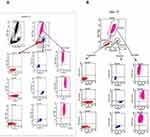
Figure 2 Representative dot plot showing white blood cells (WBCs) distribution and gating by forward scatter/side scatter characteristics. (A) Dot plots showing the expression of CD59, CD55 and CD35 on the gated lymphocytes, monocytes and neutrophils of healthy controls. (B) Dot plots showing the expression of CD59, CD55 and CD35 on the gated lymphocytes, monocytes and neutrophils of chronic kidney disease patients.
Flow cytometry was conducted in our university hospital using four-colors FACS Calibur (BD Biosciences, San Jose, USA). Cell Quest Pro software was used for the data analysis. Compensation settings were established before acquiring the samples using color calibrite beads (BD, Biosciences, San Jose, USA, and lot no. 5093879). After adjusting the sample count for acquisition (50,000 events for RBCs and WBCs), unstained samples were acquired to detect the sample autofluorescence. A isotype control, mouse IgG1 FITC/IgG2a PE control (CAT. NO.342409, BD Biosciences, San Jose, USA) was used for the detection of nonspecific binding.
The data of flow cytometry was identified as the proportion (%) of cells expressing the marker, and protein levels as MFI.
Statistical methods
Data were coded and entered in the statistical software package SPSS version 25. Data were summarized using mean, standard deviation, minimum, maximum, median and interquartile range (IQR) for quantitative data and frequencies (counts) and relative frequencies (percentages) for categorical data. Comparisons between quantitative variables were performed with the non-parametric Kruskal-Wallis and Mann-Whitney tests. To compare categorical data, the Chi square (χ2) test was performed. Fisher′s exact test was used instead when the expected frequency was less than 5. Correlations between quantitative variables were determined with Spearman′s rank-order correlation. P-values less than 0.05 were considered statistically significant.
Results
Sixty patients were split into two groups according to age; Group I (n=30) consisted of pediatric CKD patients, including 18 males and 12 females with an age range of 3–12 years, with a mean age of 9±2.39 years and a median age of 9 years; Group II (n=30) consisted of adult patients, including 18 males and 12 females with an age range of 22–67 years, a mean age of 49.9±12.4 years and a median age of 51.5 years. Patients were stratified by eGFR and disease stage.
Sixty samples were used as controls and were split into two groups: a pediatric control group (n=30), with an age range of 2–12 years, a mean age of 6.7±3.18 years and a median age of 7 years, and an adult control group (n=30), with an age range of 27–66 years, a mean age of 44.67±9.3 years and a median age of 43 years.
Expression of complement regulatory proteins in pediatric patients
We examined the expression of the three complement regulatory proteins on erythrocytes, neutrophils, lymphocytes and monocytes from pediatric patients and controls (illustrated in Table 2,3).
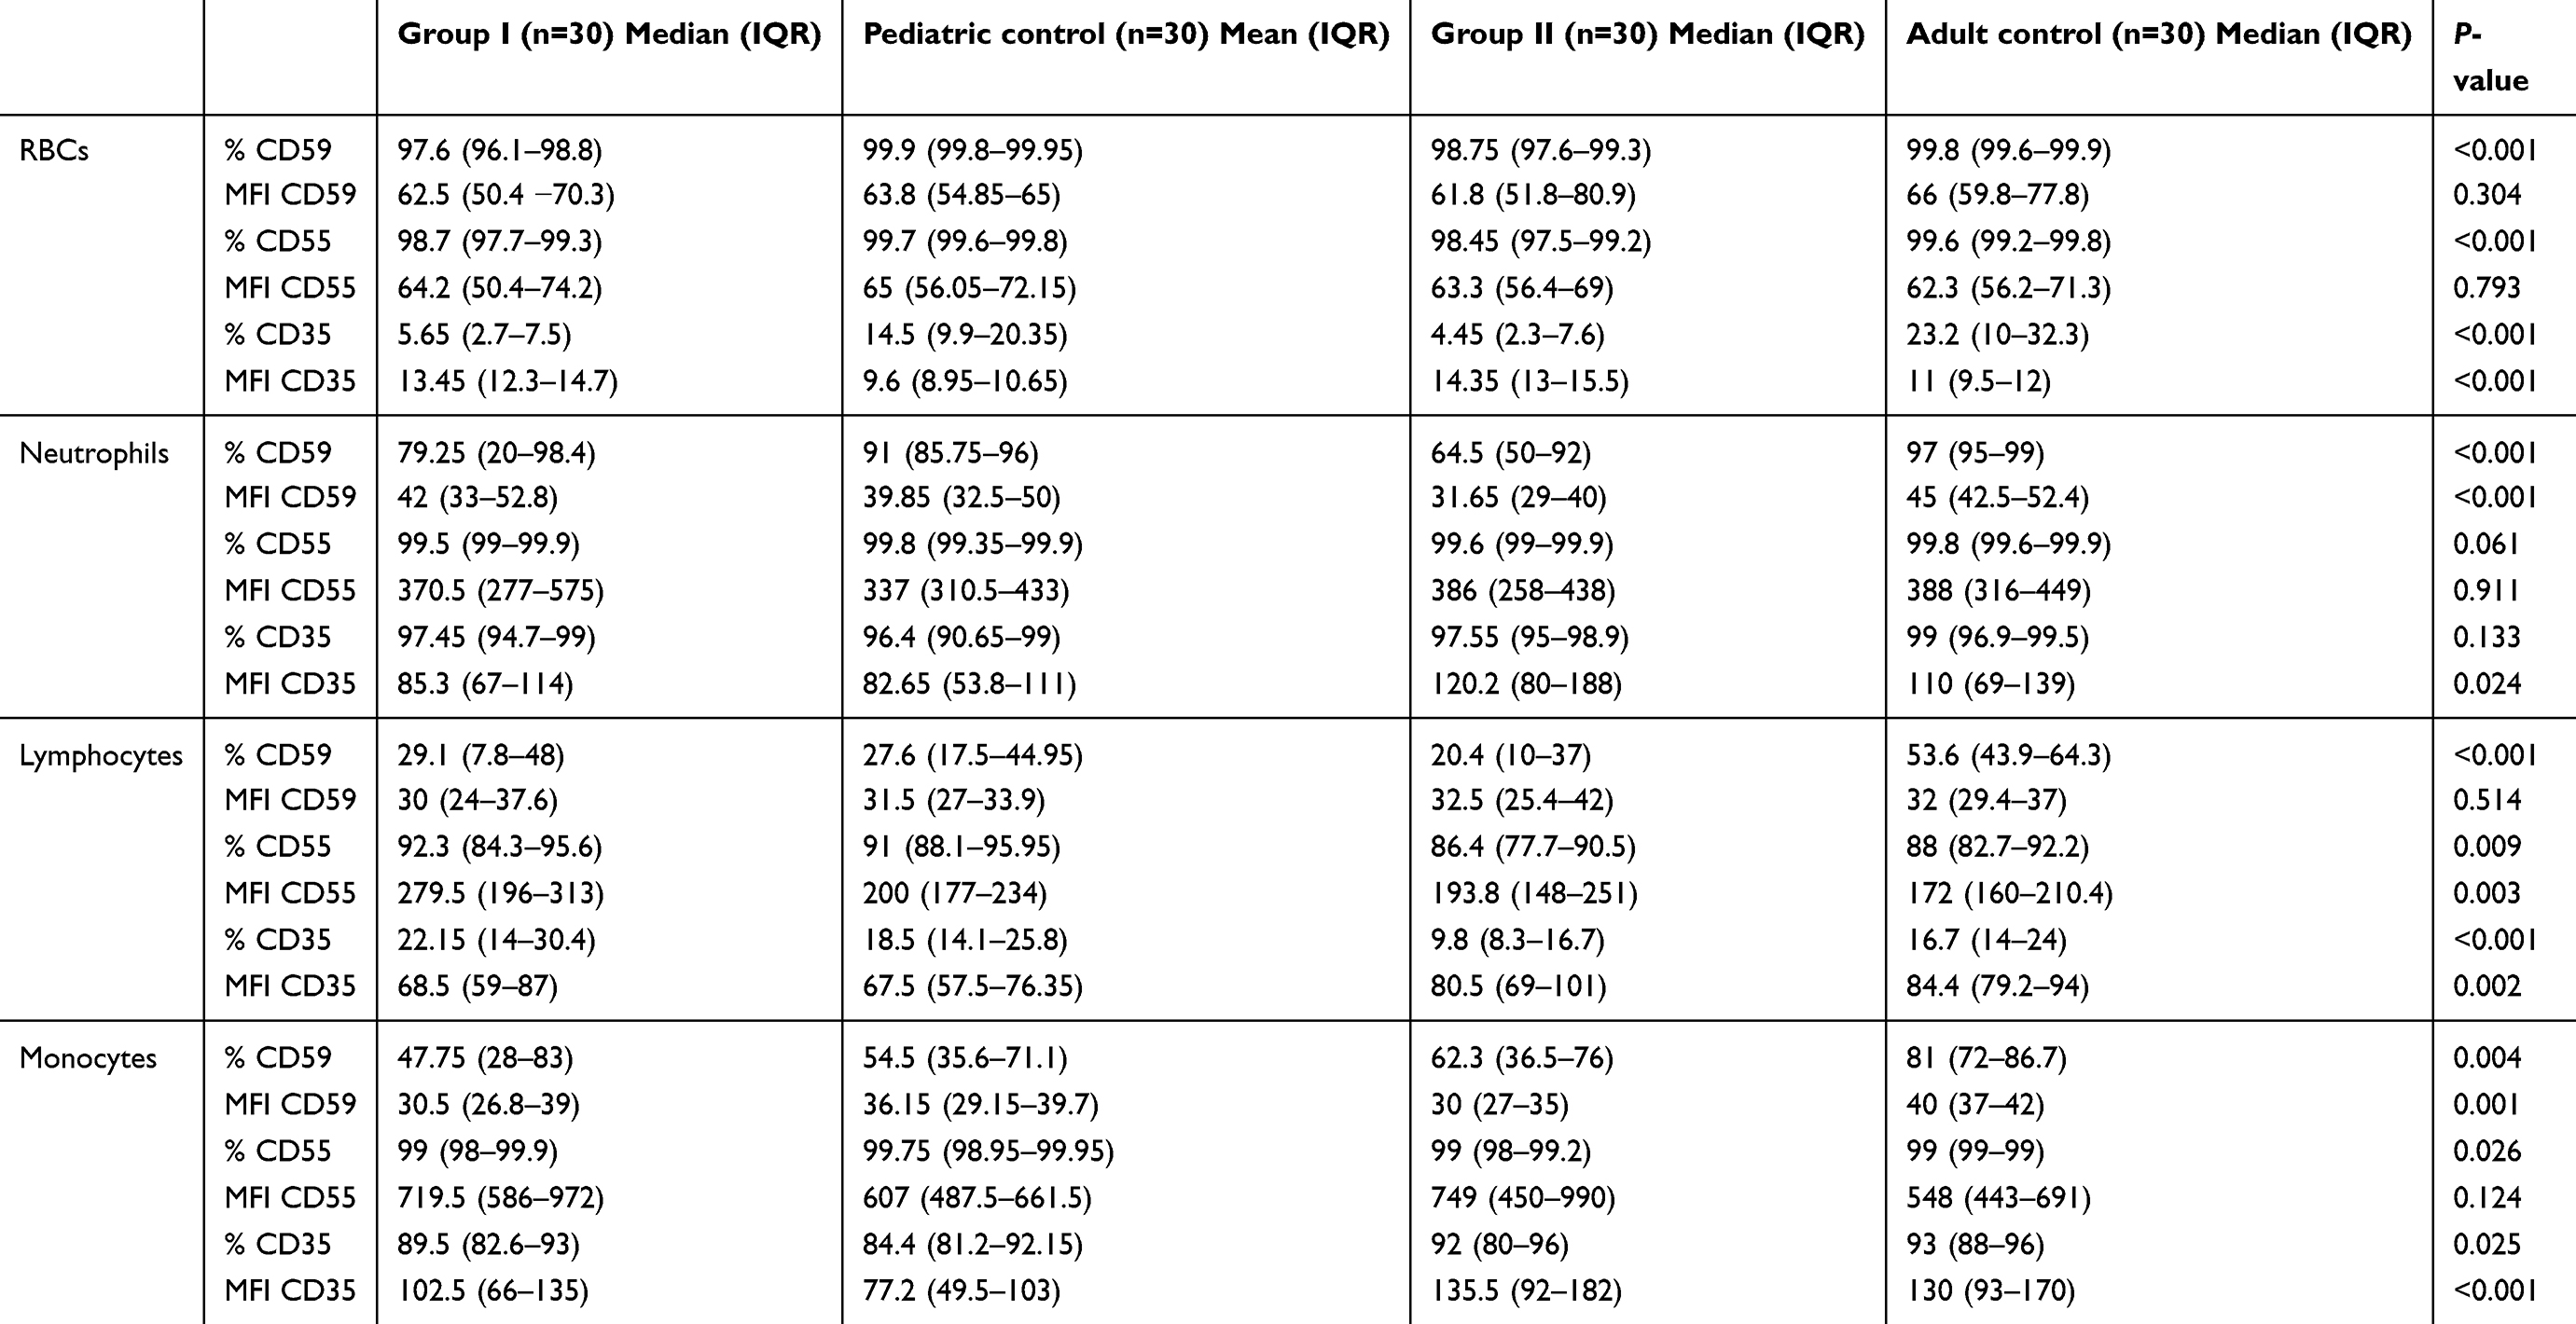 |
Table 2 Comparison of all parameters between patients and controls |
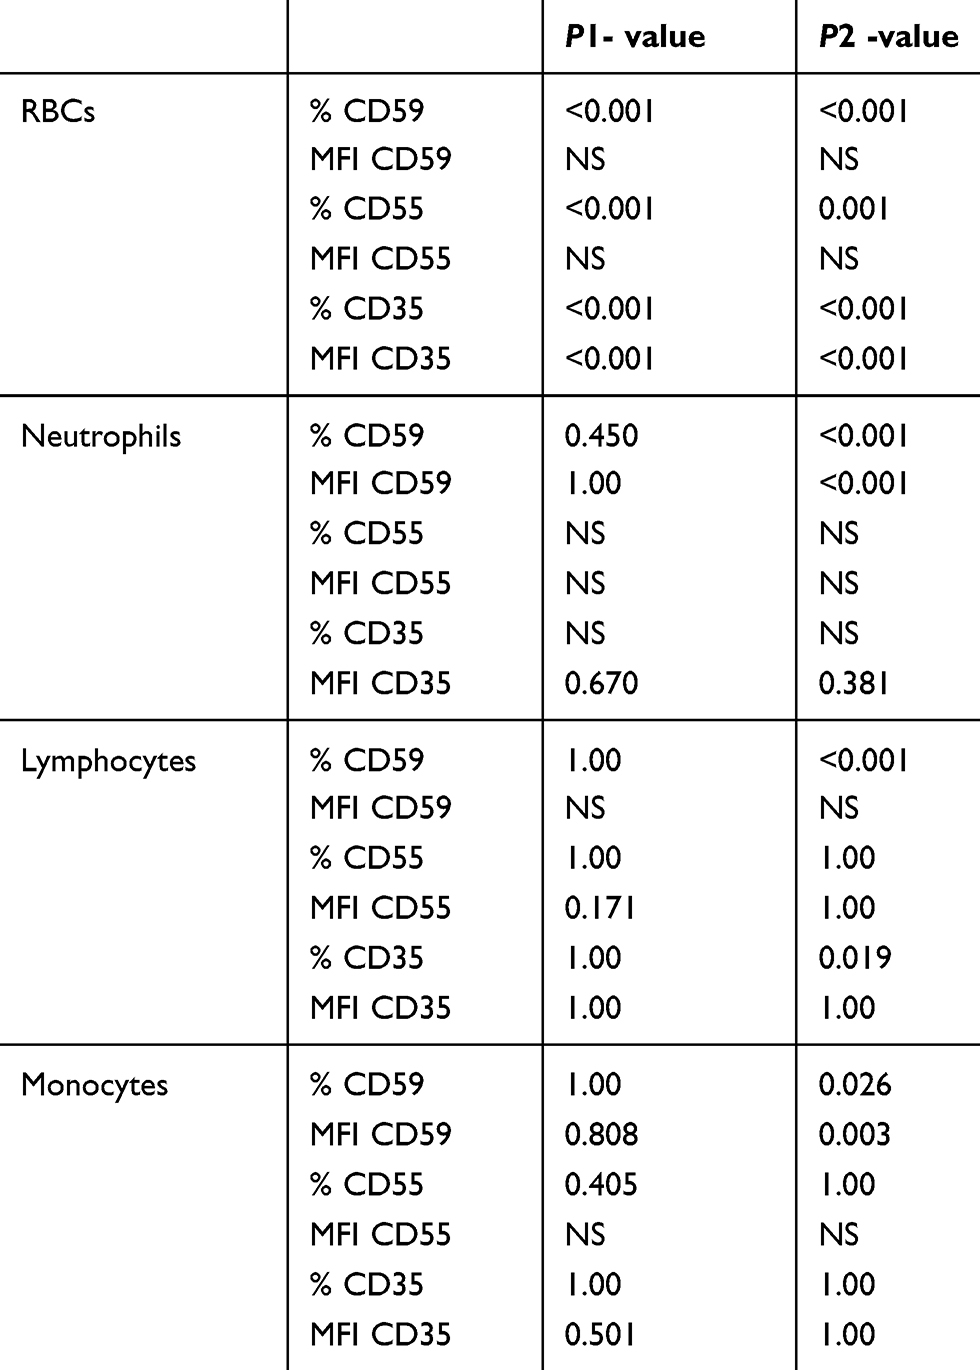 |
Table 3 Comparison of all parameters between pediatric patients and their controls and adult patients and their controls |
The proportion of cells expressing the three complement regulatory proteins varied between the cell types we examined, as did the levels of expression of the proteins (measured by MFI).
There were significantly lower proportion of positive erythrocytes expressing CD35, CD55 and CD59 in pediatric CKD patients than in pediatric control group (P<0.001). By contrast, there was no significant difference in the levels of CD35-, CD55- and CD59-positive neutrophils, lymphocytes and monocytes.
When looking at protein levels, we found that the MFI of CD35 on erythrocytes was significantly higher in pediatric CKD patients than in pediatric control group (P<0.001). The MFI of CD55 on erythrocytes showed a direct correlation with the ferritin level and CRP (r=0.442, P=0.014 and r=0.421, P=0.021 respectively) and an inverse correlation with the hemoglobin (Hb) concentration and reticulocyte count (r= −0.55, P=0.001 and r= −0.51, P=0.004, respectively).
Consistent with the proportion of positive cells, there was no significant difference in the MFI of the studied markers on neutrophils, lymphocytes and monocytes between pediatric patients and controls.
The ferritin showed an inverse correlation with the proportion of CD59-positive neutrophils and CD59-positive lymphocytes (r=−0.476, P=0.008 and r=−0.450, P=0.013 respectively). CRP showed an inverse correlation with the proportion of CD35- and CD59-positive neutrophils, CD59-positive lymphocytes, the MFI of CD35- and CD59- positive neutrophils, the MFI of CD35-positive lymphocytes and the MFI of CD59-positive monocytes (r=−0.407, P=0.026, r=−0.427, P=0.019, r=−0.372, P=0.043, r=−0.372, P=0.043, r=−0.367, P=0.046, r=−0.401, P=0.028 and r=−0.495, P=0.005 respectively).
Overall, the findings show an altered expression of the three complement regulatory proteins in pediatric patients on erythrocytes.
Expression of complement regulatory proteins in adult patients
Next, we assessed the expression of the three complement regulatory proteins in adult patients and adult controls (illustrated in Table 2,3).
Similar to the findings from pediatric patients, there were lower proportion of erythrocytes expressing CD35, CD55 and CD59 in adult patients than in adult controls (P<0.001, P=0.001 and P<0.001 respectively). In addition, there were lower proportion of CD59-positive neutrophils (P<0.001) and CD35-, CD59-positive lymphocytes (P=0.019 and P<0.001, respectively), and CD59-positive monocytes (P=0.026) in adult patients than in adult controls.
When looking at protein levels, we observed that the MFI of CD35-positive erythrocytes was significantly higher in adult patients than in the adult control (P<0.001), while CD59-positive neutrophils and monocytes was significantly lower in adult patients than in the adult controls (P<0.001 and P=0.003 respectively).
The Hb concentration showed an inverse correlation with the MFI of CD35-positive erythrocytes (r=−0.49, P=0.006). The ferritin showed a direct correlation with the proportion of CD35-positive erythrocytes and the MFI of CD59-positive erythrocytes (r=0.544, P=0.002 and r=0.499, P=0.005 respectively). CRP showed a direct correlation with the MFI of CD59-positive erythrocytes (r=0.369, P=0.045).
Overall, the expression of the three complement regulatory proteins was altered in adult patients with CKD in the four cell types analyzed.
Correlation of complement regulatory proteins and disease stage
The findings so far showed that there was, at least to some extent, a correlation between the expression of the complement regulatory proteins and the presence or absence of the disease. Therefore, we decided to explore whether the expression of the proteins might also correlate with disease severity (as measured by eGFR).
In pediatric patients eGFR directly correlated with the proportion of CD59-positive neutrophils and lymphocytes, CD35-positive lymphocytes and the MFI of CD59 on monocytes (r=0.58, P=0.001, r=0.49, P=0.005, r=0.49, P=0.006 and r=0.43, P=0.017, respectively). While there was an inverse correlation between the disease stage and the same parameters (r=−0.63, P=0.000, r=−0.49, P=0.005, r=−0.48, P=0.007 and r=−0.41, P=0.024, respectively).
However, there was no significant correlation between the studied markers on erythrocytes and the eGFR or the stage of kidney disease.
When looking at adult patients, we observed an inverse correlation between eGFR and the proportion of CD35- and CD55-positive erythrocytes, and the MFI of CD59 on erythrocytes (r=−0.62, P=0.000, r=−0.48, P=0.007 and r=−0.45, P=0.013, respectively), while the eGFR directly correlated with the proportion of CD59-positive neutrophils and lymphocytes and the MFI of CD59 on monocytes (r=0.42, P=0.02, r=0.52, P=0.003 and r=0.49, P=0.005, respectively).
The stage of the kidney disease showed a direct correlation with the proportion of CD35- and CD55-positive erythrocytes (r=0.68, P=0.000 and r=0.39, P=0.035, respectively). There was an inverse correlation with CD59-positive neutrophils and lymphocytes, CD35-positive lymphocytes and MFI of CD59 on monocytes (r=−0.52, P=0.003, r=−0.64, P=0.000, r=−0.52, P=0.003 and r=−0.52, P=0.003, respectively).
Discussion
In this study, we aimed to determine if the complement dysregulation is associated with CKD and if there is any correlation between complement regulatory proteins and the stage of the kidney disease.
There are few reports about the patterns of expression of complement regulatory proteins in CKD patients, and no single report evaluated the expression of these markers together on different peripheral blood cells in patients with CKD or compare the expression of these markers among different age groups. However, these complement regulatory proteins have been evaluated in other diseases such as SLE and rheumatoid arthritis, that may affect the kidney.
This study showed that the proportion of erythrocytes expressing CD35, CD55 and CD59 was significantly lower in both pediatric and adult CKD patients than in healthy controls. Since all patients were anemic, this may suggest that altered expression of these proteins on erythrocytes of patients with CKD might play a role in the development of anemia.
Anemia is one of the most characteristic manifestations of CKD. The principal cause of the anemia of CKD is a decrease in erythropoietin production. The presence of uremic inhibitors of erythropoiesis, shortened erythrocyte survival, excessive bleeding, and iron deficiency have all been proposed as factors contributing to the anemia of chronic renal failure. In addition, deficiency of complement regulatory proteins may be another factor in anemia of CKD.12
Al-Faris et al, found that there were increased proportions of CD55- and CD59- deficient erythrocytes among adult CKD patients than in normal healthy controls. So, this may be a factor for the development of anemia.12 But this study didn’t include patients of different ages nor evaluate the expression of the markers on different leukocytes.
Arora et al, stated that the proportion of positivity and MFIs of CD55 and CD59 on erythrocytes were much higher in diffuse proliferative glomerulonephritis patients, secondary to SLE, than in the control group, while the proportion of positivity and MFI of CD35 were significantly lower in patients than in the control group. This study suggested that the increased intensity of CD55 and CD59 is a protective response against the complement mediated injury in this disease.13 But this study didn’t show the expression of these markers on leukocytes, besides, the altered expression of these markers may be attributed to the autoimmune process of the original disease, so in our study we excluded CKD secondary to autoimmune disorders.
When looking at the proportion of positivity of these markers on leukocytes, we found no significant difference between pediatric patients and controls. By contrast, we found a significant decrease in the proportion of positivity of some of the markers between adult patients and controls. The discrepancy between pediatric and adult patients may be related to age or due to the duration of the disease, frequency of dialysis, development of complications or drug therapy. Further studies are needed to study the effect of the previous factors on the studied markers.
Our study showed that the proportion of positive cells expressing some of the three markers decreased as eGFR decreased, this may occur as a protective response against complement mediated lysis. Further studies are required to enroll significant number of cases with leucopenia to discuss the correlation of these markers with the absolute count of different subsets of leukocytes.
Coppo et al, found that CD55 expression on leucocytes in progressive immunoglobulin A nephropathy wasn’t correlated with eGFR or progression of the disease but the prediction of progression was increased when they use a specific scoring system consists of CD55 expression on leucocytes mixed with other clinical data and findings of renal biopsy.14
Taken together, our findings show that there are differences in the patterns of expression of complement regulatory proteins (CD35, CD55 and CD59) on the peripheral blood cells of CKD patients and healthy controls. Some of these differences seem to correlate with the stage of the kidney disease and eGFR, so deeper understanding of the role of these markers in CKD patients is very important for the development of novel therapies based on blood cell involvement in those patients.
Disclosure
The authors report no conflicts of interest in this work.
References
1. Ricklin D, Hajishengallis G, Yang K, Lambris JD. Complement: a key system for immune surveillance and homeostasis. Nat. Immunol. 2010;11(9):785–97. doi:10.1038/ni.1923
2. Markiewski MM and Lambris JD. The role of complement in inflammatory diseases from behind the scenes into the spotlight. AM. J. Pathol. 2007;171(3):715–27. doi:10.2353/ajpath.2007.070166
3. Lesher M and Song W. Complement and its regulatory proteins in kidney diseases. Nephrology. 2010;15 (7):663–675.
4. Borza DB. Alternative pathway dysregulation and the conundrum of complement activation by IgG4 immune complexes in membranous nephropathy. Front Immunol. 2016;7:157–163. doi:10.3389/fimmu.2016.00157
5. Salvadori M, Rosso G, Bertoni E. Complement involvement in kidney diseases: from pathophysiology to therapeutical targeting. World J Nephrol. 2015;4(2):169–184. doi:10.5527/wjn.v4.i2.169
6. Algretti A, Schneider L, Piccoli A, et al. Diminished expression of complement regulatory proteins on peripheral blood cells from sys-415 temic lupus erythematosus patients. Clin Dev Immunol. 2012. doi:10.1155/2012/725684
7. Piccoli A, Alegretti A, Schneider L, Lora P, Brenol C, Xavier R. Expression of CD55, CD59, CD46 and CD35 in peripheral blood cells from rheumatoid arthritis patients. Open J Rheumatol 420 Autoimmune Dis. 2014;4:69–73. doi:10.4236/ojra.2014.41011
8. Koscielska-Kasprzak K, Bartoszek D, Myszka M, Zabinska M, Klinger M. The complement cascade and renal disease. Arch Immunol Ther Exp. 2014;62:47–57. doi:10.1007/s00005-013-0254-x
9. Abd ElHafeez S, Bolignano D, Arrigo GD, Dounousi E, Tripepi G, 425 Zoccali C. Prevalence and burden of chronic kidney disease among the general population and high-risk groups in Africa: a systematic review. B.M.J. 2018;8(1):e 015069–57.
10. Levey AS, Stevens LA, Schmid CH, et al. A new equation to estimate glomerular filtration rate. Ann Intern Med. 2009;150(9):604–612.
11. Kurtogllu AU, Koctekin B, Kurtoglu E, Yildiz M, Bozkurt S. Expression of CD55, CD59, and CD35 on red blood cells of – thalassaemia patients. Cent Eur J Immunol. 2017;42(1):78–84. doi:10.5114/ceji.2017.67321
12. Al-Faris L, Al- Humood S, Behbehani F, Sallam H. Altered expres-sion pattern of CD55 and CD59 on red blood cells in anemia of chronic kidney disease. Medical Principles and Practice J. 2017;26(6):516–522. doi:10.1159/000481823
13. Arora M, Arora R, Tiwari SC, Das N, Srivastava LM. Expression of complement regulatory proteins in diffuse proliferative glomerulone-phritis. Lupus. 2000;9:127–131. doi:10.1191/096120300678828154
14. Coppo R, Peruzzi L, Loiacono E, et al. Defective gene expression of the membrane complement inhibitor CD46 in patients with progressive immunoglobulin A nephropathy. Nephrol Dial Transplant. 2019. 1;34(4):587–596. doi:10.1093/ndt/gfy064
 © 2019 The Author(s). This work is published and licensed by Dove Medical Press Limited. The full terms of this license are available at https://www.dovepress.com/terms.php and incorporate the Creative Commons Attribution - Non Commercial (unported, v3.0) License.
By accessing the work you hereby accept the Terms. Non-commercial uses of the work are permitted without any further permission from Dove Medical Press Limited, provided the work is properly attributed. For permission for commercial use of this work, please see paragraphs 4.2 and 5 of our Terms.
© 2019 The Author(s). This work is published and licensed by Dove Medical Press Limited. The full terms of this license are available at https://www.dovepress.com/terms.php and incorporate the Creative Commons Attribution - Non Commercial (unported, v3.0) License.
By accessing the work you hereby accept the Terms. Non-commercial uses of the work are permitted without any further permission from Dove Medical Press Limited, provided the work is properly attributed. For permission for commercial use of this work, please see paragraphs 4.2 and 5 of our Terms.