")
Back to Journals » OncoTargets and Therapy » Volume 13
Expression and Prognostic Role of PLOD1 in Malignant Glioma
Received 16 June 2020
Accepted for publication 18 October 2020
Published 29 December 2020 Volume 2020:13 Pages 13285—13297
DOI https://doi.org/10.2147/OTT.S265866
Checked for plagiarism Yes
Review by Single anonymous peer review
Peer reviewer comments 2
Editor who approved publication: Prof. Dr. Geoffrey Pietersz
Hao Wang, Weijian Luo, Limeng Dai
Department of Neurosurgery, Shenzhen People’s Hospital (Second Clinical Medical College), Ji’nan University, The First Affiliated Hospital, Southern University of Science and Technology, Shenzhen, People’s Republic of China
Correspondence: Limeng Dai
Second Clinical Medical College of Jinan University, No. 1017, Dongmen North Road, Luohu District, Shenzhen 518020, People’s Republic of China
Email [email protected]
Background: Malignant glioma is rarely curable, and factors that influence the prognosis of glioma patients are not fully understood. Lysyl hydroxylases such as PLOD1 promote the cross-linking in extracellular matrix (ECM) molecules, which contribute to ECM structural stability and maturation. However, the expression and prognostic role of PLOD1 in malignant glioma remained to be determined.
Methods: The expression of PLOD1 was evaluated by immunohistochemistry in 72 malignant glioma patients from Shenzhen People’s hospital. The mRNA expression profiles and clinical information of malignant glioma patients were obtained from public databases, including TCGA, CGGA, Rembrandt, and Gravendeel. The correlation between gene expression and tumor grade, and IDH1/2 status and 1p19q status were evaluated. The association between gene expression and overall survival of malignant glioma patients was examined using Kaplan–Meier survival analysis. GO and KEGG pathways were analyzed by Metascape. Transwell invasion assays were performed to determine the effect of PLOD1 on migration and invasion of glioma cells in vitro.
Results: PLOD1 expression was significantly elevated in malignant glioma tissues compared with non-tumor brain tissues. Besides, elevated levels of PLOD1 were significantly correlated with high tumor grade, wildtype IDH1/2 status, and 1p19q non-codel in all the four public datasets and in-house cohort. Malignant glioma patients with high PLOD1 expression had better overall survival compared to those with low PLOD1 expression. More importantly, patients with IDH1/2 mutations, 1p19q codeletions, and PLOD1 overexpression had the best overall survival. GO enrichment pathway analysis indicated that PLOD1 participates in regulating the extracellular matrix. Transwell invasion assay, which revealed that inhibiting PLOD1 reduced cell invasion in both U87 and U251 cells.
Conclusion: PLOD1 serves as a potential prognostic marker and therapeutic target for malignant glioma.
Keywords: PLOD1, glioma, prognosis, biomarker, invasion
Background
Malignant glioma is the most common type of primary brain tumor, accounting for ~70%, and an annual incidence of 5 per 100,000.1,2 The treatment of malignant glioma mainly includes surgical resection, supported by postoperative radiotherapy and chemotherapy.3,4 If left untreated, advanced glioma has extremely poor outcomes with a median overall survival of less than a year and overall 5-year survival of less than 10%.2,5 Surgery and concomitant radio- and chemotherapy increase the median survival time of the patients to 12–15 months, while the 5-year survival rate remains less than 5%.6 Malignant glioma is a complex disease caused by the accumulation of genetic alterations that cause genome instability. Complex gene interactions and molecular modulation networks are involved in the development of glioma.7 Therefore, it is important to elucidate the molecular mechanisms that might play a central role in glioma development.
Procollagen-lysine, 2-oxoglutarate 5-dioxygenase 1 (PLOD1) is a member of the PLOD family of proteins that is responsible for lysyl hydroxylation, and mutations in the PLOD1 gene have been shown to cause Ehlers-Danlos syndrome as well as Bruck syndrome type 2.8,9 PLOD1 specifically functions as a telopeptide lysyl hydroxylase. In recent years, numerous studies have investigated the role of PLOD1 in cancers. Yamada et al reported that PLOD1 was overexpressed in bladder cancer and PLOD1 acted as a potential prognostic biomarker and candidate therapeutic target in bladder cancer.10 Moreover, bioinformatics analysis has demonstrated that PLOD1 is significantly upregulated in gastrointestinal carcinoma tissues compared to the adjacent normal tissues.11 All three PLOD family genes are highly expressed in gastric tumor tissues compared with gastric normal tissues. The expression of the PLOD1 gene is reported to be significantly associated with poor prognosis. Previous studies have demonstrated that PLOD2 and PLOD3 levels were elevated in glioma tissues and significantly associated with tumor malignancy and prognosis.12,13 However, the expression and prognostic role of PLOD1 in malignant glioma remain to be further elucidated.
In this study, we explored the expression and prognostic role of PLOD1 in malignant glioma using public datasets and an in-house cohort. The correlation between PLOD1 expression and clinical parameters, such as glioma grade, IDH1/2 status, 1p19q codeletion, and molecular subtypes were analyzed. Furthermore, we investigated the effect of PLOD1 expression on overall survival on glioma patients. The biological process of PLOD1 was determined using Metascape, while the transwell invasion assay was used to verify the findings.
Methods
Patients Samples
Human malignant glioma tissues were collected from 144 glioma patients who received surgical resection at Shenzhen People’s hospital. Specimens from 13 cases of patients with craniocerebral trauma or hypertensive intracerebral hemorrhage were used as normal control brain tissues. All the tissues were stored in liquid nitrogen or as paraffin-embedded tissue blocks. None of the included patients received radiotherapy or chemotherapy before surgery. This study was approved by the Ethics Committee of Shenzhen People’s hospital. All the included patients signed informed consent. For patients with cognitive dysfunction, unable to communicate, or coma, we require relatives of the patients provided informed consent.
Bioinformatics Analysis
All data including clinical information and RNAseq expression data were retrieved from The Cancer Genome Atlas (TCGA), Rembrandt, and GSE16011 datasets, downloaded from Gliovis (http://gliovis.bioinfo.cnio.es/).14 Besides, the mRNAseq 693 datasets consisting of 693 glioma tissues with different grades was downloaded from the Chinese Glioma Genome Atlas (CGGA, http://www.cgga.org.cn/index.jsp), and the mRNA expression of the key genes in glioma and matched normal brain tissues were obtained from GEPIA (http://gepia.cancer-pku.cn/).15
Immunohistochemical (IHC) Staining
Glioma tissues or normal brain tissues were fixed in 4% paraformaldehyde (PFA) in PBS. Briefly, hydrated tissue sections were incubated in 3% hydrogen peroxide to block exogenous peroxidase activity and blocked with 10% goat serum. The sections were incubated overnight at 4°C with mouse anti-human PLOD1 monoclonal antibody (cat. 12,475-1-AP). Then, sections were incubated with HRP-conjugated anti-mouse secondary antibody. IHC staining was scored independently by two pathologists and interpreted based on the guidelines published in a previous study. The proportion of positive staining tumor cells was scored on a three-tiered scale (score 0, no staining; score 1, 1%-25%; score 2, 26%-50%; score 3, 51–75%; score 4, >75%). The staining intensity was graded as follows: 0, negative staining; 1, weakly positive staining; 2, moderately positive staining; 3, highly positive staining (Immunohistochemical staining for PLOD1, ×100). The final immune-histochemical score was determined as the product of the score of the proportion of positive staining tumor cells and the staining intensity score, defined as negative staining (0), weak staining,1–4 moderate staining,5–8 and strong staining.9–12 PLOD1 protein expression was classified as high (IHC score of 5–12) or low (IHC score of 0 −4) expression.
RNA Isolation and RT-PCR
Total RNA was extracted from the normal brain tissues, glioma tumor tissues, and glioma cell lines using the Trizol Reagent (Invitrogen, USA), according to the manufacturer’s instructions. cDNA was synthesized using the PrimeScript RT reagent kit using the gDNA eraser (TAKARA). The specificity of the primer set used in this study was determined as follows. PLOD1_F: 5ʹ-ATCACATTCCAGCAGGCTTC-3ʹ, R:5ʹ-CCTGAAGCCATCACTGAGGT-3ʹ; GAPDH_F:5´-AACTAGACGATCACAGCGATGA-3´; R:5ʹ-ACTATCGCAGACGGACTAC-3´;
Cell Culture, Cell Transfection, and Western Blot
U87 and U251 cells were purchased from the Chinese Academy of Sciences Committee Type Culture Collection Cell Bank (Shanghai, China). Cells were cultured in RPIM 1640 (Life Technologies) supplemented with 10% fetal bovine serum (Millipore). Small interfering RNAs (siRNAs) were purchased from RIBOBIO (Guangzhou, China). Lipofectamine™ 2000 (Lip2000) was obtained from Invitrogen (Carlsbad, CA) and transfections were performed according to the manufacturer’s instructions. The siRNA sequence was as follows: 5ʹ-CCAGAGGUCA GCUGUUCAAGA-3ʹ; Scramble siRNA sequence: 5ʹ-UUCGUAUCUGGGUGUAC CCTT-3ʹ. RIPA lysate was used to extract total protein from the cell lines and the protein concentration in the cell lysate was determined using the BCA protein quantification kit (Beyotime, China). SDS–PAGE was performed in 10% gel with the loading of an equal amount of protein per lane. Samples were electrophoretically transferred onto the PVDF membrane. The membranes were washed five times for 10 min with TBST and blocked using 5% non-fat dry skim milk in TBST before reblotting. The membranes were incubated overnight with primary antibodies, followed by incubation with relevant biotinylated secondary antibodies for 1 hour at room temperature. The membrane was scanned using an infrared Odyssey scanner by Li-cor.
Transwell Assay
Transfected cells (5 × 10⁵) suspended in serum-free medium were placed into the upper insert chamber pre-coated with Matrigel. Cells in 100 μL serum-free medium were placed in the top chamber without Matrigel, and 500 μL of 10% FBS containing medium added to the lower chamber. The cells were seeded in culture plates and cultured for 48 hours. Afterward, the cells were washed twice with PBS, fixed with 4% paraformaldehyde, and stained with crystal violet. Invaded cells were imaged using a microscope, and the cell number counted in 5 randomly selected high-power fields.
Gene Function Analysis (GO Enrichment)
Differentially expressed genes (DEGs) in the high and low PLOD1 groups were identified from the Gliovis website. DEGs were chosen using the criteria |FC| ≥ 2 and P ≤ 0.05. Metascape is a comprehensive tool for gene annotation and enrichment analysis. Metascape (http://metascape.org) was used to interpret the specific functions and pathways associated with DEGs.
Statistical Analysis
Descriptive results of continuous variables are expressed as mean ± standard deviation (SD). A comparison of two and three groups was conducted by independent sample t-test and one-way analysis of variance (ANOVA), respectively. Kaplan–Meier analysis was used to analyze the relationship between PLOD1 expression and survival time in patients with glioma. A p-value of less than 0.05 was considered statistically significant. All statistical analyses and graphical analyses were performed using SPSS 21 and Graphpad 5.0.
Results
PLOD1 Expression is Elevated in Glioma Tissues
RNAseq data from GEPIA were used to confirm PLOD1 expression in multiply cancers. GEPIA contained matched TCGA normal and GTEx data. Our results showed that PLOD1 was significantly elevated in glioblastoma (GBM) and specifically in lower-grade glioma (LGG, WHO grade I–III) when compared with normal brain tissues (Figure 1A and C). Genetic alteration of PLOD1 in LGG and GBM was analyzed using cBioPortal and the results showed, 25% and 22% genetic alteration of PLOD1 in LGG and GBM, respectively (Figure 1B). To further verify the findings, mRNA, and protein expression level of PLOD1 was detected by RT-PCR and IHC. The results showed that PLOD1 expression in non-tumor brain tissues was lower compared with glioma tissues (Figure 1D). This finding was confirmed by immune-histochemical staining for PLOD1 (Figure 1E).
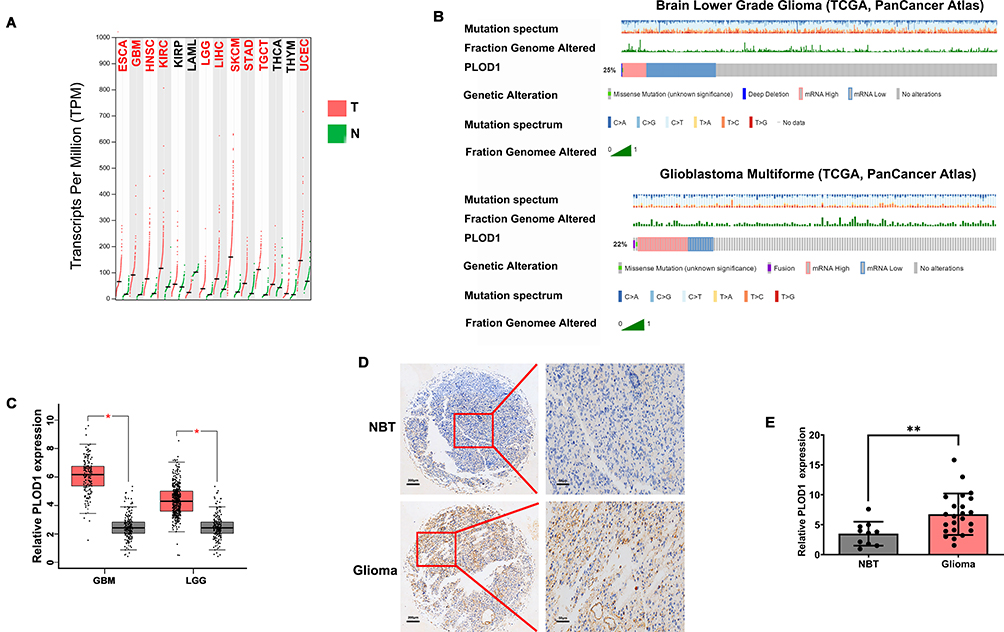 |
Figure 1 PLOD1 expression elevated in glioma tissues (A, C). GEPIA was used to analyze PLOD1 expression in multiply cancers. Expression of PLOD1 glioma was presented. (B) Genetic alteration of PLOD1 in LGG and GBM was then analyzed by using cBioPortal. mRNA and protein level of PLOD1 in glioma tissues of in-house cohort was detected by RT-PCR (D) and IHC (E). **P<0.01. Abbreviations: NBT, non-tumor brain tissues; GBM, glioblastoma; LGG, low-grade glioma. |
PLOD1 Expression Increased as Glioma Grade Increased
The malignancy of glioma increased as the tumor grade increased. IHC staining revealed that the expression of PLOD1 was higher in GBM compared to lower-grade glioma (WHO I–III) (Figure 2A). About 81% of GBM patients showed higher PLOD1 expression, while only 40% of LGG patients showed higher PLOD1 expression (Figure 2B). Taken together, these results revealed that the proportion of highly expressed PLOD1 of GBM was higher compared to that of LGG (Figure 2C). The association of PLOD1 expression and clinicopathological parameters of the in-house cohort is presented in Table 1. A total of four public datasets (TCGA, CGGA, GSE16011, and Rembrandt) were used to determine the levels of PLOD1 in different grade glioma specimens. PLOD1 mRNA expression increased as glioma tumor increased and PLOD1 was mostly enriched in GBM (Figure 2D–G).
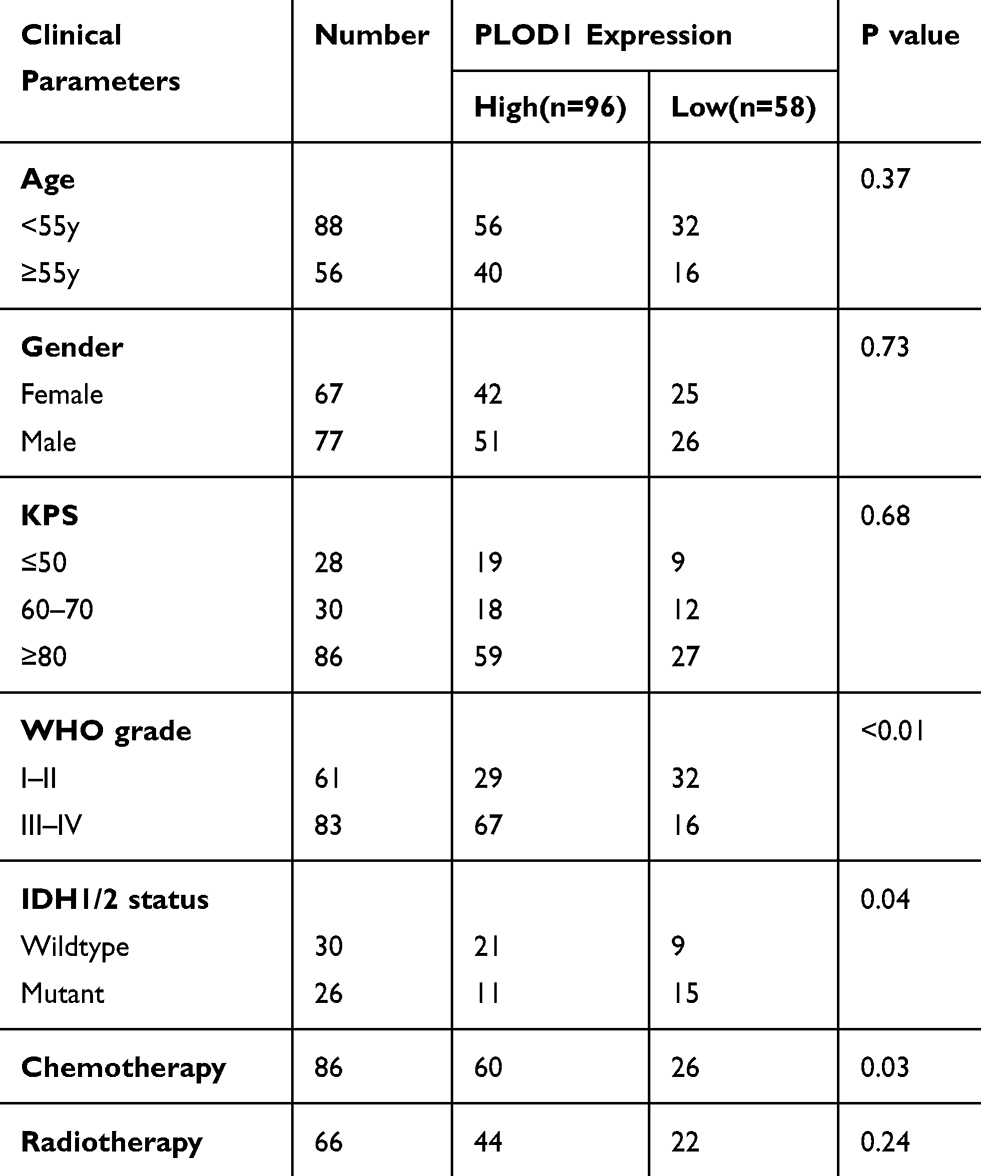 |
Table 1 Association of PLOD1 Expression and Clinicopathological Parameters |
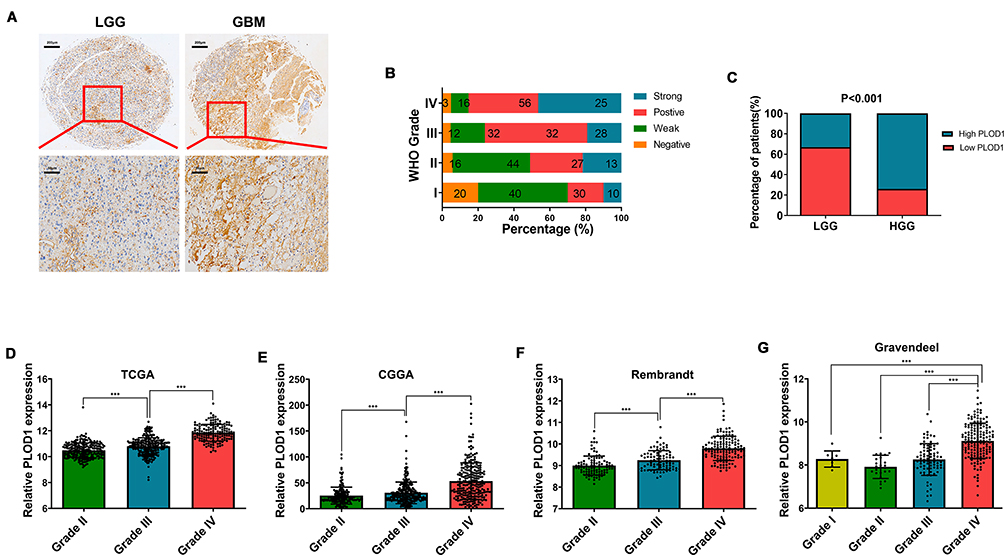 |
Figure 2 PLOD1 expression increased as glioma grade increased (A) Expression of PLOD1 in different grades of glioma detected by IHC staining. (B) Details of PLOD1 expression in every grade of glioma presented by percentage. (C) The proportion of high PLOD1 expression of GBM compared with that of LGG. Chi-square test was used in comparison of rate between two groups. (D–G) PLOD1 expression in different grades of glioma according to TCGA, CGGA, Rembrandt and Gravendeel datasets, respectively. ***P<0.001. Abbreviations: GBM, glioblastoma; LGG, low-grade glioma. |
High PLOD1 Expression is Associated with Worse Prognosis in All Glioma
Survival analysis investigated the association of PLOD1 with clinical prognosis. Patients were divided into two groups based on PLOD1 expression determined by IHC staining. The results showed that glioma patients with high PLOD1 expression had better overall survival compared with those with low PLOD1 expression. Moreover, the relationship between PLOD1 expression and prognosis in different grades was also investigated. PLOD1 expression could differentiate LGG and GBM patients into survival groups in the in-house cohort (Figure 3). Cox analysis revealed a statistically significant higher risk of progression independent of PLOD1 expression. Results of univariate and multivariate Cox regression analyses for all patients are presented in Table 2. Furthermore, the expression pattern of PLOD1 was closely related to the prognosis of patients with glioma in TCGA, CGGA, Gravendeel, and Rembrandt datasets. The results showed that PLOD1 was significantly associated with prognosis in LGG patients in four public datasets. Besides, high PLOD1 expression predicted worse prognosis in GBM in TCGA, CGGA, and Gravendeel datasets, but no correlation was observed in the Rembrandt dataset (Figure 3).
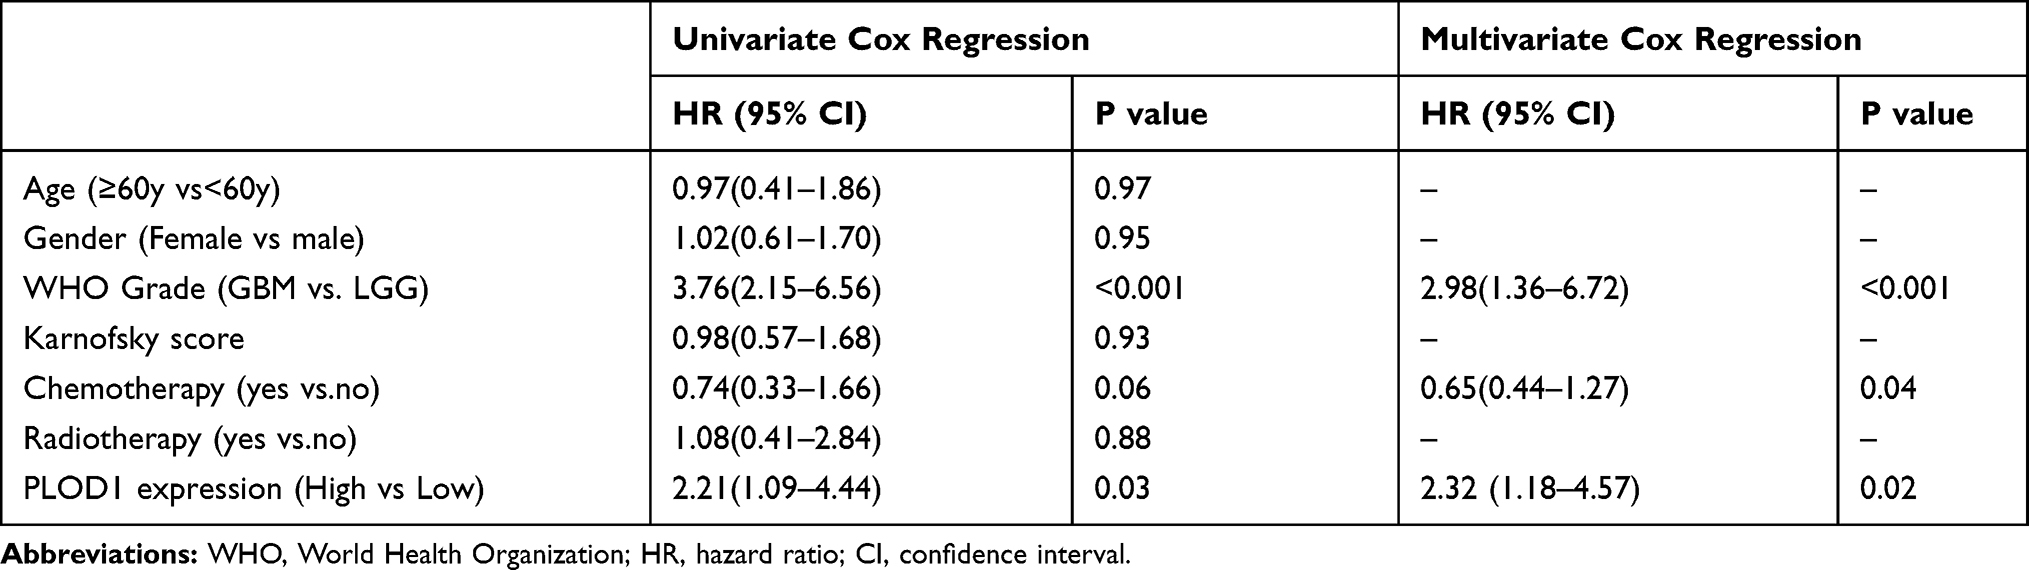 |
Table 2 Univariate and Multivariate Cox Regression Analyses for All Glioma Patients |
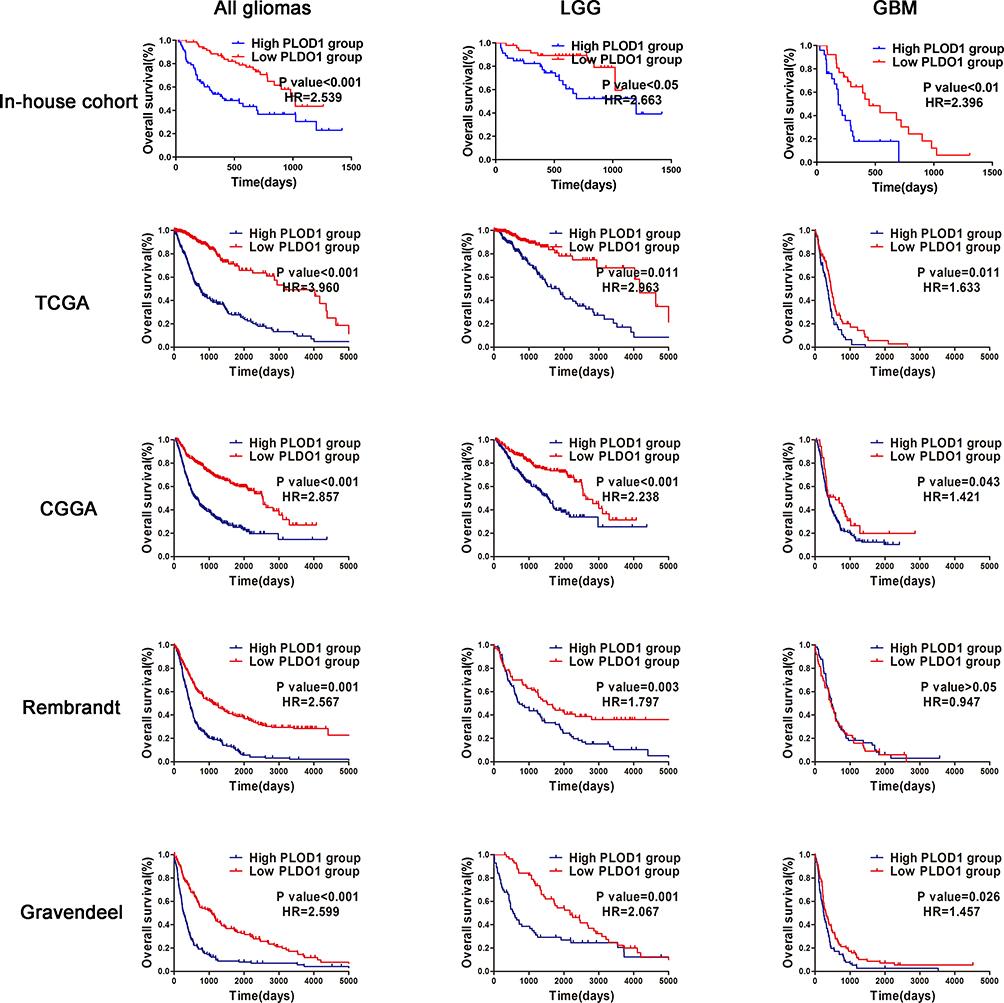 |
Figure 3 High PLOD1 expression associated with worse prognosis in all glioma, LGG and GBM Patients were divided into two groups according to PLOD1 expression. Kaplan–Meier analyses to evaluate the correlation between PLOD1 expression and the survival of all glioma patients, LGG and GBM patients according to in-house cohort, TCGA, CGGA, Rembrandt and Gravendeel datasets. Abbreviation: HR, hazard ratio. |
PLOD1 Expression is Associated with IDH1/2 Status, 1p19q in Glioma
Histologically, the presence of the 2 mutations, 1p19q and IDH1/2, have been identified as factors associated with a favorable prognosis. Numerous studies have reported that IDH1/2 mutation status and 1p 19q co-deletion status should overrule histological phenotype in tumor classification.16,17 In this study, 1p19q and IDH1/2 were detected only in some of the recruited patients. IHC staining results revealed that Patients in the GBM-IDH1/2 wild-type group had the highest PLOD1 expression among the four groups, while patients in the LGG-IDH1/2 mut codeletion group had the lowest PLOD1 expression in the in-house cohort, and these findings were verified using public datasets (Figure 4A). Our results showed that patients with IDH1/2 wildtype or 1p/19q non-codeletions had a higher level of PLOD1 expression compared to those with IDH1/2 mutation or 1p/19q codeletions based on the TCGA and CGGA datasets, respectively (Figure 4B–E). Consistent IHC results, patients in the GBM-IDH1/2 wild-type group had the highest PLOD1 expression among the four groups, while patients in the LGG-IDH1/2 mut codeletion group had the lowest PLOD1 expression when IDH1/2 mutation or 1p/19q codeletions mutations were combined in TCGA and CGGA datasets (Figure 4F and G).
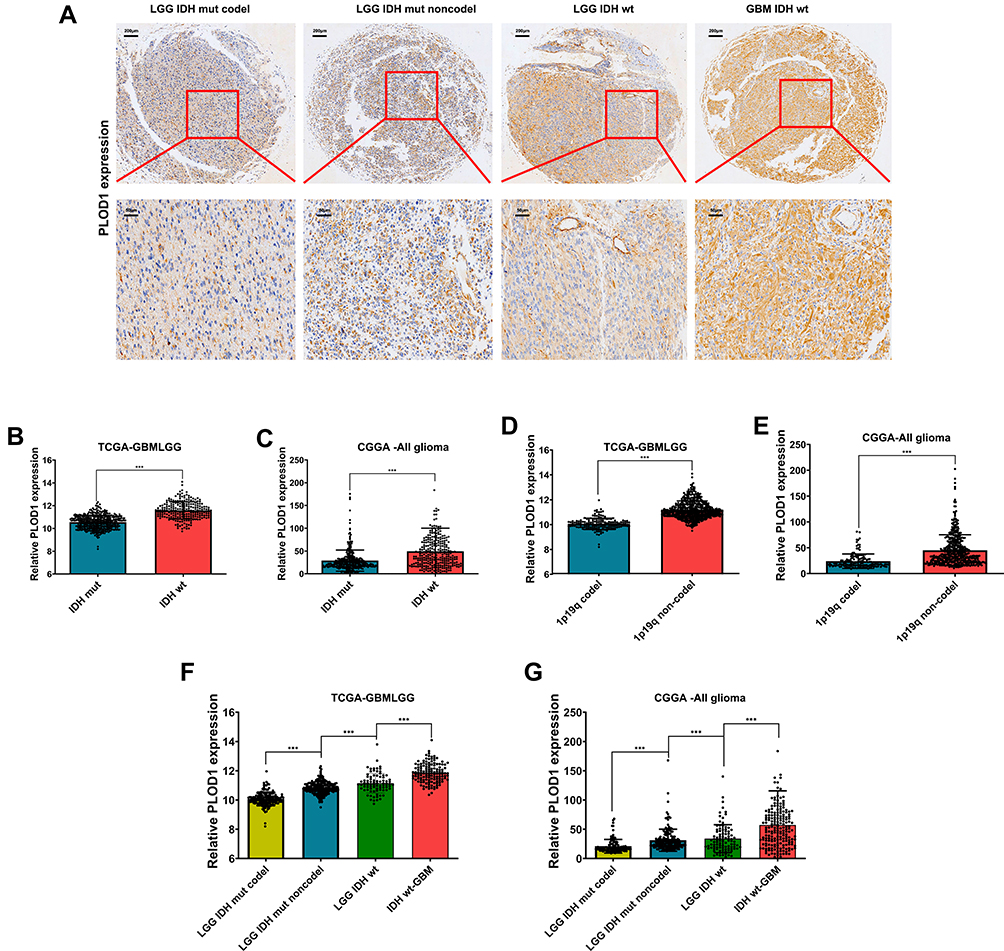 |
Figure 4 PLOD1 expression associated with IDH1/2 status, 1p19q in glioma (A) PLOD1 expression in LGG-IDH1/2 mut,1p19q codeletion, LGG-IDH1/2 mut,1p19q non-codeletion, LGG-IDH1/2 wt and GBM IDH1/2 wt glioma tissues. (B–E) PLOD1 expression in different IDH1/2 status and 1p19q codeletion in TCGA and CGGA datasets. (F–G) PLOD1 expression in LGG-IDH1/2 mut,1p19q codeletion, LGG-IDH1/2 mut,1p19q non-codeletion, LGG-IDH1/2 wt and GBM IDH1/2 wt in TCGA and CGGA datasets, respectively. ***P<0.001. Abbreviations: GBM, glioblastoma; LGG, low-grade glioma. |
Prognostic Role of PLOD1 Expression in the Presence of 1p19q and IDH1/2
To further analyze the association between PLOD1, IDH1/2 status, and 1p19q in glioma, patients were classified into different groups based on the IDH1/2, 1p19q, and PLOD1 expression. Glioma patients were divided into three survival groups, namely IDH1/2 wild-type, IDH1 mutations with 1p19q codeletion, and IDH1/2 mutations without 1p19q codeletion, as described in a previous study.18 Patients in the IDH1/2 mutations group and chromosome 1p19q codeletion had the best OS (median survival: 11.19 years, 7.08 years in TCGA and CGGA, respectively, Figure 5A and B), and the IDH1/2 wild-type group had the worst OS (median survival: 1.25years, 1.30 years in TCGA and CGGA, respectively, Figure 5A and B). Moreover, our results showed that PLOD1 expression separated patients with IDH1/2 wildtype into survival groups and patients with low PLOD1 expression and IDH1/2 mut had the best OS compared to patients in other groups (Figure 5C and D). Furthermore, we found that patients in the IDH1/2 wild-type group and with high PLOD expression had the shortest OS time among the six groups. However, patients in the IDH1/2 mutation/1p19q codeletion group with low expression of PLOD1 had the longest OS time (Figure 5E and F). These results indicated that PLOD1 played an important role in improving prognosis prediction when incorporated together with IDH1 mutation status and chromosome 1p19q codeletion.
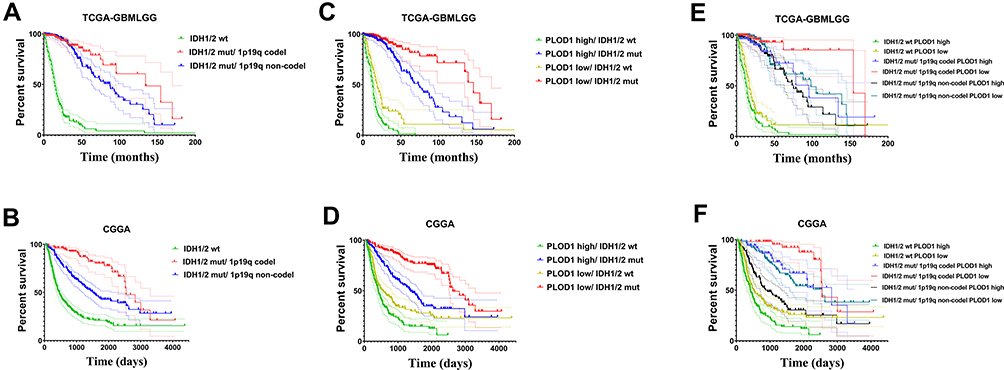 |
Figure 5 Prognostic role of PLOD1 expression with presence of 1p19q and IDH1/2. (A and B) Kaplan–Meier analyses was used to analyze patients in the group with IDH1 wild-type, IDH1 mutations with 1p19q codeletion, and IDH1 mutations without 1p19q codeletion in TCGA and CGGA datasets. (C and D) The expression of PLOD1 incorporated with IDH1/2 status in predicting prognosis of glioma patients. (E and F) The expression of PLOD1 was incorporated with IDH1 mutation status and chromosome 1p19q codeletion status to stratify glioma patients into six survival groups. |
GO Enrichment Analysis and Pathway Prediction of PLOD1 in Glioma
GO functional enrichment analysis and KEGG pathway enrichment analysis were performed on the differentially expressed genes (DEGs). Three annotation systems were used: biological process (GO), molecular function (GO), and cellular component (GO). The results showed that several biological processes were found to be involved, and included, extracellular matrix organization (GO:0030198), positive regulation of locomotion (GO: 0040017), and response to wounding (GO:0009611) (Figure 6A). Within the molecular function, the enriched GO terms were “extracellular matrix structural constituent (GO:0005201)”, “collagen binding (GO:0005518)” and “extracellular matrix structural constituent conferring tensile strength (GO:0030020)” (Figure 6B). Furthermore, for cellular components, the GO terms were related to the extracellular matrix (GO:0031012), endoplasmic reticulum lumen (GO:0005788), and cell body (GO:0044297) (Figure 6C). The results of KEGG pathway analysis showed that the DEGs were mostly enriched in focal adhesion (GO: hsa04510), AGE-RAGE signaling pathway (GO:hsa04933), and complement and coagulation cascades (GO:hsa04610) (Figure 6D). The interaction network of proteins related to PLOD1 was presented using Metascape (Figure 6E).
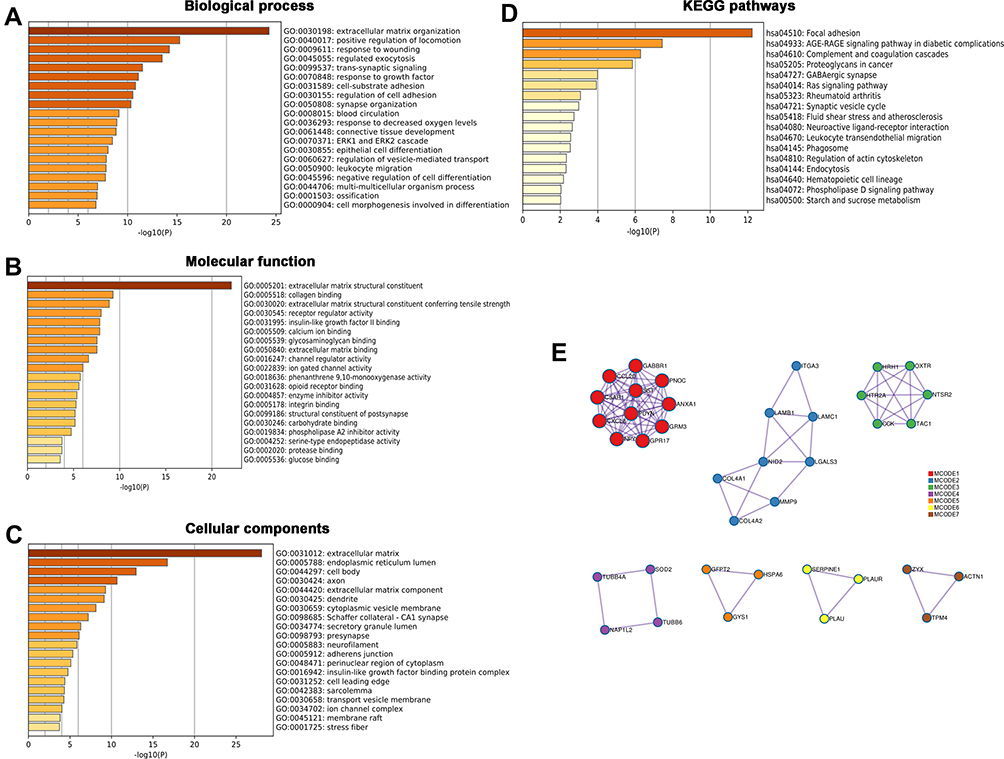 |
Figure 6 GO enrichment analysis and pathway prediction of PLOD1 in glioma. Metascape was used to perform GO enrichment analysis and pathway prediction of PLOD1 in glioma. Three annotation systems are used: (A) Biological process, (B) Molecular function and (C) Cellular component. (D) KEGG pathway analysis of differentially expressed genes (DEGs) and (E) Protein interaction network of functional partners were presented. |
PLOD1 is Associated with Molecular Subtypes of Glioma
The mesenchymal transition of glioma cells is associated with a more aggressive and treatment-resistant phenotype, leading to rapid progression and poor prognosis in patients with GBM.19 Our results showed that PLOD1 was enriched in mesenchymal GBM when compared with other molecular subtypes of GBM in TCGA, Gravendeel, and Rembrandt datasets (Figure 7A–C). To further explore the relationship between PLOD1 and mesenchymal subtype, we found that PLOD1 positively correlated with multiple mesenchymal-enriched genes (CHI3L1, RELB, MET, CD44) and invasion-related markers (Snail1, Snail2, vimentin, TWIST1, TWIST2) in TCGA-GBMLGG datasets (Figure 7D). Glioma tissues Mesenchymal glioma was more aggressive, had stronger invasive ability, and was more resistant to chemotherapy compared to other subtypes, and this was associated with relapse and poor prognosis. PLOD1 was found to be highly expressed in recurrent glioma when compared with primary gliomas of different grades in the CGGA dataset (Figure 7E).
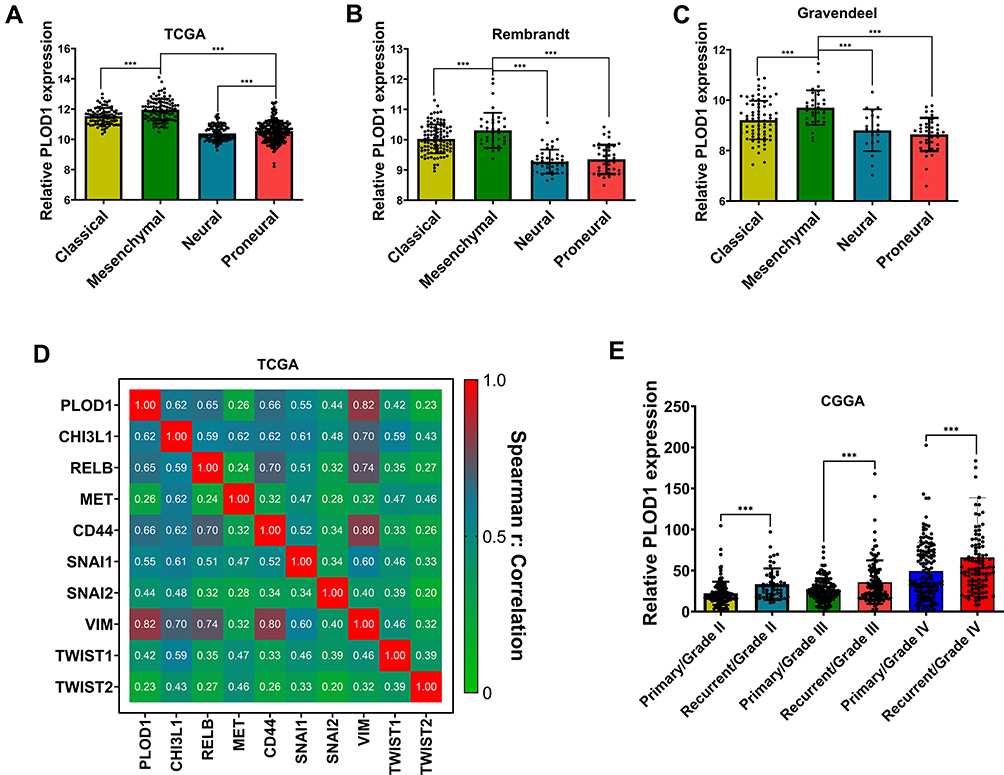 |
Figure 7 PLOD1 associated with molecular subtypes of glioma (A–C) The expression of PLOD1 among different molecular subtypes was evaluated according to TCGA, Rembrandt and Gravendeel datasets. (D) Correlation between PLOD1 expression and multiply mesenchymal-enriched genes in TCGA datasets. (E) CGGA datasets contained 422 primary and 271 recurrent glioma samples and expression of PLOD1 in primary and recurrent glioma tissues were analyzed. ***P<0.001. |
PLOD1 Promoted the Invasion of Glioma Cells in vitro
Results of GO enrichment analysis in mesenchymal glioma of PLOD1 indicated that PLOD1 promoted glioma invasion. Here, siRNA-PLOD1 significantly knockdown PLOD1 expression in U87 and U251 cells (Figure 8G). PLOD1 knockdown reduced the migration and invasion of glioma cells in vitro (Figure 8A–F). Besides, inhibiting PLOD1 downregulated the expression of mmp2 and vimentin, which were confirmed by Western blot (Figure 8G and H) and Immunofluorescence staining (Figure 8I).
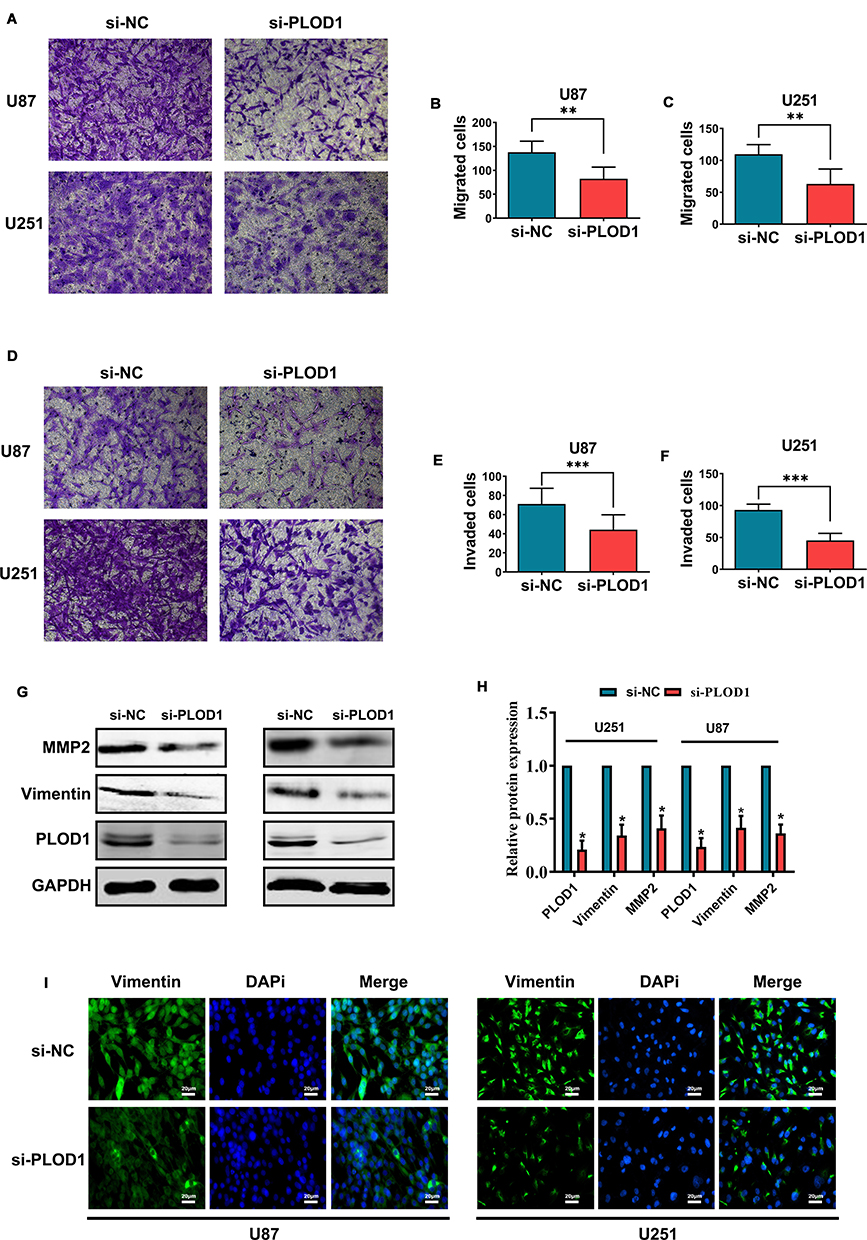 |
Figure 8 PLOD1 promoted invasion of glioma cells in vitro Small interference RNA (siRNA) was used to inhibit PLOD1 expression. Transwell assays was employed to detect the effect of PLOD1 on migration (A–C) and invasion (D–F) of U87 and U251 cells. Invasion-related proteins were measured by Western blot (G–H) and Immunofluorescence staining (I) of vimentin was also performed. *P<0.05. **P<0.01. ***P<0.001. |
Discussion
Previous studies reveal that PLOD1 plays an important role in the regulation of bone mineral density (BMD).20 PLOD1 is also responsible for catalyzing the hydroxylation of prolyl and lysyl residues through reactions crucial for the maturation and folding of several extracellular matrix proteins.21 In recent years, numerous studies have explored PLOD1 expression and its biologic role in malignant tumors. In this study, we found that PLOD1 was elevated in glioma and associated with tumor grade, IDH1/2 status, and molecular subtypes. Besides, high PLOD1 expression significantly correlated with poor prognosis in patients with LGG and GBM. Go functional enrichment analysis revealed that PLOD1 was mainly involved in regulating extracellular matrix organization, which was subsequently verified in vitro.
Regulation of PLOD1expression in cancers is rarely studied. Previous studies exploring the effect of hypoxia on the proteome of prostate cancer revealed that PLOD1 was one of the most significant differentially expressed proteins.22,23 Besides, PLOD1 has been identified as a target gene of TNF in human chondrocyte-like cells.24 A previous study found that high PLOD1 expression was observed in clear cell renal cell carcinoma (ccRCC) when compared with normal tissues and a genetic mutant of PLOD1 was associated with a significantly poorer prognosis compared with the wild-type.25 Furthermore, a significant correlation was found between increased PLOD1 expression and clinicopathological characteristics such as tumor grade, shorter progression-free survival (PFS), and overall survival. Another study also demonstrated that compared with normal tissues, PLOD1 was upregulated in gastric cancer tissues and high PLOD1 expression was significantly associated with progression and overall survival.11 Collectively, these results suggest that PLOD1 is a potential oncogene-induced by genomic amplification, and the present study results were consistent with these findings, revealing for the first time that PLOD1 was up-regulated in glioma and its expression was associated with tumor grade, IDH1/2 status, and molecular subtypes. This study also identified a novel biomarker for predicting the prognosis of patients with LGG or GBM. The current study identified the differentially expressed genes responsible for hypoxia in IDH1wt and IDH1mut gliomas, which was analyzed using a systematic bioinformatics approach.26 The results indicated that PLOD1 was one of the up-regulated genes under hypoxic conditions in IDH1mut gliomas. This study also illustrated the PLOD1 expression pattern and its prognostic role in glioma, which facilitated further functional studies.
Efforts to identify biomarkers for gliomas have been made for several decades. Genetic predictors of prognosis provide adequate strategies to aid in the clinical prediction of better clinical management and counseling.1 In light of the 2016 update by the World Health Organization (WHO) CNS tumor classification, IDH mutations, and 1p19q codeletion status have been considered novel indicators in predicting the outcome of glioma patients.27 To improve prognosis prediction, other genes associated with IDH and 1p19q status need to be identified.18,28 In this study, we revealed that PLOD1 expression was higher in glioma patients with IDH wildtype and 1p19q codeletion. Furthermore, PLOD1 was a supplementary prognostic marker for IDH1 and 1p19q status in predicting the outcome of glioma patients. Here, we identified PLOD1 as a novel biomarker, that can differentiate glioma into more comparable and clinically relevant groups.
The biological role of PLOD1 is rarely investigated in cancer. Previous studies report that PLOD1 is directly regulated by miR-140-5p in bladder cancer (BC) and knockdown of PLOD1 significantly inhibits the proliferation, migration, and invasion in BC cells.10 Aberrant expression of PLOD1 contributes to collagen-related diseases. It is reported that PLOD1 regulates the hydroxylation of lysyl residues on collagen type V, which acts as an ECM component in connective tissues to support spheroid integrity and modulate cell signaling, e.g.8 We, therefore, speculated that PLOD1 may function in remodeling or degradation of the extracellular matrix, and is likely to also play a role in tumor invasion. Since gliomas invasively grow into normal brain tissue and are thus difficult to surgically resect completely, the therapeutic outcome of gliomas is extremely poor. Similarly, this study found that PLOD1 expression is associated with glioma grade and shows a mesenchymal subtype preference. These findings indicate that PLOD1 contributes to Epithelial–mesenchymal transition (EMT), a mechanism through which epithelial cells are transformed into mesenchymal cells, and considered an important marker of tumor progression, and results from this study supported this assumption. Go analysis revealed that PLOD1 mainly participates in regulating extracellular matrix organization, thus providing a basis for a better understanding of invasion-regulation in cancer cell biology. PLOD2 is another member of the PLOD family, which affects cell migration and tumor invasion in breast cancer, cervical cancer, and glioma. It is not surprising that members of the same gene family have similar functions. Knockdown of PLOD1 was found to alter the migratory and invasive properties of U87 and U251 cells, as confirmed by in vitro transwell assay results.
Conclusion
Taken together, these results reveal that PLOD1 is downregulated in glioma when compared with normal brain tissues. There is also a significant association between PLOD1 expression and WHO grade, IDH1/2 and 1p19q codeletion status, molecular subtypes, and overall survival. Therefore, PLOD1 may be a potential prognostic biomarker and a promising target for glioma therapy.
Ethical Approval and Consent to Participate
This study was approved by the Ethics Committee of Shenzhen People’s hospital and informed consent of every patients included was signed by themselves or their relatives. For patients with cognitive dysfunction, unable to communicate, or coma, we require relatives of the patients provided informed consent.
Disclosure
None of the authors has any conflict of interest to disclose.
References
1. Omuro A. Glioblastoma and other malignant gliomas: a clinical review. JAMA. 2013;310(17):1842. doi:10.1001/jama.2013.280319
2. Rasmussen BK, Hansen S, Laursen RJ, et al. Epidemiology of glioma: clinical characteristics, symptoms, and predictors of glioma patients grade I–IV in the the Danish neuro-oncology registry. J Neurooncol. 2017;135(3):571–579. doi:10.1007/s11060-017-2607-5
3. Ostrom QT, Cote DJ, Ascha M, Kruchko C, Barnholtz-Sloan JS. Adult glioma incidence and survival by race or ethnicity in the United States from 2000 to 2014. JAMA Oncol. 2018;4(9):1254. doi:10.1001/jamaoncol.2018.1789
4. Baumert BG, Hegi ME, van den Bent MJ, et al. Temozolomide chemotherapy versus radiotherapy in high-risk low-grade glioma (EORTC 22033–26033): a randomised, open-label, Phase 3 intergroup study. Lancet Oncol. 2016;17(11):1521–1532. doi:10.1016/S1470-2045(16)30313-8
5. Van Den Bent MJ, Smits M, Kros JM, Chang SM. Diffuse infiltrating oligodendroglioma and astrocytoma. J Clin Oncol. 2017;35(21):2394–2401. doi:10.1200/JCO.2017.72.6737
6. Gusyatiner O, Hegi ME. Glioma epigenetics: from subclassification to novel treatment options. Semin Cancer Biol. 2018;51:50–58. doi:10.1016/j.semcancer.2017.11.010
7. Behnan J, Finocchiaro G, Hanna G. The landscape of the mesenchymal signature in brain tumours. Brain. 2019;142(4):847–866. doi:10.1093/brain/awz044
8. Uzawa K, Grzesik WJ, Nishiura T, et al. Differential expression of human lysyl hydroxylase genes, lysine hydroxylation, and cross-linking of type I collagen during osteoblastic differentiation in vitro. J Bone Miner Res. 1999;14(8):1272–1280. doi:10.1359/jbmr.1999.14.8.1272
9. Qi Y, Xu R. Roles of PLODs in collagen synthesis and cancer progression. Front Cell Dev Biol. 2018;6. doi:10.3389/fcell.2018.00066
10. Yamada Y, Kato M, Arai T, et al. Aberrantly expressed PLOD 1 promotes cancer aggressiveness in bladder cancer: a potential prognostic marker and therapeutic target. Mol Oncol. 2019;13(9):1898–1912. doi:10.1002/1878-0261.12532
11. Wang D, Zhang S, Chen F. High expression of PLOD1 drives tumorigenesis and affects clinical outcome in gastrointestinal carcinoma. Genet Test Mol Biomarkers. 2018;22(6):366–373. doi:10.1089/gtmb.2018.0009
12. Dong S, Nutt CL, Betensky RA, et al. Histology-based expression profiling yields novel prognostic markers in human glioblastoma. J Neuropathol Exp Neurol. 2005;64(11):948–955. doi:10.1097/01.jnen.0000186940.14779.90
13. Tsai C-K, Huang L-C, Tsai W-C, Huang S-M, Lee J-T, Hueng D-Y. Overexpression of PLOD3 promotes tumor progression and poor prognosis in gliomas. Oncotarget. 2018;9(21):15705–15720. doi:10.18632/oncotarget.24594
14. Bowman RL, Wang Q, Carro A, Verhaak RGW, Squatrito M. GlioVis data portal for visualization and analysis of brain tumor expression datasets. Neuro Oncol. 2017;19(1):139–141. doi:10.1093/neuonc/now247
15. Tang Z, Li C, Kang B, Gao G, Li C, Zhang Z. GEPIA: a web server for cancer and normal gene expression profiling and interactive analyses. Nucleic Acids Res. 2017;45(W1):W98–W102. doi:10.1093/nar/gkx247
16. Pekmezci M, Rice T, Molinaro AM, et al. Adult infiltrating gliomas with WHO 2016 integrated diagnosis: additional prognostic roles of ATRX and TERT. Acta Neuropathol. 2017;133(6):1001–1016. doi:10.1007/s00401-017-1690-1
17. Darlix A, Deverdun J, Menjot de Champfleur N, et al. IDH mutation and 1p19q codeletion distinguish two radiological patterns of diffuse low-grade gliomas. J Neurooncol. 2017;133(1):37–45. doi:10.1007/s11060-017-2421-0
18. Huang SP, Chan YC, Huang SY, Lin YF. Overexpression of PSAT1 gene is a favorable prognostic marker in lower-grade gliomas and predicts a favorable outcome in patients with IDH1 mutations and chromosome 1p19q codeletion. Cancers (Basel). 2020;12(1):13.
19. Verhaak RGW, Hoadley KA, Purdom E, et al. Integrated genomic analysis identifies clinically relevant subtypes of glioblastoma characterized by abnormalities in PDGFRA, IDH1, EGFR, and NF1. Cancer Cell. 2010;17(1):98–110. doi:10.1016/j.ccr.2009.12.020
20. Roschger P, Paschalis EP, Fratzl P, Klaushofer K. Bone mineralization density distribution in health and disease. Bone. 2008;42(3):456–466. doi:10.1016/j.bone.2007.10.021
21. Myllyharju J. Intracellular post-translational modifications of collagens. Top Curr Chem. 2005.
22. Kimbro KS, Simons JW. Hypoxia-inducible factor-1 in human breast and prostate cancer. Endocr Relat Cancer. 2006;739–749. doi:10.1677/erc.1.00728
23. Bhandari V, Hoey C, Liu LY, et al. Molecular landmarks of tumor hypoxia across cancer types. Nat Genet. 2019;51(2):308–318. doi:10.1038/s41588-018-0318-2
24. Jover E, Silvente A, Marín F, et al. Inhibition of enzymes involved in collagen cross-linking reduces vascular smooth muscle cell calcification. FASEB J. 2018;32(8):4459–4469. doi:10.1096/fj.201700653R
25. Creighton CJ, Morgan M, Gunaratne PH, et al. Comprehensive molecular characterization of clear cell renal cell carcinoma. Nature. 2013;499(7456):43–49.
26. Trong PD, Rösch S, Mairbäurl H, et al. Identification of a prognostic hypoxia-associated gene set in IDH-mutant glioma. Int J Mol Sci. 2018;19(10):2903.
27. Van Den Bent MJ, Weller M, Wen PY, Kros JM, Aldape K, Chang S. A clinical perspective on the 2016 WHO brain tumor classification and routine molecular diagnostics. Neuro Oncol. 2017;19(5):614–624. doi:10.1093/neuonc/now277
28. Deluche E, Bessette B, Durand S, et al. CHI3L1, NTRK2, 1P/19Q AND IDH status predicts prognosis in glioma. Cancers (Basel). 2019;11(4):544. doi:10.3390/cancers11040544
 © 2020 The Author(s). This work is published and licensed by Dove Medical Press Limited. The full terms of this license are available at https://www.dovepress.com/terms.php and incorporate the Creative Commons Attribution - Non Commercial (unported, v3.0) License.
By accessing the work you hereby accept the Terms. Non-commercial uses of the work are permitted without any further permission from Dove Medical Press Limited, provided the work is properly attributed. For permission for commercial use of this work, please see paragraphs 4.2 and 5 of our Terms.
© 2020 The Author(s). This work is published and licensed by Dove Medical Press Limited. The full terms of this license are available at https://www.dovepress.com/terms.php and incorporate the Creative Commons Attribution - Non Commercial (unported, v3.0) License.
By accessing the work you hereby accept the Terms. Non-commercial uses of the work are permitted without any further permission from Dove Medical Press Limited, provided the work is properly attributed. For permission for commercial use of this work, please see paragraphs 4.2 and 5 of our Terms.