")
Back to Journals » Cancer Management and Research » Volume 12
Expression and Bioinformatics-Based Functional Analysis of UAP1 in Lung Adenocarcinoma
Authors Wang X , Chen X, Liu H
Received 16 September 2020
Accepted for publication 16 November 2020
Published 25 November 2020 Volume 2020:12 Pages 12111—12121
DOI https://doi.org/10.2147/CMAR.S282238
Checked for plagiarism Yes
Review by Single anonymous peer review
Peer reviewer comments 2
Editor who approved publication: Dr Chien-Feng Li
Xianghai Wang,1 Xingwu Chen,1 Hongbing Liu2
1Department of Respiratory Medicine, Yijishan Hospital of Wannan Medical College, Wuhu, Anhui 241001, People’s Republic of China; 2Department of Respiratory Medicine, Jinling Hospital, Nanjing University School of Medicine, Nanjing, Jiangsu 210002, People’s Republic of China
Correspondence: Xianghai Wang Department of Respiratory Medicine
Yijishan Hospital of Wannan Medical College, 2 West Zheshan Road, Wuhu, Anhui 241001, People’s Republic of China
Email [email protected]
Background: Lung adenocarcinoma (LAD) is the most prevalent type of lung cancer. The abnormal expression of UDP-N-acetylglucosamine pyrophosphorylase 1 (UAP1) has been reported to be involved in many biological processes of cancer cells, but the expression of UAP1 in LAD is unclear.
Methods: Bioinformatics was used to analyse the LAD gene expression data and related clinical data in the Gene Expression Omnibus (GEO) and The Cancer Genome Atlas (TCGA) databases. DAVID6.8 was used to perform Gene Ontology (GO) and Kyoto Encyclopedia of Genes and Genome (KEGG) signal pathway enrichment analyses of UAP1 expression-related genes. The STRING database was used to analyse protein–protein interaction (PPI) networks. RNA isolation and reverse transcription-quantitative polymerase chain reaction (RT‑qPCR) assay were used to detect the expression of UAP1 in tissues and blood samples.
Results: We found that UAP1 was upregulated in LAD tissues and correlated with poor clinical outcome. GO analysis showed that these genes were enriched in biological processes and functions including intracellular transport, cellular protein catabolic process, and mitochondria (P< 0.05). The KEGG pathway analysis showed that these genes were mainly involved in the signalling pathways of amino sugar and nucleotide sugar metabolism, the aminoacyl-tRNA biosynthesis signalling pathway, and protein export (P< 0.05). The PPI analysis showed that EPRS, COPB1, CCT3, ALDH18A1 and ARF1 genes had marked or potential interaction with UAP1 (P< 0.01). In addition, UAP1 expression was upregulated in LAD tissues compared to normal tissues. High levels of UAP1 expression were associated with larger tumour sizes and later TNM stages. RT‑qPCR detection in serum further showed that UAP1 expression was upregulated in the plasma of LAD patients compared to that of healthy volunteers. High expression of UAP1 in serum suggests a poor prognosis for LAD patients.
Conclusion: UAP1 could be a novel diagnostic biomarker and a promising therapeutic target for LAD.
Keywords: UAP1, lung adenocarcinoma, bioinformatics, expression, prognosis
Introduction
The morbidity and mortality of lung cancer still rank first among all malignant tumours, and lung cancer has an extremely high disease burden worldwide. There were 1.6 million new cases and 1.38 million deaths due to lung cancer in 2008.1 According to data from the National Cancer Institute, there were 226,160 new cases in the United States in 2012, and 160,340 patients were expected to die from lung cancer.2 Non-small cell lung cancer (NSCLC) accounts for 85% of all lung cancers, and lung adenocarcinoma (LAD) is the most common histological subtype of NSCLC. Many methods for treating lung cancer have been developed, but only approximately 15% of patients survive for 5 years after diagnosis. Therefore, there is an urgent need to develop new therapeutic targets and methods to treat LAD.
The hexosamine biosynthetic pathway (HBP) has emerged as an important glucose metabolic integration point, and the HBP has been implicated in tumourigenesis in a number of cancers.3–5 UDP-N-acetylglucosamine pyrophosphorylase 1 (UAP1) is the most overexpressed gene in this pathway. Cells with high UAP1 expression have increased levels of the HBP end-product UAP1, which plays a vital role in cancer cell invasion and metastasis through the HBP. Previous studies showed that abnormal expression of UAP1 was closely related to the biological processes of cancer cells. UAP1 is highly overexpressed in prostate cancer cells and protects cancer cells from endoplasmic reticulum stress to promote their development.6 However, the expression and function of UAP1 in LAD are not clear.
Materials and Methods
Collection of Genomic Data
The GSE10072, GSE31210 and GSE30219 and GSE72094 data sets from the were downloaded Gene Expression Omnibus (GEO) (http://www.ncbi.nlm.nih.gov/geo) and The Cancer Genome Atlas (TCGA) databases (https://www.cancer.gov/about-nci/organization/ccg/research/structural-genomics/tcga). The relative expression level of UAP1 was extracted from each cohort. An unpaired t test was used to evaluate the differential expression of UAP1 between cancer tissues and adjacent normal tissues. The Log rank test and Cox proportional hazards regression were used to estimate the prognostic value of UAP1. The statistical analyses were performed using R software (version 3.3.2) with the significance level set as a two-sided P value <0.05.7
Prediction of UAP1 and the Genes Associated with Its Expression
We used cBioPortal (http://www.cbioportal.org/)8 and LinkedOmics (http://www.linkedomics.org/login.php)9 to analyse TCGA data and obtain UAP1 expression-related genes. The screening conditions were based on a Spearman correlation coefficient >|0.3|. We used online analysis tools (http://bioinformatics.psb.ugent.be/webtools/venn/) to create a Venn diagram and obtain common genes. DAVID6.8 (http://david.ncifcrf.gov/)10 was used to perform Gene Ontology (GO) and Kyoto Encyclopedia of Genes and Genomes (KEGG) signal pathway enrichment analyses of UAP1 expression-related genes. The screening conditions were based on P<0.05. The STRING database was a tool for analyzing gene or protein interactions, including biological databases and web resources that have confirmed and predictable protein–protein interactions.11 The STRING database was used to analyse protein–protein interaction (PPI) networks. “Multiple proteins” was selected to enter expression-related genes and UAP1, “Homosapiens” was selected for species, and “Mediumconfidence (0.400)” was selected for the confidence of the strength of interaction between proteins. The Igraph package was used to calculate PPI network degree centrality.
Tissue Samples, Blood Samples and Clinical Data Collection
Fifty paired LAD and normal lung tissues were obtained from patients who underwent primary surgical resection at the Yijishan Hospital of Wannan Medical College (Wuhu, China) from January 2019 to June 2020. No treatments were administered in these patients prior to surgery and all tissues were immersed in RNALater stabilization solution (Qiagen GmbH) and stored at ‑80°C. LAD patient blood was obtained from the department of respiratory medicine at Yijishan Hospital of Wannan Medical College from January 2017 to July 2017, and healthy control blood was obtained from people who received medical examinations in Yijishan Hospital of Wannan Medical College. Plasma samples were collected before any anticancer treatments were given. All patients with LAD were diagnosed according to histopathological evaluations. Overall survival (OS) was calculated from the date of clear diagnosis until the date of death or the end of the follow-up period (June 2020). The study was approved by the Institutional Review Board of Yijishan Hospital of Wannan Medical College. All of the participants signed an informed consent form, and the research was carried out according to the World Medical Association Declaration of Helsinki.
RNA Isolation and Quantitative Reverse Transcriptase
Total RNA was isolated from frozen tissue or blood samples using TRIzol® reagent (Thermo Fisher Scientific) following the manufacturer’s protocol. The cDNA was synthesized using a reverse transcription kit (Takara Biotechnology). Reverse transcription-quantitative polymerase chain reaction (RT‑qPCR) assays were performed using the SYBR Premix Ex Taq II kit (Takara Biotechnology), and the target gene expression values were normalized to the expression of GAPDH. The results were analysed based on the comparative cycle threshold (CT) (2−ΔCT) method,12 the calculation of delta Ct value was performed as follows: ΔCt (target) = Ct (target)–Ct (GAPDH). The Primer sequences of UAP1 was 5’-TTGCATTCAGAAAGGAGCAGACT-3’ (forward); 5’-CAACTGGTTCTGTAGGGTTCGTTT-3’ (reverse). The Primer sequences of GAPDH were 5’- GGAGCGAGATCCCTCCAAAAT −3’ (forward); 5’- GGCTGTTGTCATACTTCTCATGG −3’ (reverse); The data were obtained from at least 3 independent experiments and are presented as the mean ± standard deviation.
Statistical Analysis
All of the statistical analyses were performed with SPSS 18.0 software (IBM, USA). P<0.05 was considered to be statistically significant, and P<0.01 was considered to be highly statistically significant. Student’s t-test (two-tailed) was applied to compare differences between groups. Survival curves were analysed using the Kaplan–Meier method and assessed using a Log rank test. The Cox proportional hazard regression model was applied to identify independent prognostic factors.
Results
Expression Profile of UAP1 in LAD Tissues from the GEO and TCGA Datasets
A total of 3 microarray datasets (GSE10072, GSE31210 and GSE30219) from the GEO database were used to analyse UAP1 expression in LAD and normal tissues. UAP1 was upregulated in the 3 data sets (Figure 1A–C). TCGA data also indicated that UAP1 expression was upregulated in lung cancer tissues compared to normal tissues (Figure 1D). Bioinformatics analysis was used to further evaluate the effects of UAP1 expression on the prognosis of patients with LAD. UAP1 RNA-seq data and the OS times of LAD patients were downloaded from the GEO and TCGA databases, and UAP1 expression was categorized into dichotomous variables. Survival analysis showed that patients with higher UAP1 expression levels had shorter OS times than patients with low expression (Figure 2A–D). These data suggested that higher UAP1 expression was correlated with a poor prognosis in LAD.
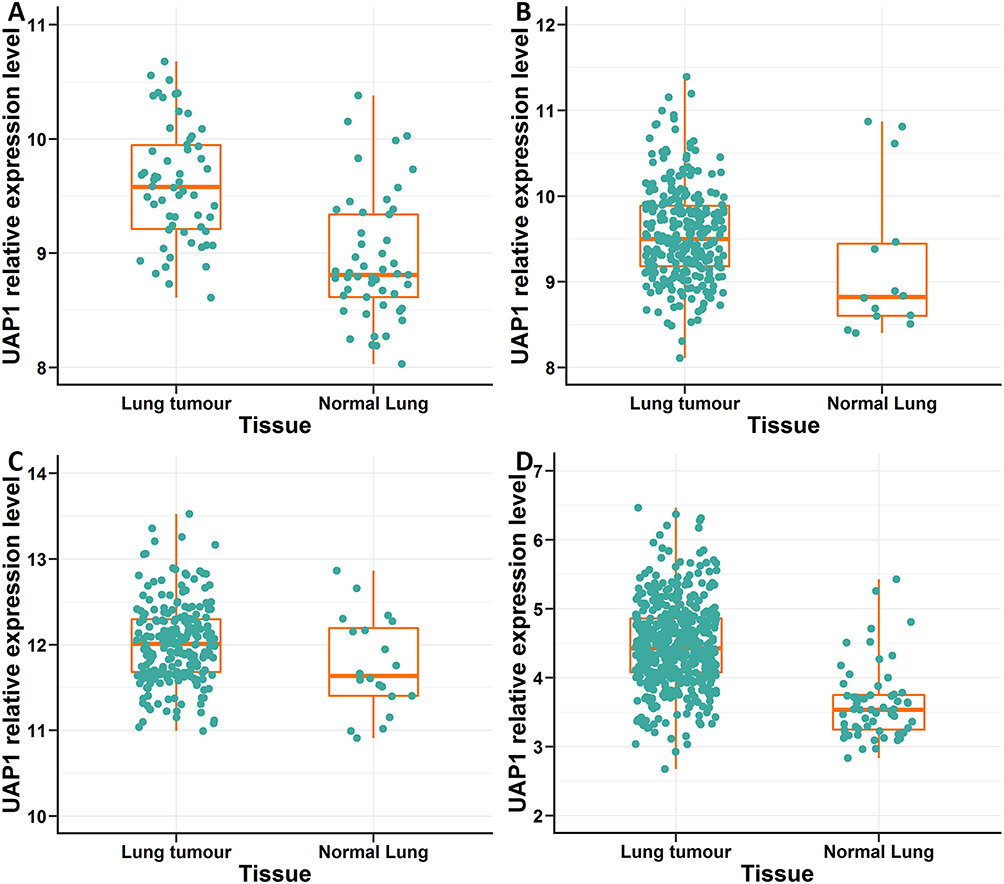 |
Figure 1 Analysis of the relative expression levels of UAP1 in LAD and normal tissues by bioinformatics methods. (A–C) The relative expression of UAP1 in LAD tissues compared to normal tissues was analysed using GEO data sets including series GSE10072, GSE31210 and GSE30219.UAP1 expression was upregulated in the three data sets. (D) The relative expression of UAP1 in LAD tissues compared to normal tissues was analysed in TCGA database. TCGA data also indicated that UAP1 expression was upregulated in lung cancer tissues compared to normal tissues. |
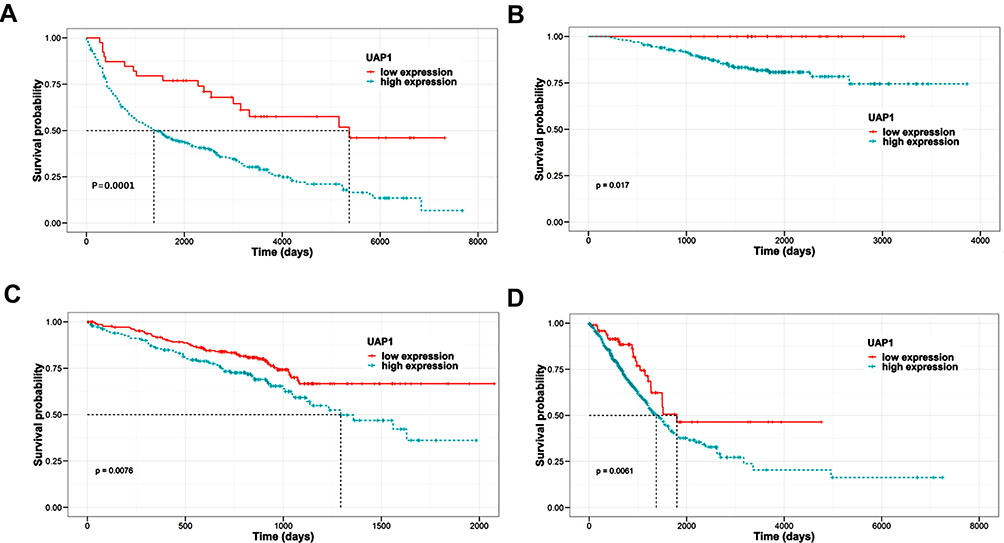 |
Figure 2 Analysis of the relationship between UAP1 expression and prognosis by bioinformatics methods. (A–C) Kaplan–Meier survival analyses of OS using the GEO data. (A) GSE72094, (B) GSE31210, (C) GSE30219. (D) Kaplan–Meier survival analyses of OS using TCGA data. |
Bioinformatics Analysis of UAP1 and the Genes Associated with Its Expression
We used cBioPortal and LinkedOmics to analyse the LAD data in TCGA, and 173 genes related to UAP1 expression were obtained (Figure 3A). GO analysis of the DAVID6.8 database revealed that UAP1 expression-related genes were primarily enriched in processes such as intracellular transport, cellular protein catabolic process, and mitochondria (P<0.05) (Figure 3B). KEGG pathway analysis revealed that UAP1 expression-related genes were primarily enriched in amino sugar and nucleotide sugar metabolism, aminoacyl-tRNA biosynthesis and protein export (P<0.05) (Figure 3C). The PPI network analysis showed that the EPRS, COPB1, CCT3, ALDH18A1 and ARF1 genes had marked or potential interaction with UAP1 (P<0.01) (Figure 4).
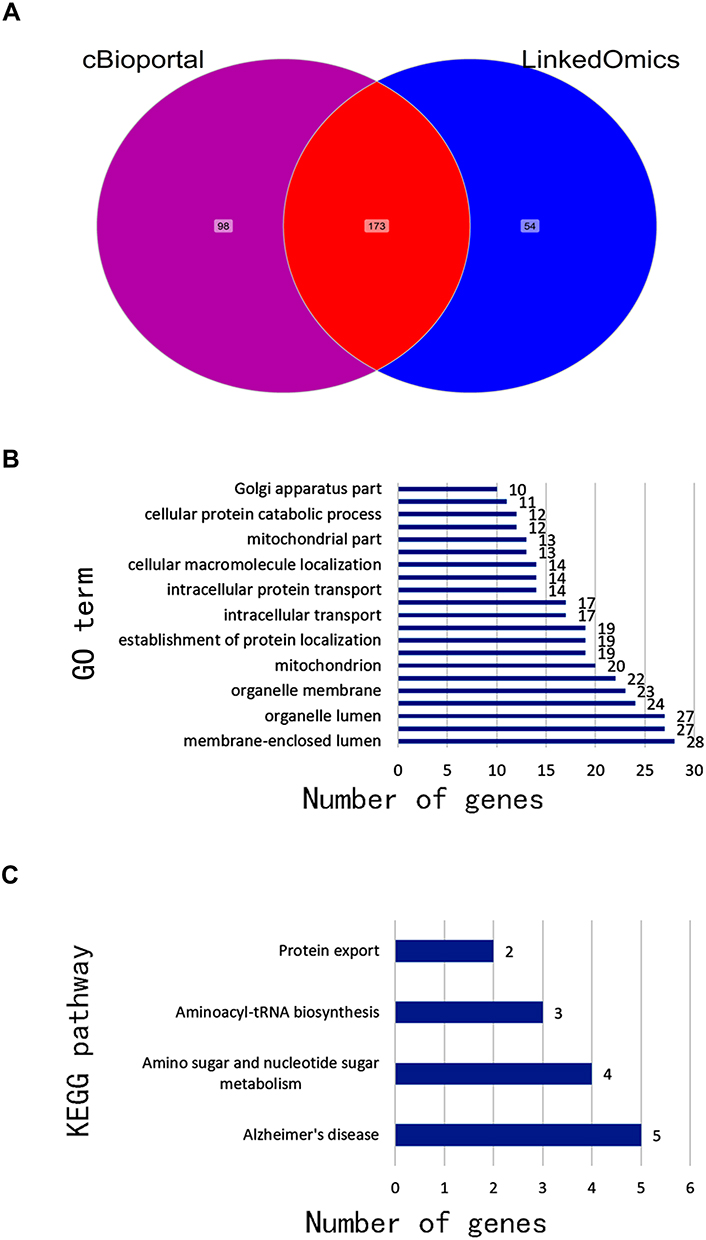 |
Figure 3 Bioinformatics analysis of genes related to UAP1 expression. (A) The genes associated with UAP1 expression. (B) GO analysis of UAP1 expression-related genes. (C) KEGG analysis of UAP1 expression-related genes. |
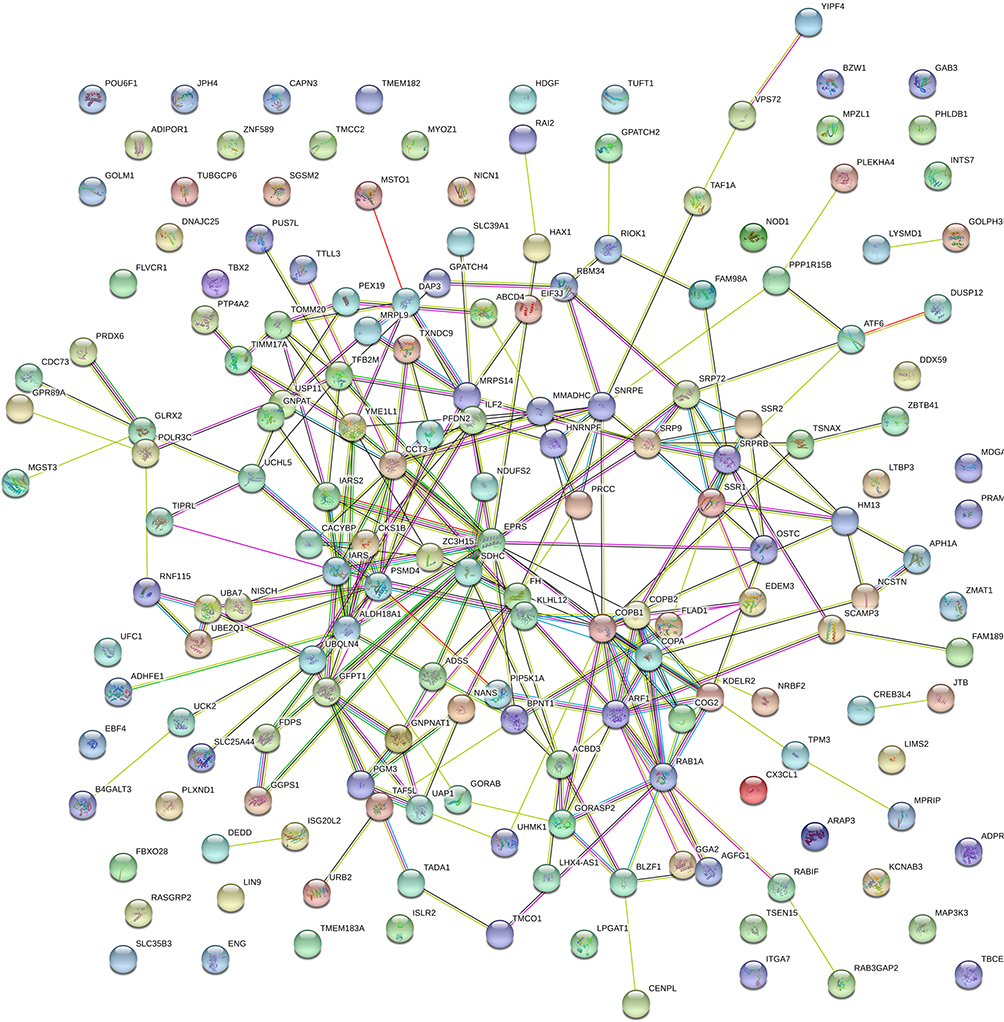 |
Figure 4 PPI network analysis of UAP1 expression-related genes and key gene predictions. |
UAP1 is Upregulated in LAD Tissues and is Associated with the Clinical Characteristics of LAD
To validate the GEO and TCGA results, RT‑qPCR assays were used to measure UAP1 expression in 50 paired LAD and adjacent normal lung tissues. The relative expression of UAP1 was calculated using the CT value (2−ΔCT) method. The expression level of UAP1 in LAD tissues was increased compared with that in normal lung tissues (P≤0.001; Figure 5A). In addition, the expression level of UAP1 in LAD tissues was increased compared with that in normal tissues, and the patients’ clinical characteristics were evaluated (Table 1). The UAP1 expression levels were significantly increased in patients with larger tumours compared with smaller tumours (P=0.002; Figure 5B) and in those with more advanced TNM stages (P=0.000; Figure 5C). However, there were no significant associations between UAP1 expression and other clinical parameters, including age, sex, differentiation, lymph node metastasis, EGFR mutation and smoking history. Furthermore, ROC curve analysis was used to determine the predictive values of UAP1 in LAD tissues. The cut-off value was 0.510, with a sensitivity of 84% and specificity of 78%, and the AUC was 0.840 (95% confidence interval: 0.762 to 0.917, P≤0.001) (Figure 5D). Collectively, the up-regulated UAP1 may serve as a biomarker of detection of LAD.
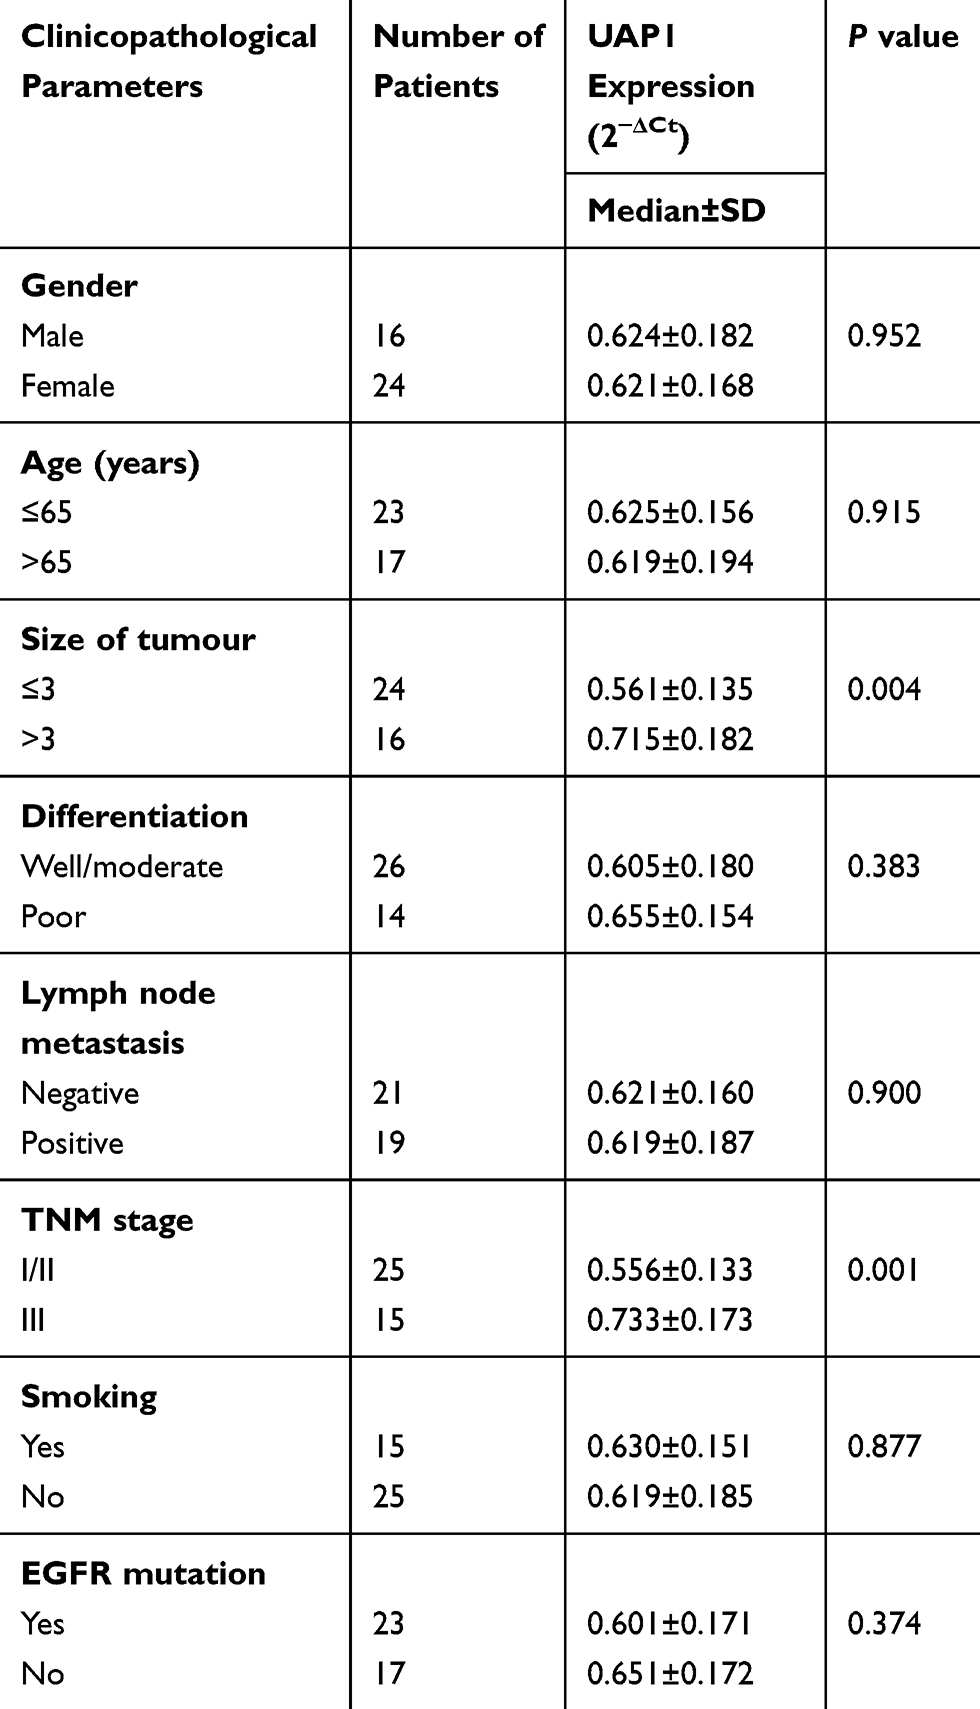 |
Table 1 Correlation Between UAP1 Expression and Clinicopathological Parameters of LAD |
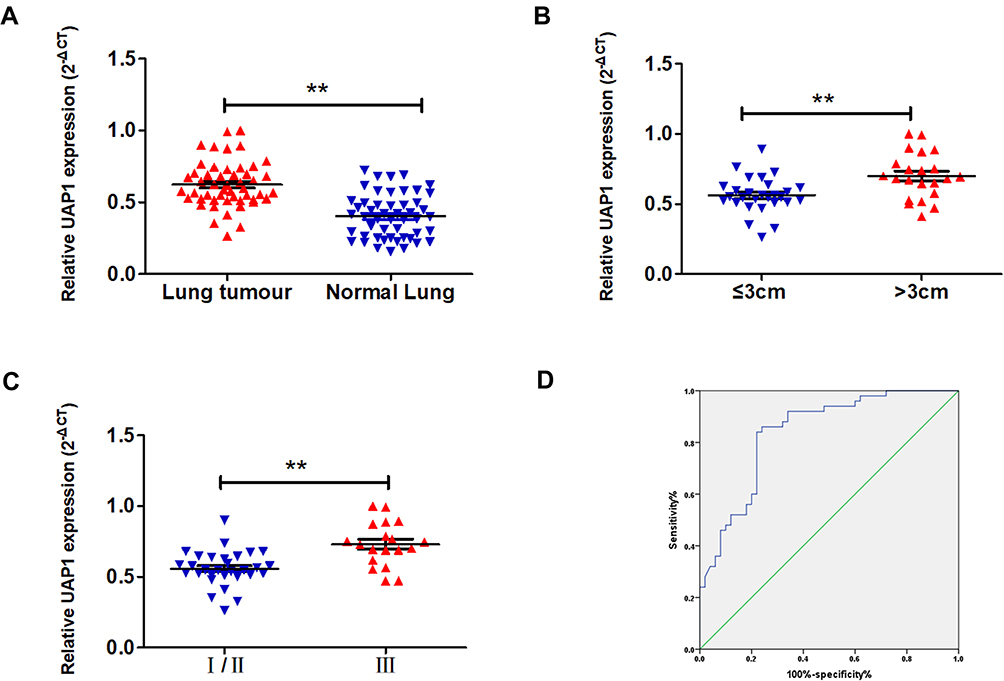 |
Figure 5 UAP1 was upregulated in LAD tissues. (A) UAP1 expression in LAD (n =50) compared to matched adjacent normal tissues (n=50) was examined by qRT-PCR assays, and UAP1 was clearly upregulated in lung cancer tissues. (B) UAP1 expression was higher in tumours with a maximum diameter >3 cm. (C) UAP1 expression was higher in stage III tumours. (D) The ROC curve for prediction of LAD was analysed using normal tissues as a control. The cut-off value was 0.510, with a sensitivity of 84% and specificity of 78%, and the AUC was 0.840 (95% confidence interval: 0.762 to 0.917, P≤0.001). **P < 0.01. |
UAP1 Was Upregulated in the Plasma of LAD Patients
To further study the expression of UAP1 in the blood, qRT-PCR was performed in 50 samples from LAD patient plasma and healthy volunteer plasma. The results indicated that UAP1 levels in the plasma of LAD patients were significantly higher than those in healthy volunteers (P≤0.001; Figure 6A). Furthermore, ROC curve analysis was used to analyse the predictive value of UAP1 in the plasma of LAD patients. The cut-off value was 0.765, with a sensitivity of 72% and specificity of 68%, and the AUC was 0.714 (95% confidence interval: 0.614 to 0.813, P≤0.001) (Figure 6B). In general, the UAP1 level was elevated in LAD patients and may serve as a novel diagnostic biomarker for LAD.
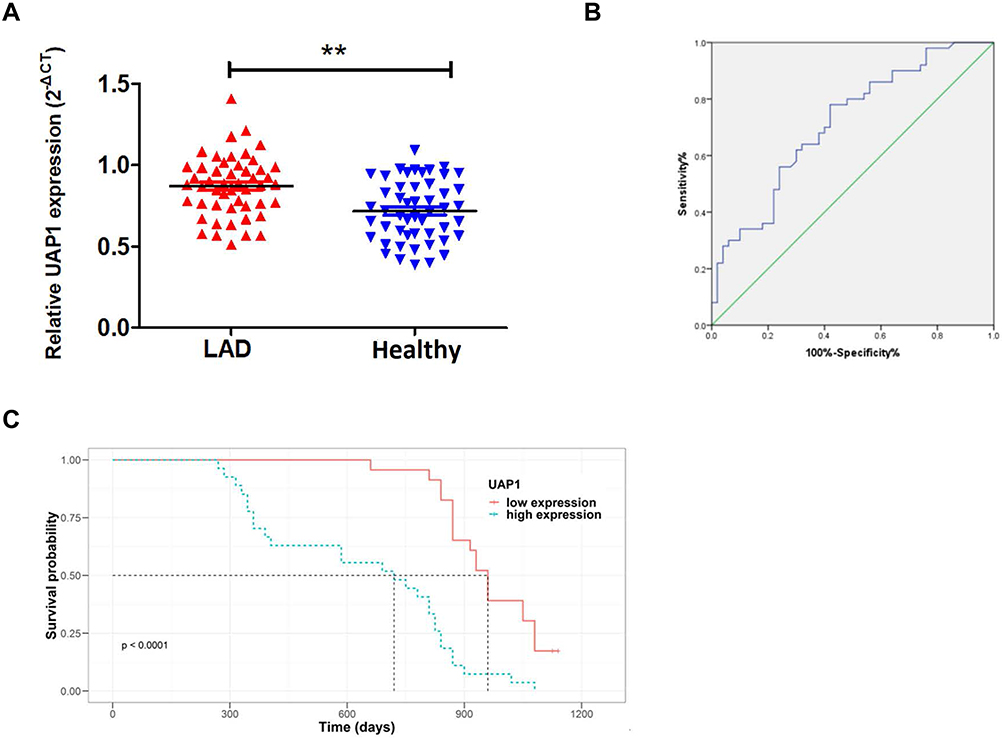 |
Figure 6 High levels of serum UAP1 expression were positively correlated with poor prognosis in LAD patients. (A). UAP1 expression in the plasma of LAD patients (n=50) compared with the plasma of healthy volunteers (n=50) was examined by qRT-PCR, and UAP1 was clearly upregulated in the plasma of LAD patients. (B) The ROC curve analysis of UAP1 for prediction of LAD was performed using healthy volunteers as a control. The cut-off value was 0.765, with a sensitivity of 72% and specificity of 68%, and the AUC was 0.714 (95% confidence interval: 0.614 to 0.813, P≤0.001). (C) Kaplan–Meier survival plots showing that high UAP1 expression levels correlated with worse OS in 50 LAD patients. **P < 0.01. |
High Levels of Serum UAP1 Expression Indicates a Poor Prognosis in LAD Patients
Kaplan–Meier and log-rank analyses were conducted to evaluate the association of UAP1 expression with OS time. Patients with high levels of serum UAP1 expression had shorter OS times than those with low levels (Figure 6C). Furthermore, multivariate analysis revealed that high UAP1 expression in LAD tissues was an independent prognostic predictor for OS in patients with LAD (Table 2).
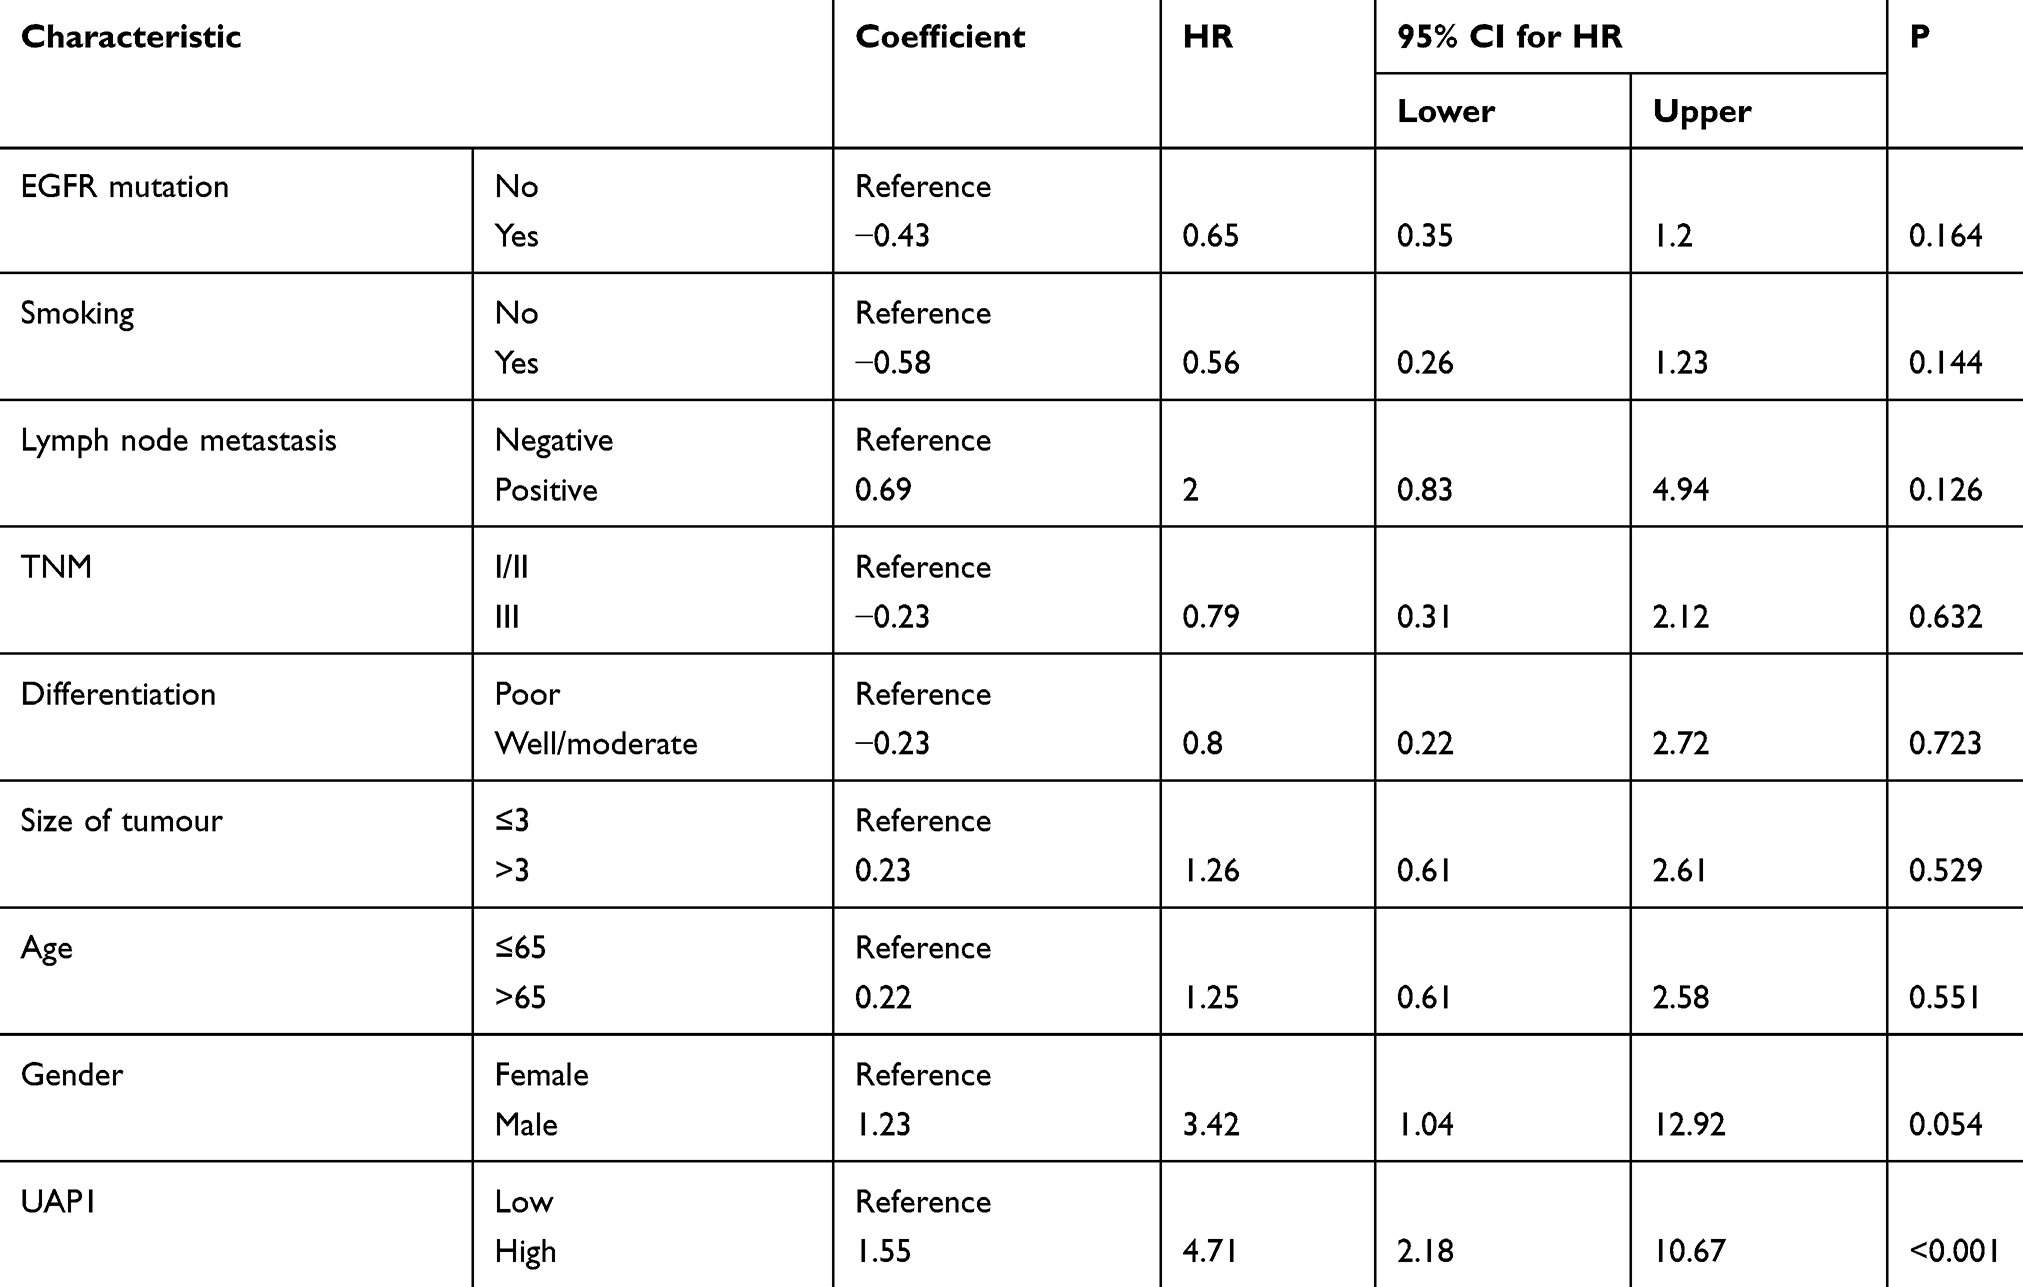 |
Table 2 Univariate and Multivariate Analyses of Clinical Pathological Factors of OS in 50 Patients with LAD |
Discussion
The morbidity and mortality of lung cancer still ranks first among all malignant tumours,13,14 and lung cancer exhibits an extremely high disease burden worldwide. LAD is the main subtype of lung cancer. Despite the diversification of current treatments for LAD, including surgery, chemotherapy, radiation therapy, targeted therapy, immunotherapy and palliative treatment, the 5-year survival rate of LAD has remained very low in recent decades. Therefore, it is of great clinical significance to find new molecular therapeutic targets for LAD and improve the prognosis of patients.
Bioinformatics provides an indispensable advantage in medical research. It integrates and makes full use of the vast data resources currently available. The current study used a variety of online tools to analyse databases. Our previous research using high-throughput sequencing found that UAP1 was highly expressed in LAD tissues.15 The present study used bioinformatics analyses of the GEO and TCGA database data to further verify the high expression level of UAP1 in LAD tissues. Analysis of the clinical data regarding the prognosis revealed that the OS time of LAD patients with high expression of UAP1 was significantly decreased. These results show that UAP1 is a potential tumour-promoting gene of LAD. GO and KEGG pathway analyses found that UAP1 mainly participated in the sugar metabolism and protein metabolism pathway. These results provide a basis for subsequent research on the mechanism of UAP1 in tumours.
HBP activity has been shown to be important for the regulation of glucose metabolism and cell growth.16,17 It is closely linked with sugar, protein, nucleic acid and lipid metabolism. The HBP converts glucose into glutamine-6-phosphate and ultimately generates UDP-N-acetylglucosamine (UDP-GlcNAc).18,19 UDP GlcNAc undergoes O-GlcNAcylation under the action of O-GlcNAc transferase (OGT), which ultimately increases O-GlcNAc in tumour cells. Recent studies found that O-GlcNAc is significantly elevated in breast, colon, and lung cancers and that it promoted the occurrence, invasion, metabolism, and anchoring growth of cancer cells.20,21
UAP1 uses N-acetylglucosamine-1-phosphate and N-acetylgalactosamine-1-phosphate to produce UDP-GlcNAc and UDP-N-acetylgalactosamine (UDP-GalNAc).22,23 Cancer cell lines with high UAP1 expression have higher UDPGlcNAc and UDP-GalNAc content.24 UAP1 regulates the N-linked glycosylation level of cancer cells by affecting the HBP, which promotes the proliferation and migration of cancer cells.25 Our results confirmed that UAP1 was overexpressed in LAD tissues. The UAP1 expression levels were significantly increased in patients with larger tumours compared to patients with smaller tumours and in those with more advanced TNM stages. These data indicate that UAP1 may play an important role in the occurrence and development of LAD. We have identified UAP1 as an oncogene, which is consistent with the results of Itkonen et al.6 Liquid biopsy plays a vital role in precision medicine. Blood samples include various amounts of tumour-derived molecular markers, including exosomes, circulating tumour cells (CTC), circulating tumour DNA (ctDNA), platelets and microRNA.26 Patients readily accept liquid biopsy methods because of their non-invasive nature, and these methods are widely used in clinical practice. The present study is the first study to detect the expression of UAP1 in the blood, and its expression level in the blood of LAD patients was significantly increased compared to that in the blood of healthy volunteers. ROC curve analysis demonstrated that detection of UAP1 in tissues and blood exhibited good sensitivity and specificity as a diagnostic marker for LAD.
In this study, we found that UAP1 was highly expressed in LAD tissues and serum and that the prognosis of LAD patients with high UAP1 expression was poor. UAP1 mainly controls sugar metabolism and protein metabolism pathways, thereby causing tumour progression. Detection of UAP1 in tissues and blood had good efficacy as a diagnostic marker for LAD. Overall, databases may be used to perform large sample analyses to provide foundation for further research on the role of UAP1 in the occurrence and development of LAD.
Data Sharing Statement
The datasets used and/or analysed during the current study are available from the corresponding author on reasonable request.
Ethics Approval and Consent to Participate
The present study was approved by the Research Ethics Committee of the Yijishan Hospital of Wannan Medical College (Wuhu, China). All of the participants provided written informed consent and agreed to the use of their samples for scientific research.
Patient Consent for Publication
All of the participants provided written informed consent and agreed to the use of their samples for scientific research.
Funding
The present study was supported by the financial support from the National Natural Science Foundation of China (grant no. 81572273) and Yijishan Hospital introduces talent Foundation.
Disclosure
All authors declared that they have no conflicts of interest.
References
1. Ferlay J, Shin HR, Bray F, Forman D, Mathers C, Parkin DM. Estimates of worldwide burden of cancer in 2008: GLOBOCAN 2008. Int J Cancer. 2010;127(12):2893–2917. doi:10.1002/ijc.25516
2. Bach PB, Mirkin JN, Oliver TK, et al. Benefits and harms of CT screening for lung cancer: a systematic review. JAMA. 2012;307:2418–2429. doi:10.1001/jama.2012.5521
3. Krzeslak A, Forma E, Bernaciak M, Romanowicz H, Brys M. Gene expression of O-GlcNAc cycling enzymes in human breast cancers. Clin Exp Med. 2012;12:61–65. doi:10.1007/s10238-011-0138-5
4. Lynch TP, Ferrer CM, Jackson SR, Shahriari KS, Vosseller K, Reginato MJ. Critical role of O-Linked beta-N-acetylglucosamine transferase in prostate cancer invasion, angiogenesis, and metastasis. J Biol Chem. 2012;287:11070–11081. doi:10.1074/jbc.M111.302547
5. Mi W, Gu Y, Han C, Liu H, Fan Q, Zhang X. O-GlcNAcylation is a novel regulator of lung and colon cancer malignancy. Biochim Biophys Acta. 2011;1812:514–519. doi:10.1016/j.bbadis.2011.01.009
6. Itkonen HM, Engedal N, Babaie E, et al. UAP1 is overexpressed in prostate cancer and is protective against inhibitors of N-linked glycosylation. Oncogene. 2015;34(28):3744–3750. doi:10.1038/onc.2014.307
7. Travis WD, Brambilla E, Noguchi M, et al. International Association for the Study of Lung Cancer/American Thoracic Society/European Respiratory Society: International multidisciplinary classification of lung adenocarcinoma: executive summary. Proc Am Thorac Soc. 2011;8:
8. Gao J, Aksoy BA, Dogrusoz U, et al. Integrative analysis of complex cancer genomics and clinical profiles using the cBioPortal. Sci Signal. 2013;6(269):pl1. doi:10.1126/scisignal.2004088
9. Vasaikar SV, Straub P, Wang J, Zhang B. LinkedOmics: analyzing multi-omics data within and across 32 cancer types. Nucleic Acids Res. 2018;46(D1):D956–D963. doi:10.1093/nar/gkx1090
10. Huang da W, Sherman BT, Lempicki RA. Systematic and integrative analysis of large gene lists using DAVID bioinformatics resources. Nat Protoc. 2009;4(1):44–57. doi:10.1038/nprot.2008.211
11. Szklarczyk D, Franceschini A, Wyder S, et al. STRING v10: protein-protein interaction networks, integrated over the tree of life. Nucleic Acids Res. 2015;43(Database issue):D447–D452. doi:10.1093/nar/gku1003
12. Livak KJ, Schmittgen TD. Analysis of relative gene expression data using real‑time quantitative PCR and the 2(-Delta Delta C(T)) method. Methods. 2001;25:402–408. doi:10.1006/meth.2001.1262
13. Siegel RL, Miller KD, Jemal A. Cancer statistics, 2019. CA Cancer J Clin. 2019;69(1):7–34.
14. Cancer Genome Atlas Research N. Comprehensive molecular pro-filing of lung adenocarcinoma. Nature. 2014;511:543–550. doi:10.1038/nature13385
15. Wang X, Liu H, Shen K, et al. Long intergenic non‑coding RNA 00467 promotes lung adenocarcinoma proliferation, migration and invasion by binding with EZH2 and repressing HTRA3 expression. Mol Med Rep. 2019;20(1):640–654.
16. Monauni T, Zenti MG, Cretti A, Daniels MC, Targher G, Caruso B. Effects of glucosamine infusion on insulin secretion and insulin action in humans. Diabetes. 2000;49:926–935. doi:10.2337/diabetes.49.6.926
17. Wellen KE, Lu C, Mancuso A, Lemons JM, Ryczko M, Dennis JW. The hexosamine biosynthetic pathway couples growth factor-induced glutamine uptake to glucose metabolism. Genes Dev. 2010;24:2784–2799. doi:10.1101/gad.1985910
18. Slawson C, Copeland RJ, Hart GW. O-GlcNAc signaling: a metabolic link between diabetes and cancer? Trends Biochem Sci. 2010;35:547–555. doi:10.1016/j.tibs.2010.04.005
19. Wellen KE, Thompson CB. A two-way street: reciprocal regulation of metabolism and signalling. Nat Rev Mol Cell Biol. 2012;13:270–276. doi:10.1038/nrm3305
20. Caldwell SA, Jackson SR, Shahriari KS, et al. Nutrient sensor O-GlcNAc transferase regulates breast cancer tumorigenesis through targeting of the oncogenic transcription factor FoxM1. Oncogene. 2010;29(19):2831–2842. doi:10.1038/onc.2010.41
21. Mio T, Yabe T, Arisawa M, Yamada-Okabe H. The eukaryotic UDP-Nacetylglucosamine pyrophosphorylases. Gene cloning, protein expression, and catalytic mechanism. J Biol Chem. 1998;273:14392–14397. doi:10.1074/jbc.273.23.14392
22. Peneff C, Ferrari P, Charrier V, et al. Crystal structures of two human pyrophosphorylase isoforms in complexes with UDPGlc(Gal)NAc: role of the alternatively spliced insert in the enzyme oligomeric assembly and active site architecture. EMBO J. 2001;20:6191–6202. doi:10.1093/emboj/20.22.6191
23. Sreekumar A, Poisson LM, Rajendiran TM, et al. Metabolomic profiles delineate potential role for sarcosine in prostate cancer progression. Nature. 2009;457:910–914. doi:10.1038/nature07762
24. Grassian AR, Coloff JL, Brugge JS. Extracellular matrix regulation of metabolism and implications for tumorigenesis. Cold Spring Harb Symp Quant Biol. 2011;76:313–324. doi:10.1101/sqb.2011.76.010967
25. Chi KR. The tumour trail left in blood. Nature. 2016;532:269–271. doi:10.1038/532269a
26. Qiu X, Zhang J, Shi W, et al. Circulating MicroRNA-26a in plasma and its potential diagnostic value in gastric cancer. PLoS One. 2016;11(3):e0151345. doi:10.1371/journal.pone.0151345
 © 2020 The Author(s). This work is published and licensed by Dove Medical Press Limited. The full terms of this license are available at https://www.dovepress.com/terms.php and incorporate the Creative Commons Attribution - Non Commercial (unported, v3.0) License.
By accessing the work you hereby accept the Terms. Non-commercial uses of the work are permitted without any further permission from Dove Medical Press Limited, provided the work is properly attributed. For permission for commercial use of this work, please see paragraphs 4.2 and 5 of our Terms.
© 2020 The Author(s). This work is published and licensed by Dove Medical Press Limited. The full terms of this license are available at https://www.dovepress.com/terms.php and incorporate the Creative Commons Attribution - Non Commercial (unported, v3.0) License.
By accessing the work you hereby accept the Terms. Non-commercial uses of the work are permitted without any further permission from Dove Medical Press Limited, provided the work is properly attributed. For permission for commercial use of this work, please see paragraphs 4.2 and 5 of our Terms.