")
Back to Journals » International Journal of General Medicine » Volume 14
Exploring the Molecular Mechanism of lncRNA–miRNA–mRNA Networks in Non-Syndromic Cleft Lip with or without Cleft Palate
Authors Wang X, Guo S, Zhou X, Wang Y, Zhang T, Chen R
Received 15 September 2021
Accepted for publication 1 November 2021
Published 16 December 2021 Volume 2021:14 Pages 9931—9943
DOI https://doi.org/10.2147/IJGM.S339504
Checked for plagiarism Yes
Review by Single anonymous peer review
Peer reviewer comments 2
Editor who approved publication: Dr Scott Fraser
Xiangpu Wang, Siyuan Guo, Xinli Zhou, Yupei Wang, Ting Zhang, Renji Chen
Department of Oral and Maxillofacial Plastic and Trauma Surgery, Center of Cleft Lip and Palate Treatment, Beijing Stomatological Hospital, Capital Medical University, Beijing, People’s Republic of China
Correspondence: Renji Chen
Department of Oral and Maxillofacial Plastic and Trauma Surgery, Center of Cleft Lip and Palate Treatment, Beijing Stomatological Hospital, Capital Medical University, Beijing, People’s Republic of China
Fax +86-10-57099151
Email [email protected]
Background: Non-syndromic cleft lip with or without cleft palate (NSCL/P) is a common craniofacial birth defect. Growing evidence has demonstrated the competing endogenous RNA (ceRNA) hypothesis has played a role in the pathogenesis of NSCL/P. Here, we identified the important lncRNAs in NSCL/P and constructed a ceRNA regulatory network to predict their underlying functional mechanism.
Methods: Total RNA isolated from the peripheral blood samples were analyzed by the Human Clariom D Affymetrix platform and differentially expressed genes (DEGs) were identified. Using the limma package in R software, DEGs in the expression profile of GSE42589 were identified from Gene Expression Omnibus (GEO) database. Co-differentially expressed lncRNAs (co-DElncRNAs) were used to predict the microRNAs that may bind to them. Co-differentially expressed mRNAs (co-DEmRNAs) were subjected to Gene Ontology (GO) and Kyoto Encyclopedia of Genes and Genomes (KEGG) pathway enrichment analyses. The hub genes were screened using the cytohubba plug-in in Cytoscape. A ceRNA network was built to investigate the molecular mechanism underlying the etiology of NSCL/P. The expression levels of lncRNAs, miRNAs, and mRNAs in the network were assessed by quantitative real-time polymerase chain reaction (qRT-PCR).
Results: We found 116 DElncRNAs and 2955 DEmRNAs from the GSE42589 dataset, and 2626 DElncRNAs and 2771 DEmRNAs from the Human Clariom D gene chip. A network of co-DEmRNAs containing 3712 edges and 621 nodes were identified by PPI analysis. A ceRNA regulatory network comprising lncRNA USP17L6P, hsa-miR-449c-5p, and MYC was established. qRT-PCR results revealed significantly lower expression levels of lncRNA USP17L6P and c-Myc in NSCL/P tissues, while the expression level of hsa-miR-449c-5p was higher as compared to control samples (p < 0.05).
Conclusion: The identified lncRNAs and the established ceRNA regulatory network provide novel insight into the pathogenesis of NSCL/P, therefore hold great promise in NSCL/P management in clinical practice.
Keywords: lncRNAs, ceRNAs, NSCL/P, bioinformatics
Introduction
Non-syndromic cleft lip with or without cleft palate (NSCL/P) is regarded among the most prevalent neonatal craniofacial defects.1 Affected by factors, including race, geographic location, economic status, etc., the birth prevalence of NSCL/P is estimated at the level of 3.4 to 22.9 per 10,000 births globally, the incidence of which is 1.82/1,000 live births in China.2 Other than impacting patient’s pronunciation, hearing, aesthetics, and systemic health, NSCL/P is associated with a heavy economic burden to the patient’s family and society owing to the huge surgical cost. Previous evidence shows that the etiology of NSCL/P is extremely complex and the key cause of the diseases is the interaction between genetics and the environment during embryonic development.3
Non-coding RNAs (ncRNAs) are described as RNAs that are not translated into protein, including small nuclear RNA (snRNA), transfer RNA (tRNA), microRNA(miRNA), circular RNA (circRNA), PIWI‐interacting RNA, and long non-coding RNA (lncRNA).4 Mature miRNAs inhibit messenger RNAs (mRNAs) and exert negative regulatory effects on gene expression through specific binding to their 3ʹ-UTRs. Mounting evidence has demonstrated the essential roles of miRNAs in numerous biological processes, including embryonic development, cell proliferation, and differentiation.5,6 Some researchers have revealed a close association between abnormal miRNA expression and the pathogenesis of NSCL/P. For instance, miR-106a-5p was found to increase the apoptosis level of palatal mesenchymal cells by regulating the expression of the target gene TGFBR2, and this influenced the occurrence of cleft palate.7 More evidence indicates that miR-374a-5p, miR-4680-3p and miR-133b inhibit the proliferation of palatal mesenchymal cells by regulating the expression of RUNX2, WNT5A, BMP2, MSX1, and other cleft palate-related genes.8
lncRNAs are >200 nt non-coding RNA lacking protein-coding function. lncRNAs can be used as a decoy or sponge to regulate the behavior of miRNAs, thereby regulating the expression of target genes at transcription, post-transcription, and epigenetics levels.9,10 Studies have illustrated the essential roles of differentially expressed lncRNAs in various cellular and pathologic processes related to NSCL/P.11,12 However, comprehensive analyses of NSCL/P-associated lncRNAs and miRNAs in the context of a ceRNA network are relatively scanty. The discovery of the ceRNA regulatory network can enrich our understanding and provide new insights into NSCL/P pathogenesis.
Using the Clariom D Human chip technology, we, herein, identified DEGs in peripheral blood samples from NSCL/P patients and healthy volunteers. DElncRNAs and DEmRNAs between dental pulp stem cells of NSCL/P patients and matched normal dental pulp stem cells were further identified from the gene expression profile of GSE42589 in the GEO database. Through GO enrichment and KEGG pathway analyses, we explored the major biological functions of the co-DEmRNAs. The hub genes related to NSCL/P were screened based on the PPI network and integrated to co-DElncRNA to establish a lncRNA-miRNA-mRNA regulatory network. Last but not least, the expression levels of lncRNAs, miRNAs, and mRNAs were verified in the constructed ceRNA regulatory network through qRT-PCR. The relevant biological functions and signal pathways of mRNAs in the network were explored via single-gene GSEA analysis.
Materials and Methods
Patients Recruitment and Samples Collection
The collection of clinical samples was carried out in accordance with the Declaration of Helsinki. The Ethics Committee of Beijing Stomatological Hospital Affiliated to Capital Medical University (Beijing, China) approved this study, and informed consent was obtained from patients and their families before sampling. A total of 31 subjects, including 16 healthy volunteers and 15 NSCL/P patients who were hospitalized in the Department of Maxillofacial Plastic Trauma surgery, Beijing Stomatological Hospital, Capital Medical University between July 2020 and March 2021, were enrolled in the study. The inclusion criteria of NSCL/P patients include: (1) Patients diagnosed with NSCL/P without congenital malformations of other system organs; (2) patient’s family members without a history of other genetic diseases. Fasting blood samples were collected on the morning of the third day of admission in BD Vacutainer K2EDTA test tubes using a 21-gauge needle. Eleven samples (6 controls and 5 NSCL/P) were used for Human Clariom D microarray analysis, whereas the remaining 20 samples (10 controls and 10 NSCL/P) were used for qRT-PCR. Information of all participants is listed in Table 1.
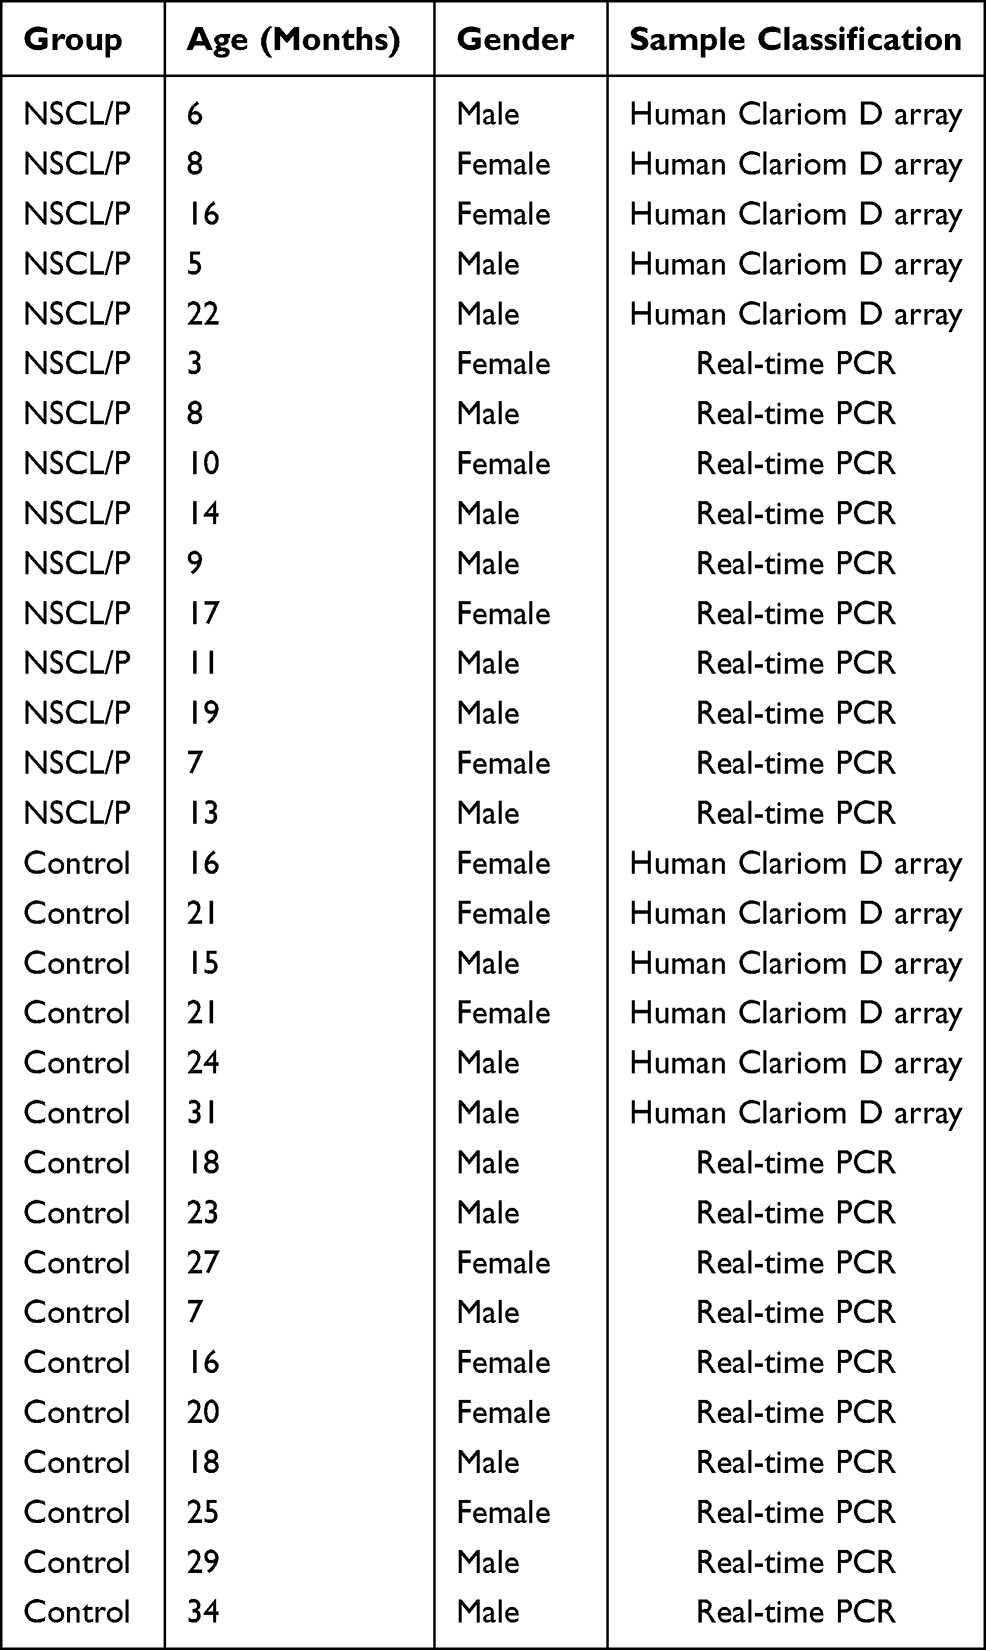 |
Table 1 Information About the Participants |
Microarray Analysis
Total RNA was extracted using the miRNeasy mini kit (Qiagen GmbH, Hilden, Germany) according to the manufacturer’s instructions. Protocols for cRNA preparation, sample hybridization, and scanning followed those provided by Affymetrix using a Cogentech Affymetrix microarray unit (Campus IFOM IEO, Milan, Italy). Samples were hybridized on Human Clariom D (Thermo Fisher Scientific) gene chip. Background-adjustment, normalization, and log-transformation of signals intensity were performed with the Signal Space Transformation-Robust Multi-Array Average algorithm (RMA). Raw data were analyzed by transcriptome analysis console (TAC) 4.0 software (Applied Biosystems, Foster City, CA, USA) awaiting further analysis. Genes with ≥1.5-fold-change (FC) and p <0.05 were considered to be significantly differentially expressed.
Acquisition and Processing of Gene Expression Data in Public Datasets
The gene expression profile of GSE42589 was retrieved from the GEO (https://www.ncbi.nlm.nih.gov/geo) of NCBI. GSE42589, including seven dental pulp stem cell samples of NSCL/P and six, matched normal dental pulp stem cell samples were processed in the GPL6244 platform (Affymetrix Human Gene 1.0 ST Array). Raw CEL files of the microarray from GSE42589 were normalized using RMA in the R affy package. Normalized gene expression levels were presented as log2-transformed values by RMA. DEGs were identified by comparing NSCL/P and normal samples via the R limma package. Genes that met the cutoff criteria, a p-value < 0.05 and a | FC |≥ 1.5, were considered as DEGs.
GO and KEGG Functional Enrichment Analysis of Co-DEmRNAs
GO annotation and KEGG enrichment analyses were performed using R packages (clusterProfiler, enrichplot, and ggplot2) to reveal significant functional genes and biological pathways of co-DEmRNAs. Significantly enriched terms were determined at p-value < 0.05 and q-value < 0.05.
Protein-Protein Interaction (PPI) Network Analysis and Hub Gene Identification
To gain insights into the interactions of co-DEmRNAs, a PPI network was constructed and analyzed using the STRING (https://stringdb.org/) tool to explore the molecular mechanisms underlying NSCL/P (combined score ≥0.4). The hub genes were screened according to the cutoff criteria of degree calculated by cytoHubba in Cytoscape (version 3.8.1).
Construction of the ceRNA Network
To establish the lncRNA-associated ceRNA network in NSCL/P, miRNA-lncRNA interactions were evaluated in the miRcode (http://www.mircode.org/info.php) database. miRDB (version 6.0), miRTarBase (version V.8) and TargetScan (release 7.2) were subsequently employed to retrieve miRNA-targeted mRNAs. The main analysis process of this method is illustrated in Figure 1.
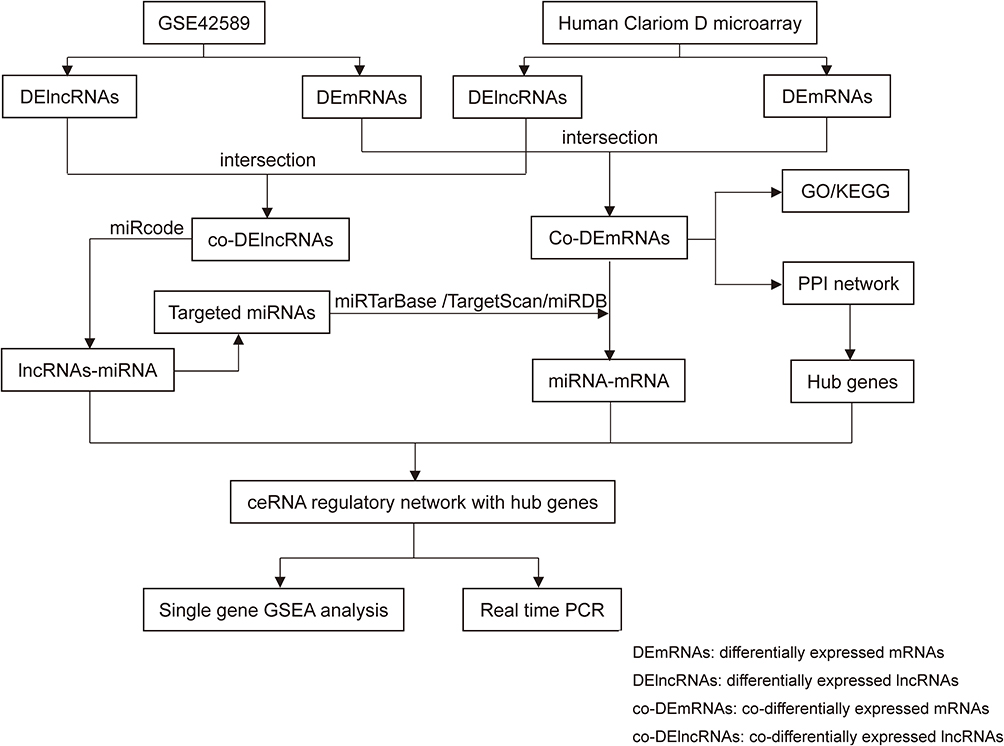 |
Figure 1 Main steps of the construction of the regulatory network in NSCL/P. |
Gene Set Enrichment Analysis (GSEA)
Gene set enrichment analysis (GSEA) of mRNA in the ceRNA regulatory network was performed to investigate the biological pathways related to NSCL/P pathogenesis. GSEA generated an ordered list of all genes based on their correlation with mRNA expression in the ceRNA network. Next, a predefined gene set receives an enrichment score (ES), which is a measure of statistical evidence rejecting the null hypothesis that its members are distributed randomly in the ordered list. mRNA expression level in the ceRNA network was employed as the phenotype label. “Metric for ranking genes” was set to Pearson Correlation, while all other basic and advanced fields were set to default. C5. GO. v7.4 gene sets, C2. CP. KEGG.v7.4 gene sets and Hallmark collections for enrichment analysis were obtained from the Molecular Signatures Database (MSigDB). Of note, 1000 gene set permutations were used for each analysis. Significant gene sets were determined using NOM at p-value < 0.05 and FDR q-value < 0.25.
qRT-PCR Validation
To verify the reliability of the constructed ceRNA regulatory network, we used qRT-PCR to explore the expression levels of lncRNAs, miRNAs, and mRNAs in the ceRNA network in another 20 samples (10 controls and 10 NSCL/P). Total RNA was extracted for each sample and the cDNA template was synthesized using a High-Capacity cDNA Reverse Transcription Kit (Thermo Fisher Scientific, USA) according to the manufacturer’s instructions. The following temperature steps were used for reverse transcription reaction: Incubation for 10 min at 25°C, followed by 120 min at 37°C, and reaction termination by heating at 85°C for 5 min. qRT-PCR was performed on the Light-Cycler96 Sequence Detection system (Roche Diagnostics, Basel, Switzerland) using SYBR® GreenER™ qPCR SuperMix (Thermo Fisher Scientific, USA). All samples were processed in triplicates. Reactions were incubated in a 96-well optical plate at 95°C for 10 min, followed by 40 cycles of 95°C for 10 sec and 60°C for 40 sec. The sequences of the primers used are outlined in Table 2. Relative expression levels were normalized to the expression of U6 mRNA and calculated using the 2-ΔΔCt method. The expression levels of lncRNAs, miRNAs, and mRNAs in normal and NSCL/P specimens were compared by the unpaired Wilcoxon test. P<0.05 denoted a statistically significant difference.
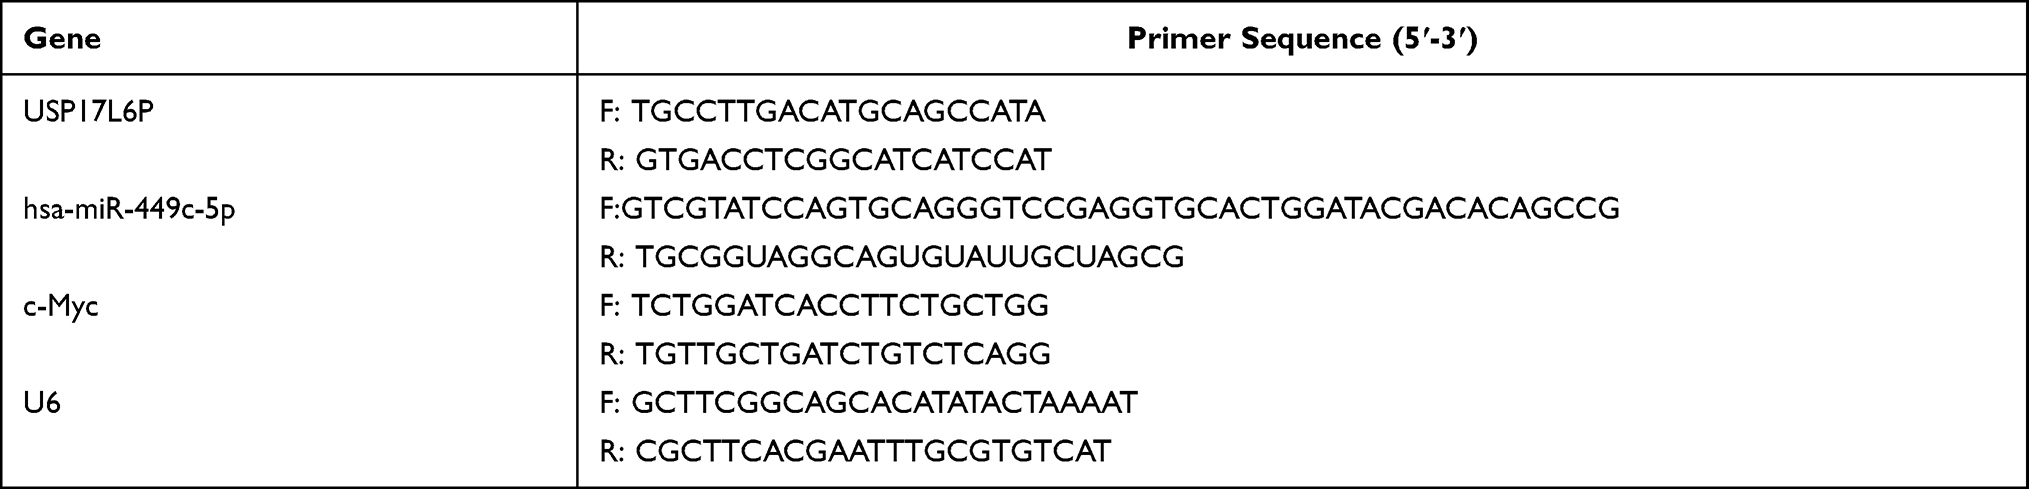 |
Table 2 Oligonucleotide Primers Used for Reverse Transcription-Quantitative Polymerase Chain Reaction Validation of Candidate Noncoding RNAs and mRNAs in the Present Study |
Results
Identification of DEGs in NSCL/P
A total of 116 DElncRNAs (Figure 2A) and 2955 DEmRNAs (Figure 2D) were identified from the GSE42589 dataset based on the screening criteria, p <0.05 and |FC|>1.5. Besides, 2626 DElncRNAs (Figure 2B) and 2771 DEmRNAs (Figure 2E) were identified from the Human Clariom D microarray. After filtering, 10 co-DElncRNAs (Figure 2C) and 622 co-DEmRNAs (Figure 2F) were identified between the GSE42589 dataset and the Human Clariom D microarray.
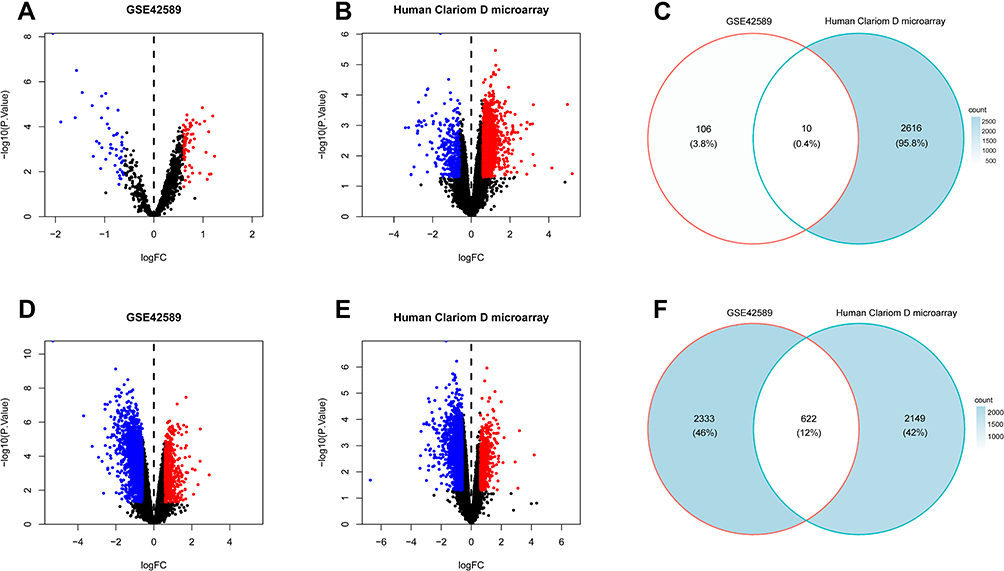 |
Figure 2 DEGs between NSCL/P samples and control samples. (A) Volcano plot for the DElncRNAs in dataset GSE42589. (B) Volcano plot for the DElncRNAs in Human Clariom D microarray. (C) Intersection of Human Clariom D microarray and GSE42589 DElncRNAs. (D) Volcano plot for the DEmRNAs in dataset GSE42589. (E) Volcano plot for the DEmRNAs in Human Clariom D microarray. (F) Intersection of Human Clariom D microarray and GSE42589 DEmRNAs. The x-axis indicates the logFC, and the y-axis indicates the log10 (p-value). The red dots represent upregulated genes, and the blue dots represent downregulated genes. The DEGs were screened on the basis of a |fold change| > 1.5 and p-value of < 0.05. |
Enrichment Analyses of the Co-Differentially Expressed mRNAs
The functions of the co-DEmRNAs were explored via Go and KEGG pathway enrichment analyses of the interacting of 622 co-DEmRNAs from GSE42589 and Human Clariom D microarray using the clusterprofiler package in R (version 3.6.3). GO analysis results demonstrated that the co-DEmRNAs were mainly enriched in BP (Biological Process), including nuclear DNA replication, regulation of DNA replication, regulation of response to DNA damage stimulus, methylation; CC (Cellular Component), including small nucleolar ribonucleoprotein complex, organelle outer membrane, MCM complex, N-terminal protein acetyltransferase complex; MF (Molecular Function), including DNA helicase activity, DNA-dependent ATPase activity, DNA replication origin binding, TFIID-class transcription factor complex binding (Figure 3A). Table 3 shows the top 15 enriched GO terms of the co-DEmRNAs. Detailed result of the GO enrichment analyses is provided in Supplementary Table 1.
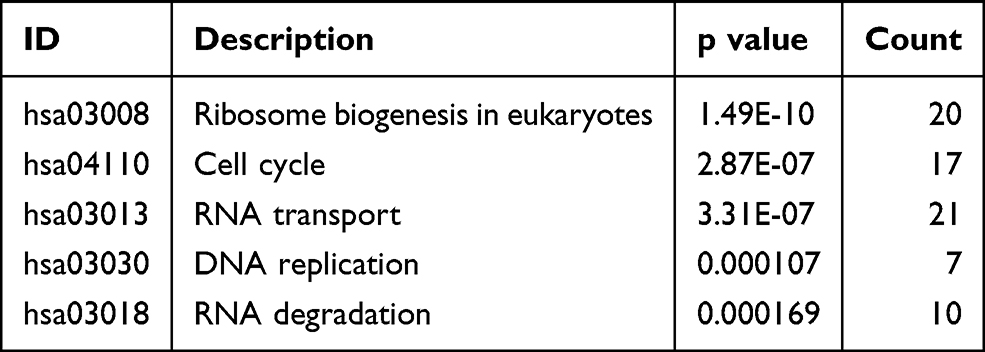 |
Table 3 Top Five Enriched KEGG Pathways of the Co-DEmRNAs |
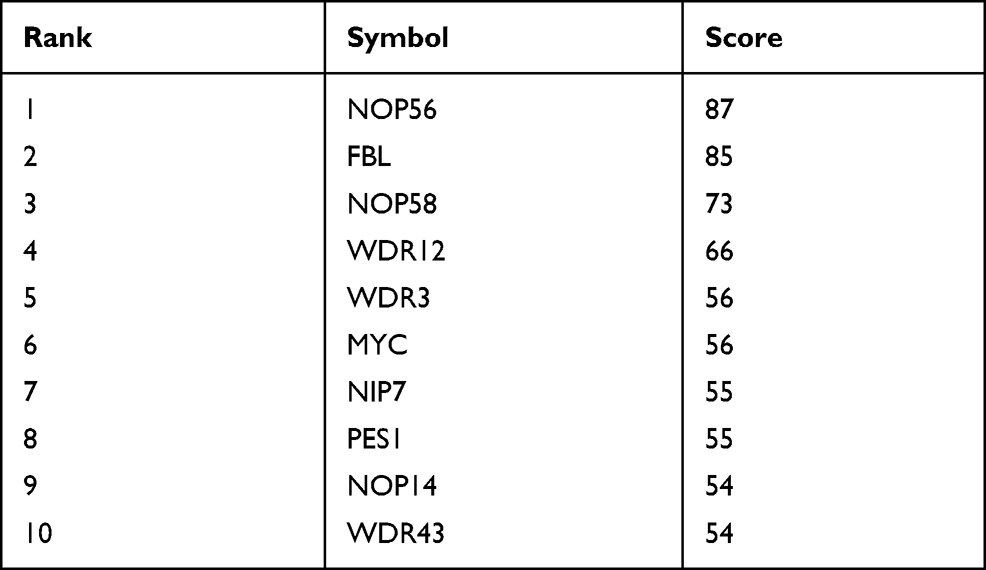 |
Table 4 Top 10 Genes in Network Ranked by Degree Method |
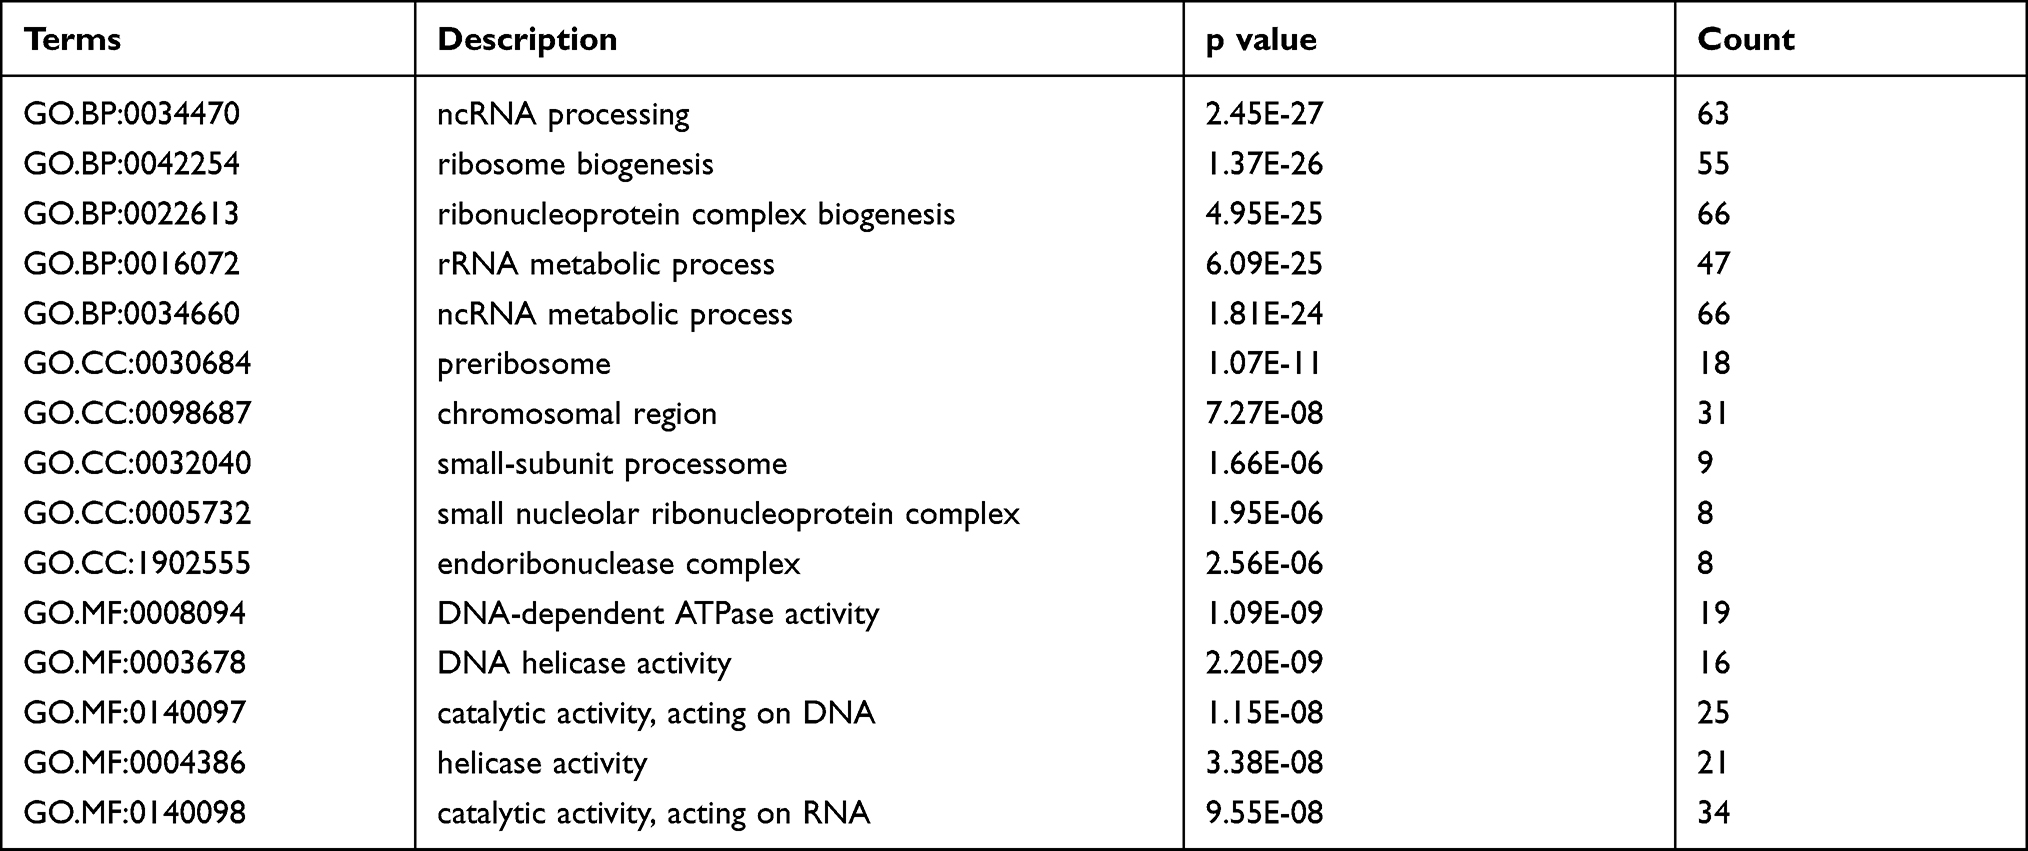 |
Table 5 Top 15 Enriched GO Terms of the Co-DEmRNAs |
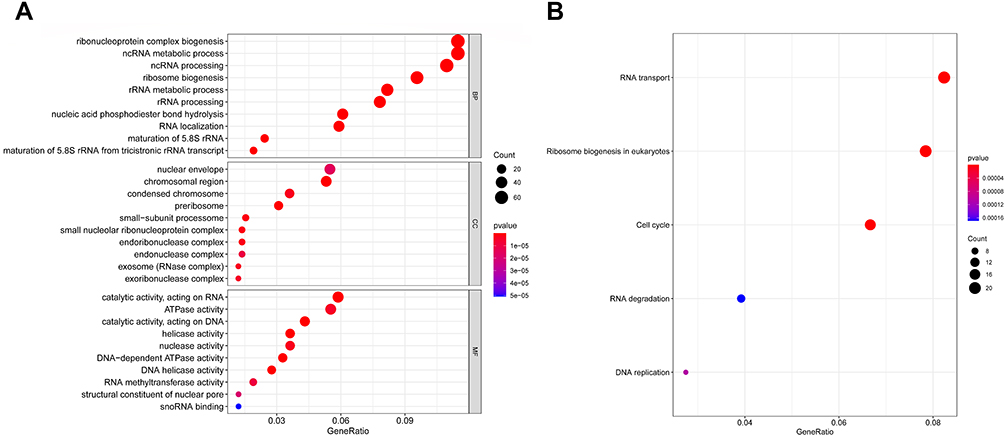 |
Figure 3 (A) Top 10 significant enrichment GO terms of co-DEmRNAs. The sizes of the dots represent the numbers of genes in each GO category. The colored dots represent the term enrichment: blue indicates low enrichment, and red indicates high enrichment. (B) Top five enriched KEGG pathways for the co-DEmRNAs. The y-axis shows the KEGG pathway names. The sizes of the dots represent the numbers of genes. The colored dots represent the term enrichment: blue indicates low enrichment, while red indicates high enrichment. Abbreviations: BP, biological process; CC, cellular component; MF, molecular function. |
KEGG pathway analysis results revealed that the co-DEmRNAs were significantly enriched in ribosome biogenesis in eukaryotes, cell cycle, RNA transport, DNA replication, RNA degradation (Figure 3B). Table 4 shows these five enriched KEGG pathways of the co-DEmRNAs.
Identification of Hub Genes in PPI Network and Construction of the ceRNA Regulatory Network in NSCL/P
To explore the interaction among the 622 co-DEmRNAs, the PPI network was established with a cutoff score of ≥0.4 using the logical data retrieved from the STRING database, https://stringdb.org/ (Figure 4A). With degree as the criterion, the top 100 linked co-DEmRNAs were identified (Figure 4B). The network comprised 100 nodes and 1338 edges, with an average local clustering coefficient of 0.606. As demonstrated in Figure 4B, the top 10 genes with a high-ranking degree are labeled in purple; they are associated with much larger circles All the edges were distinguished based on connection score.
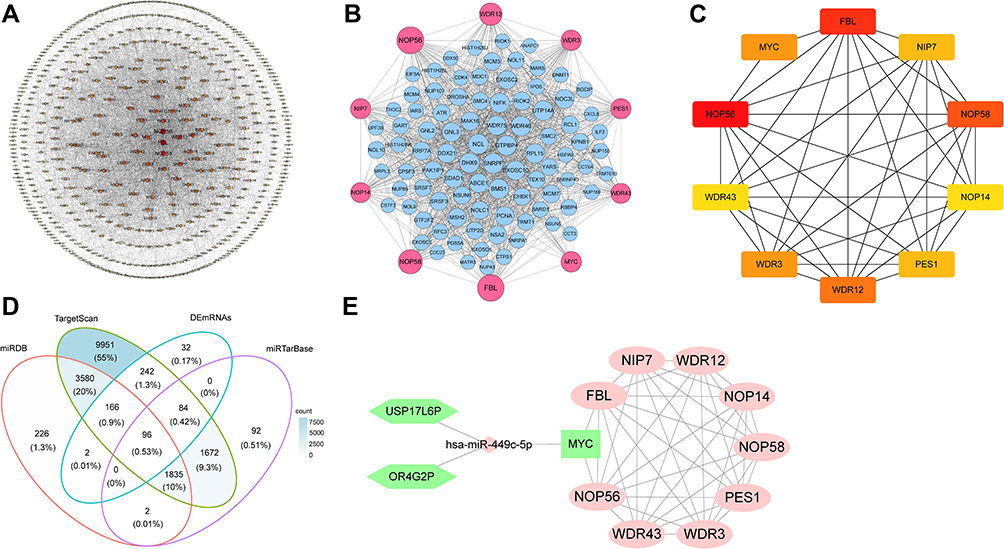 |
Figure 4 (A) The PPI networks of co-DEmRNAs. This network includes 3712 edges and 621 nodes. The circles represent genes, and the lines represent interactions between the proteins encoded by the genes. (B) The PPI networks of top 100 co-DEmRNAs. All the circles are proteins encoded by top 100 co-DEmRNAs. The red colors represent the 10 highest degree genes and the circles with blue represent the remaining genes. (C) Screening of hub genes. The hub genes were identified by filtering according to the criterion of degrees >10 criteria using the cytoHubba plugin in Cytoscape software. The lines represent interactions between the proteins encoded by the genes. 10 nodes and 38 edges were involved. (D) Venn diagram showing the number of distinct and overlapping RNAs among the co-DEmRNAs and the RNAs identified with Targetscan, miRDB, and miRTarBase. The overlapping areas show the co-DEmRNAs identified by three online tools. (E) Interaction of RNAs in the USP17L6P and OR4G2P-associated ceRNA network. The hexagon nodes and diamond node represent the lncRNAs and miRNA, respectively. The rectangle nodes represent miR-449c-5p targeted mRNAs. The ellipse nodes are the top 10 hub co-DEmRNAs in the network. The up and downregulated genes are colored in red and green, respectively. |
In a network, hub genes (highly connected genes) are expected to be crucial in understanding the biological mechanism of response under stresses/conditions. In the present study, the top 10 hub proteins included NOP56, FBL, NOP58, WDR12, MYC, WDR3, NIP7, PES1, NOP14, WDR43. The hub genes were identified by filtering according to the criterion of degrees >10 criteria (each node had more than 10 interactions) using the cytoHubba plugin in Cytoscape software (version 3.8.1), considering the top 10 closely related interactions (Figure 4C and Table 5); 10 nodes and 38 edges were involved.
We searched the miRcode database for miRNAs with the ability to bind to co-DElncRNAs. The targeted mRNAs of these miRNAs were predicted by TargetScan, starBase, and miRDB databases. Meanwhile, the core genes of co-DEmRNAs were screened by cytohubba plug-in in Cytoscape. The ceRNA regulatory network was constructed based on co-expressed lncRNA/miRNA, miRNA/mRNA, lncRNA/mRNA. Overlapping datasets are shown in Figure 4D. The ceRNA regulatory network comprised two lncRNAs (USP17L6P, OR4G2P), one miRNA (hsa-miR-449c-5p), and one mRNA (MYC proto-oncogene, MYC) (Figure 4E). A comprehensive analysis of the relationships among USP17L6P, OR4G2P, hsa-miR-449c-5p, and MYC and the top 10 downstream connected genes is illustrated in Figure 4E.
GSEA of the Biological Function of MYC and Its Related Signaling Pathways in NSCL/P
The potential molecular functions and related signaling pathways of MYC in NSCL/P were explored by single gene GSEA analysis. Results showed that, of the 186 signaling pathways, 129 were upregulated. Nine signaling pathways were significantly enriched at NOM p < 0.05 and FDR q-value < 0.25. The items “O glycan biosynthesis”, “pentose phosphate pathway”, “Tryptophan metabolism”, “Arginine and proline metabolism”, were associated with epithelial-mesenchymal transition (EMT) and significantly enriched in the positive correlation group of MYC expression (Figure 5). In addition, the items “TNFA signaling via NF-κB”, “epithelial-mesenchymal transition”, “MTORC1 signaling”, “Apoptosis”, “P53 pathway”, “IL6-JAK-STAT3 signaling” were significantly enriched in the positive correlation group of MYC expression for HALLMARK gene sets (Figure 6). Finally, the items “cellular response to retinoic acid”, “mesenchymal cell proliferation”, “mesenchymal epithelial cell signaling”, “regulation of BMP signaling pathway”, “response to BMP” and other biological functions were significantly enriched in the positive correlation group of MYC expression for GO gene sets (Figure 7). Detailed results of the GSEA enrichment analyses are provided in Supplementary Tables 2–4.
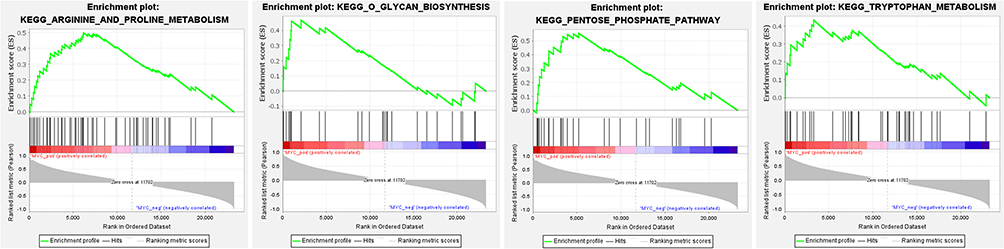 |
Figure 5 Enrichment plots from gene set enrichment analysis (GSEA). The GSEA results revealed that genes involved in O glycan biosynthesis, pentose phosphate pathway, Tryptophan metabolism, Arginine, and proline metabolism were differentially enriched in the positive correlation group of MYC expression. |
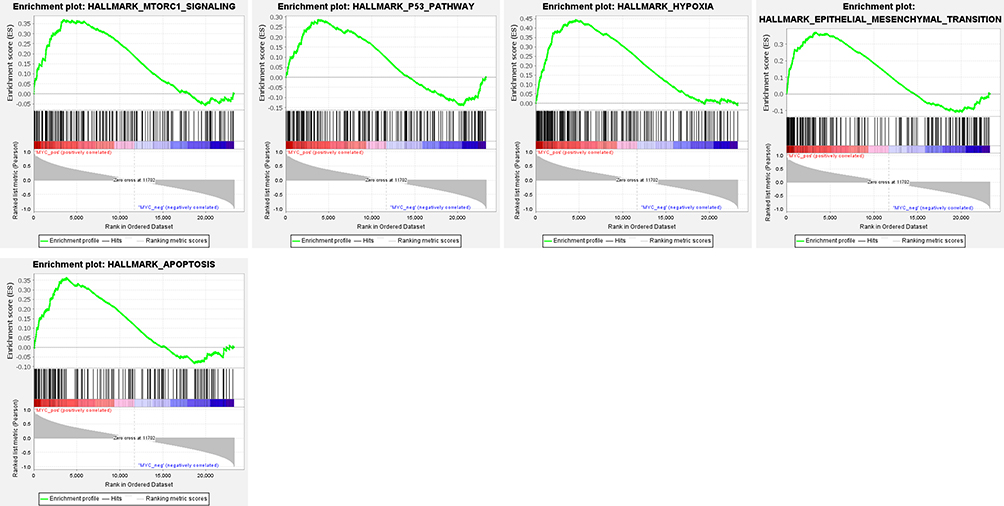 |
Figure 6 GSEA identified that five gene sets were significantly enriched including mtorc1 signaling, P53 pathway, hypoxia, epithelial mesenchymal transition, apoptosis. |
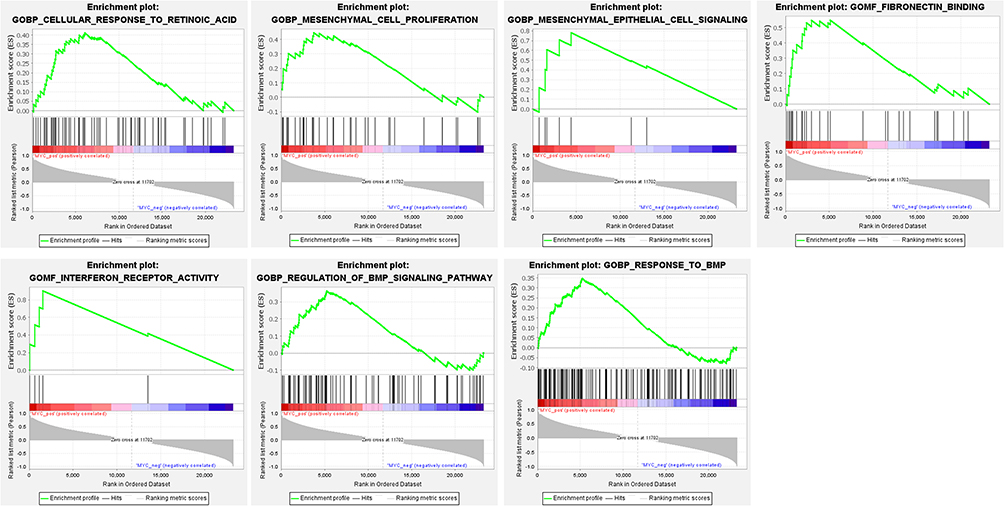 |
Figure 7 GSEA results for c-Myc in NSCL/P patients. Seven high-scoring sets, including cellular response to retinoic acid, mesenchymal cell proliferation, mesenchymal epithelial cell signaling, fibronectin binding, interferon receptor activity, regulation of BMP signaling pathway, response to BMP, are identified by GSEA analysis. |
qRT-PCR Validation of the ceRNA Regulatory Network
To verify the accuracy of the lncRNA-miRNA-mRNA regulatory network, the expression levels of lncRNA USP17L6P, hsa-miR-449c-5p, and MYC were further explored by qRT-PCR with another 20 samples (10 controls, 10 NSCL/P). Results revealed significantly lower expression levels of USP17L6P and MYC in NSCL/P samples than the control group, whereas the expression level of has-miR-449c-5p was higher in NSCL/P samples as compared to normal samples (Figure 8, p <0.05).
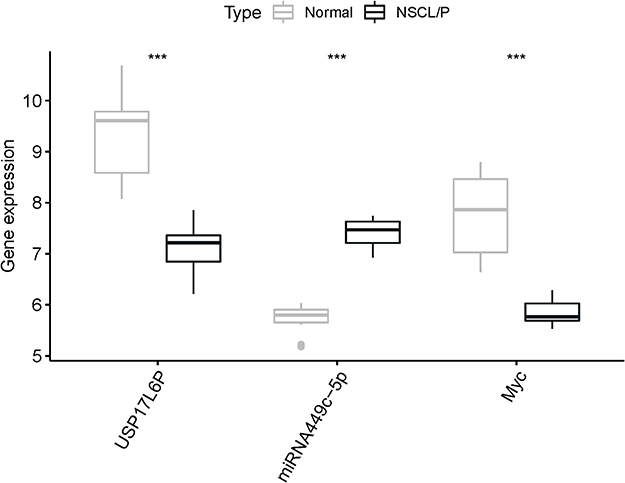 |
Figure 8 Relative expression levels of USP17L6P, miR449c-5p, c-Myc in NSCL/P and control samples. The transcript levels of USP17L6P, miR-449c-5p, and c-Myc were determined by qRT-PCR and normalized to those of the reference RNA U6. ***p < 0.001 was considered statistically significant. |
Discussion
Studies have demonstrated a close association of orofacial morphogenesis with the strict regulation of biological behaviors, including cell proliferation, apoptosis, migration, and differentiation.13–15 In this view, it is speculated that the imbalance of genes or signaling pathways coordinating these processes are key players in the pathogenesis of NSCL/P. Identification of these regulatory genes and exploring their regulatory role via signaling pathways will enrich our understanding of the molecular mechanism of NSCL/P and guide the development of more efficient prevention strategies.
Several lines of evidence have shown that non-coding RNAs, including lncRNAs, miRNAs, and circRNAs play critical functions in physiological development and pathological process.16–18 Although some researchers have affirmed the functional relevance of several miRNAs and lncRNAs in NSCL/P,19,20 studies on the relationship between ceRNA regulatory network based on lncRNA and NSCL/P remain immature. In the present study, the Human Clariom D assay was employed to identify DElncRNAs and DEmRNAs from the peripheral blood of NSCL/P patients, while DElncRNAs and DEmRNAs were identified in the GSE42589 dataset of the GEO database. The potential functions of co-differentially expressed lncRNAs and mRNAs were predicted through bioinformatics analysis. According to the ceRNA theory, a lncRNA-miRNA-mRNA regulatory network was established to explore the potential regulatory mechanisms of ncRNAs and mRNAs in NSCL/P.
We have strongly demonstrated the potential regulatory role of lncRNA USP17L6P in the pathological progress of NSCLP by competitively binding to miR-449c-5p, which impacts the expression of the downstream target gene, MYC. Ubiquitination is a crucial mechanism of cell cycle regulation. Studies show that cyclins and cyclin-dependent kinase inhibitors (CDKI) require ubiquitination modification.21 There is evidence on the role of ubiquitination modification in cell apoptosis, protein degradation, cell cycle control, transcription regulation, tumorigenesis, and intracellular signal transduction.22 Yang et al in their work, integrated and analyzed two genome-wide association studies (GWAS) datasets and expression quantitative trait loci (eQTL) datasets. They demonstrated that NSCL/P development could be regulated by genes related to ubiquitin-mediated proteolysis and DNA synthesis, and the fatty acid metabolism pathway.23 Deubiquitination, described as the removal of ubiquitin from the protein substrate bound by ubiquitin, is mediated by several deubiquitinating enzymes (DUBs), including ubiquitin-specific processing protease (USP).24 USP17L6P belongs to a subfamily of cytokine-inducible DUBs. Reports from previous investigations indicate that USP17 subfamily proteins influence cell proliferation by regulating the activity of the GTPase CAAX-box processing enzyme Ras-converting enzyme 1 (RCE1).25 The hyaluronan and/or RNA binding domains contained in USP17 subfamily proteins may also contribute to cell cycle regulation.26 More evidence indicates that USP17 subfamily proteins may regulate EMT of various cells by acting on Snail1, Snail2, and Twist1.27
MiR-449c-5p is one subtype of the mature miR-449, located in the reverse strand of chromosome 5q11.2. Studies have demonstrated the regulatory role of miR-449c in various biological processes by inhibiting specific mRNA at the posttranscriptional level. For instance, miR-449c was found to inhibit the proliferation and invasion of NCI-H23 and NCI-H838 cells by targeting c-Myc and exert a regulatory effect on the development of non-small cell lung cancer (NSCLC).28 Gastric cancer (GC) investigation revealed that miR-449c directly regulates the 6-phosphofructo-2-kinase (PFKFB3) expression in GC cells and blocks the migration and invasion of SGC-7901 cells, events which regulated the pathological progression of GC.29 In the present work, qPCR analysis of clinical samples showed that miR-449c-5p expression was higher in NSCL/P samples compared to the control samples. The precise posttranscriptional mechanisms of miR-449c-5p in NSCL/P remain to be determined.
The main members of the MYC proto-oncogene family include c-Myc, N-Myc, and L-Myc. Myc proteins are bHLHZ transcription factors and have been reported to regulate genes related to growth and proliferation of Multiple cells.30 The multifunctional transcription factor encoded by the c-myc proto-oncogene plays a regulatory role in a series of cell cycle processes, including proliferation, differentiation, and apoptosis of various cells.31 Emerging evidence indicates that c-Myc is one of the downstream transcription factors regulated by TGF-β, and an E-cadherin transcription activator.32,33 Microtubule disruption has been shown to trigger aberrant expression of Snail, Zeb, and c-MYC by blocking the TGF-β/SMAD2 signaling pathway, which consequently leads to the failure of EMT.34 Elsewhere, a study confirmed that rs4791774 in NTN1 could regulate c-Myc transcription and contributed to the etiology of non-syndromic cleft lip only (NSCLO).35 Numerous reports have further confirmed the close association between the 8q24 chromosome region (where the c-Myc gene is located) and NSCLP, which can be ascribed to the variants of the tissue-specific enhancer of c-Myc or other genes.36–38 Here, qPCR analysis of clinical samples showed significantly lower expression of c-myc in the NSCL/P group as compared to that, of the control group.
The molecular function and potential mechanism of c-Myc in NSCL/P were explored by categorizing the specimens into c-Myc positive correlation group and c-Myc negative correlation group according to the correlation between other genes and c-Myc expression. Further analysis was performed by the GSEA software. Regarding the C2 set defined by MSigDB, the analysis demonstrated that the items, “O glycan biosynthesis”, “pentose phosphate pathway”, “Tryptophan metabolism”, “Arginine, and proline metabolism”, were significantly enriched in the c-Myc positive correlation group. Previous evidence has demonstrated the relationship between these pathways and the occurrence of NSCL/P or EMT of multiple cells.39–42 On the other hand, the items, “cellular response to retinoic acid”, “mesenchymal cell proliferation”, “response to BMP”, “regulation of BMP signaling pathway”, and “mesenchymal epithelial cell signaling” were enriched in the GO gene sets of the c-Myc positive correlation group. As far as we know, the pathological mechanism of NSCL/P involves a variety of cellular behaviors and molecular events, including EMT, apoptosis, cell migration, and proliferation. As such, any behavior that influences the above processes may induce the occurrence of NSCL/P. A wealth of studies have also confirmed the association between the occurrence of NSCL/P and the regulation of the cell cycle, DNA damage repair response, and oxidative stress-initiating environmental factors.43–45 In this view, it is imperative to explore the relevant regulatory genes to understand the pathogenesis of NSCL/P.
As an important link connecting all organs in the human body, peripheral blood is rich in RNA, DNA, microvesicles and other biological components, which can effectively aid clinicians diagnose and identify various diseases.46,47 In addition, the acquisition of peripheral blood samples is more convenient and less invasive than other tissues. Although the pathogenesis of NSCL/P is closely related to various factors in embryonic development, some studies have confirmed that a number of these differences persist after birth.48,49 This study preliminarily analyzed the peripheral blood samples of NSCL/P patients through Human Clariom D platform technology, and further combined with the relevant data of NSCL/P patients in GEO database to explore the possible regulatory network of NSCL/P, which provides a reference for further enriching the pathogenesis of NSCL/P, and provides a certain research basis for clinicians to perform NSCL/P gene therapy in the future.
Using the Affymetrix Clariom D array, the transcriptome profile of NSCL/P patients was revealed, including mRNAs, lncRNAs, and precursor miRNAs. A combination of the transcriptome profile findings with the GSE42589 chip results in the GEO database allowed for exploration of the biological functions and related signal pathways of common differential genes. A ceRNA regulatory network was then constructed based on this analysis. Last but not least, the expression levels of related genes in the constructed ceRNA network were verified by qRT-PCR.
Conclusions
A potential mechanism by which lncRNA USP17L6P competes with miR-449c-5p to regulate c-Myc expression is demonstrated. According to qRT-PCR analysis, the expression of USP17L6P and c-Myc in NSCL/P tissues were significantly down-regulated, while the expression of miR-449c-5p was significantly upregulated as compared to the control group. Combined with the above comprehensive analysis of the ceRNA regulatory network, this work reveals some new key features of NSCL/P. The findings provide new insights into NSCL/P pathogenesis and may guide potential diagnosis and treatment strategies in clinical practice.
Data Sharing Statement
The publical dataset generated and analyzed in this study is available in the National Center for Biotechnology Information’s (NCBI) Gene Expression Omnibus (GEO, https://www.ncbi.nlm.nih.gov/geo/). The dataset of Affymetrix Clariom D array used and analyzed during the current study is available from the corresponding author on reasonable request.
Author Contributions
All authors made substantial contributions to conception and design, acquisition of data, or analysis and interpretation of data; took part in drafting the article or revising it critically for important intellectual content; agreed to submit to the current journal; gave final approval of the version to be published; and agree to be accountable for all aspects of the work.
Funding
This work was supported by Beijing Municipal Administration of Hospitals Clinical Medicine Development of Special (XMLX201714), Beijing Natural Science (7212046), Discipline Construction Fund of Beijing Stomatological Hospital Affiliated to Capital Medical University (19-09-24), and National Natural Science Foundation of China (81771909).
Disclosure
The authors have declared that no competing interest exists.
References
1. Young JI, Slifer S, Hecht JT, Blanton SH. DNA methylation variation is identified in monozygotic twins discordant for non-syndromic cleft lip and palate. Front Cell Dev Biol. 2021;9:656865. doi:10.3389/fcell.2021.656865
2. Mossey PA, Little J, Munger RG, Dixon MJ, Shaw WC. Cleft lip and palate. Lancet. 2009;374(9703):1773–1785. doi:10.1016/S0140-6736(09)60695-4
3. Ludwig KU, Ahmed ST, Bohmer AC, et al. Meta-analysis reveals genome-wide significance at 15q13 for nonsyndromic clefting of both the lip and the palate, and functional analyses implicate GREM1 as a plausible causative gene. PLoS Genet. 2016;12(3):e1005914. doi:10.1371/journal.pgen.1005914
4. Gluud M, Willerslev-Olsen A, Gjerdrum L, et al. MicroRNAs in the pathogenesis, diagnosis, prognosis and targeted treatment of cutaneous T-cell lymphomas. Cancers (Basel). 2020;12(5). doi:10.3390/cancers12051229
5. Tran AT, Chapman EM, Flamand MN, et al. MiR-35 buffers apoptosis thresholds in the C. elegans germline by antagonizing both MAPK and core apoptosis pathways. Cell Death Differ. 2019;26(12):2637–2651. doi:10.1038/s41418-019-0325-6
6. Li W, Zhou J, Zhang Y, et al. Echinacoside exerts anti-tumor activity via the miR-503-3p/TGF-beta1/Smad aixs in liver cancer. Cancer Cell Int. 2021;21(1):304. doi:10.1186/s12935-021-01890-3
7. Zhang W, Shen Z, Xing Y, et al. MiR-106a-5p modulates apoptosis and metabonomics changes by TGF-beta/Smad signaling pathway in cleft palate. Exp Cell Res. 2020;386(2):111734. doi:10.1016/j.yexcr.2019.111734
8. Suzuki A, Li A, Gajera M, et al. MicroRNA-374a, −4680, and −133b suppress cell proliferation through the regulation of genes associated with human cleft palate in cultured human palate cells. BMC Med Genomics. 2019;12(1):93. doi:10.1186/s12920-019-0546-z
9. Zhao C, Qiu Y, Zhou S, Liu S, Zhang W, Niu Y. Graph embedding ensemble methods based on the heterogeneous network for lncRNA-miRNA interaction prediction. BMC Genomics. 2020;21(Suppl 13):867. doi:10.1186/s12864-020-07238-x
10. Gong J, Liu W, Zhang J, Miao X, Guo AY. lncRNASNP: a database of SNPs in lncRNAs and their potential functions in human and mouse. Nucleic Acids Res. 2015;43(Databaseissue):D181–6. doi:10.1093/nar/gku1000
11. Yun L, Ma L, Wang M, et al. Rs2262251 in lncRNA RP11-462G12.2 is associated with nonsyndromic cleft lip with/without cleft palate. Hum Mutat. 2019;40(11):2057–2067. doi:10.1002/humu.23859
12. Gao L, Liu Y, Wen Y, LncRNA WW. H19-mediated mouse cleft palate induced by all-trans retinoic acid. Hum Exp Toxicol. 2017;36(4):395–401. doi:10.1177/0960327116651121
13. Li H, Jones KL, Hooper JE, Williams T. The molecular anatomy of mammalian upper lip and primary palate fusion at single cell resolution. Development. 2019;146(12). doi:10.1242/dev.174888
14. Yu W, Serrano M, Miguel SS, Ruest LB, Svoboda KK. Cleft lip and palate genetics and application in early embryological development. Indian J Plast Surg. 2009;42 Suppl:S35–50. doi:10.4103/0970-0358.57185
15. Greene RM, Pisano MM. Palate morphogenesis: current understanding and future directions. Birth Defects Res C Embryo Today. 2010;90(2):133–154. doi:10.1002/bdrc.20180
16. Du M, Yuan L, Tan X, et al. The LPS-inducible lncRNA Mirt2 is a negative regulator of inflammation. Nat Commun. 2017;8(1):2049. doi:10.1038/s41467-017-02229-1
17. Schoen C, Aschrafi A, Thonissen M, Poelmans G, Von den Hoff JW, Carels C. MicroRNAs in palatogenesis and cleft palate. Front Physiol. 2017;8:165. doi:10.3389/fphys.2017.00165
18. Yang Y, Yujiao W, Fang W, et al. The roles of miRNA, lncRNA and circRNA in the development of osteoporosis. Biol Res. 2020;53(1):40. doi:10.1186/s40659-020-00309-z
19. Schoen C, Glennon JC, Abghari S, et al. Differential microRNA expression in cultured palatal fibroblasts from infants with cleft palate and controls. Eur J Orthod. 2018;40(1):90–96. doi:10.1093/ejo/cjx034
20. Gao LY, Hao XL, Zhang L, Wan T, Liu JY, Cao J. Identification and characterization of differentially expressed lncRNA in 2,3,7,8-tetrachlorodibenzo-p-dioxin-induced cleft palate. Hum Exp Toxicol. 2020;39(5):748–761. doi:10.1177/0960327119899996
21. Wickliffe K, Williamson A, Jin L, Rape M. The multiple layers of ubiquitin-dependent cell cycle control. Chem Rev. 2009;109(4):1537–1548. doi:10.1021/cr800414e
22. Komander D, Clague MJ, Urbe S. Breaking the chains: structure and function of the deubiquitinases. Nat Rev Mol Cell Biol. 2009;10(8):550–563. doi:10.1038/nrm2731
23. Yang J, Yu X, Zhu G, et al. Integrating GWAS and eQTL to predict genes and pathways for non-syndromic cleft lip with or without palate. Oral Dis. 2020. doi:10.1111/odi.13699
24. Amerik AY, Hochstrasser M. Mechanism and function of deubiquitinating enzymes. Biochim Biophys Acta. 2004;1695(1–3):189–207. doi:10.1016/j.bbamcr.2004.10.003
25. McFarlane C, Kelvin AA, de la Vega M, et al. The deubiquitinating enzyme USP17 is highly expressed in tumor biopsies, is cell cycle regulated, and is required for G1-S progression. Cancer Res. 2010;70(8):3329–3339. doi:10.1158/0008-5472.CAN-09-4152
26. Shin JM, Yoo KJ, Kim MS, Kim D, Baek KH. Hyaluronan- and RNA-binding deubiquitinating enzymes of USP17 family members associated with cell viability. BMC Genomics. 2006;7:292. doi:10.1186/1471-2164-7-292
27. Lambies G, Garcia DHA, Diaz VM. The role of DUBs in the post-translational control of cell migration. Essays Biochem. 2019;63(5):579–594. doi:10.1042/EBC20190022
28. Miao LJ, Huang SF, Sun ZT, et al. MiR-449c targets c-Myc and inhibits NSCLC cell progression. FEBS Lett. 2013;587(9):1359–1365. doi:10.1016/j.febslet.2013.03.006
29. Chen X, Wang A, Yue X. miR-449c inhibits migration and invasion of gastric cancer cells by targeting PFKFB3. Oncol Lett. 2018;16(1):417–424. doi:10.3892/ol.2018.8609
30. Dang CV. MYC on the path to cancer. Cell. 2012;149(1):22–35. doi:10.1016/j.cell.2012.03.003
31. Amendola D, De Salvo M, Marchese R, et al. Myc down-regulation affects cyclin D1/cdk4 activity and induces apoptosis via Smac/Diablo pathway in an astrocytoma cell line. Cell Prolif. 2009;42(1):94–109. doi:10.1111/j.1365-2184.2008.00576.x
32. Pietenpol JA, Holt JT, Stein RW, Moses HL. Transforming growth factor beta 1 suppression of c-myc gene transcription: role in inhibition of keratinocyte proliferation. Proc Natl Acad Sci U S A. 1990;87(10):3758–3762. doi:10.1073/pnas.87.10.3758
33. Liu L, Guo X, Rao JN, et al. Polyamines regulate E-cadherin transcription through c-Myc modulating intestinal epithelial barrier function. Am J Physiol Cell Physiol. 2009;296(4):C801–10. doi:10.1152/ajpcell.00620.2008
34. Kitase Y, Shuler CF. Microtubule disassembly prevents palatal fusion and alters regulation of the E-cadherin/catenin complex. Int J Dev Biol. 2013;57(1):55–60. doi:10.1387/ijdb.120117yk
35. Jiang S, Shi JY, Lin YS, et al. NTN1 gene was risk to non-syndromic cleft lip only among Han Chinese population. Oral Dis. 2019;25(2):535–542. doi:10.1111/odi.13009
36. Salagovic J, Klimcakova L, Zabavnikova M, et al. Polymorphisms at 1q32, 8q24, and 17q22 loci are associated with nonsyndromic cleft lip with or without cleft palate risk in the Slovak population. Biomed Pap Med Fac Univ Palacky Olomouc Czech Repub. 2017;161(2):152–157. doi:10.5507/bp.2017.009
37. Birnbaum S, Ludwig KU, Reutter H, et al. Key susceptibility locus for nonsyndromic cleft lip with or without cleft palate on chromosome 8q24. Nat Genet. 2009;41(4):473–477. doi:10.1038/ng.333
38. Grant SF, Wang K, Zhang H, et al. A genome-wide association study identifies a locus for nonsyndromic cleft lip with or without cleft palate on 8q24. J Pediatr. 2009;155(6):909–913. doi:10.1016/j.jpeds.2009.06.020
39. Carvalho-Cruz P, Alisson-Silva F, Todeschini AR, Dias WB. Cellular glycosylation senses metabolic changes and modulates cell plasticity during epithelial to mesenchymal transition. Dev Dyn. 2018;247(3):481–491. doi:10.1002/dvdy.24553
40. Oner DA, Tastan H. Association between the transforming growth factor Beta 1 gene polymorphisms and Turkish patients with nonsyndromic cleft lip with/without cleft palate. Genet Test Mol Biomarkers. 2016;20(5):265–268. doi:10.1089/gtmb.2015.0301
41. Lauder JM, Zimmerman EF. Sites of serotonin uptake in epithelia of the developing mouse palate, oral cavity, and face: possible role in morphogenesis. J Craniofac Genet Dev Biol. 1988;8(3):265–276.
42. Wu YH, Lee YH, Shih HY, Chen SH, Cheng YC, Tsun-Yee CD. Glucose-6-phosphate dehydrogenase is indispensable in embryonic development by modulation of epithelial-mesenchymal transition via the NOX/Smad3/miR-200b axis. Cell Death Dis. 2018;9(1):10. doi:10.1038/s41419-017-0005-8
43. Bahado-Singh RO, Schenone M, Cordoba M, et al. Male gender significantly increases risk of oxidative stress related congenital anomalies in the non-diabetic population. J Matern Fetal Neonatal Med. 2011;24(5):687–691. doi:10.3109/14767058.2010.529970
44. Kobayashi GS, Alvizi L, Sunaga DY, et al. Susceptibility to DNA damage as a molecular mechanism for non-syndromic cleft lip and palate. PLoS One. 2013;8(6):e65677. doi:10.1371/journal.pone.0065677
45. Dhulipala VC, Welshons WV, Reddy CS. Cell cycle proteins in normal and chemically induced abnormal secondary palate development: a review. Hum Exp Toxicol. 2006;25(11):675–682. doi:10.1177/0960327106070848
46. Huan T, Joehanes R, Schurmann C, et al. A whole-blood transcriptome meta-analysis identifies gene expression signatures of cigarette smoking. Hum Mol Genet. 2016;25(21):4611–4623. doi:10.1093/hmg/ddw288
47. Hardy JJ, Mooney SR, Pearson AN, et al. Assessing the accuracy of blood RNA profiles to identify patients with post-concussion syndrome: a pilot study in a military patient population. PLoS One. 2017;12(9):e0183113. doi:10.1371/journal.pone.0183113
48. Zhang J, Zhou S, Zhang Q, et al. Proteomic analysis of RBP4/Vitamin A in children with cleft lip and/or palate. J Dent Res. 2014;93(6):547–552. doi:10.1177/0022034514530397
49. Li S, Jin S, Jin C. The correlative hypotheses between Pitchfork and Kif3a in palate development. Med Hypotheses. 2019;126:23–25. doi:10.1016/j.mehy.2019.03.005
 © 2021 The Author(s). This work is published and licensed by Dove Medical Press Limited. The full terms of this license are available at https://www.dovepress.com/terms.php and incorporate the Creative Commons Attribution - Non Commercial (unported, v3.0) License.
By accessing the work you hereby accept the Terms. Non-commercial uses of the work are permitted without any further permission from Dove Medical Press Limited, provided the work is properly attributed. For permission for commercial use of this work, please see paragraphs 4.2 and 5 of our Terms.
© 2021 The Author(s). This work is published and licensed by Dove Medical Press Limited. The full terms of this license are available at https://www.dovepress.com/terms.php and incorporate the Creative Commons Attribution - Non Commercial (unported, v3.0) License.
By accessing the work you hereby accept the Terms. Non-commercial uses of the work are permitted without any further permission from Dove Medical Press Limited, provided the work is properly attributed. For permission for commercial use of this work, please see paragraphs 4.2 and 5 of our Terms.