")
Back to Journals » International Journal of General Medicine » Volume 14
Exploring Prognosis-Associated Biomarkers of Estrogen-Independent Uterine Corpus Endometrial Carcinoma by Bioinformatics Analysis
Authors Ye Y , Li H, Bian J, Wang L, Wang Y, Huang H
Received 9 October 2021
Accepted for publication 16 November 2021
Published 30 November 2021 Volume 2021:14 Pages 9067—9081
DOI https://doi.org/10.2147/IJGM.S341345
Checked for plagiarism Yes
Review by Single anonymous peer review
Peer reviewer comments 2
Editor who approved publication: Dr Scott Fraser
Youchun Ye, Hongfeng Li, Jia Bian, Liangfei Wang, Yijie Wang, Hui Huang
Department of Gynecology and Obstetrics, The Affiliated People’s Hospital of Ningbo University, Ningbo, Zhejiang, 315040, People’s Republic of China
Correspondence: Youchun Ye
Department of Gynecology and Obstetrics, The Affiliated People’s Hospital of Ningbo University, 251 Baizhang East Road, Ningbo, Zhejiang, 315040, People’s Republic of China
Email [email protected]
Background: Uterine corpus endometrial carcinoma (UCEC) is one of the most common female cancers with high incidence and mortality rates. In particular, the prognosis of type II UCEC is poorer than that of type I. However, the molecular mechanism underlying type II UCEC remains unclear.
Methods: RNA-seq data and corresponding clinical information on UCEC patients were downloaded from The Cancer Genome Atlas database, which were then separated into mRNA, lncRNA, and miRNA gene expression profile matrix to perform differentially expressed gene analysis. Weighted gene co-expression network analysis (WGCNA) was used to identify key modules associated with different UCEC subtypes based on mRNA and lncRNA expression matrix. Following that, a subtype-associated competing endogenous RNA (ceRNA) regulatory network was constructed. In addition, GO functional annotation and KEGG pathway analysis were performed on subtype-related DE mRNAs, and STRING database was utilized to predict the interaction network between proteins and their biological functions. The key mRNAs were validated at the protein and gene expression levels in endometrial cancerous tissues as compared with normal tissues.
Results: In summary, we identified 4611 mRNA, 3568 lncRNAs, and 47 miRNAs as differentially expressed between endometrial cancerous tissues and normal endometrial tissues. WGCNA demonstrated that 72 mRNAs and 55 lncRNAs were correlated with pathological subtypes. In the constructed ceRNA regulatory network, LINC02418, RASGRF1, and GCNT1 were screened for their association with poor prognosis of type II UCEC. These DE mRNAs were linked to Wnt signaling pathway, and lower expression of LEF1 and NKD1 predicted advanced clinical stages and worse prognosis of UCEC patients.
Conclusion: This study revealed five prognosis-associated biomarkers that can be used to predict the worst prognosis of type II UCEC.
Keywords: uterine corpus endometrial carcinoma, estrogen-independent, prognosis, WGCNA, competing endogenous RNA
Introduction
Uterine corpus endometrial carcinoma (UCEC) is a serious disease that affects women.1 The increasing incidence rate of endometrial cancer accounts for 6% of new cancer cases,2,3 and approximately 3% of cancer deaths.2 In 1983, Bokhman first proposed that endometrial cancer could be classified into two subtypes based on diverse clinical and histological characteristics.4 Type I tumors are predominantly endometrioid adenocarcinomas and can be affected by an imbalance between progesterone and estrogen exposures and even obesity.5 Estrogen-independent UCEC (type II) is prevalent in postmenopausal females and is associated with endometrial atrophy,6 presenting as a high-grade, poorly differentiated tumor with poorer prognoses than type I tumor. Little is known about the risk factors of type II tumors. Due to the higher infiltrative capacity and metastatic rate of lymph nodes, the 5-year survival rate of type II tumor is as low as 20% to 26%.7,8 Type II tumors account for approximately 10% to 20% of UCEC cases, but 40% of deaths.9 Distinct etiologies underlying these subtypes have been proposed for disparate genetic alterations found in type I and type II tumors.10
Interaction of multiple genes and factors contributed to the complicated development and tumorigenesis of UCEC. Based on diverse mutations, the Cancer Genome Atlas (TCGA) classified UCEC into different subtypes, such as POLE (DNA polymerase epsilon) mutants, microsatellite instability (MSI) high mutants, low copy number types (CN-L), and high copy number type (CN-H).11,12 This classification was previously used to predict the prognosis of patients and guide the formulation of clinical treatment plans, providing new classification options for precise UCEC treatment. With further research and development of specific targeted therapy, molecularly targeted drugs have been applied in clinical diagnosis and treatment. For instance, Tsoref et al found that PI3K/AKT/mTOR signal axis is often abnormally expressed in endometrial cancer.13 Molecular analysis has revealed that PI3K and MAPK pathways are the most frequently altered in type II tumors.14 However, clinically, research results mentioned above have not been properly validated. Clinical trials indicated that the effective response rate of mTOR inhibitors is less than 10%,15 whereas PI3K inhibitors,16 angiogenesis factor/fibroblast growth factor receptor inhibitors,17,18 and programmed cell death protein 1 (PD-1) and its ligand (PD-L1) inhibitors19 all had relatively limited efficacy. Therefore, further searching for highly specific and sensitive markers has a significant impact on early prevention, diagnosis, treatment, and prognosis evaluation of UCEC, particularly for type II endometrial cancer with a poor prognosis.
Bioinformatics is a rapidly growing discipline that aims to uncover the biological significance of biological data using a multidisciplinary approach, thereby resolving difficulties in life science research and related technological industries.20–22 The present study analyzed high-throughput RNA-sequencing data of UCEC from TCGA database. First, differentially expressed genes were identified to construct a co-expression network and competitive endogenous RNA (ceRNA) regulatory networks associated with pathological tissue subtypes of UCEC. In addition, biological function enrichment analysis, protein interaction network construction, and survival analysis were performed to reveal the potential role of key molecules in different pathological UCEC subtypes to elucidate the molecular mechanism underlying occurrence and development of UCEC.
Materials and Methods
Acquisition and Preprocessing of RNA-Sequencing Data
Figure 1 displays the workflow diagram for this study. RNA-sequencing data of UCEC patients was downloaded from the National Cancer Institute’s Genomic Data Comments data portal (https://portal.gdc.cancer.gov), which was retrieved from The Cancer Genome Atlas (TCGA, https://www.cancer.gov/tcga) database. The TCGA-UCEC cohort analysis was included with the following searching strategies: (1) pathological diagnosis was uterine corpus endometrial carcinoma; (2) raw count data was available for each sample; (3) information of clinical traits was available. Each sample was acquired using the American Illumina HiSeq 2000 RNA sequencing platform, and the ENSEMBL system was used for gene annotation. After the download is completed, use the R program to convert all gene IDs into gene names, and organize the gene expression profile into a matrix format with the sample as the column name and the gene as the row name for subsequent statistical analysis.
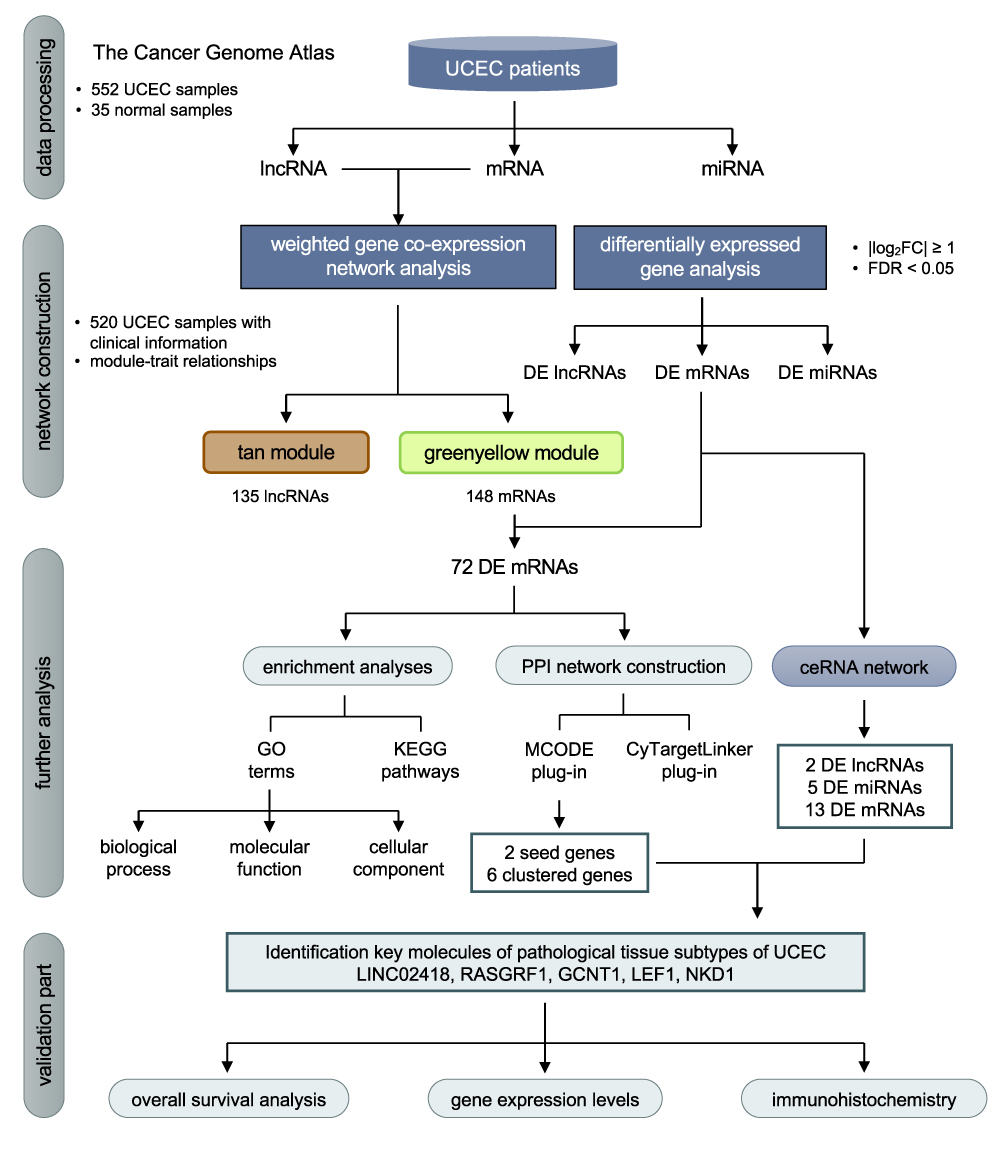 |
Figure 1 Flow chart of data processing, network construction, analysis and validation in the present study. |
Data Processing and Screening of the Differentially Expressed Genes
Different types of RNA in the RNA-seq expression matrix were summarized and classified according to mRNA, lncRNA, and miRNA. The RNA-seq data was performed CPM (counts per million) algorithm for normalization, and genes with CPM value > 0.5 in at least 2 samples were retained, and those genes with low abundance were eliminated. This study uses “logarithmic transformation” to convert the RNA-seq data into a normal distribution. Using the “edgeR” package in the R software, RNA-seq data of 552 UCEC samples and 35 normal endometrial samples were utilized to screen out differentially expressed genes (DEGs) with the cut-off criteria of |log2FC|≥1 and false discovery rate (FDR) <0.05. The DEGs were divided into differentially expressed mRNAs (DE mRNAs), differentially expressed lncRNAs (DE lncRNAs), and differentially expressed miRNAs (DE miRNAs).
Weighted Gene Co-Expression Network Analysis (WGCNA)
“WGCNA” package was used for the following analysis. First, normal and cancer samples without clinical data are removed from mRNA and lncRNA expression matrix, and 80% of genes whose expression level was 0 are removed from the samples, forming a new expression matrix with sample names as rows and gene names as columns. The goodSampleGens function detected and eliminated genes with excessive number of missing values and further calculated the sample connection degree. WGCNA used the correlation coefficient of the expression matrix and calculated topological overlap matrix (TOM). An unsupervised co-expression relationship between genes was established using Pearson correlation coefficients. Following that, TOM was constructed using soft threshold β (β=4). The gene modules were divided using dynamicTreeCut algorithm in WGCNA, and all genes with similar expression profiles were grouped into the same module using hierarchical clustering. A module must contain at least 30 genes, and gene modules with similarities greater than or equal to 75% (cutHeight = 0.25) were combined. By performing module–trait relationship (MTR) analysis, we built heatmaps to identify modules with high association to different clinical features. In addition, gene significance (GS) and module significance (MS), respectively, refer to the correlation between genes and external information, as well as the average value of GS of all genes in a specific module.
Construction of ceRNA Regulatory Network
mRNAs and lncRNAs related to pathological tissue subtypes of UCEC were selected using the above-mentioned WGCNA technology. Intersection results concluded that subtype-related differentially expressed mRNAs and lncRNAs among identified DE mRNAs and DE lncRNAs. Furthermore, DE miRNAs were combined to construct a ceRNA regulatory network by the following steps: (1) predicting the interaction between DE lncRNAs and DE miRNAs using miRcode (http://www.mircode.org) database; (2) predicting the interaction between DE miRNAs and DE mRNAs using TargetScan (http://www.targetscan.org), miRTarBase (http://miRTarBase.cuhk.edu.cn/), and miRBase (http://www.mirbase.org) databases; (3) selecting duplicate DE miRNAs as common connections. Finally, we constructed ceRNA regulatory networks and visualized them using Cytoscape software (version 3.7.0).
Construction of Protein–Protein Interaction (PPI) Network and Screening of Key Genes
We uploaded DE mRNAs related to pathological tissue subtypes of UCEC identified in WGCNA to the Search Tool for the Retrieval of Interacting Genes (STRING, http://string-db.org) online analysis software to identify the potential relationship between proteins encoded by DE mRNAs. Cytoscape (version 3.7.0) software was employed to visualize PPI network. Molecular Complex Detection algorithm was performed using MCODE plug-in to filter out highly relevant modules from the entire PPI network and assigned each molecule to the MCODE value to calculate clustering seed genes and clustered genes in the module. The CyTargetLinker plug-in based on “Wikipathways” database (https://www.wikipathways.org/index.php/WikiPathways) was used to perform the functional pathway enrichment analysis of DE mRNAs in the constructed PPI network.
Verification and Survival Analysis of Key RNAs
Based on their clinical characteristics and the subtypes of pathological tissues, 520 cases of UCEC were divided into 384 cases of type I UCEC and 136 cases of type II UCEC. RNA expression levels of key RNAs were calculated. Second, based on their clinical stages, UCEC samples can be divided into 375 patients with early stage (stage I and II) and 145 patients with advanced stage (stage III and IV), and then the relationship between expression and clinical stages was determined. In addition, to verify whether Wnt signaling pathway-related molecules predicted by the metabolic pathway analysis in PPI network had reliable biological significance, we used TCGA data in Oncomine (https://www.oncomine.org/) database to observe the expression levels of genes related to Wnt signaling pathways in type I and type II UCEC, respectively. Five hundred and twenty UCEC cases were divided into high- and low-expression groups to perform overall survival (OS) analysis by using the Log rank test method, determining the associations between key RNAs and OS rate. Kaplan–Meier (KM) survival curve demonstrated the results. The Human Protein Atlas (http://www.proteinatlas.org)23 was employed to map the tissue protein expression pattern for the key RNAs.
Statistical Methods
The data were presented as mean ± standard deviation, and GraphPad Prism software was used for statistical analysis. The comparison between the two groups was performed by t test, and the comparison between multiple groups was performed by one-way analysis of variance (ANOVA). P<0.05 was regarded as statistical significance.
Results
Clinical Information of Endometrial Cancer Samples
A total of 552 UCEC samples were collected and sorted from TCGA database, of which 520 had relevant clinical data. The cluster tree diagram of 520 samples exhibited corresponding clinical information on age, height, weight, race, pathological tissue type, clinical stage, tumor status, and survival time (Figure 2). All patients were females with an average age of 63.9±10.9 years, ranging from 31 to 89 years. The average height was 1.61±0.08 meters, ranging from 0.66 to 1.83 meters. The average weight was 87.2± 25.3 kg, ranging from 44 to 209 kg. The race of 355 out of 520 patients was white. As for the pathological type of these samples, 384 cases were type I UCEC and 136 cases of type II UCEC, including serous cystadenocarcinoma, clear cell carcinoma, and papillary cystadenocarcinoma. In addition, there were 325 cases with stage I, 50 cases with stage II, 118 cases with stage III, and 27 cases with stage IV. Of the cases with recorded survival times, 432 survived and 88 died, with an average survival time of 1137 days.
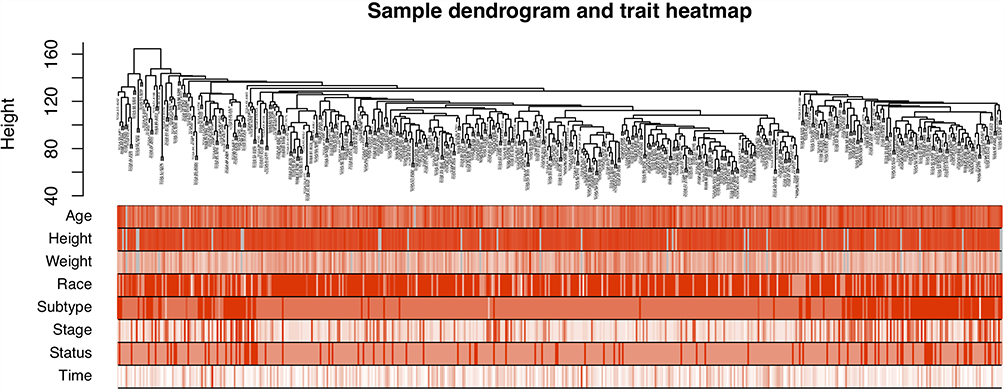 |
Figure 2 Hierarchical clustering tree and corresponding clinical feature information heat map of 520 samples, and the color depth only represents the value. |
Differential Expression of mRNAs, lncRNAs, and miRNAs
Among 19,601 mRNAs, 19,121 eligible genes were retained, and 9094 mRNAs had CPM greater than 0.5 in 587 samples. Similarly, the original data of lncRNA and miRNA were preprocessed. A total of 24,571 out of 25,295 eligible lncRNAs were retained, whereas 1311 out of 1448 eligible miRNAs were retained. As illustrated in Figure 3, a differential analysis of RNA-seq data found that 2629 mRNAs, 1977 lncRNAs, and 14 miRNAs were upregulated, whereas 1982 mRNAs, 1591 lncRNAs, and 33 miRNAs were downregulated.
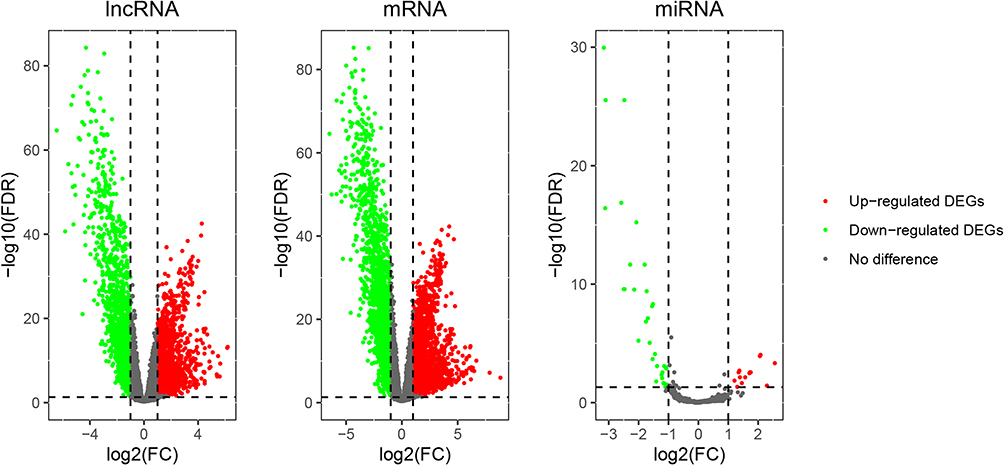 |
Figure 3 The volcano map of differentially expressed lncRNA, mRNA and miRNA. The green dots on the abscissa axis (log2FC) less than or equal to 1 represented downregulated genes and the red dots greater than or equal to 1 represented upregulated genes. |
Weighted Gene Co-Expression Network Analysis (WGCNA) of mRNA and lncRNA
We utilized the goodSampleGenes function to eliminate genes with missing values. Based on inclusion criteria, 520 samples were included in a further-step study of WGCNA. Then, we calculated the soft threshold parameter (ß) required to construct a scale-free distribution using pickSoftThreshold function, and after considering the stability of the average connectivity, we chose ß=4 (Figure 4A and B). At the same time, a gene-free scale network could be established under this soft threshold (R2=0.81) (Figure 4C and D). By specifying that the minimum number of genes in the module was 30, the minimum cutHeight was 0.25, and other parameters were default values of algorithm, we used dynamicTreeCut algorithm to divide gene modules. The gray module was eliminated because gene connectivity was too small to be incorporated in other modules, resulting in 11 modules of mRNA (Figure 4E). Using MTR analysis, at the mRNA level, the tan module, yellow module, green yellow module, and blue module were found to be significantly associated with pathological tissue subtypes of endometrial cancer (Figure 4F), and the green yellow module was found to be significantly associated by calculating the correlation between GS and MS of the above four modules (Figure 4G).
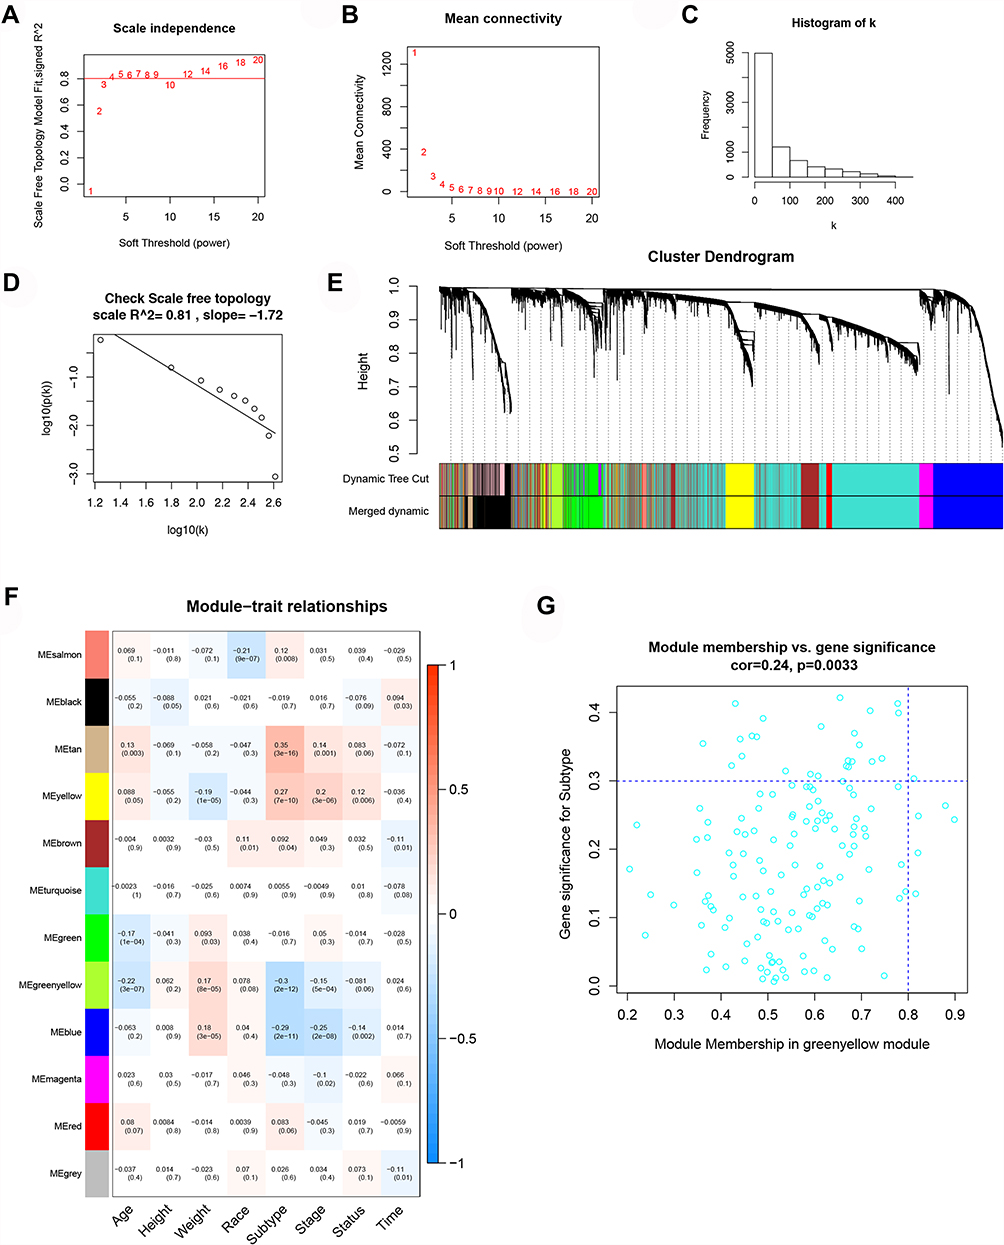 |
Figure 4 WGCNA of mRNA. (A) The relationship between SFT.R.sq and soft threshold (power). (B) The relationship between average connection degree and soft threshold (power). (C) Frequency distribution histogram of connection degree k in the case of ß=4. (D) The square (R2=0.81) and slope relationship of the correlation between each parameter log(p(k)) and log(k). (E) Module gene clustering dendrogram and dynamic cutting module heat map. (F) Heat map of the correlation between the module and the clinical characteristics of the sample. On the left is the ME value of the module and the bottom column is the different clinical features. The box shows the correlation coefficient and p value of each ME and clinical feature. (G) Scatter plot of the correlation between GS and MS and green yellow module was considered to be significantly related module. |
On the other hand, a parallel analysis was performed at the lncRNA level; we also chose ß=4 to construct a scale-free distribution and observed R2=0.84 (Supplementary Figure 1A–D). After performing dynamicTreeCut algorithm, 13 modules of lncRNA were obtained (Supplementary Figure 1E). Ultimately, the yellow, tan, green, and light cyan modules were related, and the tan module was considered the most strongly associated (Supplementary Figure 1F and G).
CeRNA Regulatory Network Construction and Key Molecular Verification
We constructed a ceRNA network from DE mRNAs, DE lncRNAs, and DE miRNAs associated with pathological tissue subtypes of UCEC (Figure 5A). LINC02418 and DLX6-AS1 were found to be employed as ceRNAs of multiple miRNAs to exert a competitive, regulatory role on target genes. Moreover, the molecules with high tissue specificity may become new therapeutic targets for endometrial cancer. As illustrated in Figure 5B, LINC02418, RASGRF1, and GCNT1 were statistically significant in ceRNA regulatory network connected to pathological tissue subtypes. The expression levels of LINC02418, RASGRF1, and GCNT1 in type II endometrial cancer were notably lower than those in type I (Figure 5C). Meanwhile, they demonstrated lower expression levels in advanced patients (clinical stages III and IV) compared with patients in the early stages of cancer (clinical stages I and II) (Figure 5D).
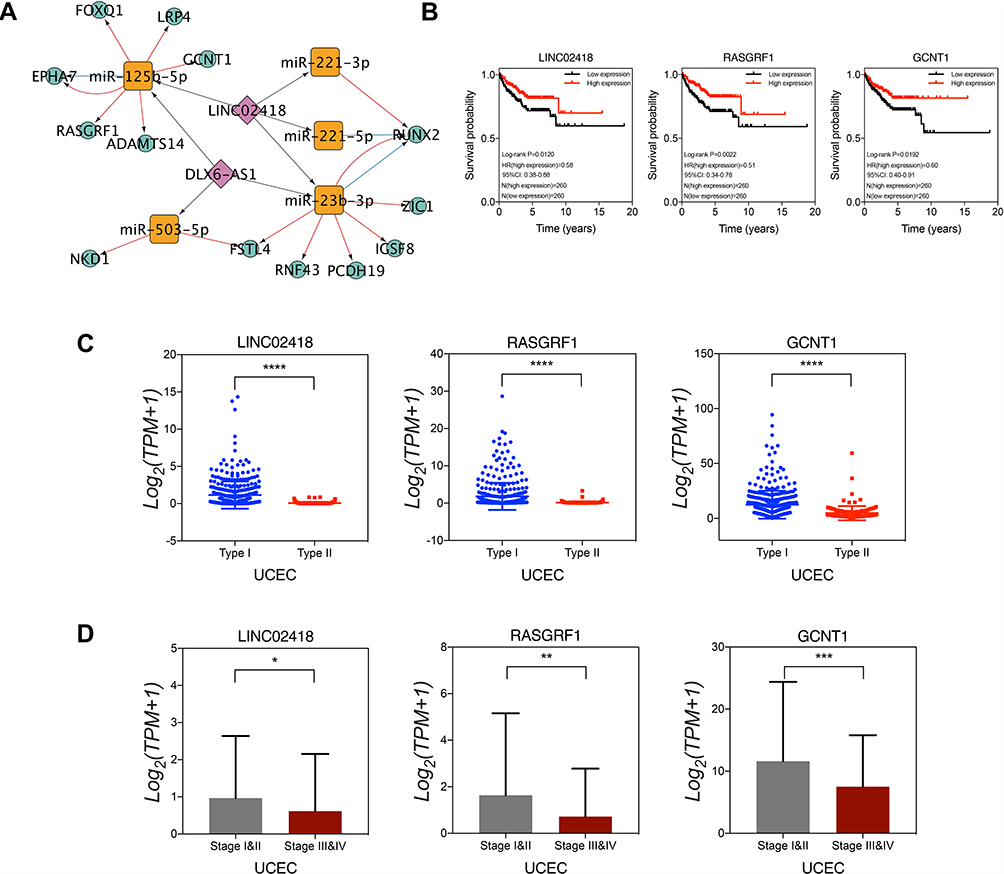 |
Figure 5 CeRNA regulatory network construction and key molecular verification. (A) ceRNA regulatory network. (B) Low expression of LINC02418, RASGRF1 and GCNT1 was associated with poor prognosis of endometrial cancer. LINC02418, RASGRF1 and GCNT1 were significantly low expression in type II endometrial cancer (C) and advanced cancer (D). *p<0.05. **p<0.01. ***p<0.001. ****p<0.0001. |
Functional Enrichment Analyses and PPI Network Construction
WGCNA results exhibited that the green yellow module with 148 mRNAs was highly correlated with pathological tissue subtypes. Compared with normal endometrial tissues, 72 out of 148 mRNAs were considered to be differentially expressed mRNAs. DAVID online software was used to conduct enrichment analysis of the biological functions and signal pathways of these DE mRNAs (Figure 6A). GO function annotation revealed that the biological process category contained 21 BP terms, 2 MF terms, and 5 CC terms. KEGG signaling pathway analysis results indicated that DE mRNAs were mainly concentrated in Wnt signaling pathway and were also enriched in basal cell carcinoma, melanogenesis, and Hippo signaling pathways. Specifically, this may imply that studying the impact of genes on these pathways in endometrial cancer could become a new direction for research.
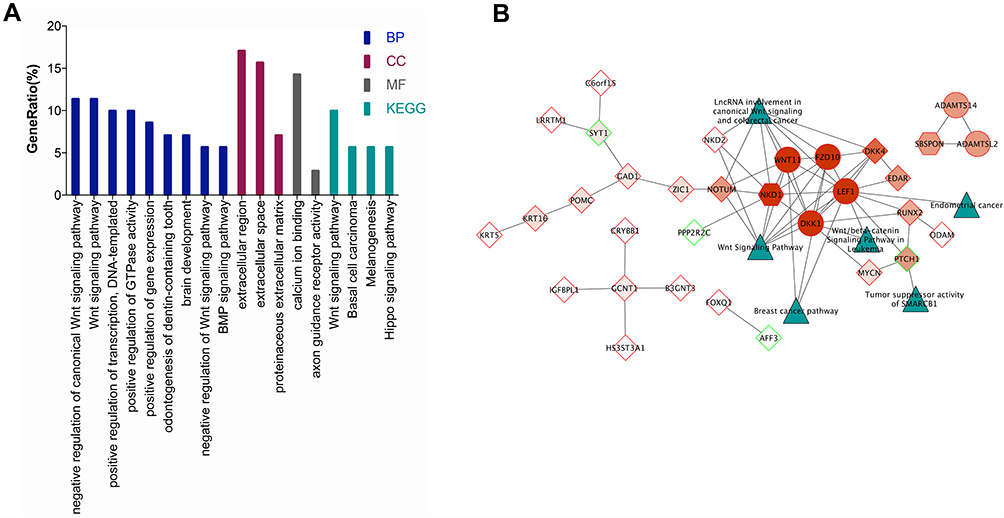 |
Figure 6 Functional enrichment analyses and PPI network construction. (A) The results of GO and KEGG enrichment analysis of 72 DE mRNAs in the GreenYellow module. (B) The protein interaction network of DE mRNAs in the GreenYellow module. The dark green triangles represent each pathway, the red represents the MCODE score from dark to light, the hexagon represents the seed gene, the circle represents the clustered gene, and the diamond represents the unclustered gene, the red frame indicates the upregulation of DE mRNAs and the green frame indicates the downregulation of DE mRNAs. |
Among 72 DE mRNAs, the interactions between proteins encoded by 31 mRNAs formed a complex protein interaction network (Figure 6B). According to MCODE plug-in, PPI network contained two clustering modules: one module utilized NKD1 as the seed gene and WNT11, FZD10, LEF1, and DKK1 as the clustered gene, and the other module utilized SBSPON as the seed gene, and ADAMTS14 and ADAMTSL2 as the cluster genes. It was predicted that metabolic signaling pathways of key genes in PPI network were mainly enriched in Wnt signaling pathway using CyTargetLinker plug-in and Wikipathways database. In addition, because LEF1 was predicted to be enriched in the metabolic signaling pathway of endometrial cancer, and because NKD1 was the seed gene in the clustering module, LEF1 and NKD1 were the focus of subsequent research and analysis.
Key Molecules’ Verification of the Expression Level and Survival Analysis
Among DE mRNAs that were notably related to pathological tissue subtypes of UCEC, we used protein interaction network and cluster analysis to screen out LEF1 and NKD1 in Wnt signaling pathway linked to UCEC occurrence and development. The search results of Oncomine database revealed that LEF1 expression in type I endometrial cancer was 2.94 times that of type II, and NKD1 expression in type I endometrial cancer was 3.18 times that of type II (Figure 7A), consistent with RNA-seq data results (Figure 7B). LEF1 expression was markedly reduced in advanced endometrial cancer, particularly in clinical stage IV cancer tissues (p = 0.04) (Figure 7C). However, NKD1 expression in advanced cancer tissues was slightly reduced, but this was not statistically significant (p = 0.265) (Figure 7D). Furthermore, Figure 7E demonstrates a positive correlation between LEF1 and NKD1 expression levels in endometrial cancer (Spearman correlation coefficient 0.59, p = 1.5E-17). Based on the results of survival prognosis analysis performed on GEPIA database, patients with low expression of LEF1 and NKD1 tended to have a poor prognosis (Figure 7F, log-rank p = 0.016, log-rank p = 0.039, respectively). Following that, we obtained survival prognosis curves of LEF1 and NKD1 based on RNA-seq data of 520 endometrial cancer patients. As illustrated in Figure 7G, in UCEC patients, LEF1 expression levels higher than 7.70 belonged to the high-expression group, and those with LEF1 expression lower than 7.70 belonged to the low-expression group. The results indicated that patients with high LEF1 expression had a better prognosis than those with low expression (log-rank p = 0.0015), with a hazard ratio (HR) of 0.50 (0.33–0.76). Similarly, NKD1 patients took 2.41 as the cut-off point, and the prognostic outcome of high expression group was significantly better than that of low expression group (log-rank p = 0.0068), with a hazard ratio (HR) of 0.42 (0.25–0.68).
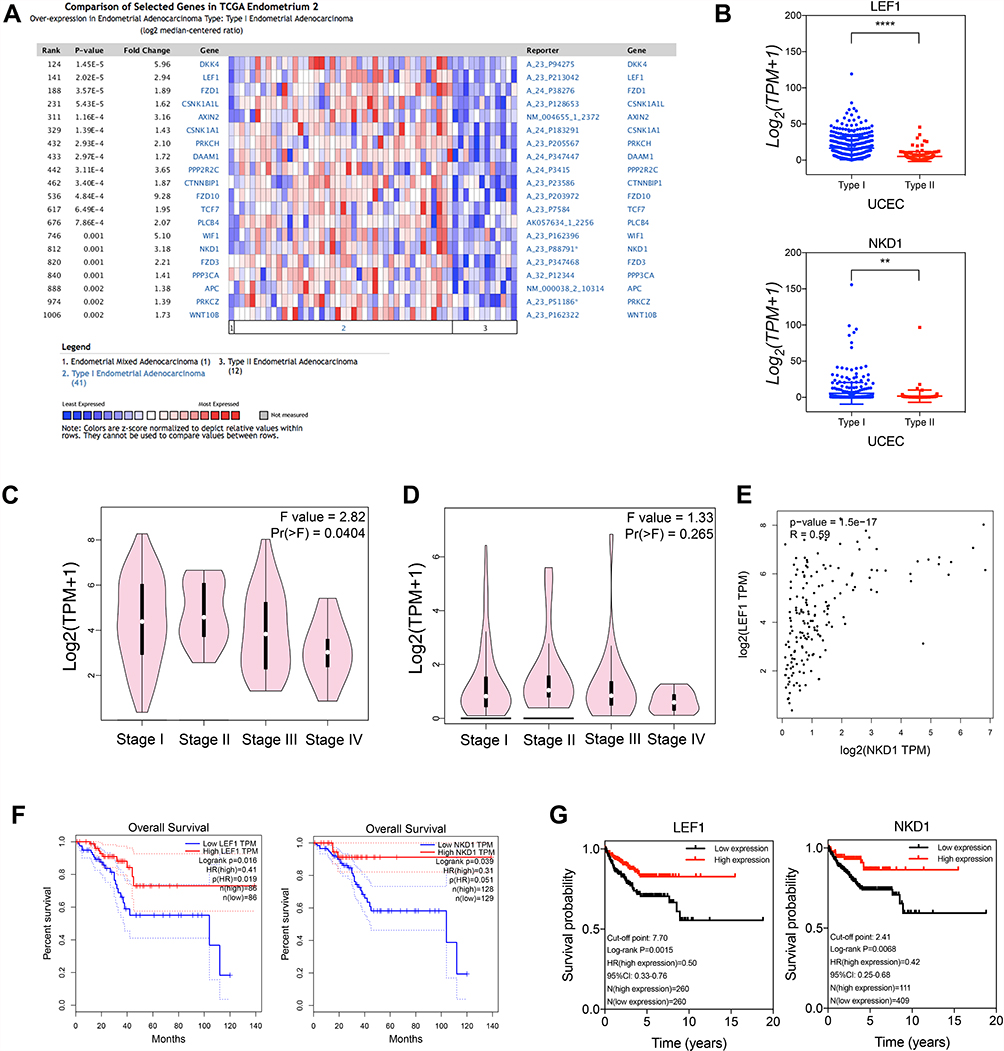 |
Figure 7 Key molecules’ verification of the expression level and survival analysis. (A) Gene expression profile of Wnt signaling pathway related molecules in type I and type II UCEC in Oncomine database. (B) RNA-seq data verified that the level of gene expression of LEF1 and NKD1 in type I and type II UCEC. LEF1 (C) and NKD1 (D) gene expression levels and their correlation (E) in different clinical stages. Both in the GEPIA database (F) and in the RNA-seq data (G), patients with low expression of LEF1 and NKD1 had a poor prognosis. **p<0.01. ****p<0.0001. |
Verification of RASGRF1, GCNT1, LEF1, and NKD1 Protein Expression Levels
Table 1 shows the histopathological characteristics of UCEC patients. To explore the protein expression patterns of the pathological subtype-associated genes in UCEC samples, we examined the expression of RASGRF1, GCNT1, LEF1, and NKD1 in The Human Protein Atlas database (Figure 8). This analysis revealed that the GCNT1 and LEF1 proteins were expressed at higher levels in UCEC tissues compared with those in normal tissues. Immunohistochemistry staining revealed the cytoplasmic and membranous location of RASGRF1, GCNT1, and NKD1 proteins in cancerous tissues, as well as the nuclear locations of LEF1 and NKD1 proteins. The boundary between endometrial tissue and connective tissue becomes blurred in cancerous tissues, which is clearly well structured in the normal endometrial epithelial tissues.
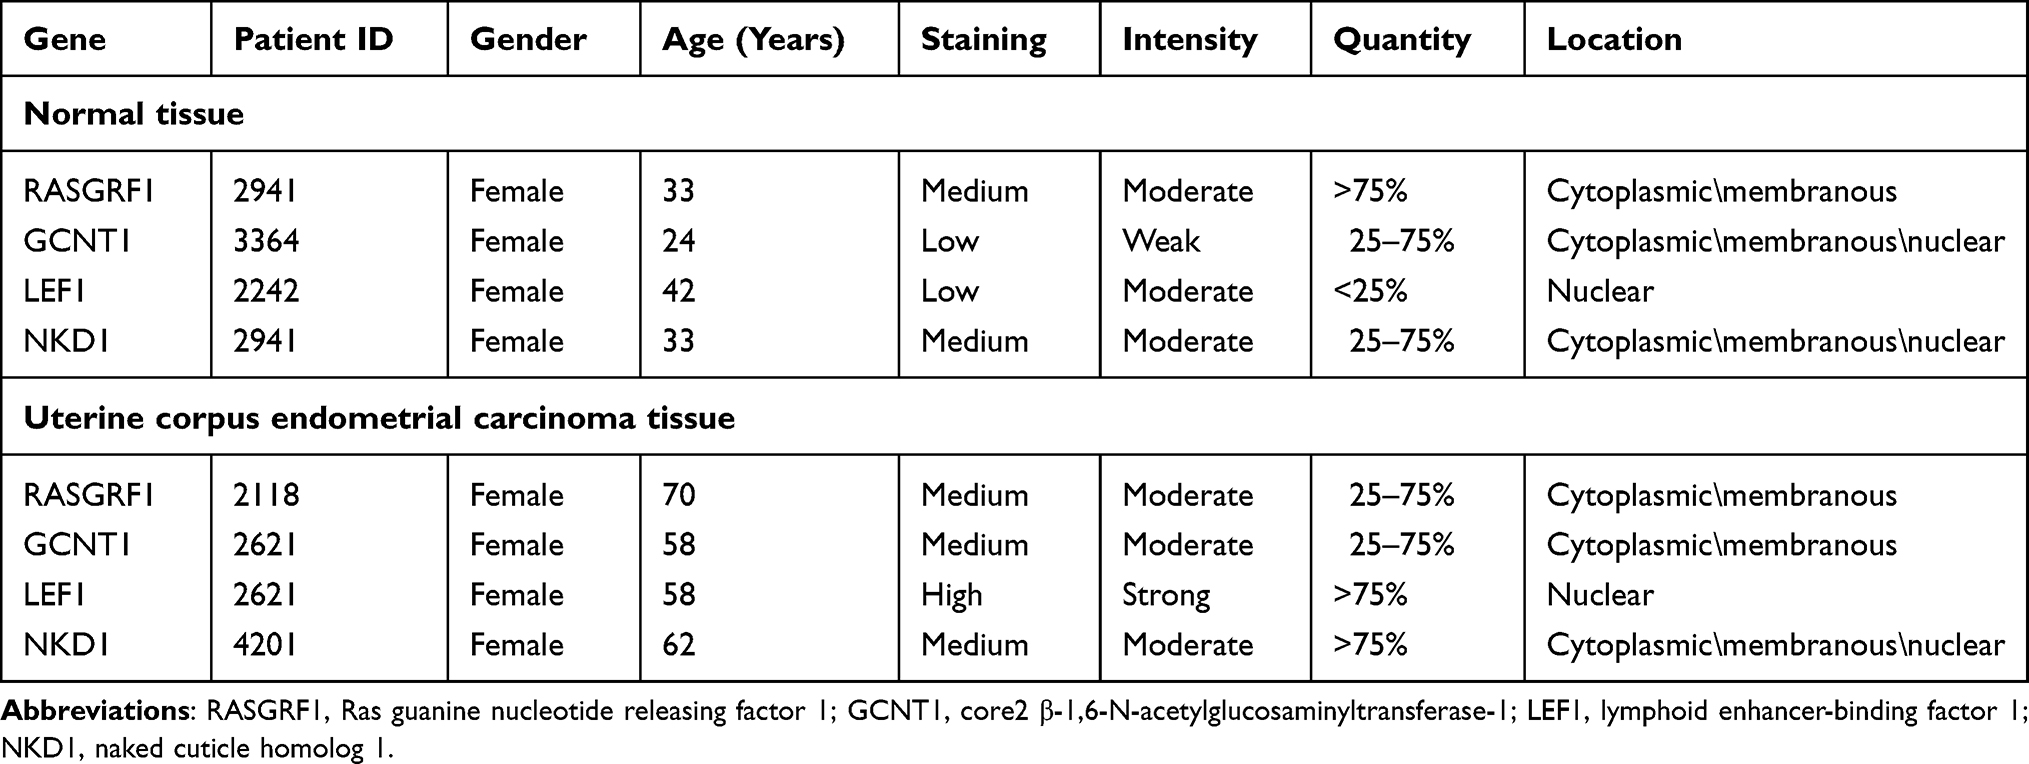 |
Table 1 Immunohistochemistry Staining Characteristics of Key RNAs from the Human Protein Atlas Database |
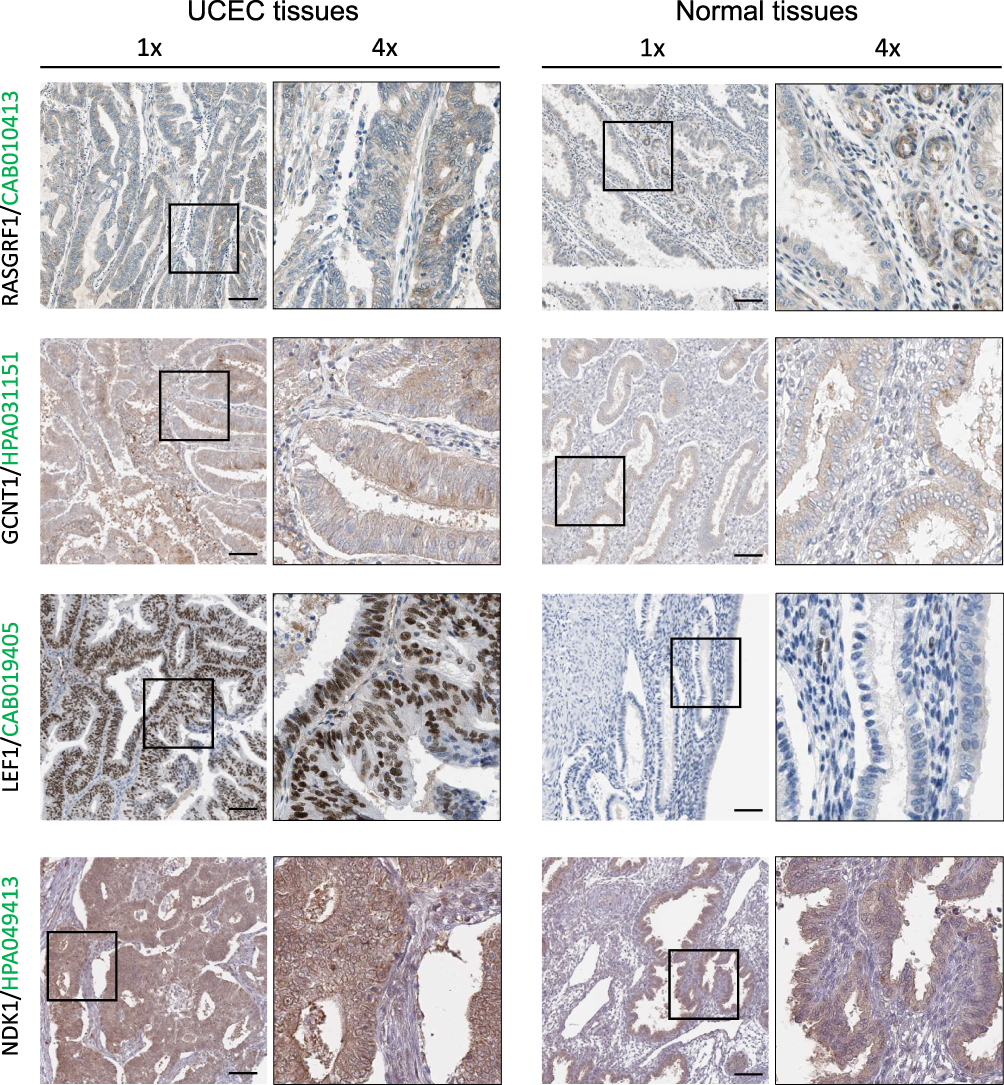 |
Figure 8 RASGRF1, GCNT1, LEF1 and NKD1 expression validation. Protein expression levels in UCEC as compared to those in normal tissues by IHC staining from the Human Protein Atlas database. Black square boxes represent typical normal and UCEC tissues, respectively. Scale bars represent 100 μm. |
Discussion
Poorly differentiated type II endometrial carcinomas include poorly differentiated endometrioid carcinoma, serous papillary carcinoma, clear cell carcinoma, and other non-endometrioid carcinomas, with high recurrence risk and poor prognosis. Exploring regulatory mechanisms underlying the occurrence and progression of UCEC at the molecular level is critical to identify prognostic signal pathways and key genes and discover potential therapeutic targets associated with type II endometrial cancer.
Based on WGCNA technology and ceRNA regulatory network hypothesis, we found that 13 mRNAs, 2 lncRNAs, and 5 miRNAs related to pathological tissue subtypes of UCEC can participate in the occurrence and development of endometrial cancer. Among them, LINC02418, RASGRF1, and GCNT1 are related to the poor prognosis of type II endometrial cancer. Subsequently, we conducted a multi-dimensional analysis of DE mRNAs screened from WGCNA technology and were significantly associated with pathological tissue subtypes of endometrial cancer and found that LEF1 and NKD1 are not only linked to pathological tissue subtypes of endometrial cancer but also involved in Wnt signaling pathway and endometrial cancer-related signaling pathways.
In this study, LINC02418 is an important part of ceRNA regulatory network linked to pathological tissue subtypes of endometrial cancer. At present, most researches mainly focus on the ability of LINC02418 to competitively bind to miRNA and affect the inhibitory effect of miRNA on target genes. Numerous studies have confirmed that dysregulated LINC02418 is correlated with various cancers via ceRNA regulatory mechanisms, such as colorectal cancer,24,25 non-small cell lung cancer,26 lung adenocarcinoma,27 and so on. Zhao et al24 identified the differential expression characteristics of LINC02418 in colorectal cancer and non-cancer tissues through TCGA database and confirmed that highly expressed LINC02418 could act as a “sponge” for mir-1273G-3p in tissues and cell lines. The expression of the target gene MELK was up-regulated by ceRNA and promoted the occurrence of colorectal cancer. Tian et al25 found that LINC02418 can negatively regulate cell apoptosis through mir-34B-5p/BCL2 axis, hence enhancing tumor growth, cell migration, and invasiveness and adversely affecting the survival prognosis of colorectal cancer. Moreover, LINC02418 was also proved to have carcinogenic effects in non-small cell lung cancer, regulating mir-4677-3p/SEC61G axis to accelerate disease progression.26 However, no studies have reported the role of LINC02418 in endometrial cancer pathogenesis. Our research initially revealed that the expression level of LINC02418 differs in various pathological tissue subtypes of endometrial cancer, and LINC02418 may form a ceRNA regulatory axis with miR-125p-5p, RASGRF1, and GCNT1 to function as a “tumor suppressor”.
RASGRF1 and GCNT1 are mRNA components of ceRNA regulatory network, with expression patterns in endometrial cancer similar to those of LINC02418. RASGRF1 (Ras guanine nucleotide releasing factor 1) and RASGRF2 co-encode the guanine nucleotide exchange factor by promoting bound GDP release to activate Ras GTPase.28 Feigl found that RASGRF1 exerts carcinogenic effects by activating Ras protein in gastric tumors.28 Simultaneously, research revealed that RASGRF1 could directly bind to another Ras-related GTP binding protein, Cdc42, to suppress tumor cell invasion and transformation.29 In addition, Takamaru et al also demonstrated that ectopic expression of RASGRF1 exerts a tumor suppressor impact, mainly inhibiting cancer cell proliferation and invasion, and that methylated RASGRF1 is a biological marker for identifying individuals at high risk of gastric cancer.30 Our research indicated that RASGRF1 has a potential inhibitory influence on the occurrence and development of endometrial cancer and that patients with higher expression levels have better survival rates. Furthermore, GCNT1 (core2 β-1,6-N-acetylglucosaminyltransferase-1) exhibits a significant correlation with cancer cell invasiveness.31,32 The protein encoded by GCNT1 gene is a key enzyme in forming core2 O-glycans that assist tumor cells in evading natural killer cells and surviving longer in the circulatory system.33,34 It has been established that decreased expression of GCNT1 is associated with progression-free survival (PFS) and decreased overall survival following intravenous chemotherapy for ovarian cancer.35 In this study, we found that the expression level of GCNT1 in advanced tissue samples of type II endometrial cancer with high invasive capacity and high lymphatic metastasis was relatively low. We then presented a characteristic of promoting malignant progression of cancer.
LEF1 (lymphoid enhancer-binding factor 1) is a downstream mediator of Wnt/β-catenin signaling pathway, and its abnormal expression is linked to tumorigenesis, migration, and invasion.36,37 At present, LEF1 has been proved to be a required protein for producing mouse endometrial glands, and its expression is increased in endometrial cancer cells compared with normal endometrium.38 As a downstream gene of Wnt/β-catenin signaling pathway, the expression of myc and MMP9 is also elevated.39 Wu et al confirmed that LEF1, as a target gene of miR-449a, participates in biological processes, such as “negative regulation of transcription by RNA polymerase II promoter” and that endometrial cancer patients with low LEF1 expression have a poor prognosis (p = 0.058).40 Our research results also revealed that LEF1, a highly expressed gene in cancer tissues, had a lower expression level in type II and advanced (especially clinical stage IV) endometrial cancer tissues with a worse prognosis. Therefore, the specific biological mechanism of LEF1 deserves further investigation. Additionally, this work proves that NKD1 (naked cuticle homolog 1) is significantly under-expressed in type II endometrial cancer and contributes to endometrial cancer pathogenesis via Wnt/β-catenin signaling pathway. Hu et al found that NKD1 can inhibit migration and invasion of gastric cancer cells, and that the over-expressed miR-532 could suppress NKD1 and promote disease progression.41 In addition, it has been established that NKD1 exerts its tumor suppressor action by inhibiting Wnt/β-catenin pathway.42 Meanwhile, NKD1 can suppress non-small cell lung cancer invasion43 and hepatocellular carcinoma metastasis.44 LEF1 and NKD1 are classic target genes of β-catenin. Disseminated tumor cells (DTCs) in the bone marrow of breast cancer patients have been found to be predictors of early recurrence, and the expression levels of LEF1 and NKD1 were also significantly down-regulated when PITX2 was inhibited, which is significantly associated with early metastasis.43 However, the role of LEF1 and NKD1 in the pathogenesis of type II endometrial cancer warrants further investigation.
Conclusion
In summary, we utilize bioinformatics research methods and public databases to identify key molecules associated with type II endometrial cancer by constructing gene co-expression networks and ceRNA regulatory networks and conducting survival analysis to reveal the prognosis of key molecules. We found that LINC02418 exerts a competitive, regulatory effect on the target genes RASGRF1 and GCNT1 by regulating multiple miRNAs, which may become a new therapeutic target for endometrial cancer. Meanwhile, LEF1 and NKD1 revealed differential expression levels in type I and type II endometrial cancer, which may be closely related to poor prognosis of type II endometrial cancer. At present, ceRNA regulation theory remains in its infancy, and additional experimental data are required for further corroboration.
Data Sharing Statement
The datasets generated and/or analyzed during the present study are available in The Cancer Genome Atlas database (UCEC RNA-sequencing; https://www.cancer.gov/tcga).
Ethics Statement
The Affiliated People’s Hospital of Ningbo University’s institutional review board has waived the need for ethical approval for the reasons that the present study used public database, so it did not involve ethics.
Acknowledgments
The results published in the present study are in whole or in part based upon data generated by The Cancer Genome Atlas Research Network (https://www.cancer.gov/tcga).
Funding
No funding was received.
Disclosure
The authors declare that they have no competing interests.
References
1. Morice P, Leary A, Creutzberg C, Abu-Rustum N, Darai E. Endometrial cancer. Lancet. 2016;387(10023):1094–1108. doi:10.1016/S0140-6736(15)00130-0
2. Siegel RL, Miller KD, Jemal A. Cancer statistics, 2020. CA Cancer J Clin. 2020;70(1):7–30. doi:10.3322/caac.21590
3. Wartko P, Sherman ME, Yang HP, Felix AS, Brinton LA, Trabert B. Recent changes in endometrial cancer trends among menopausal-age U.S. women. Cancer Epidemiol. 2013;37(4):374–377. doi:10.1016/j.canep.2013.03.008
4. Bokhman JV. Two pathogenetic types of endometrial carcinoma. Gynecol Oncol. 1983;15(1):10–17. doi:10.1016/0090-8258(83)90111-7
5. Emons G, Fleckenstein G, Hinney B, Huschmand A, Heyl W. Hormonal interactions in endometrial cancer. Endocr Relat Cancer. 2000;7(4):227–242. doi:10.1677/erc.0.0070227
6. Weigelt B, Banerjee S. Molecular targets and targeted therapeutics in endometrial cancer. Curr Opin Oncol. 2012;24(5):554–563. doi:10.1097/CCO.0b013e328354e585
7. Creasman WT, Odicino F, Maisonneuve P, et al. Carcinoma of the corpus uteri. FIGO 26th Annual Report on the results of treatment in gynecological cancer. Int J Gynaecol Obstet. 2006;95(Suppl 1):S105–43. doi:10.1016/S0020-7292(06)60031-3
8. Colombo N, Creutzberg C, Amant F, et al. ESMO-ESGO-ESTRO consensus conference on endometrial cancer: diagnosis, treatment and follow-up. Radiother Oncol. 2015;117(3):559–581. doi:10.1016/j.radonc.2015.11.013
9. Moore KN, Fader AN. Uterine papillary serous carcinoma. Clin Obstet Gynecol. 2011;54(2):278–291. doi:10.1097/GRF.0b013e318218c755
10. Setiawan VW, Yang HP, Pike MC, et al. Type I and II endometrial cancers: have they different risk factors? J Clin Oncol. 2013;31(20):2607–2618. doi:10.1200/JCO.2012.48.2596
11. Soslow RA. Endometrial carcinomas with ambiguous features. Semin Diagn Pathol. 2010;27(4):261–273. doi:10.1053/j.semdp.2010.09.003
12. Hussein YR, Soslow RA. Molecular insights into the classification of high-grade endometrial carcinoma. Pathology. 2018;50(2):151–161. doi:10.1016/j.pathol.2017.09.010
13. Tsoref D, Welch S, Lau S, et al. Phase II study of oral ridaforolimus in women with recurrent or metastatic endometrial cancer. Gynecol Oncol. 2014;135(2):184–189. doi:10.1016/j.ygyno.2014.06.033
14. Remmerie M, Janssens V. Targeted therapies in type II endometrial cancers: too little, but not too late. Int J Mol Sci. 2018;19(8):2380. doi:10.3390/ijms19082380
15. Oza AM, Pignata S, Poveda A, et al. Randomized Phase II trial of ridaforolimus in advanced endometrial carcinoma. J Clin Oncol. 2015;33(31):3576–3582. doi:10.1200/JCO.2014.58.8871
16. Matulonis U, Vergote I, Backes F, et al. Phase II study of the PI3K inhibitor pilaralisib (SAR245408; XL147) in patients with advanced or recurrent endometrial carcinoma. Gynecol Oncol. 2015;136(2):246–253. doi:10.1016/j.ygyno.2014.12.019
17. Powell MA, Sill MW, Goodfellow PJ, et al. A phase II trial of brivanib in recurrent or persistent endometrial cancer: an NRG Oncology/Gynecologic Oncology Group Study. Gynecol Oncol. 2014;135(1):38–43. doi:10.1016/j.ygyno.2014.07.083
18. Lee PS, Secord AA. Targeting molecular pathways in endometrial cancer: a focus on the FGFR pathway. Cancer Treat Rev. 2014;40(4):507–512. doi:10.1016/j.ctrv.2013.11.004
19. Howitt BE, Shukla SA, Sholl LM, et al. Association of polymerase e-mutated and microsatellite-instable endometrial cancers with neoantigen load, number of tumor-infiltrating lymphocytes, and expression of PD-1 and PD-L1. JAMA Oncol. 2015;1(9):1319–1323. doi:10.1001/jamaoncol.2015.2151
20. Duran-Sanchon S, Moreno L, Auge JM, et al. Identification and validation of microRNA profiles in fecal samples for detection of colorectal cancer. Gastroenterology. 2020;158(4):947–957.e4. doi:10.1053/j.gastro.2019.10.005
21. Polano M, Chierici M, Dal Bo M, et al. A pan-cancer approach to predict responsiveness to immune checkpoint inhibitors by machine learning. Cancers (Basel). 2019;11(10):1562. doi:10.3390/cancers11101562
22. Zhang K, Li H, Yan Y, et al. Identification of key genes and pathways between type I and type II endometrial cancer using bioinformatics analysis. Oncol Lett. 2019;18(3):2464–2476. doi:10.3892/ol.2019.10550
23. Thul PJ, Lindskog C. The human protein atlas: a spatial map of the human proteome. Protein Sci. 2018;27(1):233–244. doi:10.1002/pro.3307
24. Zhao Y, Du T, Du L, et al. Long noncoding RNA LINC02418 regulates MELK expression by acting as a ceRNA and may serve as a diagnostic marker for colorectal cancer. Cell Death Dis. 2019;10(8):568. doi:10.1038/s41419-019-1804-x
25. Tian J, Cui P, Li Y, et al. LINC02418 promotes colon cancer progression by suppressing apoptosis via interaction with miR-34b-5p/BCL2 axis. Cancer Cell Int. 2020;20:460. doi:10.1186/s12935-020-01530-2
26. Han B. LncRNA LINC02418 regulates proliferation and apoptosis of non-small cell lung cancer cells by regulating miR-4677-3p/SEC61G. Eur Rev Med Pharmacol Sci. 2019;23(23):10354–10362. doi:10.26355/eurrev_201912_19673
27. Wang T, Zhai R, Lv X, Wang K, Xu J. LINC02418 promotes malignant behaviors in lung adenocarcinoma cells by sponging miR-4677-3p to upregulate KNL1 expression. BMC Pulm Med. 2020;20(1):217. doi:10.1186/s12890-020-01229-0
28. Feig LA. Regulation of neuronal function by Ras-GRF exchange factors. Genes Cancer. 2011;2(3):306–319. doi:10.1177/1947601911408077
29. Calvo F, Sanz-Moreno V, Agudo-Ibanez L, et al. RasGRF suppresses Cdc42-mediated tumour cell movement, cytoskeletal dynamics and transformation. Nat Cell Biol. 2011;13(7):819–826. doi:10.1038/ncb2271
30. Takamaru H, Yamamoto E, Suzuki H, et al. Aberrant methylation of RASGRF1 is associated with an epigenetic field defect and increased risk of gastric cancer. Cancer Prev Res (Phila). 2012;5(10):1203–1212. doi:10.1158/1940-6207.CAPR-12-0056
31. Sato T, Yoneyama T, Tobisawa Y, et al. Core 2 beta-1, 6-N-acetylglucosaminyltransferase-1 expression in prostate biopsy specimen is an indicator of prostate cancer aggressiveness. Biochem Biophys Res Commun. 2016;470(1):150–156. doi:10.1016/j.bbrc.2016.01.011
32. Hatakeyama S, Kyan A, Yamamoto H, et al. Core 2 N-acetylglucosaminyltransferase-1 expression induces aggressive potential of testicular germ cell tumor. Int J Cancer. 2010;127(5):1052–1059. doi:10.1002/ijc.25117
33. Tsuboi S, Hatakeyama S, Ohyama C, Fukuda M. Two opposing roles of O-glycans in tumor metastasis. Trends Mol Med. 2012;18(4):224–232. doi:10.1016/j.molmed.2012.02.001
34. Tsuboi S, Sutoh M, Hatakeyama S, et al. A novel strategy for evasion of NK cell immunity by tumours expressing core2 O-glycans. EMBO J. 2011;30(15):3173–3185. doi:10.1038/emboj.2011.215
35. Seagle BL, Eng KH, Yeh JY, et al. Discovery of candidate tumor biomarkers for treatment with intraperitoneal chemotherapy for ovarian cancer. Sci Rep. 2016;6:21591. doi:10.1038/srep21591
36. Clevers H. Wnt/beta-catenin signaling in development and disease. Cell. 2006;127(3):469–480. doi:10.1016/j.cell.2006.10.018
37. Santiago L, Daniels G, Wang D, Deng FM, Lee P. Wnt signaling pathway protein LEF1 in cancer, as a biomarker for prognosis and a target for treatment. Am J Cancer Res. 2017;7(6):1389–1406.
38. Shelton DN, Fornalik H, Neff T, et al. The role of LEF1 in endometrial gland formation and carcinogenesis. PLoS One. 2012;7(7):e40312. doi:10.1371/journal.pone.0040312
39. Huang X, Zhong R, He X, et al. Investigations on the mechanism of progesterone in inhibiting endometrial cancer cell cycle and viability via regulation of long noncoding RNA NEAT1/microRNA-146b-5p mediated Wnt/beta-catenin signaling. IUBMB Life. 2019;71(2):223–234. doi:10.1002/iub.1959
40. Wu X, Han Y, Liu F, Ruan L. Downregulations of miR-449a and miR-145-5p act as prognostic biomarkers for endometrial cancer. J Comput Biol. 2020;27(5):834–844. doi:10.1089/cmb.2019.0215
41. Hu S, Zheng Q, Wu H, Wang C, Liu T, Zhou W. miR-532 promoted gastric cancer migration and invasion by targeting NKD1. Life Sci. 2017;177:15–19. doi:10.1016/j.lfs.2017.03.019
42. Cui Y, Gao D, Linghu E, et al. Epigenetic changes and functional study of HOXA11 in human gastric cancer. Epigenomics. 2015;7(2):201–213. doi:10.2217/epi.14.92
43. Zhang S, Wang Y, Dai SD, Wang EH. Down-regulation of NKD1 increases the invasive potential of non-small-cell lung cancer and correlates with a poor prognosis. BMC Cancer. 2011;11:186. doi:10.1186/1471-2407-11-186
44. Koch A, Waha A, Hartmann W, et al. Elevated expression of Wnt antagonists is a common event in hepatoblastomas. Clin Cancer Res. 2005;11(12):4295–4304. doi:10.1158/1078-0432.CCR-04-1162
 © 2021 The Author(s). This work is published and licensed by Dove Medical Press Limited. The full terms of this license are available at https://www.dovepress.com/terms.php and incorporate the Creative Commons Attribution - Non Commercial (unported, v3.0) License.
By accessing the work you hereby accept the Terms. Non-commercial uses of the work are permitted without any further permission from Dove Medical Press Limited, provided the work is properly attributed. For permission for commercial use of this work, please see paragraphs 4.2 and 5 of our Terms.
© 2021 The Author(s). This work is published and licensed by Dove Medical Press Limited. The full terms of this license are available at https://www.dovepress.com/terms.php and incorporate the Creative Commons Attribution - Non Commercial (unported, v3.0) License.
By accessing the work you hereby accept the Terms. Non-commercial uses of the work are permitted without any further permission from Dove Medical Press Limited, provided the work is properly attributed. For permission for commercial use of this work, please see paragraphs 4.2 and 5 of our Terms.