")
Back to Journals » Journal of Hepatocellular Carcinoma » Volume 7
Exploring Metabolic Consequences of CPS1 and CAD Dysregulation in Hepatocellular Carcinoma by Network Reconstruction
Authors Dumenci OE, U AMR , Khan SA , Holmes E, Taylor-Robinson SD
Received 18 November 2019
Accepted for publication 19 December 2019
Published 7 January 2020 Volume 2020:7 Pages 1—9
DOI https://doi.org/10.2147/JHC.S239039
Checked for plagiarism Yes
Review by Single anonymous peer review
Peer reviewer comments 2
Editor who approved publication: Dr Ahmed Kaseb
Ozbil E Dumenci, Abellona MR U, Shahid A Khan, Elaine Holmes, Simon D Taylor-Robinson
Imperial College London, London, UK
Correspondence: Abellona MR U
Imperial College London, 660 Sir Alexander Fleming Building, London SW7 2AZ, UK
Tel +44 7428 274231
Email [email protected]
Purpose: Hepatocellular carcinoma (HCC) is the fourth commonest cause of cancer-related mortality; it is associated with various genetic alterations, some involved in metabolic reprogramming. This study aimed to explore the potential metabolic impact of Carbamoyl Phosphate Synthase I (CPS1) and carbamoyl phosphate synthetase/aspartate transcarbamoylase/dihydroorotase (CAD) dysregulation through the reconstruction of a network that integrates information from the Kyoto Encyclopedia of Genes and Genomes (KEGG) database, Human Metabolome Database (HMDB) and Human Protein Atlas (HPA).
Methods and results: Existing literature was used to determine the roles of CPS1 and CAD in HCC. CPS1 downregulation is thought to play a role in hepatocarcinogenesis through an increased glutamine availability for de novo pyrimidine biosynthesis, which CAD catalyzes the first three steps for. KEGG, HMDB and HPA were used to reconstruct a network of relevant pathways, demonstrating the relationships between genes and metabolites using the MetaboSignal package in R. The network was filtered to exclude any duplicates, and those greater than three steps away from CPS1 or CAD. Consequently, a network of 18 metabolites, 28 metabolic genes and 1 signaling gene was obtained, which indicated expression profiles and prognostic information of each gene in the network.
Conclusion: Information from different databases was collated to form an informative network that integrated different “-omics” approaches, demonstrating the relationships between genetic and metabolic components of urea cycle and the de novo pyrimidine biosynthesis pathway. This study paves the way for further research by acting as a template to investigate the relationships between genes and metabolites, explore their potential roles in various diseases and aid the development of new screening and treatment methods through network reconstruction.
Keywords: metabonomics, reprogramming, bioinformatics, liquid biopsy, hepatocytes
Introduction
Hepatocellular carcinoma (HCC) is the most prevalent primary liver cancer. The latest GLOBOCAN data have estimated HCC to be the 4th biggest cause of global cancer-related mortality, accounting for 8.2% of all cancer-related deaths. Over 80% of HCC cases occur in sub-Saharan Africa and in Eastern Asia. However, HCC cases have also been increasing in low-incidence areas, such as the United States.1,2
Chronic liver inflammation of any underlying cause results in a cycle of necrosis and regeneration, leading to chromosomal instability and the accumulation of reactive oxygen species and inflammatory cytokines, resulting in genetic and epigenetic alterations.3–5 Although the main risk factors vary between regions, chronic hepatitis B infection and aflatoxin B1 exposure are key determinants in high-risk areas.1–3 The increasing prevalence of obesity is thought to contribute to the increasing HCC incidence in low-risk areas.1
The development of HCC is a multi-step process involving genetic and environmental interactions. Amongst the 26 genes identified recently to be frequently mutated in HCC by The Cancer Genome Atlas (TCGA) Research Network, several genes have been linked to metabolic reprogramming, such as the APOB, CTNNB1 and CPS1 genes.6
Carbamoyl Phosphate Synthetase I (CPS1) is an enzyme found in the mitochondrion, responsible for catalyzing the first and rate-limiting step of the hepatic urea cycle, critical for the removal of excess urea from cells.7,8 There is evidence to suggest that CPS1 downregulation may play a critical role in the development of HCC in 5.92% of liver cancer cases according to TCGA.6,9,10
Networks are bioinformatic tools that are increasingly used to visualize relationships within biological systems, such as those between genes and their products.11 MetaboSignal (http://bioconductor.org/packages/release/bioc/html/MetaboSignal.html) is an R package which allows the development of networks that demonstrate the relationships between genes and metabolites through utilizing the information available from the Kyoto Encyclopaedia of Genes and Genomes (KEGG) database.12,13 In addition, information from other databases such as the Human Protein Atlas (HPA) and the Human Metabolome Database (HMDB) can be merged for the first time to be demonstrated in a single informative network that integrates various “-omics” approaches.6,14
This study aimed to identify the evidence for CPS1 and carbamoyl phosphate synthetase/aspartate transcarbamoylase/dihydroorotase (CAD) dysregulation in HCC based on existing literature and explore their metabolic impact through the reconstruction of a network that integrates information from the KEGG, HPA and HMDB databases.
Methods
Literature Review
A literature search was conducted to explore the mechanism behind the metabolic roles of both CPS1 and CAD, both in normal metabolism and in HCC. This was limited to articles in English. Additional information available from the European Molecular Biology Laboratory, HMDB and KEGG databases regarding CPS1 and CAD was also obtained.
Reconstruction of MetaboSignal Network
MetaboSignal is an R (R Development Core Team, Auckland, New Zealand) package that utilizes the KEGG database to reconstruct comprehensive networks exploring relationships between genes and metabolites. In order to reconstruct the network, the KEGG database was used to identify the metabolic pathways in which CPS1 and CAD are involved, resulting in selecting the pyrimidine metabolism, arginine biosynthesis and alanine, aspartate and glutamate metabolism pathways, which were then merged, and any duplicates were removed. Distances of each metabolite node from CPS1 and CAD were calculated and those that were greater than three steps away were disregarded for simplification purposes. This ability was granted through a MetaboSignal function, although since there was no evident use of this function in published data, the maximum number of steps was determined through trial and error, as any lower number of steps oversimplified the network, while higher resulted in networks that were complicated, resulting in networks that would not allow for any useful inferences. A node table (a list of all metabolites and genes in the network) and an edge table (a list of all connections between the genes and the metabolites i.e. the nodes) were created. Data which indicated the expression profiles of genes within the network in hepatocytes, and provided prognostic information based on patient survival and mRNA level correlation based on data from TCGA, HPA version 19 and Ensembl version 92.38 were incorporated into the nodes table. This data was obtained directly from tissue samples.15,16 Genes indicative of prognosis were identified as those with log rank p values less than 0.001 in Kaplan-Meier analysis. Those with a significantly lower number of overall survival than expected were labelled as “unfavorable” and vice versa. Data from HMDB were used to annotate whether each metabolite that was included in the network could be detected in normal and abnormal urine. The R script used to achieve these steps can be found in Supplementary Material I.
Cytoscape v3.7.0 (Institute for Systems Biology, Seattle, WA, USA) was used to visualize the network produced. The nodes represent each unit within the network (i.e. the metabolites and the genes), and were visualized as points. The edges, visualized as lines, represent the interactions between each node. The node table was used to manually filter out the genes that were not expressed in hepatocytes. Consequently, any nodes that were no longer connected to the network, and any gene nodes that were not connected to a minimum of two metabolic nodes were also filtered out as genes only connected to a single metabolite would not represent a complete reaction.
Results
Evidence for the Role of CPS1 and CAD in HCC
CPS1 is a liver-specific enzyme responsible for catalyzing the first step of the urea cycle, converting ammonium into carbamoyl phosphate.9 (Figure 1) The CPS1 gene is located on 2q35 on chromosome 2 and consist of 38 exons.17,18
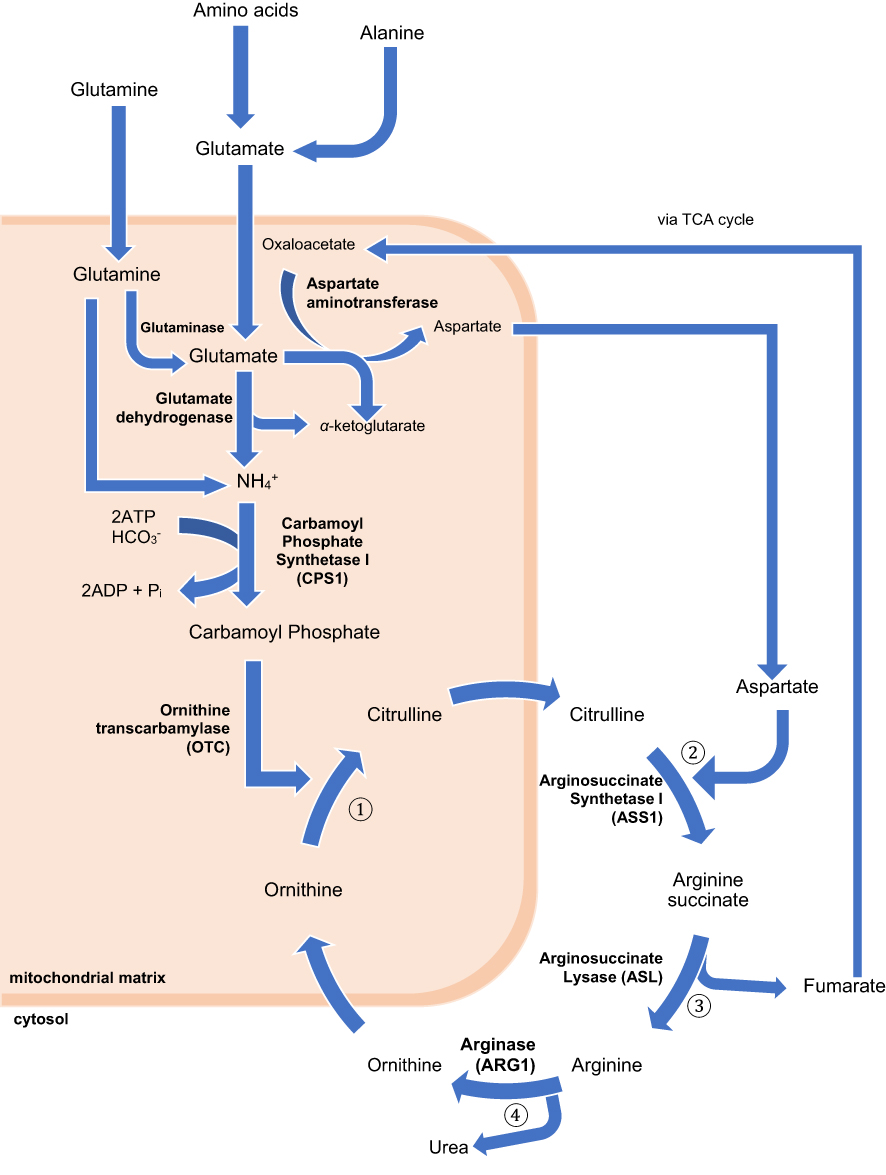 |
Figure 1 The urea cycle. The process begins in the liver mitochondrial matrix although some steps take place in the cytoplasm. During the metabolic breakdown of amino acids, most commonly, the cleaved amino group is transferred to α-ketoglutarate to form glutamate. Ammonia formed elsewhere can be transported to the liver to partake in the urea cycle in two ways; either as the amino group of alanine, if from skeletal muscle, or the amide nitrogen of glutamine, if formed in other tissues. Regardless of the source, all NH4+ generated within the mitochondria are used, together with CO2 and ATP to form carbamoyl phosphate, catalyzed by CPS1. This enters the urea cycle and initiates the four-step urea cycle. ① Ornithine and carbamoyl phosphate form citrulline, which passes into the cytosol. This is catalyzed by ornithine transcarbamylase (OTC) ② Formation of arginine succinate from a citrulline-aspartate intermediate, as catalyzed by arginosuccinate synthetase I (ASS1). The aspartate used in this step is generated via the action of aspartate aminotransferase on glutamate in the mitochondrial matrix. ③ Formation of arginine from arginine succinate. This leads to the release of fumarate, which enters the citric acid cycle. ④ Arginine is converted to ornithine by arginase (ARG1), also generating urea. Ornithine generated in this process moves from the cytosol to the mitochondrial matrix, allowing the continuation of the cycle.8 |
CAD encodes a trifunctional protein involved in the first three steps of de novo pyrimidine synthesis (Figure 2). Carbamoyl phosphate synthetase II (CPS2), the first component of CAD, is the cytosolic isoform of CPS1, carrying out the rate-limiting step of this process.6,19
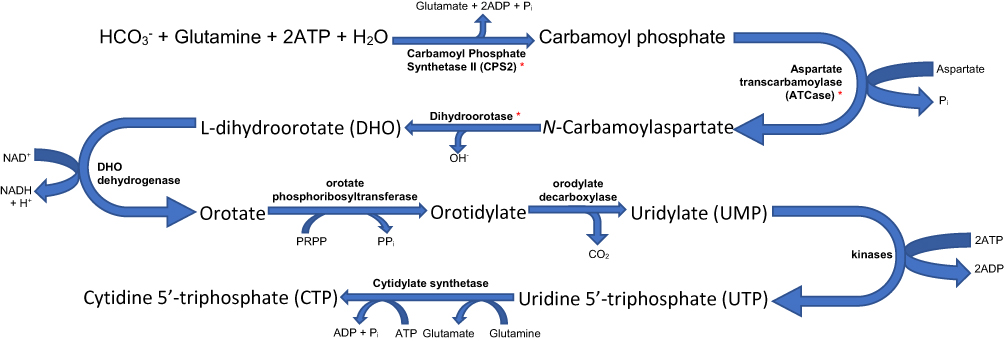 |
Figure 2 De novo pyrimidine biosynthesis pathway. Carbamoyl Phosphate Synthetase II (CPS2), the cytosolic form of the enzyme CPS1 found in the mitochondrial matrix taking part in the urea cycle, catalyses the reaction leading to the formation of carbamoyl phosphate from HCO3−, glutamine, ATP and water. The generated carbamoyl phosphate and aspartate are used to generate pyrimidines though the steps as seen above. Note that thymidine 5ʹ-triphosphate (TTP), another pyrimidine is generated from CTP. Those marked * are components of the CAD complex.8,25,26 |
Network Reconstruction
Upon merging the pyrimidine metabolism, arginine biosynthesis and alanine, aspartate and glutamate metabolism pathways, removing duplicates, and filtering out nodes more than 3 steps away from CPS1 or CAD, a directed network of 71 nodes (20 metabolites, 47 metabolic genes and 4 signalling genes) and 138 edges (the connections between the genes and the metabolites) was obtained.
Following further filtering of genes not expressed in hepatocytes and nodes with a lack of connection to the network as described in 3.2, a final network with 47 nodes (19 metabolites, 27 metabolic genes and 1 signaling gene) and 74 edges was obtained (Figure 4) (Supplementary Material II), which successfully displayed the connection between the urea cycle and de novo pyrimidine synthesis, and thus CPS1 and CAD.
The data from the TCGA and HPA which indicated expression profiles provided prognostic information was from 365 patients. (Table 1)15,16
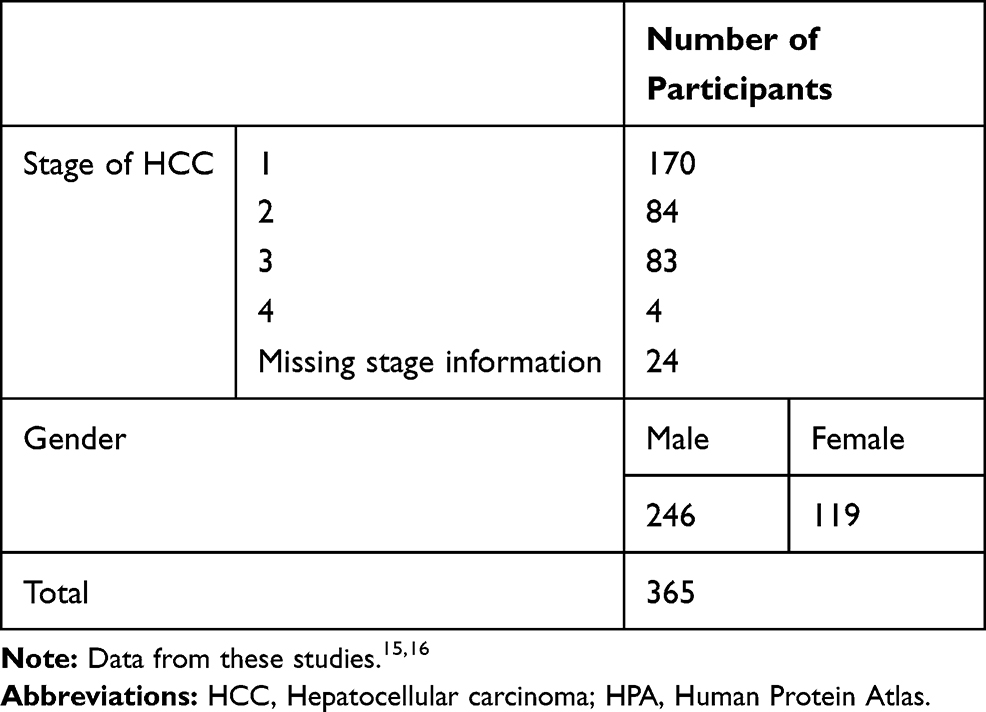 |
Table 1 Table Summarizing Clinicopathological Information for the HPA Dataset |
Moreover, the network showed that an increased expression of CPS1 was associated with a favorable prognosis (p=6.93x10⁻⁵), and an increased expression of CAD was associated with an unfavorable prognosis (p=1.72x10⁻¹¹) based on data from HPA.
Discussion
Metabonomics is the analysis of biological samples to determine composite biochemical profiles that reflect the metabolic status of an individual.20 Although in research “-omics” approaches are often investigated individually, they are intrinsically interlinked.21 This study was the first of its kind to develop a network displaying the interactions between genes and metabolites by using information from various databases. The network was used to investigate the role of CPS1, which codes for a protein that catalyzes the first step of the urea cycle, and CAD, which codes for a trifunctional protein catalyzing the first three steps of de novo pyrimidine biosynthesis pathway, in normal metabolism, and in turn, metabolic reprogramming in HCC.7,8,22–25
A downregulation of CPS1 has frequently been associated with HCC in literature.7,8,22 The upregulation of CAD in HCC, which has been previously reported, was hypothesized to be linked to the downregulation in CPS1 through an increased availability of glutamine due to the halting of urea cycle.23–25 This study aimed to develop a network which explored the relationships between genes and metabolites in disease, and to test the applicability of such networks, using CPS1 and CAD in HCC as an example, and using information from KEGG, HMDB and HPA to develop the network.
Identification of CPS1 as Candidate Gene
Each gene that was identified to be a candidate for analysis for the purpose of this study has been identified to be involved in metabolic reprogramming in HCC.
Truncated mutations of APOB are speculated to result in decreased very low-density lipoprotein synthesis, diverting energy into cancer-related metabolic pathways.27,28 Activation of CTNNB1 is thought to rewire fatty acid catabolism, resulting in reduced lipogenesis and increased use of fatty acids as an energy source.29,30 Silencing of CPS1 in HCC is linked to an in increased CAD expression, leading to increased pyrimidine synthesis, allowing for increased cell proliferation.6
The choice of investigating CPS1 for the purpose of this research was made upon considering several factors. Most importantly, literature review provided sufficient evidence that CPS1 is commonly downregulated in HCC, with TCGA reporting CPS1 abnormalities in 5.92% of liver cancer cases.6 A study theorized that the downregulation of CPS1 in HCC may be due to the loss of differentiation in hepatocytes, but this was excluded, since other liver-specific genes were found to be adequately expressed.9
A 2011 study by Liu et al has found that instead of traditional CpG islands, the CPS1 gene possesses two CpG dinucleotides. The hypermethylation of these dinucleotides are closely linked to the downregulation of CPS1 in HCC. The same study was able to conclude that CPS1 was under-expressed in cirrhotic liver tissue compared to healthy samples. Liu et al therefore concluded that CPS1 methylation may be a suitable early biomarker for HCC.9
The downregulation of CPS1 has been found to halt the urea cycle, diverting the amino acids involved in this process (glutamine, and glutamate, which can be converted to glutamine by glutamine synthetase) to initiate de novo pyrimidine synthesis through the action of the trifunctional protein coded by CAD, which may be upregulated in CPS1-silenced-HCC (Figure 3).6,23–25 TCGA has reported a 2.8-fold increase and a 2.1-fold decrease in CAD and CPS1 RNA levels in HCC compared to normal hepatocytes respectively, with CAD abnormalities reported in 3.50% of liver cancers.6
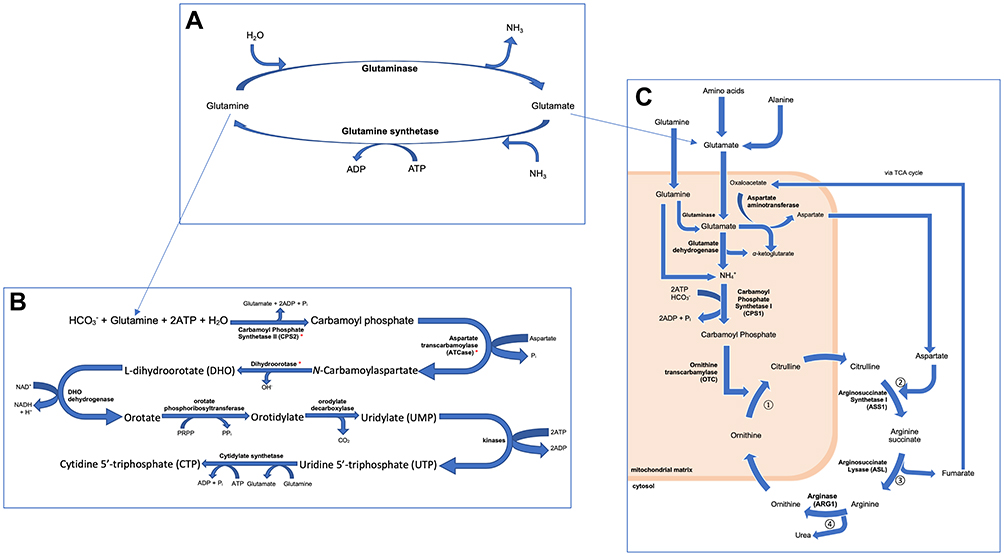 |
Figure 3 Figure summarising the role of (A) glutamine and glutamate synthesis, in (B) de novo pyrimidine biosynthesis and (C) the urea cycle. These pathways are thought to be intrinsically linked, as demonstrated in this figure. Consequentially, it was hypothesised that a downregulation in CPS1 in HCC would result in an increased availability of glutamine for the biosynthesis of pyrimidines, favouring cell division, therefore promoting the development of HCC. Those marked with * in (B) are the individual components of the CAD complex, which are thought to be upregulated in HCC. |
Despite the evidence supporting the involvement of CPS1 in HCC, there appears to be a gap in the understanding of the mechanism behind this process. Additionally, the other identified potential candidate genes such as APOB and CTNNB1 are involved in signaling pathways, activation and/or deactivating other genes, while CPS1 is directly involved in metabolism, thus is less prone to potential confounding due to the involvement of other genes within signaling pathways.28,26
Network Filtering
It is important to note that the final network has undergone various steps of filtering, most notably to only include metabolites at most three steps from CPS1 and CAD. Although this step has allowed for the much-needed simplification of the network, it has also filtered out a considerable number of nodes that may have been relevant to the study. While it can be argued that a more concise network can be easier to comprehend and thus be more informative, and that the further away from the target genes, the more likely that the concentrations of metabolites would be more prone to confounding, various nodes directly involved in the urea cycle, and more notably, in de novo pyrimidine synthesis (only the first 4 steps of the 8 step process demonstrated in Figure 3 can be located in the network) have been removed as a result of the filtering process.
CPS1, CAD and Prognosis
The data integrated from HPA allowed the network to display how an increased expression of the genes influenced the prognosis of patients.14–16 Interestingly, an increased expression of CPS1 was linked with a significantly more favorable prognosis (p=6.93x10⁻⁵) whereas an increased expression of CAD was linked with a significantly less favorable prognosis (p=1.72x10⁻¹¹).
Both CPS1 and CAD have been well established to play important roles in the development of HCC, mainly due to their relation to de novo pyrimidine synthesis.8,22–25 Although the same mechanism could also be linked to the effects of increased expression of CPS1 and CAD on prognosis, by speeding up and slowing down cell proliferation respectively, no work has been done to investigate whether this is the case.
Although information regarding each individual pathway is freely available on KEGG, this is the first study to not only combine these several pathways using information from KEGG to form a network such as the one demonstrated in Figure 4, but also incorporate information from different databases such as HPA and HMDB, allowing for a comprehensive and informative approach regarding prognosis, disease associations and detection concentrations. However, the network was filtered to only include genes expressed in normal hepatocytes, which may differ to those expressed in HCC. This may have potentially resulted in metabolites relevant in HCC to be filtered out due to their lack of expression in healthy hepatocytes.
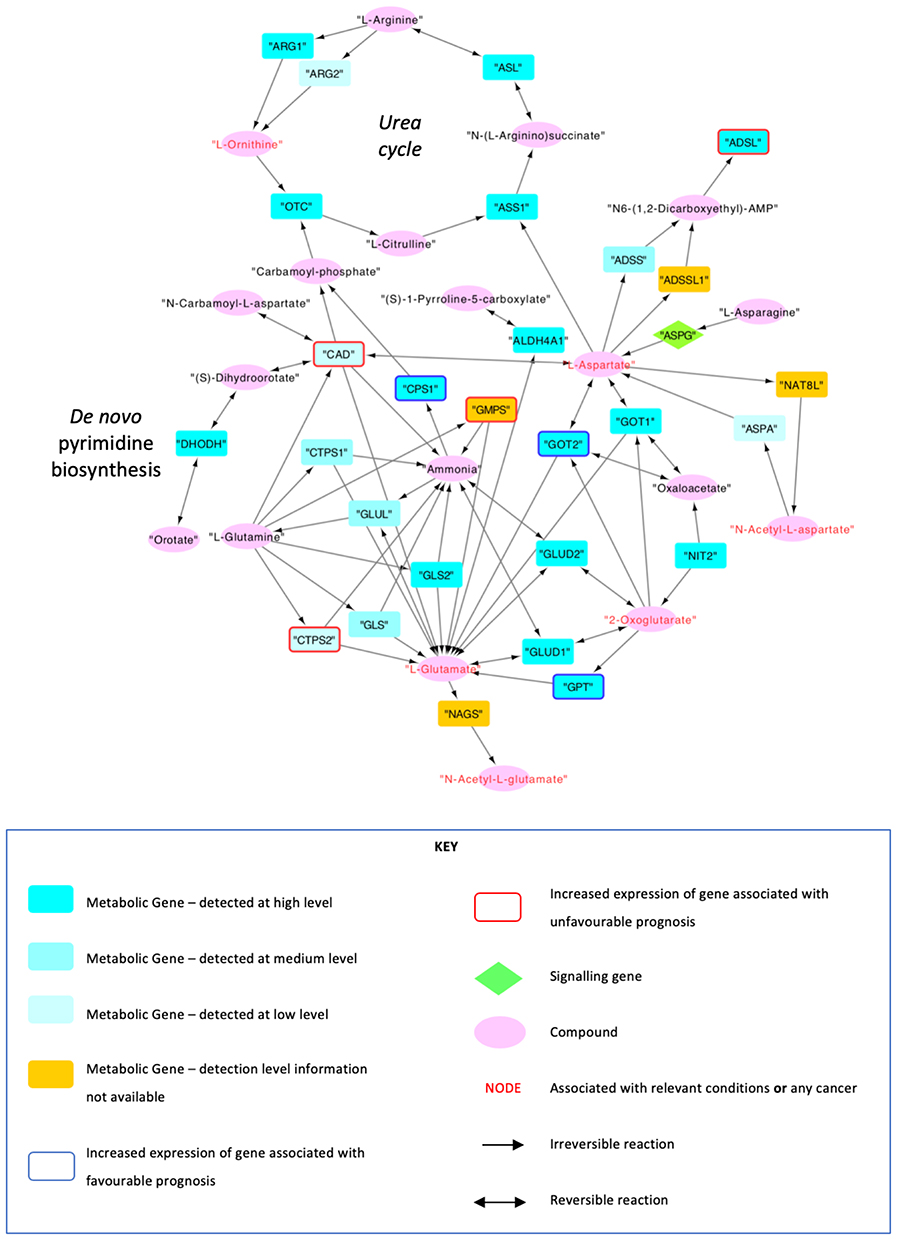 |
Figure 4 Network that was formed using data from KEGG, HPA and HMDB. The nodes were filtered to be at a maximum distance of 3 steps from CPS1 and CAD, to show metabolites that are expressed in hepatocytes, and to genes that are connected to at least two metabolites. Data from TCGA and HPA were used to indicate whether any nodes were associated with any relevant conditions and cancers. The genes that were associated with favourable and unfavourable prognoses upon upregulation at an RNA level were also labelled using data from TCGA and HPA. |
Future confirmatory work should extend this study into case-control analyses by validating the findings of the network through a metabonomic approach, investigating the metabolites within the network. This can be achieved by obtaining urine, serum and tissue samples from healthy volunteers, a cirrhosis cohort with a HCC cohort, and comparing the concentrations of the metabolites in the network that were found within the samples following a rigorous metabolite annotation process, which would allow to draw conclusions regarding the selected genes’ and the metabolites’ roles in HCC.
Alpha-fetoprotein (AFP) is the most widely available tumor biomarker used in the detection of HCC. However, a serious limitation of AFP in its diagnostic use is its unsatisfactory sensitivity and specificity at the designated cut-off value of 20 ng/mL, resulting in a need to utilize more invasive or radiological diagnostic methods to confirm the presence of HCC. Therefore, there is an urgent unmet need for a specific and sensitive biomarker in HCC, which can potentially be met through extending this study as noted.31
70–90% of HCC occurs on the background of chronic liver disease and cirrhosis, which is associated with different etiologies, such as chronic hepatitis B and hepatitis C infections, excessive consumption of alcohol, exposure to aflatoxin B1 and.2,32 Although research has been conducted to link specific mutations to individual etiologies in HCC, the extent of the findings from such research has been minimal.33 Methodology established by this study can be extended to determine whether the concentrations of any metabolite from the network differed in any underlying etiologies of HCC, which could allow conclusions to be reached regarding the role of specific genes such as CPS1 and CAD in different etiologies of HCC.
Conclusion
In summary, this study is the first to compile information from various databases such as HMDB, KEGG and HPA to form an informative network. The metabolic consequences of CPS1 and CAD alterations were investigated through the construction of a network combining urea cycle and the de novo pyrimidine biosynthesis pathways, two of the many metabolic pathways which are thought to play a role in the development of HCC. Through the development of a modifiable R script, the study paved the way for further research to be able to combine information from different databases further investigate the relationships between genes and metabolites. There is currently an unmet need for specific and sensitive biomarkers for screening for HCC. This study can not only act as a template to fill this gap by aiding in the development of new techniques, potentially non-invasively via urine samples, to screen for HCC and other conditions.
Abbreviations
HCC, Hepatocellular carcinoma; CPS1, Carbamoyl Phosphate Synthase I; KEGG, Kyoto Encyclopedia of Genes and Genomes; HMDB,Human Metabolome Database; HPA, Human Protein Atlas; CAD, Carbamoyl phosphate synthetase/aspartate transcarbamoylase/dihydroorotase; TCGA, The Cancer Genome Atlas; CPS2, Carbamoyl phosphate synthetase II.
Acknowledgments
All authors acknowledge the UK National Institute for Health Services Research (NIHR) Biomedical Facility at Imperial College London for infrastructure support. Abellona MR U was supported by a Fellowship from the STRATiGRAD Foundation. We also acknowledge the Wellcome Institutional Strategic Support Fund at Imperial College London for running costs for this study.
Disclosure
The authors report no conflicts of interest in this work.
References
1. Bray F, Ferlay J, Soerjomataram I, et al. Global cancer statistics 2018: GLOBOCAN estimates of incidence and mortality worldwide for 36 cancers in 185 countries. CA Cancer J Clin. 2018;68(8):394–424. doi:10.3322/caac.21492
2. El-Serag HB. Epidemiology of viral hepatitis and hepatocellular carcinoma. Gastroenterology. 2012;142(6):126–1273.e1. doi:10.1053/j.gastro.2011.12.061
3. Karagozian R, Derdák Z, Baffy G. Obesity-associated mechanisms of hepatocarcinogenesis. Metabolism. 2014;63(5):607–617. doi:10.1016/j.metabol.2014.01.011
4. Choi BI. Hepatocarcinogenesis in liver cirrhosis: imaging diagnosis. J Korean Med Sci. 1998;13:103–106. doi:10.3346/jkms.1998.13.2.103
5. Dhanasekaran R, Bandoh S, Roberts LR. Molecular pathogenesis of hepatocellular carcinoma and impact of therapeutic advances. F1000Res. 2016;5:879.
6. Ally A, Balasundaram M, Carlsen, et al. Comprehensive and integrative genomic characterization of hepatocellular carcinoma. Cell. 2017;169(7):1327–1341.e23. doi:10.1016/j.cell.2017.05.046
7. Maglott D, Ostell J, Pruitt KD, Tatusova T. Entrez gene: gene-centered information at NCBI. Nucleic Acids Res. 2005;33(Database issue):D54–D58. doi:10.1093/nar/gki031
8. Nelson DL, Cox MM. Chapter 18: amino acid oxidation and the production of urea. In: Ahr K, editor. Lehninger Principles of Biochemistry.
9. Liu H, Dong H, Robertson K, et al. DNA methylation suppresses expression of the urea cycle enzyme carbamoyl phosphate synthetase 1 (CPS1) in human hepatocellular carcinoma. Am J Pathol. 2011;178(2):652–661. doi:10.1016/j.ajpath.2010.10.023
10. Blanc JF, Lalanne C, Plomion C, et al. Proteomic analysis of differentially expressed proteins in hepatocellular carcinoma developed in patients with chronic viral hepatitis C. Proteomics. 2005;5(14):3778–3789. doi:10.1002/pmic.200401194
11. Pavlopoulos GA, Secrier M, Moschopoulos CN, et al. Using graph theory to analyze biological networks. BioData Min. 2011;4:10. doi:10.1186/1756-0381-4-10
12. Rodriguez-Martinez A, Ayala R, Posma JM, et al. MetaboSignal: a network-based approach for topological analysis of metabotype regulation via metabolic and signaling pathways. Bioinformatics. 2017;33(5):773–775. doi:10.1093/bioinformatics/btw697
13. Ogata H, Goto S, Sato K, et al. KEGG: kyoto encyclopedia of genes and genomes. Nucleic Acids Res. 1999;27(1):29–34. doi:10.1093/nar/27.1.29
14. Uhlén M, Fagerberg L, Hallström BM, et al. A tissue-based map of the human proteome. Science. 2015;347:6220.
15. The Cancer Genome Atlas Research Network, Weinstein JN, Collisson EA, et al. The cancer genome atlas pan-cancer analysis project. Nat Genet. 2013;45(10):1113–1120. doi:10.1038/ng.2764.
16. Uhlen M, Zhang C, Lee S, et al. A pathology atlas of the human cancer transcriptome. Science. 2017;357:6352. doi:10.1126/science.aan2507
17. Hoshide R, Soejima H, Ohta T, et al. Assignment of the human carbamyl phosphate synthetase I gene (CPS1) to 2q35 by fluorescence in situ hybridization. Genomics. 1995;28(1):124–125. doi:10.1006/geno.1995.1119
18. Häberle J, Schmidt E, Pauli S, et al. Gene structure of human carbamylphosphate synthetase 1 and novel mutations in patients with neonatal onset. Hum Mutat. 2003;21(4):444. doi:10.1002/humu.9118
19. Simmer JP, Kelly RE, Rinker AG, et al. Mammalian dihydroorotase: nucleotide sequence, peptide sequences, and evolution of the dihydroorotase domain of the multifunctional protein CAD. Proc Natl Acad Sci U S A. 1990;87(1):174–178. doi:10.1073/pnas.87.1.174
20. Xie J, Zhang A, Wang X. Metabolomic applications in hepatocellular carcinoma: toward the exploration of therapeutics and diagnosis through small molecules. RSC Adv. 2017;7(28):17217–17226. doi:10.1039/C7RA00698E
21. Hasin Y, Seldin M, Lusis A. Multi-omics approaches to disease. Genome Biol. 2017;18(1):15–83. doi:10.1186/s13059-017-1215-1
22. Rawitch AB. Chapter 19: biosynthesis and degradation of amino acids. In: Baynes JW, Dominiczac MH, editors. Medical Biochemistry.
23. Keshet R, Szlosarek P, Carracedo A, et al. Rewiring urea cycle metabolism in cancer to support anabolism. Nat Rev Cancer. 2018;18(10):634–645. doi:10.1038/s41568-018-0054-z
24. Still ER, Yuneva MO. Hopefully devoted to Q: targeting glutamine addiction in cancer. Br J Cancer. 2017;116(11):1375–1381. doi:10.1038/bjc.2017.113
25. Nelson DL, Cox MM. Chapter 22: biosynthesis of amino acids, nucleotides, and related molecules. In: Ahr K, editor. Lehninger Principles of Biochemistry.
26. Monga SP. Role of Wnt/Beta-Catenin signaling in liver metabolism and cancer. Int J Biochem Cell Biol. 2011;43(7):1021–1028. doi:10.1016/j.biocel.2009.09.001
27. Yamanaka S, Balestra ME, Ferrell LD, et al. Apolipoprotein B mRNA-editing protein induces hepatocellular carcinoma and dysplasia in transgenic animals. Proc Natl Acad Sci U S A. 1995;92(18):8483–8487. doi:10.1073/pnas.92.18.8483
28. Lee G, Jeong YS, Kim DW, et al. Clinical significance of APOB inactivation in hepatocellular carcinoma. Exp Mol Med. 2018;50:147. doi:10.1038/s12276-018-0174-2
29. Montagner A, Le Cam L, Guillou H. Β-catenin oncogenic activation rewires fatty acid catabolism to fuel hepatocellular carcinoma. Gut. 2019;68(2):183–185. doi:10.1136/gutjnl-2018-316557
30. Senni N, Savall M, Cabrerizo Granados D, et al. Β-catenin-activated hepatocellular carcinomas are addicted to fatty acids. Gut. 2019;68(2):322–334. doi:10.1136/gutjnl-2017-315448
31. Bialecki ES, Di Bisceglie AM. Diagnosis of hepatocellular carcinoma. HPB (Oxford). 2005;7(1):26–34. doi:10.1080/13651820410024049
32. Sanyal AJ, Yoon SK, Lencioni R. The etiology of hepatocellular carcinoma and consequences for treatment. Oncologist. 2010;15(Supplement 4):14–22. doi:10.1634/theoncologist.2010-S4-14
33. Palmirotta R, Lovero D, Cafforio P, et al. Liquid biopsy of cancer: a multimodal diagnostic tool in clinical oncology. Adv Med Oncol. 2018;10:1–24.
 © 2020 The Author(s). This work is published by Dove Medical Press Limited, and licensed under a Creative Commons Attribution License.
The full terms of the License are available at http://creativecommons.org/licenses/by/4.0/.
The license permits unrestricted use, distribution, and reproduction in any medium, provided the original author and source are credited.
© 2020 The Author(s). This work is published by Dove Medical Press Limited, and licensed under a Creative Commons Attribution License.
The full terms of the License are available at http://creativecommons.org/licenses/by/4.0/.
The license permits unrestricted use, distribution, and reproduction in any medium, provided the original author and source are credited.