")
Back to Journals » Patient Preference and Adherence » Volume 13
Exploring Medicines Burden Among Adults in New Zealand: A Cross-Sectional Survey
Authors Tordoff JM , Brenkley C, Krska J , Smith A
Received 16 September 2019
Accepted for publication 10 December 2019
Published 20 December 2019 Volume 2019:13 Pages 2171—2184
DOI https://doi.org/10.2147/PPA.S231202
Checked for plagiarism Yes
Review by Single anonymous peer review
Peer reviewer comments 2
Editor who approved publication: Dr Johnny Chen
June M Tordoff,1 Charlotte Brenkley,2 Janet Krska,3 Alesha Smith1
1School of Pharmacy, University of Otago, Dunedin, New Zealand; 2Karori Mall Pharmacy, Wellington, New Zealand; 3Medway School of Pharmacy, Universities of Greenwich and Kent, Chatham, Kent, UK
Correspondence: June M Tordoff
School of Pharmacy, University of Otago, PO Box 56, Dunedin 9054, New Zealand
Tel +64 3479 7275
Fax +64 3479 7034
Email [email protected]
Background: Using medicines regularly can be a burden for some people and can contribute to reduced adherence. In New Zealand, relatively few studies have examined people’s medicine-taking experiences and most involved older people, although medicine burden is also an issue for younger people. The UK-developed “Living with Medicines Questionnaire” (LMQ-3) is an instrument designed to quantify medicine burden.
Objective: The objective was to quantify medicines burden among New Zealand adults, using the LMQ-3, to identify any sub-populations with high medicine burden and to identify specific issues that may need to be addressed.
Setting: The study was set in New Zealand and included seven national patient support group websites, and five community pharmacies in Dunedin.
Methods: The survey was distributed to adults ≥18 years using ≥ one medicine for ≥3 months. LMQ-3 scores and domain scores were compared by patient characteristics using descriptive statistics and statistical tests.
Results: In total, 472 responses were analysed: 327/417 (78.4%) from patient support group websites and 145/360 (40.3%) from community pharmacies. Most commonly participants were female (295, 62.5%), ≥65 years (236, 50.0%), European (422, 89.4%), retired (232, 49.2%), university educated (203, 43.0%), used medicines independently (449, 95.1%), and paid for prescriptions (429, 90.9%). Most used <10 medicines (415, 87.9%) and <three times daily (356, 75.4%). From LMQ scores, 30.5% had a high burden (≥111). Regression analysis indicated that higher LMQ-3 scores were associated with those who were unemployed, aged 18–29 years, using ≥5 medicines, or using medicines <3 times a day (p<0.01). Burden was mainly driven by a perceived lack of autonomy over medicine regimens, or concerns about medicines and side effects.
Conclusion: Three quarters of New Zealand participants experienced moderate or high medicine burden. Being unemployed, aged 18–29 years, or using more (or more frequent) medicines, were associated with higher burden. These groups should become the target for interventions seeking to reduce medicine burden.
Keywords: medicines, treatment burden, long-term conditions, patients’ perspectives, side effects, New Zealand
Introduction
Chronic diseases are some of the world’s major health challenges and prescription medicines are commonly used for their treatment.1 Many people take multiple prescription medicines daily for such conditions and have described their positive and/or negative experiences.2,3 People experiencing polypharmacy (using ≥5 medicines)4 are at high risk of serious negative experiences, eg, adverse drug reactions and hospitalization.5 Furthermore, people’s beliefs about medicines, perhaps influenced by their own or other people’s experiences, can affect how they choose to use medicines (adherence),6–9 and poor adherence could compromise their health.10–12
For some people, using medicines is burdensome for various reasons; making it harder to use medicines as directed, and optimize their effects.13,14 Recent studies have described the work of taking medicines.13–15 In addition to managing their medicines and monitoring their effects, patients need to organize visits to their doctor/s, any relevant laboratory tests, and to feedback information to other healthcare providers.14
In the past two decades, survey tools have been developed to measure people’s beliefs about medicines, and their treatment burden. Notable ones are the Beliefs about Medicines Questionnaire (BMQ),16 the Treatment Satisfaction Questionnaire for Medication (TSQM),17 and the Treatment Burden Questionnaire (TBQ).18 More recently, as polypharmacy becomes widespread, a tool has been developed specifically to explore people’s medicines burden – the Living with Medicines Questionnaire (LMQ). The LMQ, a multi-item survey tool, was developed in the UK based on findings from a qualitative study.2 It has been validated, refined and revised and is now the LMQ-3.19 This tool has been used in the UK and other countries to examine people’s experiences of using medicines, and has been translated into other languages.8,9,19–22
In New Zealand, studies have examined people’s medicine-taking experiences and the issues involved; mainly in people ≥65 years.3,23,24 Medicines burden, however, could occur in any age group, so should be more widely explored. The findings from such a study could be used to help design interventions aiming to reduce medicine burden and support people to make the best use of their medicines.
Aims of the Study
To quantify medicines burden among New Zealand adults, using the LMQ-3, to identify any sub-populations with high medicine burden and to identify specific issues which may need to be addressed from the responses.
Ethics Approval
The University of Otago Ethics Committee approved the study (D17/315) and regarded completion of the questionnaire as consent to participate. Permission was obtained from the University of Kent to use the Living with Medicines Questionnaire v3, including use of the text in the publication.
Methods
Inclusion Criteria
The study included members of the public aged 18 years and over taking one or more prescription medicine for at least 3 months.
Sample Size Calculation
Recruiting 300 respondents with usable data was considered sufficiently precise to allow estimation of proportions overall with 95% CIs ± 0.06 (worst case, using Wald estimates) and estimate means overall with 95% CIs ± 0.12 SDs. For the smallest anticipated subgroup, those <30 years of age, n≥30 were expected, which would provide 95 CIs ± 0.18 for proportions (worst case) and ± 0.38 SDs.
The Survey Tool
The LMQ-3 consists of 41 statements positively or negatively worded on a 5-point Likert-type scale (strongly agree to strongly disagree).19 Reverse scoring is used for negatively worded questions so that higher scores reflect a higher burden/worse experience of medicines use. The degree of burden is categorized as: minimal (scores of 41–87), moderate (88–110) and high (≥111), based on data from an English population.19,20 Additionally, the LMQ-3 includes a visual analogue scale (VAS) measuring global burden on a scale from 1–10, an optional free-text question and a demographic section. The 41 statements comprise eight domains consisting of 3–7 questions per domain (eg, “Practical difficulties”). The sum of responses to each set of questions represents a “domain score”. The tool was adapted for New Zealand by modifying the list of ethnic groups, but was otherwise unchanged.
Survey Distribution
To ensure a diverse study population and wider access to the study, a mixed approach to survey distribution was used (i) via New Zealand patient support group websites, and (ii) via community pharmacies. Seven, of 22 websites contacted, assisted with the project. Six sites related to long-term conditions, eg, heart disease, and one to older people’s care. They provided accessible links to the questionnaire via their website and/or social media page and/or an electronic newsletter from December 2017 to March 2018. Community pharmacies were purposely selected from the Dunedin telephone directory to represent lower/middle/higher socioeconomic areas. Managers of the first five community pharmacies contacted agreed to their pharmacies being sites for survey distribution. CB distributed the survey during November/December 2017. She screened people for eligibility, explained the project and provided a copy of the survey, an information sheet, and a reply-paid envelope. The information sheet distributed provided a link to an online “community pharmacy” version of the questionnaire (identical to the website/hardcopy versions). Participants self-completed the survey in the pharmacy/at home.
Data Entry and Analysis
The LMQ-3 was hosted on Qualtrics© (Provo, UT). Links were provided for (i) the online survey, and (ii) the community pharmacy-based survey. Participants recruited via websites entered their data directly into Qualtrics©. CB entered the mailed community pharmacy responses into Qualtrics©. A 10% quality check of data entry was undertaken by JT and AS. All data were downloaded into Excel for analysis. Questionnaires with any unanswered statements were excluded from the analysis. Sub-group variables were coded numerically. Frequency of medicine use per participant was assigned to the highest category selected, eg, four or more times a day. Statistical tests were performed using Stata Version 11.2 (College Station, TX) and statistical significance was determined by p<0.05.
Participant characteristics and findings were compared between surveys using the Chi-squared test and t-test for independent samples, prior to merging of the data from the two recruitment methods. LMQ-3 scores were compared by participant characteristics using independent t-tests or One-way analysis of variance (ANOVA) (Table 1). Spearman correlation coefficients were used to assess correlations between LMQ-3 and VAS scores, and number of medicines and age of participants. Scale reliability for the eight LMQ‐3 domains was tested using Cronbach’s alpha (Table 2). In a domain analysis, participants’ responses to statements were categorized according to the number who indicated they “strongly agree/agree” OR “strongly disagree/disagree” OR had a neutral opinion (Table 2). The mean scores for each domain were compared by participant characteristics (Table 3); and divided by the maximum possible domain score to derive a “percentage maximum score” (Table 2). We hypothesized that medicine burden may be associated with age, ethnicity, employment, education level, the numbers or frequency of medicines used, requiring assistance with medicines use, or paying for prescription medicines.20,25,26 Data were examined for associations between these possible predictors and dependent variables (LMQ3 scores, domain scores) using simple and multiple linear regression. Categorical independent variables were developed for further analysis, eg, 18–29 years-old vs others; unemployed vs others; using ≥5 medicines vs others; and taking medicines ≥3 times per day vs others (Table A, supplementary data). Multiple linear regression was undertaken using all predictors with p<0.20 from simple linear regression models. Potential predictors were sequentially removed until only significant predictors remained. Statistical significance was determined by p<0.05 (Tables 4 and 5; and Tables B-H in supplementary data).
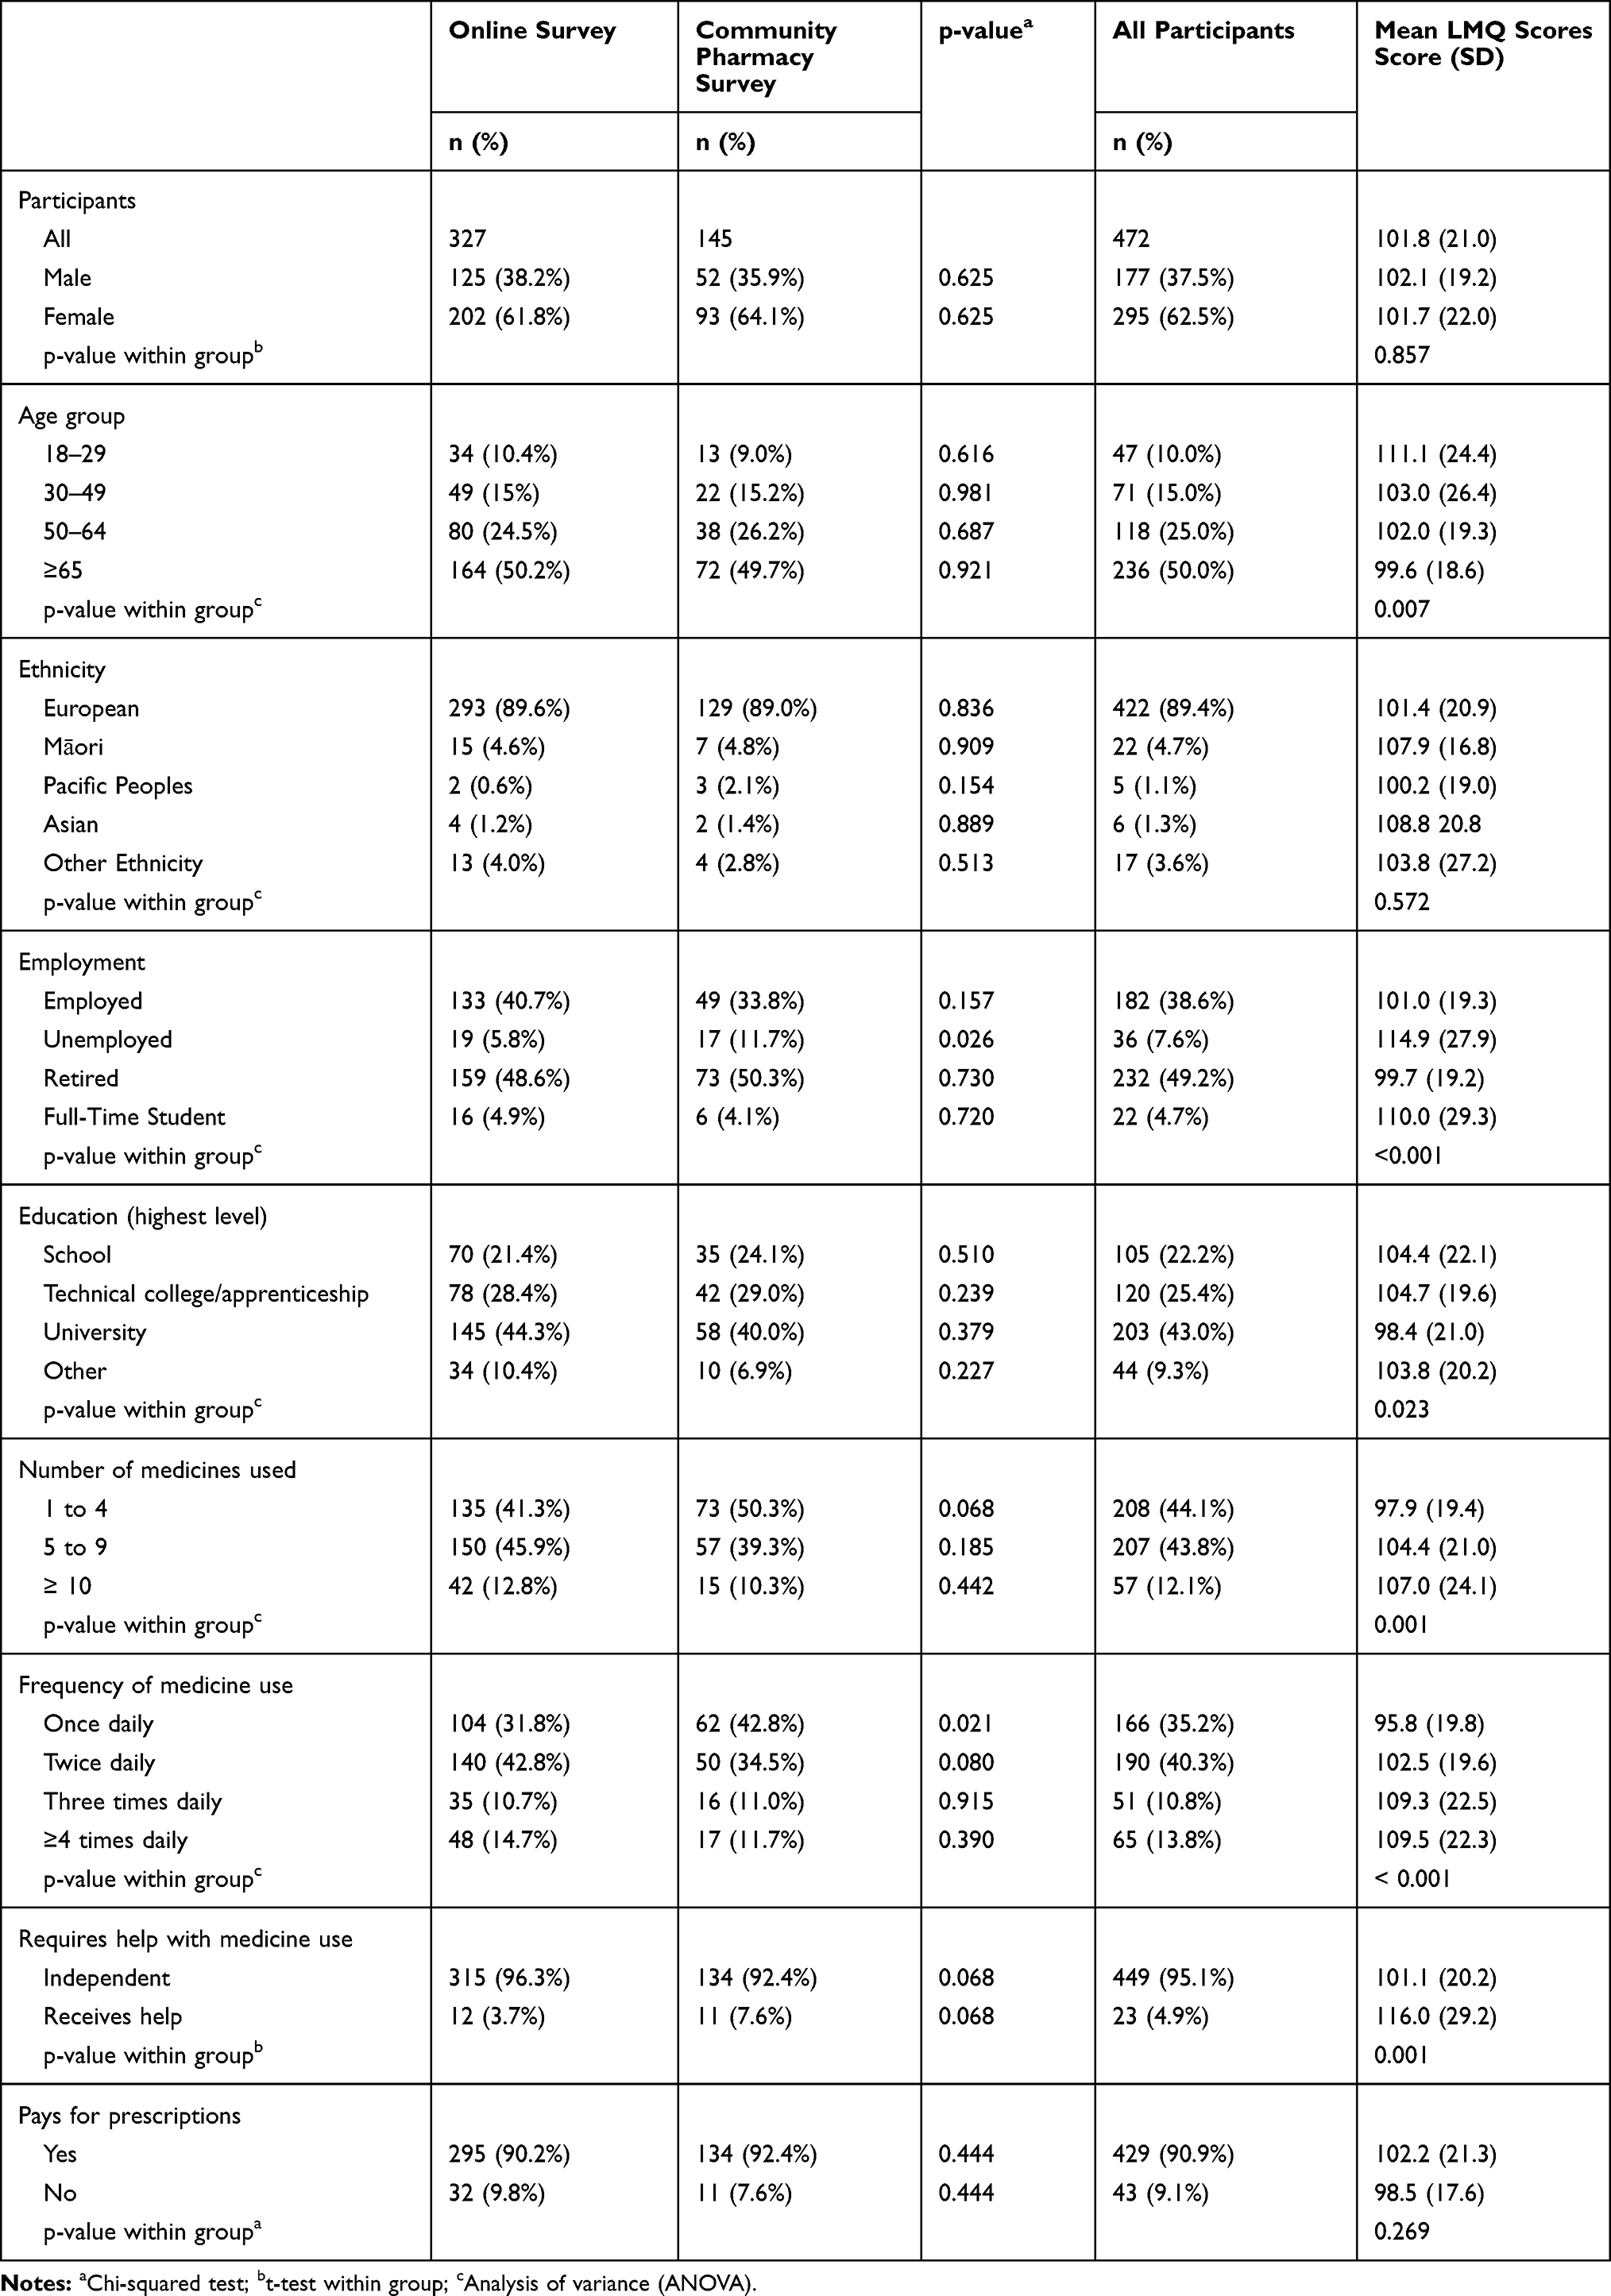 |
Table 1 Participant Characteristics and Mean LMQ Scores |
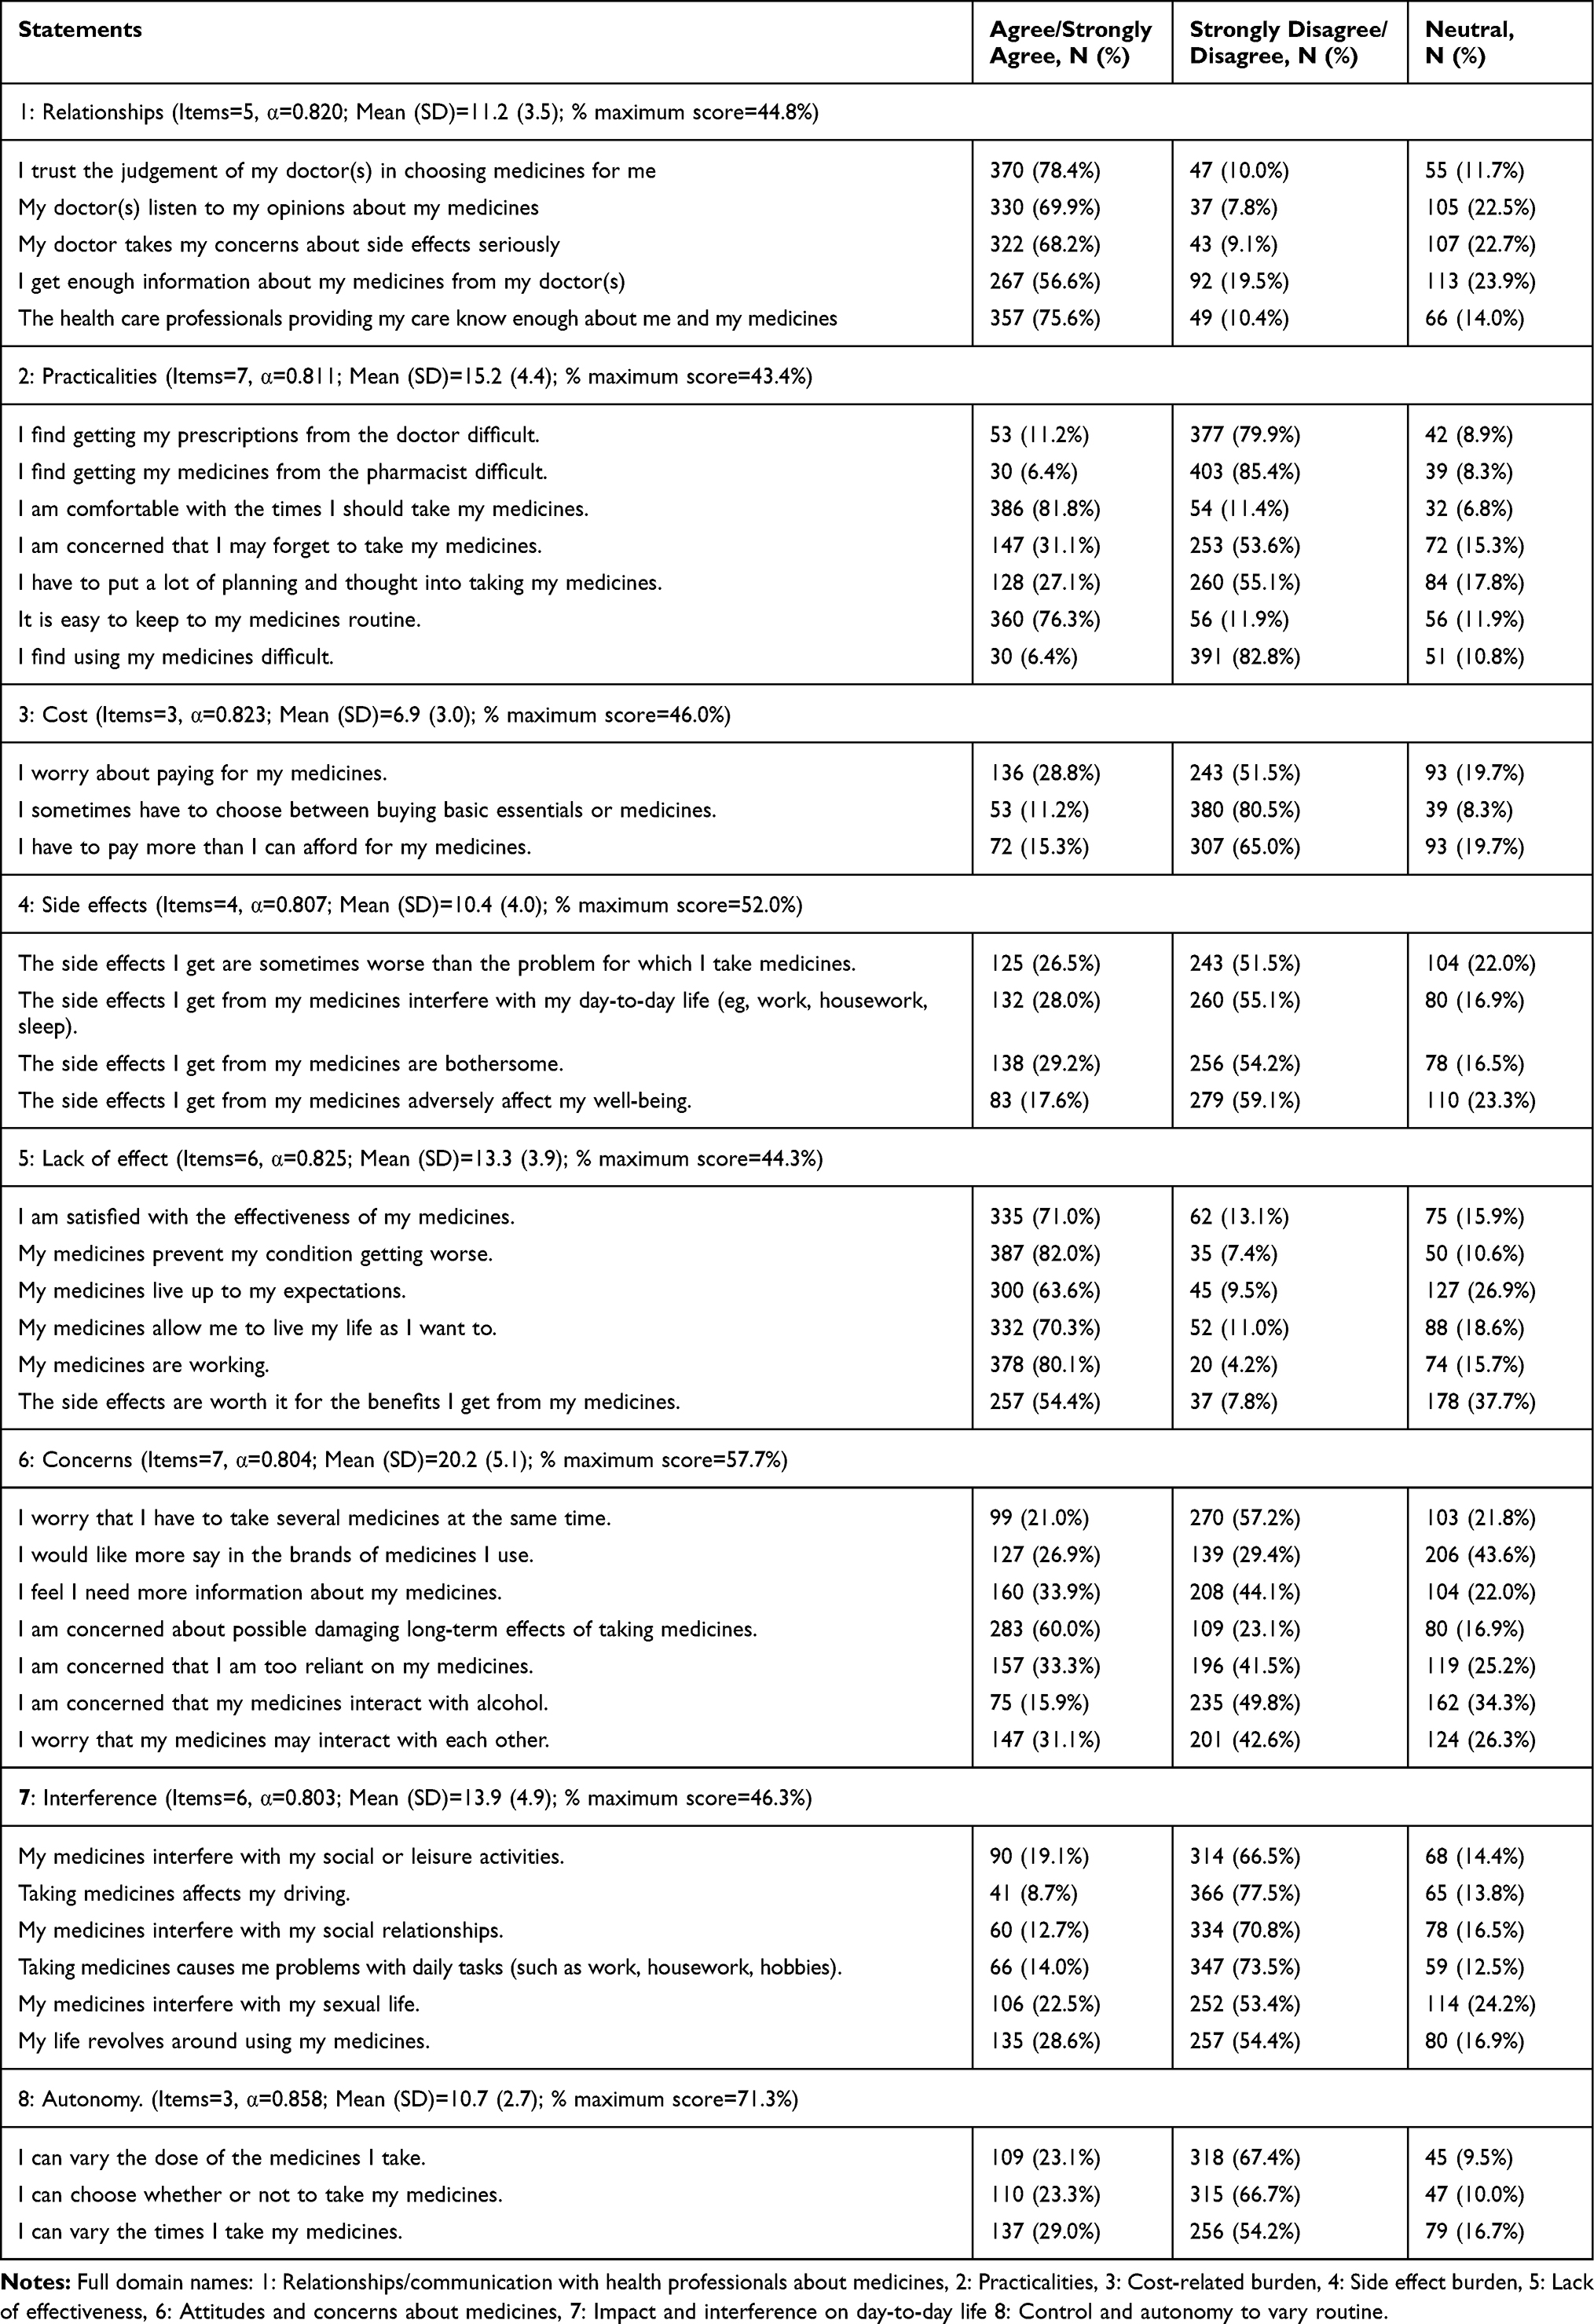 |
Table 2 Domain Analysis. Responses to Statements |
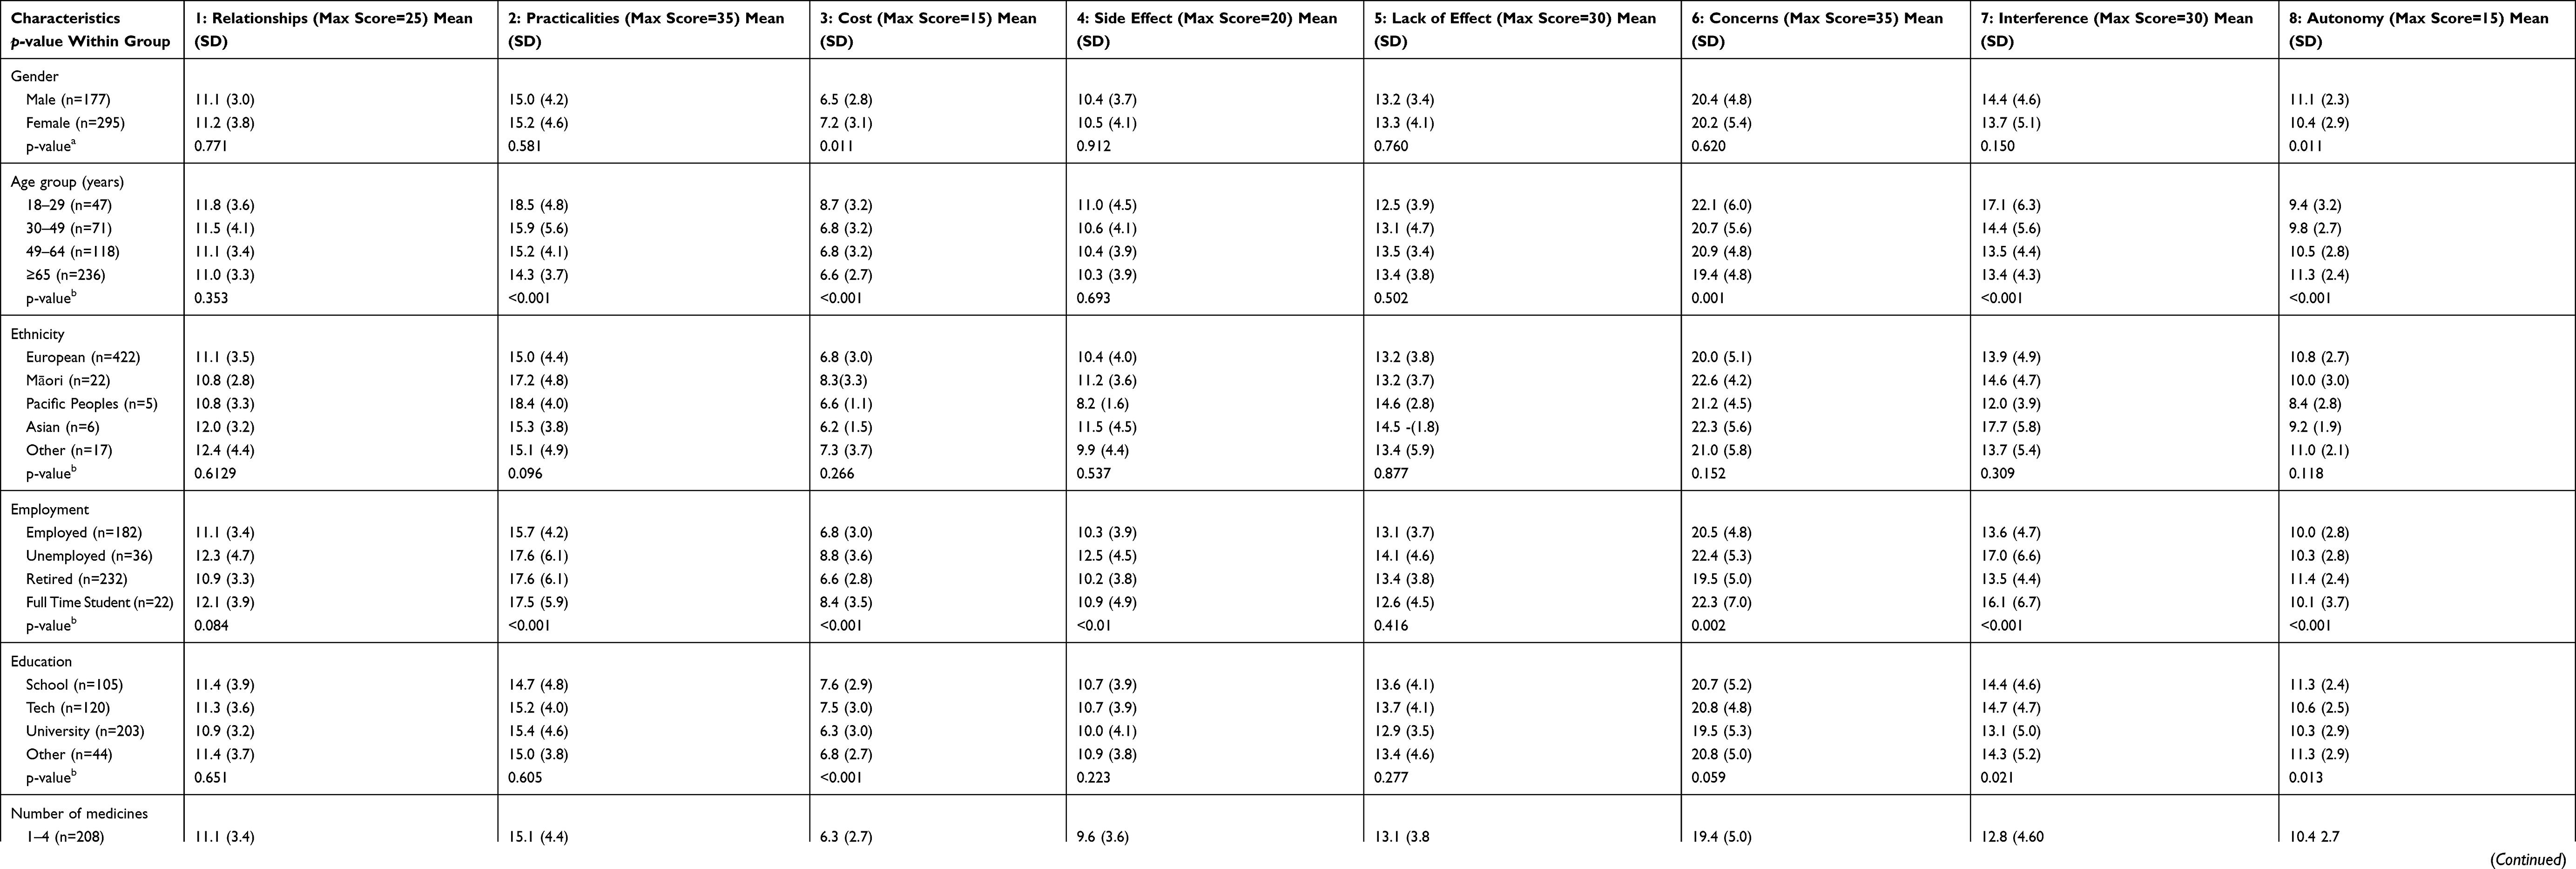 |
Table 3 Mean Domain Scores by Participant Characteristics |
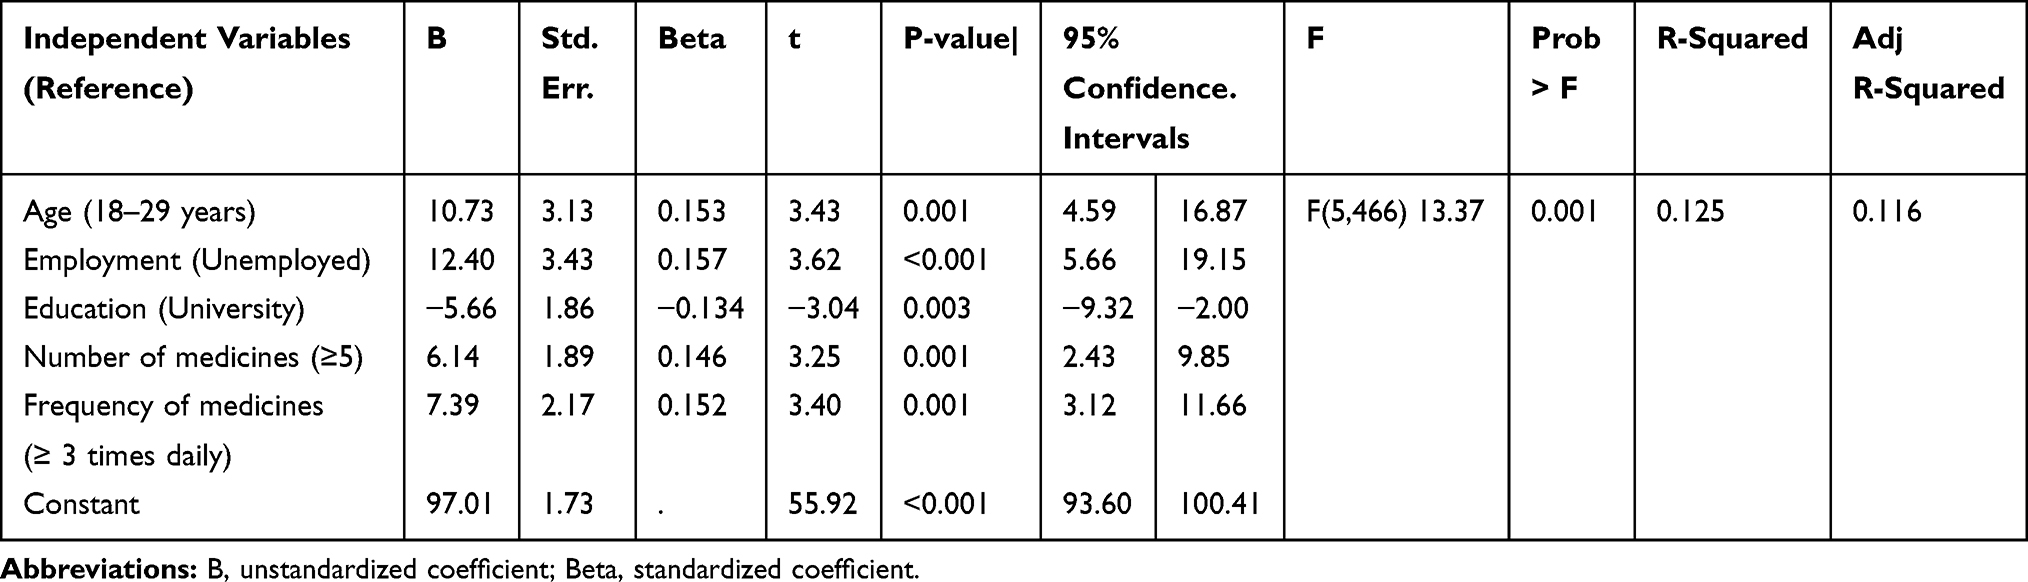 |
Table 4 Multiple Linear Regression – LMQ-3 Score versus Participants’ Sociodemographic and Medicine-Use Characteristics |
 |
Table 5 Multiple Linear Regression – Domain Scores versus Participants’ Sociodemographic and Medicine-Use Characteristics |
Results
Participants
In total, 472 survey responses were included in the analysis. From websites, 417 questionnaires were viewed, 397 submitted electronically (93%), 70 excluded as incomplete, and 327 (78.4%) included. From community pharmacies, 360 questionnaires were distributed, 180 (50%) returned, 35 excluded as incomplete, and 145 (40.3%) included. Most commonly participants were female (295, 62.5%), ≥65 years (236, 50.0%), of European ethnicity (422, 89.4%), retired (232, 49.2%), educated at university (203, 43.0%), independently used medicines (449, 95.1%), and paid for their prescriptions (429, 90.9%) (Table 1). The median (range) of participants age was 65 years (18–90), and of medicines used was 5 medicines (1–35). Participants most commonly used 1–4 medicines (208, 44.1%) or 5–9 medicines (207, 43.8%) and used medicines once (166, 35.2%) or twice daily (190, 40.3%). Significantly more unemployed participants (p=0.026) and those using medicines once daily (p=0.021) were recruited via community pharmacies, but there were no other differences between recruitment sites.
LMQ-3 Scores
LMQ-3 scores were normally distributed. The mean score was 101.8 (SD=21.0) ranging from 55–191 (possible range 41–205). Overall, participants had minimal burden (115 participants, 24.4%, scores=55-87), moderate burden (213, 45.1%, scores=88-110), or a high degree of burden (144, 30.5%, score≥111). A significantly higher proportion of respondents recruited via websites had high burden (114, 34.9%) compared to those recruited from community pharmacies (30, 20.7%) (p=0.008).
The highest mean score/burden was in participants requiring help with medicine use (Table 1) (M=116.0 vs M=101.1, p=0.001). The lowest was in people using medicines once daily (M=95.8). Mean scores significantly differed by age group (p=0.007), employment status (p<0.001), education level (p=0.023), number of medicines used (p=0.001), and frequency of medicines use (p<0.001).There were no significant differences in mean LMQ-3 scores by gender, ethnicity, or payment for prescriptions. Respondents recruited via websites had higher LMQ-3 total scores compared to those recruited from community pharmacies (103.9 ± 20.9 vs 94.0 ± 20.4, p=0.001); however, VAS burden scores were similar (3.66 ± 2.5 vs 3.16 ± 2.7, p=0.053).
Simple linear regression indicated significant associations with age (each additional year ß=−0.158, p=0.001), age ≥65 years (ß=−0.107, p=0.02), age 18–29 years (ß =0.147, p=0.001), being unemployed (ß=0.179, p<0.001), being retired (ß =−0.102, p=0.027), or having a university education (ß=−0.141, p=0.002). Additionally significant associations were seen with number of medicines used (each additional medicine ß=0.154, p=0.001), using ≥five or ≥10 medicines (ß =0.16, p<0.001; ß=0.914, p=0.047, respectively), using medicines ≥3 or ≥4 times daily (ß=0.207, p<0.001, ß=0.147, p=0.001), or having help with medicines use (ß=0.154, p=0.001).
Multiple linear regression (Table 4; and Table B in supplementary data) indicated that age, employment status, educational level, number and frequency of medicines used, all affected levels of burden. Higher scores/burden were associated with participants 18–29 years-old, unemployed, using ≥5 medicines or using: ≥3 times daily; and lower scores with having a university education (p<0.01). No associations were seen with gender, ethnicity, requiring assistance with medicine use, or payment for prescription medicines.
VAS scores were skewed to lower values with a median (range) of 2 (0–10). Forty-five participants (9.5%) perceived no burden. VAS scores showed a moderate positive relationship with LMQ-3 scores (Spearman’s r=0.587, p<0.001). Number of medicines was weakly positively correlated with LMQ-3 scores (r=0.177, p<0.001) and VAS scores (r=0.171, p<0.001); and age of participants was weakly negatively correlated (r=−0.124, p=0.007 and r=−0.234, p<0.001, respectively).
Domain Analysis
The highest negative individual responses (Table 3) indicated that 318 (67.4%) thought they could not vary the dose of their medicines; 315 (66.7%) felt they could not choose whether-or-not to take medicines; and 283 (60.0%) were concerned about the possible damaging long-term effects of taking medicines. The top three percentage maximum domain scores were for Autonomy (71.3%), Concerns (57.7%), and Side effects (52.0%) (Table 2). Participants ≥65 years had the lowest scores of all age groups, in six domains. Cronbach’s alpha scores for the domains (0.803 to 0.858) demonstrated acceptable scale reliability (≥0.700) (Table 3).
Multiple linear regression (Table 5; and Tables C-H in supplementary data) found significantly higher domain scores/burden were associated with specific characteristics. Being unemployed was associated with having a high burden in six of the eight domains (all except lack of effect and autonomy) and being 18–29 years-old in three domains (practicalities, concerns and interference). Using ≥5 medicines and using medicines ≥3 times a day both led to higher cost, side effect and interference burden. Using high numbers of medicines was also associated with higher scores in the concerns domain, while high frequency was associated with higher practicalities scores. Higher scores in the practicalities and cost domains were associated with the need for support using medicines; and paying for prescriptions was associated with higher cost domain scores.
Discussion
Main Findings
The present study, using the LMQ-3, found a wide range of medicines burden among participants in New Zealand; ranging from minimal to moderate burden in over two-thirds of participants to high burden in almost a third (30.5%), with a higher proportion of those recruited through websites perceiving higher burden in some domains. Participants requiring help using medicines had the highest mean scores/burden (M=116) and those taking medicines once daily, the lowest scores (M=95.8). VAS scores indicated a tenth of participants (9.5%) perceived no burden.
The domain analysis suggested the main drivers of burden were: (i) the lack of autonomy over medicine regimens (ii) concerns about medicines, and (iii) side effects. Multiple linear regression indicated significantly higher burden in those unemployed, 18–29 years-old, using ≥5 medicines, using medicines ≥3 times a day, and those requiring help using medicines. Governments and health professionals should focus interventions on these groups, to reduce their medicine burden and help them make the best use of their medicines.
Drivers of Burdens
Lack of autonomy to vary medicine regimens contributed to medicine burden in over two-thirds of participants. This was consistent with qualitative research findings where adhering to treatment regimens proved difficult for some people and impacted on their independence.15,27 Furthermore, a systematic review of qualitative studies found the negative impact of such concerns meant patients resorted to “rationalized mal-adherence and/or adaptive work”.27 Concerns about medicines and their long-term effects and side effects were important factors in the present study and others.3,23,24,27 Prescribers and pharmacists could help address medicine burden with practical advice, if they asked patients about their medicine use and/or used the LMQ-3 to identify concerns. Identifying and addressing their issues might help improve poor adherence and optimize health outcomes.27,28
Participants with High and Low Scores/Burden
From LMQ scores, this study found that almost a third (30.5%) of participants had a high level of burden, higher than the 25.0% seen in English populations.19,20 Participants requiring help using medicines had the highest mean LMQ-3 scores/burden (M=116.0), and close to those in UK studies (M=116.4).19,20 The present study found they had significantly higher scores than independent users in four domains (Practicalities, Cost, Side effects, Interference) suggesting ongoing areas of concern. Furthermore, multiple linear regression found that requiring assistance with medicines use was a predictor of high scores in the Practicalities and Cost domains (p<0.05). Similarly, Sav et al in Australia found that having unpaid care in people with chronic illness, predicted a high medicine burden.25
Consistent with UK findings, the unemployed had higher LMQ-3 scores/burden compared with other participants (NZ, M=114.9 vs UK, M=114.7);19,20 and being unemployed was a predictor of higher burden scores in six domains (all except Lack of effect and Autonomy). Unemployment may be a cause or consequence of poor health,29 has been linked to medicine burden8,19,20 and to cost-related non-adherence.30–32 The present study and others examining medicine burden suggest the unemployed need more support with medicine use.
Younger participants (18–29 years-old) were associated with high burdens in three domains (Practicalities, Concerns and Interference), and had the highest LMQ-3 scores of all age groups (M=111.1). The scores were higher than in UK studies (M=104.6, M=100.8).19,20 People 18–24 years-old are in “emerging adulthood”,33 and many find transitioning to managing their own medicines difficult.34 An Australian survey of hospitalized young people (n=85, aged 12–24 years) found those with chronic rather than acute illness had more negative beliefs about their medication.35 Some had aversions to taking medicines (eg, hating the “pain medicines”, side effects, or lacking confidence in their benefits). Others thought that adhering to regimens was controlling their lives. It is possible that the participants in the present study shared similar beliefs and resentments about medicines.
In contrast, participants ≥65 years had the lowest scores of all age groups in six domains and simple regression found lower scores (p<0.05) for participants ≥65 years and decreasing LMQ-3 scores with age (p<0.05). This was consistent with UK studies19,20 and might result from participants being retired and having more time for medicine-related tasks. The findings were also consistent with earlier New Zealand studies where older people described daily routines for medicine use, felt that medicines were “keeping them alive” or “keeping them well”, trusted their health professionals, and did not find medication-related costs a major issue.3,23,36
Not surprisingly, high or frequent use of medicines showed associations with higher LMQ-3 scores. Multiple linear regression showed an association between using ≥5 medicines or using medicines ≥3 times daily (p=0.001) and higher scores. Participants using 5–9 or ≥10 medicines had the highest LMQ-3 score in their sub-group (M=104.0 and 107.0, respectively). Furthermore, participants using medicines ≥4 times a day had the highest LMQ-3 scores in their group (M=109.5) and in four domains (Relationships, Practicalities, Cost, Interference). Again, similar findings were seen in the UK for high and frequent users of medicines (≥10 medicines, M=104.4, M=104.1, and ≥4 times a day, M=112.7, M=110.9).19,20
Our study also found some variation in perceptions of medicine burden between recruitment methods. A UK study, using an earlier version of the LMQ found that responses from respondents recruited through patient support group websites were more likely to indicate dissatisfaction with Health Care Practitioner relationships, lack of effectiveness, more side effects and interference with daily life than those recruited through pharmacies.37 However, the UK study differed from the present study in that the two groups of survey respondents were significantly different in age, gender, education and number of medicines used. These findings may therefore be explained by users of online fora being more dissatisfied in general with healthcare and having a greater awareness of side effects, and/or a higher level of obsequiousness bias in respondents recruited face-to-face through community pharmacies.
Strengths and Limitations
Strengths were that the present study used a validated survey tool from a country with a similar health system and culture to New Zealand. Response rates, even after excluding incomplete surveys, were good (78.0% websites, 40.3% community pharmacies). Responses were from 177 (37.5%) males and 295 (62.5%) females; covered four age groups (10.4% in smallest group); and with four levels of education (9.3% in smallest group). Furthermore, study numbers were similar to those in other published studies, and were sufficient to detect significant differences.
Although the pharmacy distribution arm was conducted in one city (Dunedin), the use of patient support group websites allowed respondents from the entire country, with approximately 70% of the responses coming from throughout New Zealand (online survey participants). There were few Māori (n=22, 4.7% vs 15% nationally), Pacific (n=5, 1.1% vs 7%) and Asian participants (n=6, 1.3% vs 12%), so these populations were under-represented.38 Selection bias was possible, from possible positive or negative views on allopathic medicines. Some responses may have been missed, eg, from busy people with demanding lifestyles and possibly high medicine burden. Only seven of 22 websites participated, capturing a limited range of views from individuals with chronic conditions. “Quick decisions”, may have been made on the 41-statements, perhaps missing difficulties that were more likely to be disclosed over time.39,40 It was not possible to account for diagnoses, number of conditions, severity of symptoms or classes of medicines with our analyses, as this information is not requested in the LMQ-3. For some individuals, these factors may have an impact on their experiences of using medicines. Finally, participants may have given socially desirable responses to impress the researchers based at a School of pharmacy.
Conclusions
A wide range of medicine burden was seen among study participants in New Zealand, with approximately half having a moderate degree of burden and almost a third, high burden. Subgroups with high burden included those requiring help using medicines, 18–29 years-old, the unemployed, and high or frequent medicine users. GPs and pharmacists should endeavor to spend more time discussing medicines with people in these groups in order to provide practical solutions and assist adherence.
More work is needed to explore associations between burden, adherence and patient outcomes. The LMQ could be used to examine burden in people with specific chronic disease/s (eg, cardiovascular or respiratory disease) and its association with adherence be further explored. Research pharmacists or nurses could test the LMQ-3 for use in family practice among priority sub-groups in an intervention study. Any beneficial effects from identifying and addressing issues would provide evidence for a possible rollout via the health system.
Acknowledgments
We thank the study participants, the patient support group websites, and the community pharmacy managers that permitted survey distribution.
Funding
The New Zealand Pharmacy Education Foundation provided funding to support the study.
Disclosure
The authors have no conflicts of interest to declare.
References
1. Rosenbaum L, Lamas D. Facing a “slow-motion disaster” — the UN meeting on noncommunicable diseases. N Engl J Med. 2011;365(25):2345–2348. doi:10.1056/NEJMp1112235
2. Krska J, Morecroft CW, Poole H, Rowe PH. Issues potentially affecting quality of life arising from long-term medicines use: a qualitative study. Int J Clin Pharm. 2013;35(6):1661–1669. doi:10.1007/s11096-013-9841-5
3. Tordoff J, Simonsen K, Thomson WM, Norris PT. It’s just routine.” A qualitative study of medicine-taking amongst older people in New Zealand. Pharm World Sci. 2010;32:154–161. doi:10.1007/s11096-009-9361-5
4. Masnoon N, Shakib S, Kalisch-Ellett L, Caughey GE. What is polypharmacy? A systematic review of definitions. BMC Geriatr. 2017;17(1):230. doi:10.1186/s12877-017-0621-2
5. Maher RL, Hanlon J, Hajjar ER. Clinical consequences of polypharmacy in elderly. Expert Opin Drug Saf. 2014;13(1):57–65. doi:10.1517/14740338.2013.827660
6. Pound P, Britten N, Morgan M, et al. Resisting medicines: a synthesis of qualitative studies of medicine taking. Soc Sci Med. 2005;61(1):133–155. doi:10.1016/j.socscimed.2004.11.063
7. Horne R, Weinman J. Patients’ beliefs about prescribed medicines and their role in adherence to treatment in chronic physical illness. Psychosom Res. 1999;47(6):555–567. doi:10.1016/S0022-3999(99)00057-4
8. Zidan A, Awaisu A, El-Hajj MS, Al-Abdulla SA, Figueroa DCR, Kheir N. Medication-related burden among patients with chronic disease conditions: perspectives of patients attending non-communicable disease clinics in a primary healthcare setting in Qatar. Pharmacy (Basel). 2018;6(3):E85. doi:10.3390/pharmacy6030085
9. van der Laan DM, Elders PJM, Boons CCLM, Nijpels G, Krska J, Hugtenburg JG. The burden of cardiovascular medication use on patients’ daily lives: a cross-sectional study. Int J Clin Pharm. 2018;40(2):412–420. doi:10.1007/s11096-018-0601-4
10. Roebuck MC, Liberman JN, Gemmill-Toyama M, Brennan T. Medication adherence leads to lower health care use and costs despite increased drug spending. Health Aff (Millwood). 2011;30(1):91–99. doi:10.1377/hlthaff.2009.1087
11. Boye KS, Curtis SE, Lage MJ, Garcia-Perez LE. Associations between adherence and outcomes among older, type 2 diabetes patients: evidence from a medicare supplemental database. Patient Prefer Adherence. 2016;10:1573–1581. doi:10.2147/PPA.S107543
12. Halpern R, Mody RR, Fuldeore MJ, Patel PA, Mikuls T. Impact of noncompliance with urate-lowering drug on serum urate and gout-related healthcare costs: administrative claims analysis. Curr Med Res Opin. 2009;25(7):1711–1719. doi:10.1185/03007990903017966
13. Russell LB, Suh DC, Safford MA. Time requirements for diabetes self-management: too much for many? J Fam Pract. 2005;54(1):52–56.
14. May C, Montori VM, Mair FS. We need minimally disruptive medicine. BMJ. 2009;339(7719):485–487. doi:10.1136/bmj.b2803
15. Sav A, Kendall E, McMillan SS, et al. ‘You say treatment, I say hard work’: treatment burden among people with chronic illness and their carers in Australia. Health Soc Care Community. 2013;21(6):665–674. doi:10.1111/hsc.12052
16. Horne R, Weinman J, Hankins M. The beliefs about medicines questionnaire: the development and evaluation of a new method for assessing the cognitive representation of medication. Psychol Health. 1999;14(1):1–24. doi:10.1080/08870449908407311
17. Atkinson MJ, Sinha A, Hass SL, et al. Validation of a general measure of treatment satisfaction, the Treatment Satisfaction Questionnaire for Medication (TSQM), using a national panel study of chronic disease. Health Qual Life Outcomes. 2004;2(1):1–13. doi:10.1186/1477-7525-2-12
18. Tran V-T, Montori VM, Eton DT, Baruch D, Falissard B, Rvaud P. Development and description of measurement properties of an instrument to assess treatment burden among patients with multiple chronic conditions. BMC Med. 2012;10(68):1–10. doi:10.1186/1741-7015-10-68
19. Katusiime B, Corlett SA, Krska J. Development and validation of a revised instrument to measure burden of long-term medicines use: the Living with Medicines Questionnaire version 3. Patient Relat Outcome Meas. 2018;28(9):155–168. doi:10.2147/PROM.S151143
20. Krska J, Katusiime B, Corlett SA. Patient experiences of the burden of using medicines for long-term conditions and factors affecting burden: a cross-sectional survey. Health Soc Care Community. 2018;26(6):946–959. doi:10.1111/hsc.12624
21. Carter SR, Bulanadi MG, Katusiime B, Chen TF, Corlett S, Krska J. Comprehensibly measuring patients’ subjective thoughts, feelings and experiences of living with medicines: the Living With Medicines. Questionnaire (LMQ). Int J Pharm Pract. 2015;37(2):424–425.
22. Krska J, Katusiime B, Corlett SA. Complexity of medicine regimens and patient perceptions of medicine burden. Pharmacy. 2019;7(18). doi:10.3390/pharmacy7010018
23. Tordoff JM, Bagge ML, Gray AR, Campbell AJ, Norris PT. Medicine-taking practices in community-dwelling people aged ≥75 years in New Zealand. Age Ageing. 2010;39(5):574–580. doi:10.1093/ageing/afq069
24. Kairuz T, Bye L, Birdsall R, et al. Identifying compliance issues with prescription medicines among older people: a pilot study. Drugs Aging. 2008;25(2):153–162. doi:10.2165/00002512-200825020-00007
25. Sav A, Whitty JA, McMillan SS, et al. Treatment burden and chronic illness: who is at most risk? Patient. 2016;9(6):559–569. doi:10.1007/s40271-016-0175-y
26. Mohammed MA, Moles RJ, Chen TF. Medication-related burden and patients’ lived experience with medicine: a systematic review and metasynthesis of qualitative studies. BMJ Open. 2016;6(2):e010035. doi:10.1136/bmjopen-2015-010035
27. Demain S, Gonçalves A-C, Areia C, et al. Living with, managing and minimising treatment burden in long term conditions: a systematic review of qualitative research. PLoS One. 2015;10(5):e0125457. doi:10.1371/journal.pone.0125457
28. Sav A, King MA, Whitty JA, et al. Burden of treatment for chronic illness: a concept analysis and review of the literature. Health Expect. 2015;18(3):312–324. doi:10.1111/hex.12046
29. Jin RL1, Shah CP, Svoboda TJ. The impact of unemployment on health: a review of the evidence. CMAJ. 1995;153(5):529–540.
30. Norris P, Tordoff J, McIntosh B, Laxman K, Chang SY, Te Karu L. Impact of prescription charges on people living in poverty: a qualitative study. Res Social Adm Pharm. 2016;12(6):893–902. doi:10.1016/j.sapharm.2015.11.001
31. Kennedy J, Tuleu I, Mackay K. Unfilled prescriptions of medicare beneficiaries: prevalence, reasons, and types of medicines prescribed. J Manag Care Pharm. 2008;14(6):553–560. doi:10.18553/jmcp.2008.14.6.553
32. Briesacher BA, Gurwitz JH, Soumerai SB. Patients at-risk of cost-related nonadherence: a review of the literature. J Gen Intern Med. 2007;22(6):864–871. doi:10.1007/s11606-007-0180-x
33. Arnett JJ. Emerging adulthood. A theory of development from the late teens through the twenties. Am Psychol. 2000;55(5):469–480. doi:10.1037/0003-066X.55.5.469
34. Majumder E, Cogen FR, Monaghan MJ. Self-management strategies in emerging adults with Type 1 diabetes. Pediatr Health Care. 2017;31(1):29–36. doi:10.1016/j.pedhc.2016.01.003
35. Rosina R, Crisp J, Steinbeck K. Treatment adherence of youth and young adults with and without a chronic illness. Nurs Health Sci. 2003;5(2):139–147. doi:10.1046/j.1442-2018.2003.00149.x
36. Tordoff J, Bagge M, Ali F, et al. Older people’s perceptions of prescription medicine costs and related costs: a pilot study in New Zealand. J Prim Health Care. 2014;64(4):295–303. doi:10.1071/HC14295
37. Katusiime B, O’ Grady M, Vaghji C, Rubaseyone R, Corlett S, Krska J. Experiences of using prescription medicines among the general public in the UK: a comparison of paper and online-reported experiences. Int J Clin Pharm. 2015;37(2):403.
38. Stats NZ. Major ethnic groups in New Zealand. January 2015. Available from: https://www.stats.govt.nz/infographics/major-ethnic-groups-in-new-zealand.
39. Fitzpatrick R. Surveys of patients satisfaction: important general considerations. BMJ. 1991;302(6781):887–889. doi:10.1136/bmj.302.6781.887
40. Bagge M, Tordoff J, Norris P, Heydon S. Older people’s attitudes towards their regular medicines. J Prim Health Care. 2013;5(3):234–242. doi:10.1071/HC13234
 © 2019 The Author(s). This work is published and licensed by Dove Medical Press Limited. The full terms of this license are available at https://www.dovepress.com/terms.php and incorporate the Creative Commons Attribution - Non Commercial (unported, v3.0) License.
By accessing the work you hereby accept the Terms. Non-commercial uses of the work are permitted without any further permission from Dove Medical Press Limited, provided the work is properly attributed. For permission for commercial use of this work, please see paragraphs 4.2 and 5 of our Terms.
© 2019 The Author(s). This work is published and licensed by Dove Medical Press Limited. The full terms of this license are available at https://www.dovepress.com/terms.php and incorporate the Creative Commons Attribution - Non Commercial (unported, v3.0) License.
By accessing the work you hereby accept the Terms. Non-commercial uses of the work are permitted without any further permission from Dove Medical Press Limited, provided the work is properly attributed. For permission for commercial use of this work, please see paragraphs 4.2 and 5 of our Terms.