")
Back to Journals » International Journal of General Medicine » Volume 14
Exploring Diagnostic Biomarkers and Comorbid Pathogenesis for Osteoarthritis and Metabolic Syndrome via Bioinformatics Approach
Authors Jiang X, Zhong R, Dai W , Huang H, Yu Q, Zhang JA , Cai Y
Received 24 June 2021
Accepted for publication 14 September 2021
Published 29 September 2021 Volume 2021:14 Pages 6201—6213
DOI https://doi.org/10.2147/IJGM.S325561
Checked for plagiarism Yes
Review by Single anonymous peer review
Peer reviewer comments 2
Editor who approved publication: Dr Scott Fraser
Xiang Jiang,1,* Rongzhou Zhong,1,* Weifan Dai,2,* Hui Huang,1 Qinyuan Yu,1 Jiji Alexander Zhang,3 Yanrong Cai3
1Department of Orthopaedics and Rehabilitation, Shanghai Yangzhi Rehabilitation Hospital (Shanghai Sunshine Rehabilitation Center), Tongji University School of Medicine, Shanghai, 201619, People’s Republic of China; 2Department of Digital Hub, Decathlon International, Shanghai, 200131, People’s Republic of China; 3Department of Medicine, Heidelberg University Hospital, University of Heidelberg, Heidelberg, 69120, Germany
*These authors contributed equally to this work
Correspondence: Yanrong Cai
Department of Medicine, Heidelberg University Hospital, University of Heidelberg, Heidelberg, 69120, Germany
Email [email protected]
Background: Metabolic syndrome (MS) has grown in recognition to contribute to the pathogenesis of osteoarthritis (OA), which is the most prevalent arthritis characterized by joint dysfunction. However, the specific mechanism between OA and MS remains unclear.
Methods: The gene expression profiles and clinical information data of OA and MS were retrieved from the Gene Expression Omnibus (GEO) database. The genes in the key module of MS were identified by weighted gene co-expression network analysis (WGCNA), which intersected with the differentially expressed genes (DEGs) between control and MS samples to obtain hub genes for MS. The potential functions and pathways of hub genes were detected through the Gene Ontology (GO) and Kyoto Encyclopedia of Gene and Genome (KEGG) analyses. The genes involved in the different KEGG pathways between the control and OA samples overlapped with the DEGs between the two groups via the Venn analysis to gain the hub genes for OA affected by MS (MOHGs). Additionally, the least absolute shrinkage and selection operator (LASSO) was performed on the MOHGs to establish a diagnostic model for each disease.
Results: A total of 61 hub genes for MS were identified that significantly enriched in platelet activation, complement and coagulation cascades, and hematopoietic cell lineage. Besides, 4 candidate genes (ELOVL7, F2RL3, GP9, and ITGA2B) were screened among the 6 MOHGs to construct a diagnostic model, showing good performance for distinguishing controls from patients with MS and OA. GSEA suggested that these diagnostic genes were closely associated with immune response, adipocytokine signaling, fatty acid metabolism, cell cycle, and platelet activation.
Conclusion: Taken together, we identified 4 potential gene biomarkers for diagnosing MS and OA patients, providing a theoretical basis and reference for the diagnostics and treatment targets of MS and OA.
Keywords: osteoarthritis, OA, metabolic syndrome, MS, diagnostic biomarkers, pathogenesis, bioinformatics
Introduction
OA is the most prevalent arthritic joint disease and a leading cause of disability and joint pain worldwide, affecting almost 37% of the US population over 60 years of age.1 OA is a multifactorial disease, affected by aging, joint trauma, bio-tribology of joint contact surface, genetic susceptibility, cardiovascular disorder, obesity and metabolic dysregulation.1–3 It has been long regarded as a degenerative disease of the cartilage that results from simple wear and tear. In recent decades, however, it is more appreciated that OA is a disorder of the joint as a whole, with an increasing amount of research has dug deeper into molecular mechanisms underlying OA pathogenesis.4 According to the structure and elements that constitute a synovial joint, the pathology of an OA joint can be divided into the breakdown of cartilage, remodeling of the underlying bone, ectopic bone formation, joint capsule hypertrophy and inflammation of the synovial lining or synovitis, among which the low-grade chronic inflammation plays a central role.1 The interplay between the innate and adaptive immune system and inflammatory mediators could lie in the center of a vicious cycle of local tissue damage and failed tissue repair in joints.5,6 Chondrocytes and/or their progenitors start secreting matrix-degrading enzymes, cytokines and chemokines when the attempt to repair the damaged cartilage matrix fails.2 In turn, inflammation of the synovium ensues, contributing to cartilage degradation. Previous research has demonstrated that inflammatory mediators from activated B lymphocytes and primary T cells and macrophages from OA patients could induce synovial stromal cells and chondrocytes to produce matrix metalloproteases 3 (MMP-3), a tissue-destructive enzyme, and a disintegrin and metalloproteinase with thrombospondin motifs (ADAMTS).7,8 Immune cells, thereby, acquired potential cartilage invasion properties that contribute to the progression of arthritis. Obesity and the associated increase in adipokine levels also add to the inflammatory state in OA.2,9
MS, mainly characterized by central obesity, diabetes and insulin resistance, has grown in recognition to contribute to the pathogenesis of OA.10 Evidence from epidemiological studies has shown a strong correlation between MS and OA of the knee.11,12 This association could be partly explained by a greater body mass in MS that is consequently with an increase in the forces acting on the load-bearing joints. On the other hand, obesity has been linked to the development of OA in non-weight-bearing joints of the hand in a population-based cohort study.11 Besides, it is reported in a large Netherlands Epidemiology of Obesity cohort study that fat mass and waist-to-hip ratio were closely related to hand OA, with an association with visceral fat in men.13 Leptin, a biomarker of MS, could be involved in OA pathogenesis at a local and systemic level.14 Leptin levels in serum/plasma and synovial fluids were associated with joint pain, radiographic progression and knee OA incidence.15 Hui et al suggested that leptin from joint white adipose tissues acted as a pro-inflammatory adipokine in cartilage degradation via the increased induction of proteolytic enzymes; it also synergized with IL-1, with a concomitant activation of STAT1, STAT3, STAT5, MAPK (JNK, Erk, p38), Akt and NF-κB signaling pathways, linking obesity and cartilage catabolism in OA.16 Additionally, hyperlipidemia and hypertension have been reported to increase the risk of OA progression, as components of MS that are independent of the BMI.17,18
So far, the metabolic OA phenotype has been well identified. However, the underlying mechanisms between OA and MS remain to be elucidated. In this study, we explored shared biomarkers between OA and MS and the mechanisms through which MS could influence the development of OA. Subsequently, we aimed to uncover the novel insight of the comorbidity between MS and OA, and identify candidate genes for the diagnosis and therapeutic targets.
Materials and Methods
Here, we used comprehensive bioinformatics approach to explore diagnostic biomarkers and shared pathogenesis for both OA and MS. The work-flow of this study was presented in Figure 1.
 |
Figure 1 The work-flow of this study. |
Data Acquisition
The gene expression profiles of patients with MS (GSE145412) and OA (GSE51588) were all collected from the GEO database (https://www.ncbi.nlm.nih.gov/geo/). The GSE145412 dataset for MS screened 32 samples, containing 16 controls and 16 MS patients. 10 control samples and 40 OA patient samples were included in the GSE51588 dataset (Table 1).
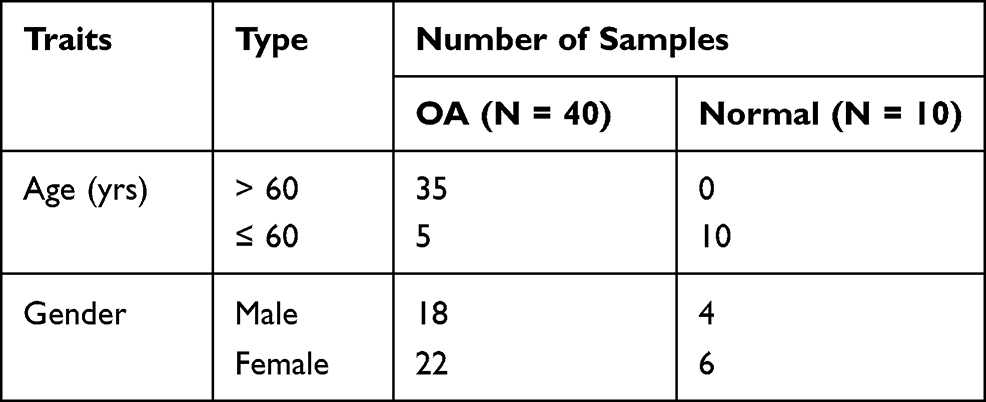 |
Table 1 Demography of OA Samples in GSE51588 Dataset |
WGCNA for MS
WGCNA can be utilized to identify global gene expression profiles as well as co-expressed genes. The relationship between the genes and the phenotype of MS was investigated by the WGCNA algorithm. In our study, the WGCNA analysis was performed on the data in the GSE145412 dataset for MS using the WGCNA package in R.19 Firstly, the clustering analysis for all samples was operated to remove the outlier samples, which can ensure the accuracy of the subsequent study. All gene pairs were then analyzed by the Pearson algorithm and a weighted adjacency matrix was created to calculate the topological overlap measurement (TOM) representing the overlap in the shared neighbors. Secondly, based on the distribution of the criteria scale-free, an optimal soft-thresholding power was selected where the co-expression similarity was raised to generate an approximate scale-free network. Then, the dynamic tree cutting method was used to overlap the similar modules identified by the TOM with the minimum number of 30 genes in each module. Finally, the module-trait relationships were detected by Pearson correlation analysis and further screened a key model highly related to the trait of MS. The P-value less than 0.05 was regarded as a significant correlation.
Differentially Expressed Analysis
Between the control samples and MS patient samples, the limma package in R was applied to conduct the differentially expressed analysis of the data in the GSE145412 dataset. The genes that met the threshold of P-value < 0.01 were considered as DEGs (Supplementary Table 1). The Venn analysis (http://bioinformatics.psb.ugent.be/webtools/Venn/) was utilized to identify hub genes for MS by integrating DEGs and genes in the selected key module identified by the WGCNA analysis.
Functional Enrichment Analysis
GO annotation (www.geneontology.org/) and KEGG pathway (www.genome.jp/kegg/pathway.html) analyses were performed on the hub genes for MS to obtain the possible biological processes of these genes using the clusterProfiler package in R. GO analysis can be divided into three categories: molecular function (MF), biological process (BP), and cellular components (CC).20 P-value < 0.05 indicates a statistically significant result. The detailed information of GO and KEGG results was illustrated in Supplementary Tables 2 and 3.
Screening of MOHGs
According to the enriched pathways of hub genes of MS selected from the KEGG analysis, single sample gene set enrichment analysis (ssGSEA) was adopted using the gene set variation analysis (GSVA) package in R to calculate the ssGSEA score of the control and OA patient samples in the GSE51588 dataset, and further screened the significantly different KEGG pathways between the control and OA patient samples21 based on the ssGSEA score.Genes involved in the identified different KEGG pathways between the two groups were further identified and then intersected with OA-related DEGs (Supplementary Table 4) to acquire the MOHGs for subsequent study. |log2FC| > 1 and P-value < 0.05 were defined as screening standard to obtain DEGs for OA.
LASSO Analysis for MS and OA
Based on the above results, the MOHGs were considered as genes both related to OA and MS. To explore the diagnostic value of these genes, LASSO regression was then operated to select the candidate genes significantly associated with the diagnosis of MS and OA among the harvested MOHGs using the R package named Glmnet. The receiver operating characteristic (ROC) curve was conducted and the area under the curve (AUC) of the ROC curve was calculated using the pROC package in R to detect the diagnostic ability of the constructed model built on all candidate genes and each candidate gene for MS and OA, respectively.
GSEA for OA
In the GSE51588 dataset, samples of OA were classified into high- and low-expression groups according to the expression level of each diagnostic gene. The potential functions and pathways of each diagnostic gene were analyzed by GSEA (https://software.broadinstitute.org/gsea/index.jsp) using the clusterProfiler package of the R based on GO and KEGG enrichment analyses. The enrichment result was regarded significant difference if the value of P < 0.05.
Statistical Analysis
R software was performed to analyze the statistical analyses in our study. Wilcoxon test was utilized for the significance of differences between two groups. The ggplot2 package in R was applied to draw the box plot and heatmap plot. Data were considered to be significant differences when P < 0.05.
Results
Identification of Hub Genes for MS
WGCNA was performed to construct a co-expression network for MS based on the GSE145412 dataset. To begin this process, sample 18, an obvious outlier after clustering analysis for all MS samples, was removed with the cut-off value = 20,000 (Supplementary Figure 1A and B). The optimal soft threshold power was necessary for building the scale-free network for MS, and the soft threshold power was chosen = 8 (scale-free R2 = 0.9), ensuring the network was scale-free (Figure 2A). The dynamic tree cutting method identified 51 modules labeled with different colors with the minimum number of genes in each module to 30 (Figure 2B). The relationship between the identified modules and the trait (MS phenotype) was illustrated in Figure 2C, Supplementary Figure 1C. The sky-blue module (R = 0.48, P = 0.007) and indianred4 module (R = 0.4, P = 0.03) were positively correlated with clinical trait of MS. The heatmap displayed the TOM of 400 randomly selected genes, indicating the independence of each module (Figure 2D). Besides, 372 DEGs were screened between the control and MS patient samples with 195 upregulated and 177 downregulated genes (Figure 2E and F). The result of Venn analysis suggested that 61 hub genes related to MS were identified for further study by overlapping the 372 DEGs and 212 genes in the key module (Figure 2G).
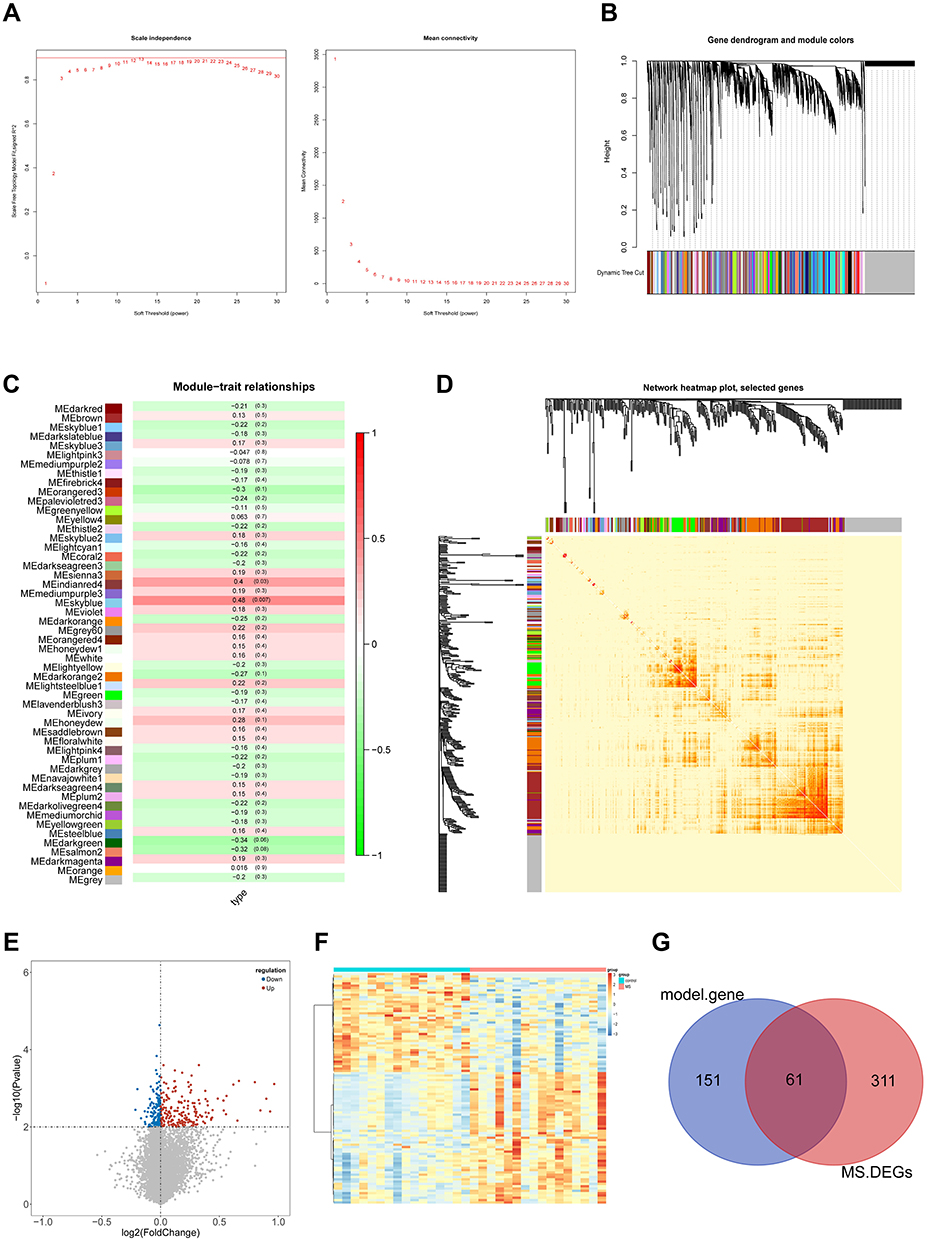 |
Figure 2 WGCNA analysis and hub candidates for MS. (A) Determination of the soft threshold power in WGCNA. The left panel shows the influence of soft threshold power on the scale-free fit index and the right panel shows the impact of soft threshold power on the mean connectivity; (B) gene clustering tree to detect 51 co-expression clusters with corresponding color assignments, each of which represents a module. The gray module indicates no co-expression among the genes; (C) the module-trait relationships. Each row represents a module, the column to the trait (MS phenotype). Each number in rows includes the corresponding correlation and P-value. The positive correlation is in red and the negative one is in green; (D) correlated heatmap of topological overlap of 400 randomly selected genes. Darker squares along the diagonal correspond to modules. The gene dendrogram and module assignment are shown along the left and top; (E) volcano plot of DEGs between control and MS groups; (F) heat map of DEGs between control and MS groups; (G) Venn diagram for selecting hub candidates in MS. |
Functional Enrichment Analysis of Hub Genes
GO annotation and KEGG pathway analyses were conducted on 61 hub genes to perform the gene functional enrichment analysis. The biological process (BP) of GO term result manifested that hub genes were significantly enriched in platelet deregulation, platelet activation, blood coagulation, and leukocyte migration (Figure 3A). For molecular function (MF), the hub genes were found to be mostly related to actin filament binding, platelet-derived growth factor receptor binding, and chemokine activity (Figure 3B). The cellular components (CC) terms emphasized platelet alpha granule, platelet alpha granule membrane, and platelet alpha granule lumen (Figure 3C). The KEGG result highlighted that the hub genes were mainly concentrated on platelet activation, complement and coagulation cascades, and hematopoietic cell lineage (Figure 3D).
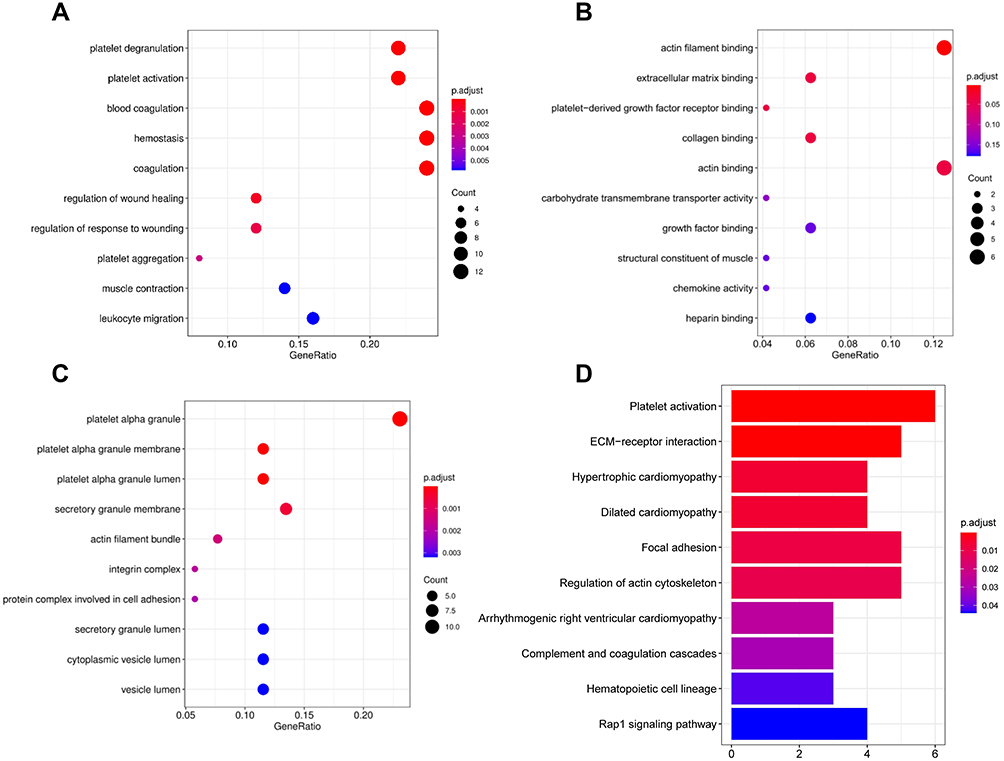 |
Figure 3 GO enrichment and KEGG analyses for 61 gene candidates. (A–C) The top 10 terms of GO categories of biological process (BP), molecular function (MF) and cellular component (CC), respectively; (D) top 10 terms of KEGG analysis. P-value < 0.05 was considered to be the cut-off criteria. |
Identification of MOHGs
According to the selected enriched pathways analyzed by the KEGG algorithm, we uncovered that the pathways of arachidonic acid metabolism, fatty acid metabolism, platelet activation, proteoglycans in cancer, and viral protein interaction with cytokine and cytokine receptors were different between control and OA patient samples (Figure 4A). Among the above pathways, arachidonic acid metabolism, fatty acid metabolism, platelet activation were reported to play a vital role in the pathogenesis of OA.22–24 We screened the genes in these pathways, including ALOX12, PTGS1, ACSBG1, ELOVL7, GP9, ITGA2B, F2RL3, PTGS1, GP6, and ITGB3, for subsequent study. Moreover, the 1630 DEGs between control and OA patient samples were identified in total, consisting of 970 upregulated and 660 downregulated genes (Figure 4B and C). Finally, 1630 DEGs had intersected with 9 genes in the KEGG pathways to generate 6 genes, ALOX12, ITGA2B, F2RL3, GP9, GP6, and ELOVL7, that further considered as MOHGs (Figure 4D).
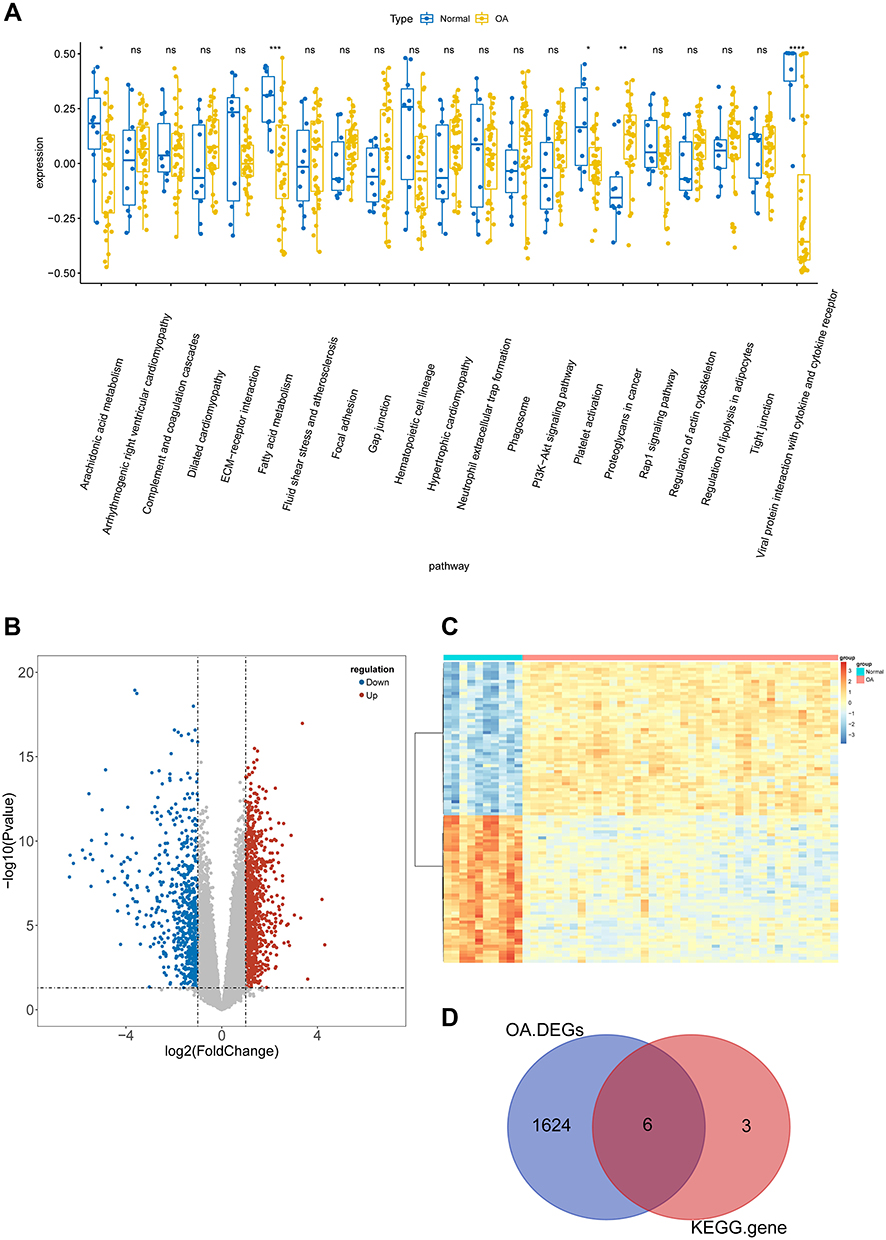 |
Figure 4 Identification of hub genes for OA affected by MS (MOHGs). (A) Box plot of differentially expressed KEGG pathways in the control and OA patient samples. The expression level of each KEGG pathway was calculated based on ssGSEA for each sample (ns = no significance; *p < 0.05; **p < 0.01; ***p < 0.001; ****p < 0.0001); (B and C) volcano plot and heat map of DEGs between control and OA groups, respectively (|log2FC| > 1 and P-value < 0.05 were defined as screening standard to obtain DEGs for OA.); (D) Venn diagram for selecting hub candidates for MS-affected OA. |
Diagnostic Genes Screening and Model Establishment
4 genes were identified, namely ELOVL7, F2RL3, GP9, and ITGA2B, as candidate genes by LASSO regression analysis among these MOHGs to develop a diagnostic model for OA (Figure 5A). The AUC of the constructed diagnostic model was 1, indicating a better diagnostic power and accuracy for diagnosing OA (Figure 5B). Interestingly, we discovered the differentiated expression levels of 4 candidate genes in OA and MS samples. All of the 4 candidate genes were decreased in patients with OA, while increased in MS patients compared with their corresponding control samples (Figure 5C and D). For OA, the AUC value of ELOVL7, F2RL3, GP9, and ITGA2B reached 0.785, 0.74, 0.758, and 0.785, respectively, which showed an excellent diagnostic ability (Figure 5E). In addition, ELOVL7 (AUC = 0.82), F2RL3 (AUC = 0.816), GP9 (AUC = 0.824) and ITGA2B (AUC = 0.82) had promising reliability for diagnosing MS patients (Figure 5F). These findings suggested that 4 candidate genes all possessed a discriminatory power to stratify patients from controls for both diseases.
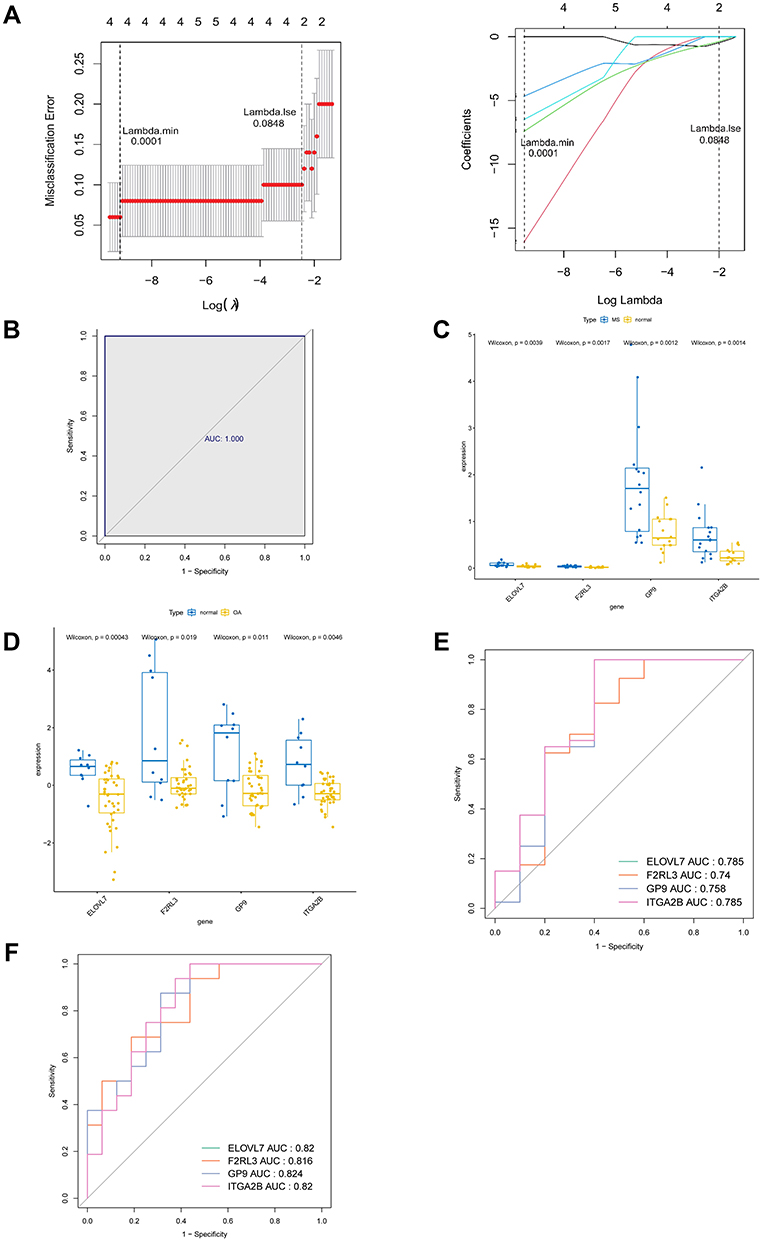 |
Figure 5 Identification of diagnostic gene biomarkers from MOHGs and model establishment. (A) LASSO regression model of MOHGs. The left plot shows cross-validation to select the optimal tuning parameter (λ or Lambda). The left vertical line crosses over the optimal log λ, which corresponds to the minimum value for multivariate Cox modeling. The right plot indicates coefficient profiles of MOHGs. (B) the ROC curve of constructed model with 4 identified genes (ELOVL7, F2RL3, GP9, and ITGA2B), with an AUC of 1; (C and D) the expression levels of identified 4 diagnostic genes in OA and MS dataset (significant differences were indicated by the corresponding P-values of Wilcoxon test); (E) the ROC curves of identified 4 diagnostic gene biomarkers in OA dataset, with 1-specificity and sensitivity. The AUC value of each curve shows the diagnostic ability of corresponding gene candidates; (F) the ROC curves of identified 4 diagnostic gene biomarkers in the MS dataset. |
GSEA Analysis of Candidate Genes
In order to investigate the possible biological processes associated with these candidate genes, the GSEA method was conducted. The enrichment analysis demonstrated that ELOVL7 was centralized on the olfactory transduction, fatty acid metabolism, and immune-related signaling pathway, such as adaptive immune response and antigen receptor signaling pathway (Figure 6A and B). F2RL3 was mainly implicated in cytoplasmic translation, cytosolic ribosome, and some metabolism pathways, such as insulin signaling pathway, adipocytokine signaling pathway, and glycolysis gluconeogenesis (Figure 6C and D). For GP9, cell cycle-related pathways, DNA replication, oxidative phosphorylation, and primary immunodeficiency were mostly enriched pathways (Figure 6E and F). GSEA results suggested that ITGA2B was mostly involved in the cell cycle, DNA replication, and some immune-related response (Figure 6G and H).
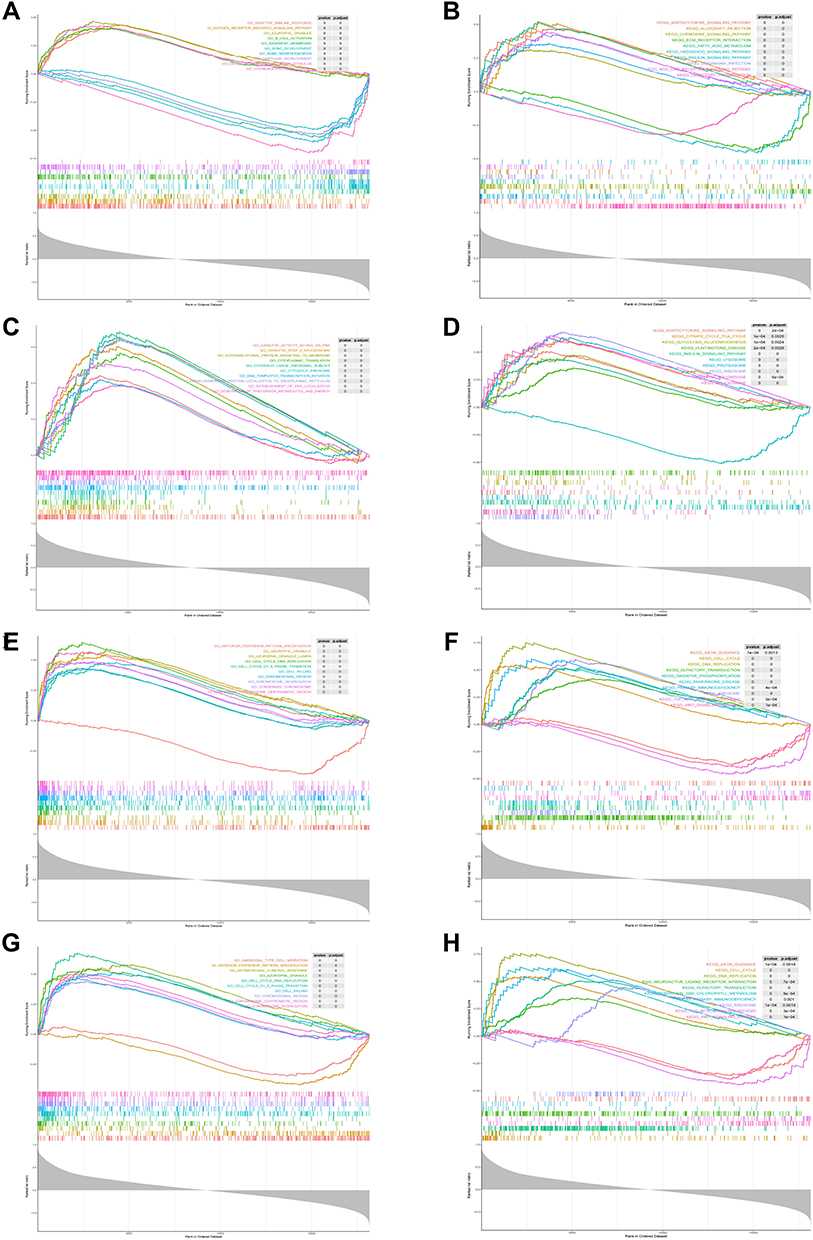 |
Figure 6 GSEA analysis of 4 diagnostic genes in OA dataset based on GO and KEGG enrichment analyses. Top 10 closely related KEGG pathways and GO terms were shown in each figure. (A and B) GSEA analysis of ELOVL7; (C and D) GSEA analysis of F2RL3; (E and F) GSEA analysis of GP9; (G and H) GSEA analysis of ITGA2B. |
Discussion
Both OA and MS are major public health problems with increasing prevalence and disability.6,25 MS is not well defined as one disorder, but it can be extracted into four central features: insulin resistance, visceral obesity, atherogenic dyslipidemia and hypertension.26,27 Metabolic OA, a newly characterized subtype of OA, links individual MS components or MS as a whole with OA phenotype. Increasing evidence has suggested that OA is a whole-joint disease that is influenced by systemic mediators, inflammaging, innate immunity and the low-grade inflammation induced by MS.28 Adipokines, hyperglycaemia and endocrine imbalance are the most common pathways that could be responsible for the involvement of MS in OA pathogenesis.29 However, the specific mechanism between OA and MS has not been fully elucidated. Our results revealed that 4 candidate genes (ELOVL7, F2RL3, GP9, and ITGA2B) were involved in the mechanism through which MS could influence the development of OA, and these genes could be potential biomarkers for the diagnosis of OA and MS or metabolic OA.
Our results suggested that ELOVL7, F2RL3, GP9 and ITGA2B gene have potential diagnostic value for both OA and MS. Very-long-chain elongases are required for the synthesis of essential fatty acids in non-ruminants.30 Fatty acid elongase 7 (ELOVL7) has been reported to be preferentially involved in elongation of saturated very-long-chain fatty acids and lipid accumulation that could increase MS activity.31,32 In addition, OA is associated with increased angiogenesis and fatty acid oxidation (FAO).33,34 Recent study has demonstrated that low lipid levels are the main nutritional determinant for the chondrogenic commitment of skeletal progenitor cells.35 High rate of FAO in chondrocytes could impair their function and thus contribute to OA phenotype. All these phenomena suggest that manipulation of ELOVL7 and its related lipid metabolism could be a therapeutic target for OA and MS.
F2RL3 (F2R Like Thrombin or Trypsin Receptor 3) is a gene that encodes the protein named protease-activated receptor 4 (PAR-4) or coagulation factor II (thrombin) receptor-like 3. Enrichment analyses in our study suggested the potential role of F2RL3 in platelet activation that could contribute to MS. Previous study has reported that soluble tissue factors contribute to inflammatory arthritis through a thrombin-dependent pathway, in which PAR-4-induced platelet activation is an essential step.36 Besides, increasing evidence has linked MS and OA with platelet dysfunction. A strong positive correlation between blood platelet count and the number of present MS components was documented upon adjustment for a variety of biosocial factors (age, smoking, alcohol use, and physical activity).37 Kwon et al revealed that high platelet counts within the normal range are significantly associated with knee and hip OA in Korean women over 50 years.38 A possible explanation lies in that platelets are the major source of the cytokines such as IL-1β, and increased activation of them is believed to be involved in the development and progression of inflammation.39
In addition to F2RL3, GP9 and ITGA2B genes were found to be involved in platelet activation. ITGA2B encodes integrin alpha-IIb/beta-3, which is a receptor for fibronectin, fibrinogen, plasminogen, prothrombin, thrombospondin.40 Following activation, integrin alpha-IIb/beta-3 brings about platelet-platelet interaction through binding of soluble fibrinogen, leading to rapid platelet aggregation. GP9 (glycoprotein IX platelet) encodes platelet glycoprotein IX. Defects in GP9 could lead to Bernard-Soulier syndrome and thrombocytopenia; among its related pathways are GP1b-IX-V activation signaling and hematopoietic stem cell differentiation.41,42 Although so far the expression levels of them are not reported in MS studies, our results indicated higher expression of them in MS samples compared with normal controls potentially contributes to platelet-related inflammation that could stabilize the MS phenotype. Interestingly, we found adverse expression of GP9 and ITGA2B in MS and OA, suggesting their different role in OA pathogenesis.
GSEA analysis of GP9 and ITGA2B gene suggested that cell cycle-related pathways and DNA replication were involved in OA progression. The lower expression of GP9 and ITGA2B in OA samples compared with normal groups in the OA dataset suggested a decline in OA cell proliferation. In consistence with our results, Wang et al reported that human OA cartilage and synovium expressed very little αIIb mRNA (ITGA2B).43 Increasing evidence has emerged focusing on the harmful biological mechanisms of inflammatory factors in OA joints. However, the understanding of how inflammation impacts cartilage regeneration remains unclear.44 Recent study demonstrated that impaired chondrocyte function was associated with G0/G1 cell-cycle arrest and concomitant inhibition of DNA replication and cell proliferation.45 According to these clues, GP9 and ITGA2B could be involved in a novel mechanism through which MS could contribute to OA progression, potentially connecting OA cartilage regeneration with impaired cell proliferation and concomitant cell-cycle arrest.
However, our study has several limitations. First, the number of samples in the raw dataset was relatively small; further investigations based on a larger sample should be performed. Second, hub genes were identified using bioinformatics analysis; thus, experimental studies are needed to validate our results. Thirdly, since subjects that have both OA and MS were not explored, the validity of our results needs further experimental verification. Despite these limitations, this study provided some new insights into the biomarkers and pathogenesis of comorbid MS and OA. Further studies are needed to corroborate these findings and investigate the potential mechanisms highlighting comorbidity between OA and MS.
Conclusion
In summary, the present study identified 4 potential diagnostic biomarkers, including ELOVL7, F2RL3, GP9, and ITGA2B for OA and MS based on comprehensive bioinformatics methods, which may provide new insights into the diagnosis and treatment of comorbid OA and MS. However, further studies are necessary to confirm these findings in our research on MS and OA pathogenesis due to some limitations mentioned above.
Acknowledgments
This work was kindly supported by Shanghai Integrated Traditional Chinese and Western Medicine Project for Ability Improvement of Rehabilitation Diagnosis and Treatment (ZY (2018-2020)-FWTX-8016). We thank Dr. Jonathan Griffiths from the Ruprecht Karl University of Heidelberg for English language editing and proofreading.
Author Contributions
All authors made a significant contribution to the work reported, whether that is in the conception, study design, execution, acquisition of data, analysis and interpretation, or in all these areas; took part in drafting, revising or critically reviewing the article; gave final approval of the version to be published; have agreed on the journal to which the article has been submitted; and agree to be accountable for all aspects of the work. Xiang Jiang, Rongzhou Zhong and Weifan Dai are the co-first authors of this study; Yanrong Cai is the corresponding author of this study.
Disclosure
The authors report no conflicts of interest in this work.
References
1. Robinson WH, Lepus CM, Wang Q, et al. Low-grade inflammation as a key mediator of the pathogenesis of osteoarthritis. Nat Rev Rheumatol. 2016;12(10):580–592. doi:10.1038/nrrheum.2016.136
2. Obesity A. Osteoarthritis. Nat Rev Dis Primer. 2016;2(1):16073. doi:10.1038/nrdp.2016.73
3. Marian M, Shah R, Gashi B, et al. Exploring the lubrication mechanisms of synovial fluids for joint longevity - A perspective. Colloids Surf B Biointerfaces. 2021;206:111926. doi:10.1016/j.colsurfb.2021.111926
4. Loeser RF, Goldring SR, Scanzello CR, Goldring MB. Osteoarthritis: a disease of the joint as an organ. Arthritis Rheum. 2012;64(6):1697–1707. doi:10.1002/art.34453
5. Grässel S, Aszódi A. Cartilage. Springer; 2016.
6. Lorenzo J, Horowitz M, Choi Y, Takayanagi H, Schett G, eds. Osteoimmunology: Interactions of the Immune and Skeletal Systems.
7. Störch H, Zimmermann B, Resch B, et al. Activated human B cells induce inflammatory fibroblasts with cartilage-destructive properties and become functionally suppressed in return. Ann Rheum Dis. 2016;75(5):924–932. doi:10.1136/annrheumdis-2014-206965
8. Platzer H, Nees TA, Reiner T, et al. Impact of Mononuclear Cell Infiltration on Chondrodestructive MMP/ADAMTS Production in Osteoarthritic Knee Joints—An Ex Vivo Study. J Clin Med. 2020;9(5):1279. doi:10.3390/jcm9051279
9. Gkretsi V, Simopoulou T, Tsezou A. Lipid metabolism and osteoarthritis: lessons from atherosclerosis. Prog Lipid Res. 2011;50(2):133–140. doi:10.1016/j.plipres.2010.11.001
10. Dickson BM, Roelofs AJ, Rochford JJ, Wilson HM, De Bari C. The burden of metabolic syndrome on osteoarthritic joints. Arthritis Res Ther. 2019;21(1):289. doi:10.1186/s13075-019-2081-x
11. Reyes C, Leyland KM, Peat G, Cooper C, Arden NK, Prieto-Alhambra D. Association Between Overweight and Obesity and Risk of Clinically Diagnosed Knee, Hip, and Hand Osteoarthritis: a Population-Based Cohort Study: OVERWEIGHT/OBESITY AND THE RISK OF DEVELOPING OA. Arthritis Rheumatol. 2016;68(8):1869–1875. doi:10.1002/art.39707
12. Messier SP, Pater M, Beavers DP, et al. Influences of alignment and obesity on knee joint loading in osteoarthritic gait. Osteoarthritis Cartilage. 2014;22(7):912–917. doi:10.1016/j.joca.2014.05.013
13. Visser A, Ioan-Facsinay A, de Mutsert R, et al. Adiposity and hand osteoarthritis: the Netherlands Epidemiology of Obesity study. Arthritis Res Ther. 2014;16(1):R19. doi:10.1186/ar4447
14. Scotece M, Mobasheri A. Leptin in osteoarthritis: focus on articular cartilage and chondrocytes. Life Sci. 2015;140:75–78. doi:10.1016/j.lfs.2015.05.025
15. Gao Y-H, Zhao C-W, Liu B, et al. An update on the association between metabolic syndrome and osteoarthritis and on the potential role of leptin in osteoarthritis. Cytokine. 2020;129:155043. doi:10.1016/j.cyto.2020.155043
16. Hui W, Litherland GJ, Elias MS, et al. Leptin produced by joint white adipose tissue induces cartilage degradation via upregulation and activation of matrix metalloproteinases. Ann Rheum Dis. 2012;71(3):455–462. doi:10.1136/annrheumdis-2011-200372
17. Frey N, Hügle T, Jick SS, Meier CR, Spoendlin J. Hyperlipidaemia and incident osteoarthritis of the hand: a population-based case-control study. Osteoarthritis Cartilage. 2017;25(7):1040–1045. doi:10.1016/j.joca.2017.01.014
18. Berenbaum F, Griffin TM, Liu‐Bryan R. Review: metabolic Regulation of Inflammation in Osteoarthritis. Arthritis Rheumatol. 2017;69(1):9–21. doi:10.1002/art.39842
19. Langfelder P, Horvath S. WGCNA: an R package for weighted correlation network analysis. BMC Bioinform. 2008;9:559. doi:10.1186/1471-2105-9-559
20. Gene Ontology Consortium. Gene Ontology Consortium: going forward. Nucleic Acids Res. 2015;43(Databaseissue):D1049–1056. doi:10.1093/nar/gku1179
21. Subramanian A, Tamayo P, Mootha VK, et al. Gene set enrichment analysis: a knowledge-based approach for interpreting genome-wide expression profiles. Proc Natl Acad Sci U S A. 2005;102(43):15545–15550. doi:10.1073/pnas.0506580102
22. Mobasheri A, Rayman MP, Gualillo O, Sellam J, van der Kraan P, Fearon U. The role of metabolism in the pathogenesis of osteoarthritis. Nat Rev Rheumatol. 2017;13(5):302–311. doi:10.1038/nrrheum.2017.50
23. Gkretsi V, Simopoulou T, Tsezou A. Lipid metabolism and osteoarthritis: lessons from atherosclerosis. Prog Lipid Res. 2011;50(2):133–140. doi:10.1016/j.plipres.2010.11.001
24. Andia I, Maffulli N. Platelet-rich plasma for managing pain and inflammation in osteoarthritis. Nat Rev Rheumatol. 2013;9(12):721–730. doi:10.1038/nrrheum.2013.141
25. Isomaa B, Almgren P, Tuomi T, et al. Cardiovascular Morbidity and Mortality Associated With the Metabolic Syndrome. Diabetes Care. 2001;24(4):683–689. doi:10.2337/diacare.24.4.683
26. Zimmet P, Magliano D, Matsuzawa Y, Alberti G, Shaw J. The metabolic syndrome: a global public health problem and a new definition. J Atheroscler Thromb. 2005;12(6):295–300. doi:10.5551/jat.12.295
27. Huang PL. A comprehensive definition for metabolic syndrome. Dis Model Mech. 2009;2(5–6):231–237. doi:10.1242/dmm.001180
28. Mobasheri A, Henrotin Y. Biomarkers of (osteo)arthritis. Biomarkers. 2015;20(8):513–518. doi:10.3109/1354750X.2016.1140930
29. Bijlsma JW, Berenbaum F, Lafeber FP. Osteoarthritis: an update with relevance for clinical practice. The Lancet. 2011;377(9783):2115–2126. doi:10.1016/S0140-6736(11)60243-2
30. Shi W, Luo L, Loor L. Fatty Acid Elongase 7 (ELOVL7) Plays a Role in the Synthesis of Long-Chain Unsaturated Fatty Acids in Goat Mammary Epithelial Cells. Animals. 2019;9(6):389. doi:10.3390/ani9060389
31. Chen S, Hu Z, He H, Liu X. Fatty acid elongase7 is regulated via SP1 and is involved in lipid accumulation in bovine mammary epithelial cells. J Cell Physiol. 2018;233(6):4715–4725. doi:10.1002/jcp.26255
32. Tamura K, Makino A, Hullin-Matsuda F, et al. Novel Lipogenic Enzyme ELOVL7 Is Involved in Prostate Cancer Growth through Saturated Long-Chain Fatty Acid Metabolism. Cancer Res. 2009;69(20):8133–8140. doi:10.1158/0008-5472.CAN-09-0775
33. Ashraf S, Walsh DA. Angiogenesis in osteoarthritis. Curr Opin Rheumatol. 2008;20(5):573–580. doi:10.1097/BOR.0b013e3283103d12
34. Ratneswaran A, LeBlanc EA, Walser E, et al. Peroxisome Proliferator–Activated Receptor δ Promotes the Progression of Posttraumatic Osteoarthritis in a Mouse Model. Arthritis Rheumatol. 2015;67(2):454–464. doi:10.1002/art.38915
35. van Gastel N, Stegen S, Eelen G, et al. Lipid availability determines fate of skeletal progenitor cells via SOX9. Nature. 2020;579(7797):111–117. doi:10.1038/s41586-020-2050-1
36. Busso N, Chobaz-Péclat V, Hamilton J, Spee P, Wagtmann N, So A. Essential role of platelet activation via protease activated receptor 4 in tissue factor-initiated inflammation. Arthritis Res Ther. 2008;10(2):R42. doi:10.1186/ar2400
37. Kotani K, Sakane N, Saiga K, Mu H, Kurozawa Y. Clustered components of the metabolic syndrome and platelet counts in Japanese females. Clin Chem Lab Med. 2007;45:3. doi:10.1515/CCLM.2007.063
38. Kwon Y-J, Koh I-H, Chung K, Lee Y-J, Kim H-S. Association between platelet count and osteoarthritis in women older than 50 years. Ther Adv Musculoskelet Dis. 2020;12:1759720X2091286. doi:10.1177/1759720X20912861
39. Fan Z, Wang L, Jiang H, Lin Y, Wang Z. Platelet dysfunction and its role in the pathogenesis of psoriasis. Dermatology. 2021;237(1):56–65. doi:10.1159/000505536
40. Nurden AT, Pillois X, Fiore M, et al. Expanding the mutation spectrum affecting αiibβ3 integrin in glanzmann thrombasthenia: screening of the ITGA2B and ITGB3 Genes in a Large International Cohort. Hum Mutat. 2015;36(5):548–561. doi:10.1002/humu.22776
41. Ali S, Ghosh K, Shetty S. Novel genetic abnormalities in Bernard-Soulier syndrome in India. Ann Hematol. 2014;93(3):381–384. doi:10.1007/s00277-013-1895-x
42. Savoia A, Kunishima S, De Rocco D, et al. Spectrum of the mutations in Bernard-Soulier syndrome. Hum Mutat. 2014;35(9):1033–1045. doi:10.1002/humu.22607
43. Wang Q, Onuma K, Liu C, et al. Dysregulated integrin αVβ3 and CD47 signaling promotes joint inflammation, cartilage breakdown, and progression of osteoarthritis. JCI Insight. 2019;4(18):e128616. doi:10.1172/jci.insight.128616
44. Fahy N, Farrell E, Ritter T, Ryan AE, Murphy JM. Immune modulation to improve tissue engineering outcomes for cartilage repair in the osteoarthritic joint. Tissue Eng Part B Rev. 2015;21(1):55–66. doi:10.1089/ten.teb.2014.0098
45. Stegen S, Rinaldi G, Loopmans S, et al. Glutamine metabolism controls chondrocyte identity and function. Dev Cell. 2020;53(5):530–544.e8. doi:10.1016/j.devcel.2020.05.001
 © 2021 The Author(s). This work is published and licensed by Dove Medical Press Limited. The full terms of this license are available at https://www.dovepress.com/terms.php and incorporate the Creative Commons Attribution - Non Commercial (unported, v3.0) License.
By accessing the work you hereby accept the Terms. Non-commercial uses of the work are permitted without any further permission from Dove Medical Press Limited, provided the work is properly attributed. For permission for commercial use of this work, please see paragraphs 4.2 and 5 of our Terms.
© 2021 The Author(s). This work is published and licensed by Dove Medical Press Limited. The full terms of this license are available at https://www.dovepress.com/terms.php and incorporate the Creative Commons Attribution - Non Commercial (unported, v3.0) License.
By accessing the work you hereby accept the Terms. Non-commercial uses of the work are permitted without any further permission from Dove Medical Press Limited, provided the work is properly attributed. For permission for commercial use of this work, please see paragraphs 4.2 and 5 of our Terms.