")
Back to Journals » OncoTargets and Therapy » Volume 14
Exploration of the Associations of lncRNA Expression Patterns with Tumor Mutation Burden and Prognosis in Colon Cancer
Authors Ding C, Shan Z, Li M, Xia Y, Jin Z
Received 7 January 2021
Accepted for publication 22 March 2021
Published 29 April 2021 Volume 2021:14 Pages 2893—2909
DOI https://doi.org/10.2147/OTT.S300095
Checked for plagiarism Yes
Review by Single anonymous peer review
Peer reviewer comments 2
Editor who approved publication: Dr Federico Perche
Chengsheng Ding,1,* Zezhi Shan,2,3,* Mengcheng Li,1 Yang Xia,1 Zhiming Jin1
1Department of General Surgery, Shanghai Jiao Tong University Affiliated Sixth People’s Hospital, Shanghai, People’s Republic of China; 2Department of Colorectal Surgery, Fudan University Shanghai Cancer Center, Shanghai, People’s Republic of China; 3Department of Oncology, Shanghai Medical College, Fudan University, Shanghai, People’s Republic of China
*These authors contributed equally to this work
Correspondence: Yang Xia; Zhiming Jin
Department of General Surgery, Shanghai Jiao Tong University Affiliated Sixth People’s Hospital, Yishan Road 600, Shanghai, People’s Republic of China
Tel +86 15057728772
; +86 18930177680
Email [email protected]; [email protected]
Background: Tumor mutation burden (TMB) is emerging as a new biomarker to monitor the response of cancer patients to immunotherapy. Long non-coding RNAs (lncRNAs) are critical in regulating gene expression and play a significant role in cancer-associated immune responses. However, the association between lncRNA expression patterns and TMB levels and survival outcomes remains unknown in colon cancer.
Methods: In colon cancer patients from The Cancer Genome Atlas Program (TCGA), a multi-lncRNAs based classifier for predicting TMB levels was established using the least absolute shrinkage and selection operator (LASSO) method. The association between classifier index and immune-related characteristics of patients was also investigated. Quantitative polymerase chain reaction (qPCR) was used to verify the expression levels of these lncRNAs in normal and CRC cell lines.
Results: The multi-lncRNAs based classifier had ability to predict TMB level of patients with accuracy (AUC= 0.70), and the general applicability of this classifier was proved in the validation set (AUC= 0.71) and the pooled set (AUC= 0.70). The classifier index was related to three immune checkpoints (PD1, PD-L1, and CTLA-4), the infiltration level of immune cells, and immune response-related score (IFN-γ score, gene expression profiles (GEP) score, cytolytic activity (CYT) score and MHC score). A nomogram, which integrates classifier and some common clinical information, was able to predict the overall survival of colon cancer patients accurately.
Conclusion: LncRNA expression patterns are associated with TMB, which may serve as a classifier to predict the TMB in colon cancer patients. The nomogram could potentially evaluate survival outcomes and provide a reference to better manage colon cancer patients.
Keywords: colon cancer, long non-coding RNA, tumor mutation burden, immunotherapy, prognosis
Introduction
Colon cancer is one of the most common malignant tumors in humans. Its incidence and mortality are fourth and second respectively among 36 cancer types worldwide.1 The incidence of colon cancer is highest in developed countries, but rising in other parts of the world.2 Early colonoscopy screening and treatment improves the outcome of patients, but the mortality and recurrence rates of colon cancer are not significantly reduced. Indeed, 25–40% of patients who have undergone surgery and chemoradiotherapy experience tumor recurrence with an unsatisfactory prognosis.3 Studies have illustrated that dysregulation of the immune system can promote the development of cancer. Immunotherapy is rapidly attracting attention in cancer-associated treatment, because it has shown efficacy in some advanced and aggressive cancers.4–6 At present, tumor-cell PD-L1 expression7 and tumor-infiltrating lymphocytes8 have been identified as biomarkers to assist in predicting the response of immunotherapy. However, not all patients show a good response to immunotherapy, with some having no response.9 It is essential to understand the mechanism of immunotherapy and further explore the new biomarkers for predicting the treatment of immunotherapy better. TMB has emerged as a new promising biomarker for immunotherapy.10 It has been confirmed that TMB can predict the clinical efficacy of immunotherapy, as a biomarker, in several types of cancers.11,12 For colon cancer, Schrock et al13 showed that TMB may be an important biomarker for predicting responsiveness of colon cancer patients to immunotherapy; measuring the TMB using whole-exome sequencing (WES) or targeted sequencing panels is a mainstream approach.14–16 The traditional assessment of TMB requires adequate amounts of tumor DNA; it is difficult to obtain a sufficient quantity of tumor DNA using a fine needle biopsy.17 High TMB of tumor patients leads to the generation of neo-epitopes by modifying the proteins encoded with mutated genes, and the immune system recognizes neo-epitopes as “non-self” then activates host anti-cancer immune responses.18
LncRNAs are non-coding RNAs with > 200 nt in length, and they are short of coding capacity but can encode some small peptides.19,20 LncRNAs are regarded as transcriptional noise, but are currently thought to play a significant role in regulating diverse biological processes.21,22 Arunoday Bhan et al showed that a large number of lncRNAs are involved in the development of some types of cancers with their tumor-suppressive or tumor-promoting functions.23 LncRNAs show promise as new biomarkers and targets for cancer treatment due to the genome-wide expression pattern in different tissues and tissue-specific expression characteristics of lncRNAs. In terms of immunotherapy, lncRNAs seem to regulate tumor immunity by directly regulating genes that are related to immune suppression or activation.24 For example, LINK-A, one of the oncogenic lncRNAs, plays an important role in downregulating cancer cell antigenicity and intrinsic tumor suppression.25 NKILA lncRNA, an NF-κB-interacting lncRNA, promotes tumor immune evasion by regulating T cell sensitivity to activation-induced cell death (AICD).26 In addition, some lncRNAs, known as immune-related lncRNAs, may play a crucial role in immunotherapy resistance by regulating the expression of immune cell-specific genes that mediate immune processes.27 Therefore, this study hypothesized that the expression pattern of lncRNAs could reflect different TMB levels and was related to the survival outcomes of colon cancer patients. There are no studies that have evaluated the association of lncRNA expression patterns with TMB level and overall survival (OS) in colon cancer.
To validate this assumption, the datasets of colon adenocarcinoma (COAD) were acquired from the TCGA database, which integrates RNA sequencing data, mutation annotation format, and corresponding clinical information. Differentially expressed lncRNAs were identified between low- and high-TMB groups. Then, LASSO method was applied to select significant candidate lncRNAs for construction of 14-lncRNA based classifier, which could predict TMB levels and prognosis of colon patients. Based on the classifier, we can also explore the different immune-related characteristics of each colon cancer patient. Hence,this multi-lncRNAs based classifier would have very clinical value for colon cancer patients.
Materials and Methods
Data Processing
The RNA sequencing data of 473 colon cancer and 41 normal colon tissue samples with HTSeq-FPKM workflow type from the TCGA database, were downloaded (https://portal.gdc.cancer.gov/). The corresponding clinical information was also downloaded from the database via the GDC data portal; it included clinical information, such as overall survival time, survival state, age, gender, pathological stage, and AJCC-TNM stages. The lncRNA sequencing data was selected from RNA sequencing data via Perl scripts based on the JAVA8 platform. Meanwhile, mutation annotation format (MAF) of 399 colon cancer patients with Masked Somatic Mutation type processed using Mutect2 software from the TCGA database was obtained. Mutation profiles were processed using the “maftools” R package, which could display the results of analysis modules in the visualization. Tumor mutational burden was defined as the number of somatic variants per million bases of the genome. Somatic variants included coding errors in somatic genes, base substitutions, insertions, or deletions. Finally, 390 samples had intact information of lncRNA sequencing, somatic mutational data, and clinical variants. There were 390 samples randomly assigned to the training set (50%) and validation set (50%) using the “caret” package in R.
Relationship of TMB with Clinical Variants and CIBERSORT Results
The Perl scripts based on the JAVA8 platform was utilized to calculate the TMB level (the number of variants per million base-pairs). All colon samples were classified into the low- and high-TMB groups according to the median value of TMB. Samples that had full information of both TMB data and corresponding survival information were selected. The “limma” and “survival” packages in R were utilized to compare the survival difference in low- and high-TMB groups. The relationship between TMB level and clinical characteristics was also determined. The Wilcoxon rank-sum test and Kruskal–Wallis (K-W) test were utilized for comparisons between two and > three groups respectively. The RNA sequencing profiles from TCGA and utilized “limma” R script was extracted to normalize the profiles. The processed data was analyzed using the CIBERSORT algorithm (R script v1.03), based on a known reference set that includes gene expression features of 22 leukocyte subtypes-LM22, to estimate the percentage of immune cells in each patient. The different infiltration levels of immune cells between the low- and high-TMB groups were determined using the Wilcoxon rank-sum test, and were displayed via the “vioplot” R package.
Differentially Expressed lncRNAs Between Low- and High-TMB Group
For the training set, the colon samples were divided into the low- and high-TMB groups according to the median value of TMB. The “limma” package in R was utilized to identify the differentially expressed lncRNAs between low TMB and high TMB groups. The lncRNAs with |log2FC|>0.263 and False Discovery Rate (FDR) <0.05 were considered significant. Then, the “pheatmap” package was utilized to display differentially expressed lncRNAs in a heat map.
Establishment of a Multi-lncRNAs Based Classifier to Predicting TMB
Total expression values of differentially expressed lncRNAs for each colon sample in the training set were extracted. Least Absolute Shrinkage and Selection Operator (LASSO) is a regression analysis method that performs both variable selection and regularization to enhance the prediction accuracy and interpretability of the statistical model it produces. The differentially expressed lncRNAs were screened using the LASSO method using the “glmnet” package in R to select the optimal lncRNAs to predict TMB level.
Then, lncRNAs with nonzero regression coefficients were utilized to construct a multi-lncRNAs based classifier for predicting the TMB level. The index of each sample was calculated using the expression values of optimal differentially expressed lncRNAs multiplied using nonzero regression coefficients from the LASSO method. The formula was as follows:
Index = Coef1*ExplncRNA1 + Coef2*ExplncRNA2 + Coef3*ExplncRNA3 + Coef4*ExplncRNA4 + …
The “Coef” represents nonzero regression coefficients from the LASSO method, and “ExplncRNA” is the expression values of optimal differentially expressed lncRNAs. The accuracy, robustness, and transferability of multi-lncRNAs were validated based on classifiers in the validation and pooled sets. Finally, the “pROC” package in R was utilized to plot the ROC curves, and area under the ROC curve (AUC) to evaluate the effectiveness of the classifier. The effectiveness of the classifier was compared with some clinical characteristics through the Online ROC Curves (http://www.houshixu.cn:3838/sample-apps/ROC/).
Relationships of the Multi-lncRNAs Based Classifier Index with TMB, the Infiltration Level of Immune Cells, ICIs and Immune Response-Related Score
The above mentioned TMB and the immune cells with significantly different infiltration levels were selected to explore the relationships with the classifier index. We extracted the expression level of PD1, PD-L1, and CTLA-4 genes from RNA sequencing data with HTSeq-FPKM workflow type, then assessed the relationships of the multi-lncRNAs-based classifier index with TMB and three immune checkpoints (PD1, PD-L1, CTLA-4). Beyond that, the immune response-related score (IFN-γ score, GEP score, CYT score, and MHC score) was downloaded from previous studies,28–30 and the association between the classifier and the immune response-related score was also explored.
Correlation Between Multi-lncRNAs Based Classifier Index and Prognosis
The classifier index was merged with the corresponding survival information using the ID number of samples. The X-tile software was used to search the optimal cut off value of the index for predicting prognosis of patients, then we divided patients into low- and high-index groups using cut off value. Kaplan-Meier analysis was utilized to access the survival difference between the low- and high-index groups. The P of Log rank test was then calculated. The differences in the infiltration level of immune cells and the immune response-related score between the low- and high-index groups were also explored. Finally, the results were visually displayed through the “survival” and “vioplot” R scripts.
A Nomogram for Predicting OS in Colon Cancer
In the pooled set, we utilized the “rms” package in R to establish a nomogram that contained age, gender, pathological stages, AJCC-TNM stages, CEA, and multi-lncRNAs based classifier index for predicting the OS of patients. The calibration curve was plotted to estimate the uniformity of the nomogram to predict OS possibility and actual OS. Meanwhile, C-index was calculated. To examine whether the classifier index is independent of other clinical factors, multivariate Cox regression analysis was applied.
Cell Lines Culture and Real-Time Quantitative PCR (RT-qPCR) Analysis
All cell lines HIEC, DLD1, SW480, HCT116 were purchased from the Institute of Biochemistry and Cell Biology of the Chinese Academy of Sciences (Shanghai, China).
Cells were cultured in RPMI-1640 or DMEM (Gibco, Grand Island, NY, USA) supplemented with 10% fetal bovine serum (FBS), 1% penicillin/streptomycin (Gibco) at 37°C with 5% CO2. Total lncRNA was extracted from cell lines using TRIzol (Invitrogen, Carlsbad, CA) according to the manufacturer’s protocol reverse-transcribed to cDNA with a Reverse Transcription Kit (Takara, Japan) following the manufacturer’s instructions. RT-qPCR was performed using the Light Cycler 480 system (Roche, USA) using SYBR Green Master Mix (Vazyme, USA). The primer sequences are shown in Table 1. The relative intensity of target lncRNAs were normalized to the expression of GAPDH and calculated based on 2−ΔΔct method. All reactions were performed in triplicate.
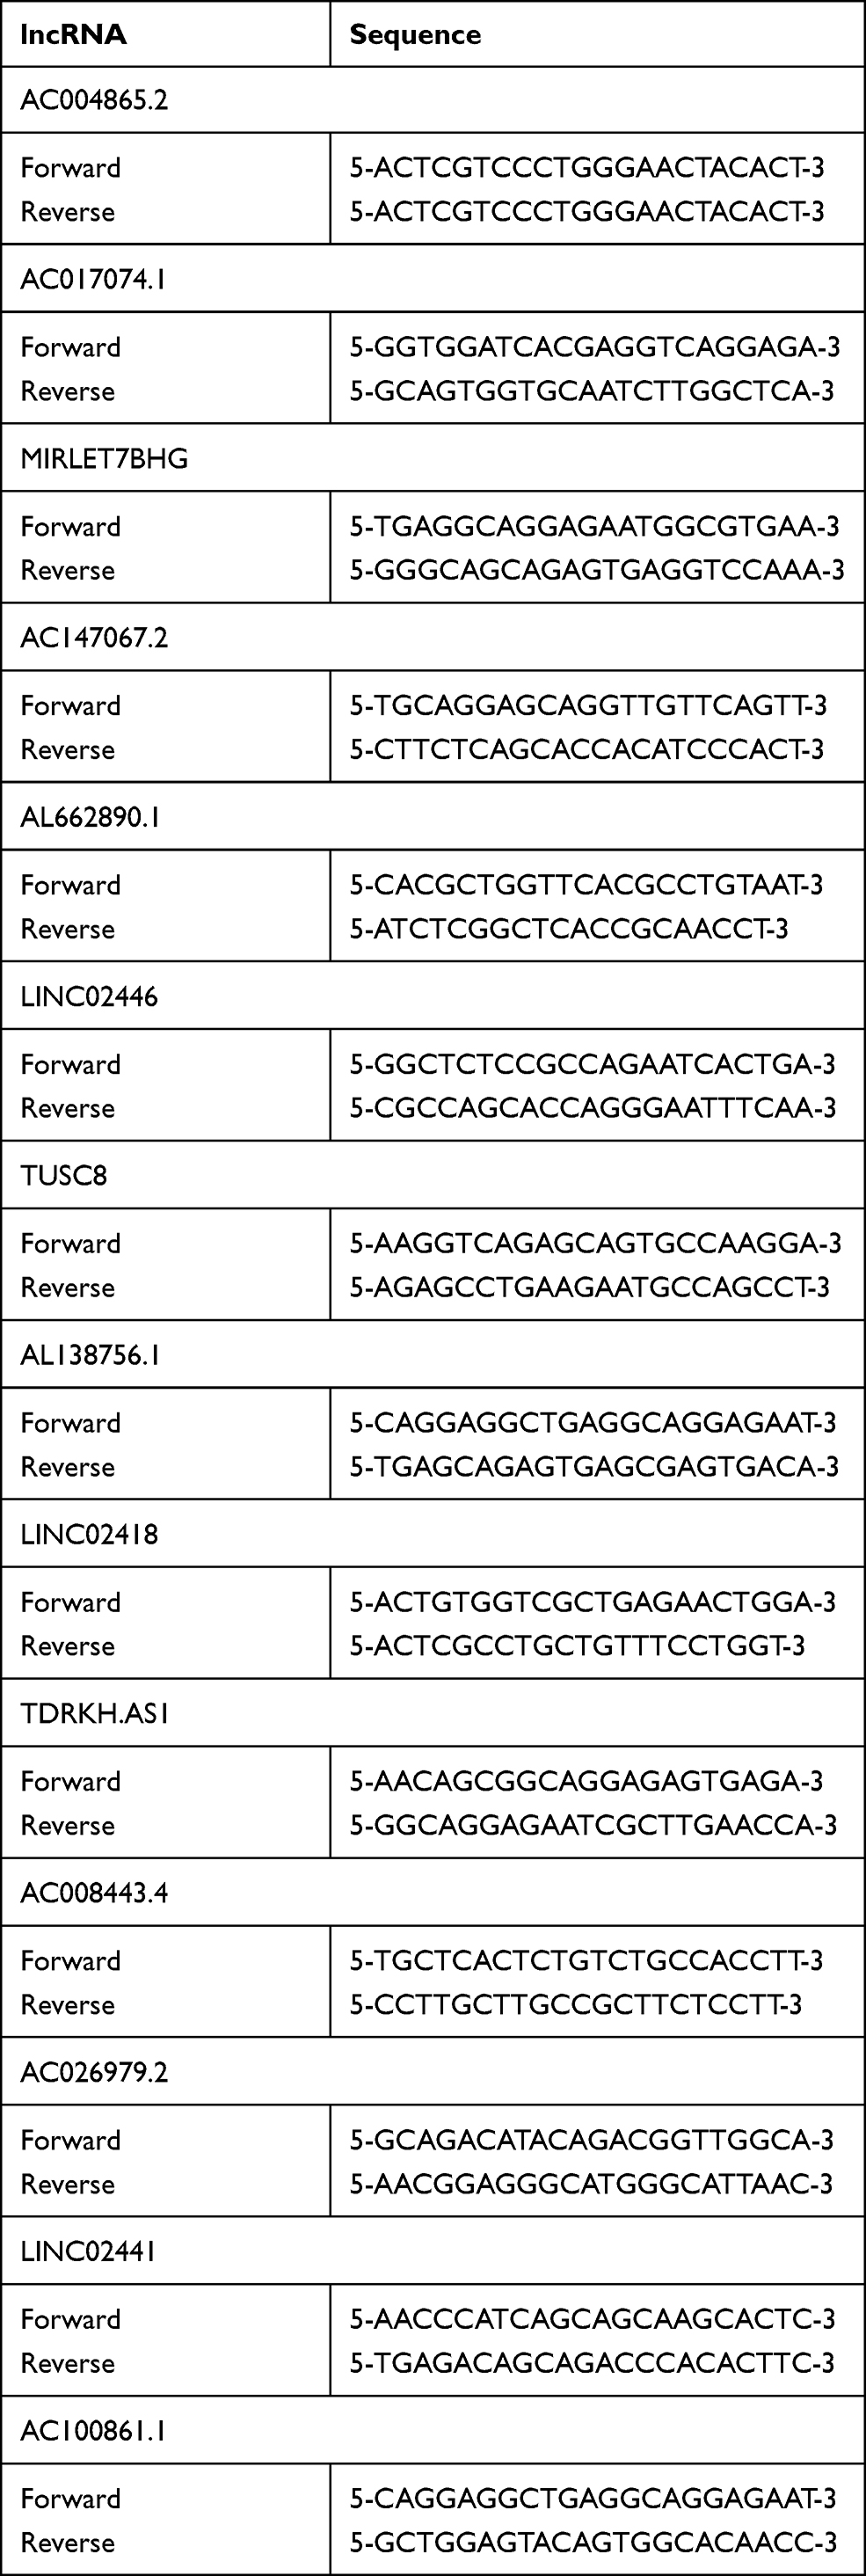 |
Table 1 The Sequences of Forward and Reverse Primers |
Statistical Analysis
The LASSO regression analysis model was processed using the “glmnet” package in R. Wilcoxon rank-sum test was applied to compare the difference between the two groups, whereas the Kruskal–Wallis test was performed to compare three or more groups. Kaplan-Meier analysis was utilized to evaluate the survival differences between low- and high-groups. The ROC curve was plotted to access the effectiveness of the classifier. All the statistical analysis was conducted in R 4.0.0 (P < 0.05).
Results
An Overview of Mutation in Colon Samples
The Mutation Annotation Format (MAF) of 399 colon cancer samples with Masked Somatic Mutation type processed by Mutect2 software were downloaded from the TCGA database. The “maftools” package in R was used to display the result of mutation data. The waterfall plot was used to display the mutation expression of each gene in all samples and different patterns of the mutation were represented by corresponding colors at the bottom of the picture (Figure 1A). The mutation data were further classified according to different classified categories in the summary plot. Missense mutation was the most common variant (Figure 1B), single nucleotide polymorphism (SNP) showed larger proportion than insertion or deletion (Figure 1C), and C>T occurred most frequently in the single nucleotide variants (SNV) (Figure 1D). The number of variants per sample was calculated and visualized the variant classification with corresponding colors in the box plot (Figure 1E and F. The top 10 mutated genes were: TTN (53%), APC (74%), MUC16 (31%), SYNE1 (30%), TP53 (54%), FAT4 (26%), KRAS (41%), RYR2 (23%), OBSCN (22%), and PIK3CA (29%) (Figure 1G). The coincident and exclusive relationships of mutated genes were reported, where the co-occurrence and the mutually exclusive relationships were represented in green and red, respectively (Figure 1H). The Gene Cloud plot displayed the mutated gene frequencies (Supplement Figure S1).
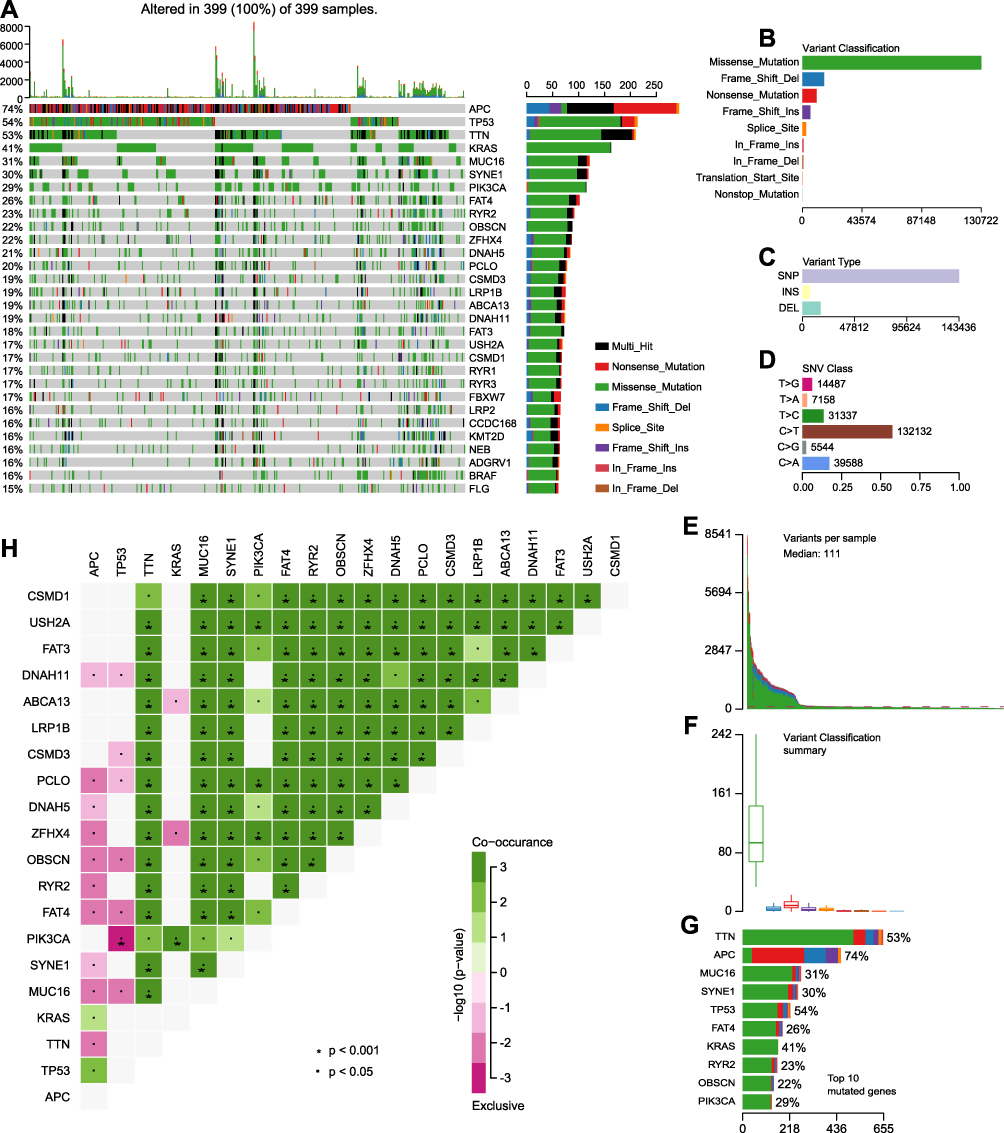 |
Figure 1 Landscape of mutational profiles in colon cancer patients. (A) Mutation information of each gene in each patient is shown in the waterfall plot; various colors with annotations on the right represented the different mutation types. The barplot exhibited the mutation burden. (B) Classification of mutation types according to different categories; missense mutation accounts for the most fraction. (C) Single nucleotide polymorphism (SNP) showing a larger proportion than insertion or deletion. (D) In single nucleotide variants (SNV); C>T occurred most frequently. (E and F) Tumor mutation burden in samples. (G) The top 10 mutated genes in colon cancer. (H) The coincident and exclusive relationships of mutated genes. |
Moreover, the clinical information of the training set and the validation set was shown in Table 2.
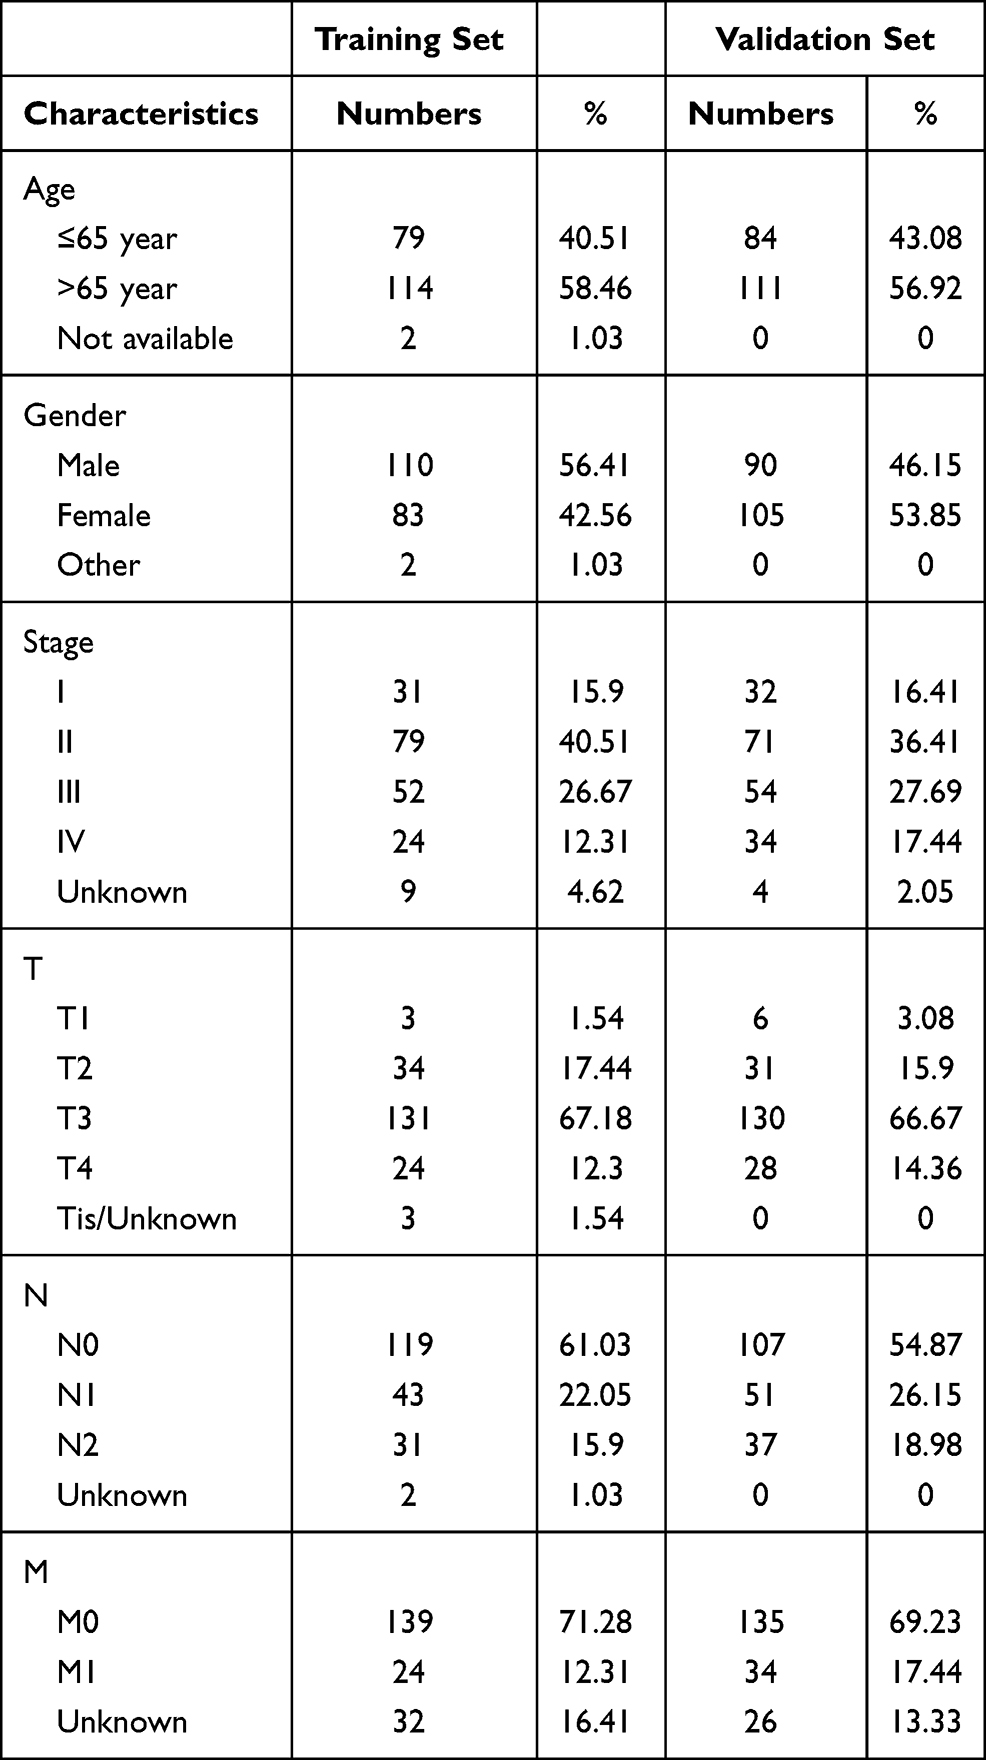 |
Table 2 Clinical Baseline of 390 Colon Cancer Patients in Study |
TMB Correlated with Prognosis, Age and AJCC-TNM Stages
The TMB was calculated as the number of mutation variants per million bases in 399 colon cancer patients. The patients were divided into the low- and high-TMB groups using the median TMB value. Patients in the high TMB group had a worse prognosis than those in the low group (P= 0.007, Figure 2A). This was opposite to another study that reported that higher TMB promotes the immune response and prolongs the survival period. High TMB levels were found to be related to early pathological stages (Figure 2B). In terms of the AJCC-TNM stage, there was no significant difference in TMB level between T1-2 and T3-4 (Figure 2C), while patients in N0, M0 stages had higher TMB levels than patients in N1-2, M1 stages (Figure 2D and E. In addition, patients > 65 year-old had higher TMB levels than ≤ 65-year-old patients (Supplement Figure 2A). However, there was no significant difference in gender and CEA levels (Supplement Figure S2B and C).
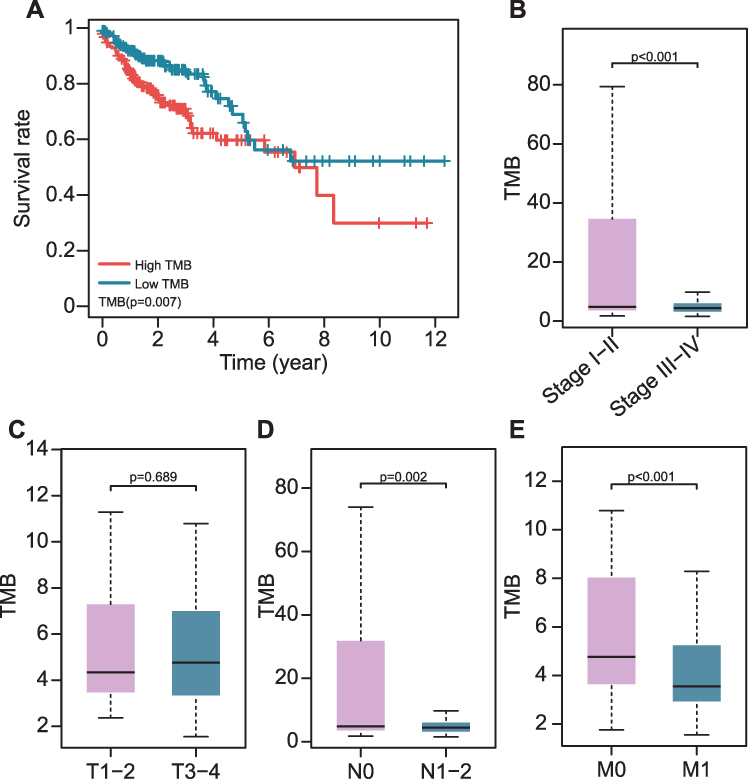 |
Figure 2 The association of TMB with clinical characteristics and prognosis. (A) Higher TMB levels correlated with poor survival outcomes (P=0.007). (B–E) The association of TMB with pathological stages; T, N, and M stages. |
Different Infiltration Levels of Immune Cells Between Low- and High-TMB Groups
The TMB level was related to the survival outcomes of colon cancer patients and a biomarker for immunotherapy response. The infiltration level of immune cells in the low- and high-TMB groups was compared. The specific percentage of 22 immune cells in each colon cancer patient was reported in a bar plot (Figure 3A). Then, we compared the different infiltration levels of immune cells in the low- and high-TMB groups using the Wilcoxon rank-sum test (P< 0.05). As shown in Figure 3B, the infiltration levels of CD8+ T cell, CD4+ memory activated T cell, follicular helper T cell, M1 macrophage, and activated NK cell were higher in the high-TMB group (marked with red color). However, the infiltration levels of regulatory T cell, M0 macrophage was higher in the low-TMB group (marked with blue color).
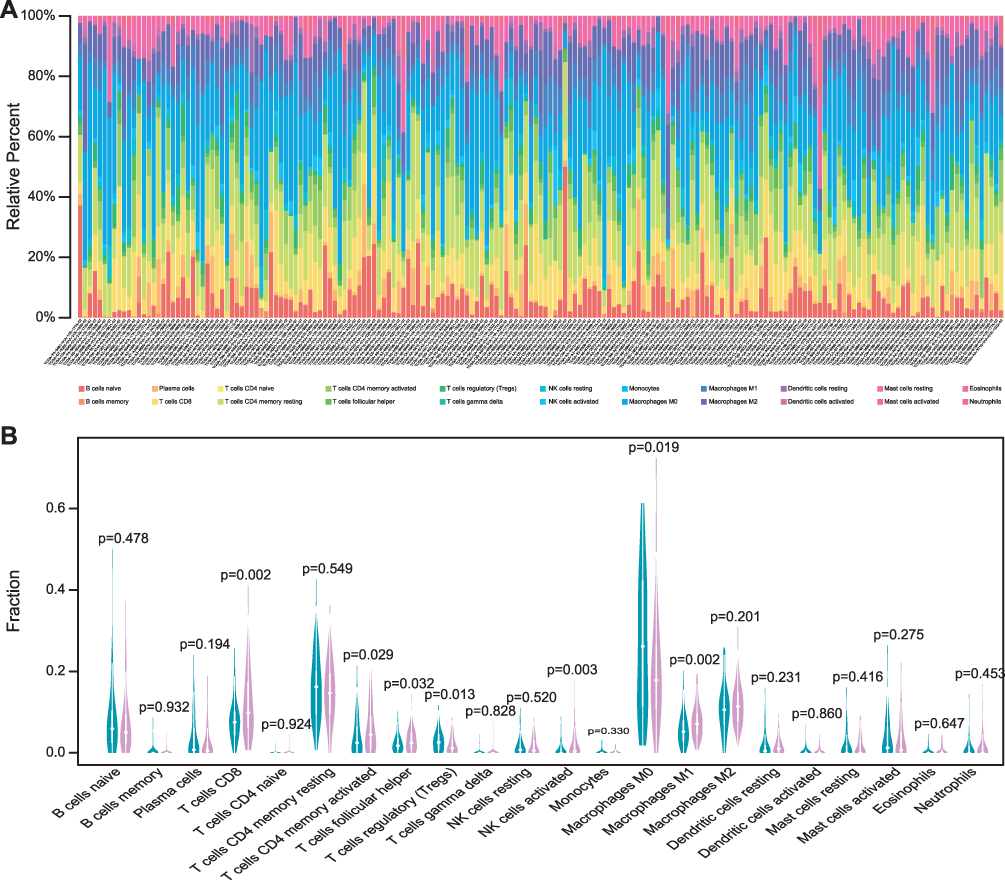 |
Figure 3 Comparisons of 22 important immune fractions between low- and high-TMB groups. (A) Barplot showing the specific 22 immune cells percentages displayed by different colors in each sample. (B) Wilcoxon rank-sum test revealed the different infiltration levels of immune cells between low- and high-TMB groups. Blue represented low-TMB group, red represented high-TMB group. |
Different Expression of lncRNAs Between Low- and High-TMB Groups
The patients were classified into the low- and high-TMB groups in the training set, according to the median value of TMB. Then, 195 differently expressed lncRNAs were screened out with FDR < 0.05 and |log2FC|>0.263. There were 119 down-regulated and 76 up-regulated lncRNAs in the high-TMB group. A heat map visualized the results of the top 20 down- and up-regulated lncRNAs (Figure 4A); the blue bar presented low expression and the red bar presented high expression. The low- and high-TMB groups had a different expression pattern of differently expressed lncRNAs.
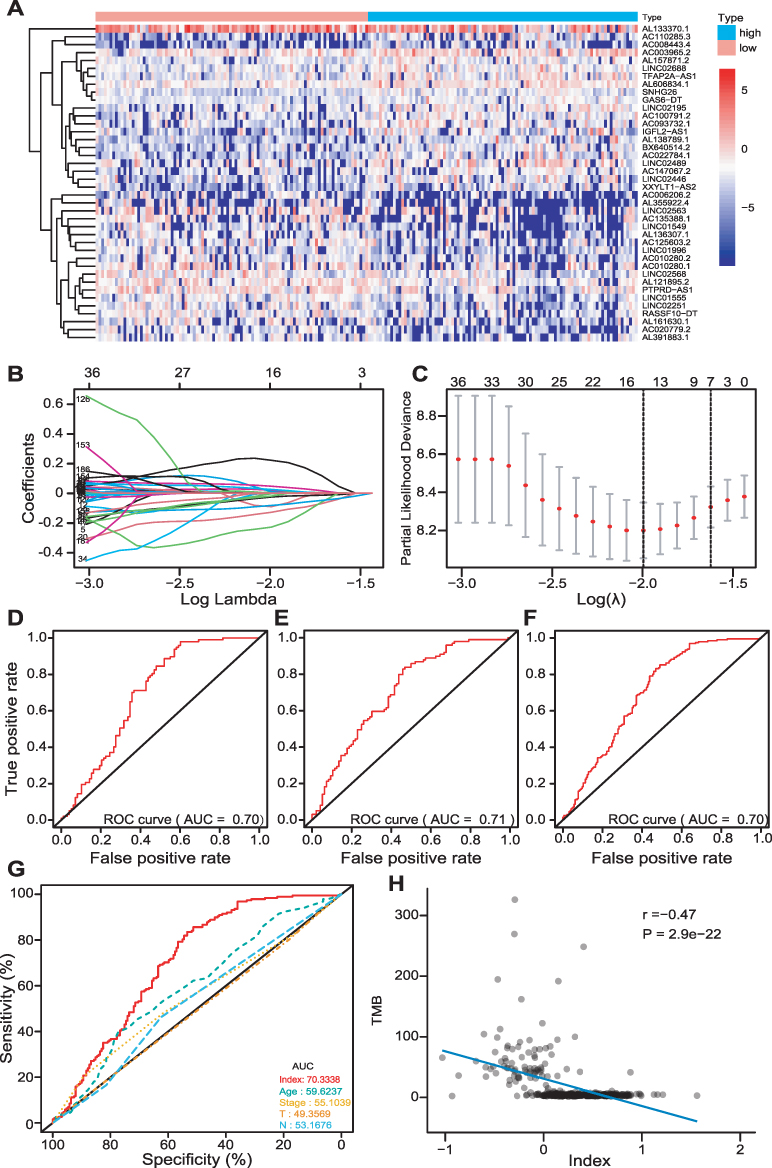 |
Figure 4 Development of a multi-lncRNAs based classifier. (A) The expression heat map of the top 20 down- and up-regulated differently expressed lncRNAs between low- and high-TMB groups. (B and C) Optimal lncRNAs selection in the LASSO regression model. (D–F) Receiver operating characteristic analyses in the training, validation, and pooled set. (G) Receiver operating characteristic analyses of multi-lncRNAs based classifier index and clinical characteristics. (H) The correlation between the classifier index and TMB. |
Establishment of LASSO Regression Model
The LASSO method was utilized to screen out 14 lncRNAs with nonzero regression coefficients (Figure 4B and C) as optimal features from 195 differently expressed lncRNAs and lambda.min= 0.1359374. The multi-lncRNAs based classifier index was calculated as the following formula:
Index = AC004865.2 * (−0.09133) + AC017074.1 * 0.019747 + MIRLET7BHG * (−0.02642) + AC147067.2 * (−0.12924) + AL662890.1 * (−0.22917) + LINC02446 * (−0.08308) + TUSC8 * 0.005121 + AL138756.1 * 0.010298 + LINC02418 * 0.046515 + TDRKH.AS1 * 0.221224 + AC008443.4 * (−0.00195) + AC026979.2 * (−0.00408) + LINC02441 * 0.024832 + AC100861.1 * (−0.02021).
The ROC analysis was performed to access the multi-lncRNAs based classifier in the training, validation, and pooled sets, respectively, to validate the accuracy, robustness, and transferability of the multi-lncRNAs based classifier. The AUC was 0.70 in the training set, 0.71 in the validation set, and 0.70 in the pooled set (Figure 4D–F). The AUC of ROC demonstrated that a multi-lncRNAs-based classifier presented a superior ability to predict TMB level than clinical characteristics, such as age and pathological stages (Figure 4G).
Relationships of Multi-lncRNAs Based Classifier Index with TMB, the Infiltration Level of Immune Cells, ICIs and Immune Response-Related Score
We calculated the multi-lncRNAs based classifier index of all patients using the above formula. The relationships of the classifier index with TMB, the infiltration level of immune cells, ICIs, and immune response-related scores were evaluated. The index is highly correlated with TMB with Pearson R = −0.47, P = 2.9e-22 (Figure 4H); it indicated that classifier could predict for TMB effectively. For immune cells with significantly different infiltration, the classifier index was negatively related to the infiltration levels of CD8+ T cell, M1 macrophage, activated NK cell, whereas it was positively related to the infiltration levels of CD4+ memory activated T cell, and M0 macrophage. However, follicular helper and regulatory T cells had no significant association with the classifier index (Supplement Figure S3A–E). The classifier index showed a high relationship with ICIs. The result was as follows: PD1 with Pearson R = −0.42, P = 1.5e-17, PD-L1 with Pearson R = −0.46, P = 1.4e-21, CTLA-4 with Pearson R = −0.38, P = 1.1e-14 (Figure 5A–C). In addition, the classifier index had negatively association with CYT score (Pearson R = −0.50, P = 2.5e-25) (Figure 5D), INF-γ score (Pearson R = −0.50, P = 2.5e-25) (Figure 5E), GEP score (Pearson R = −0.51, P = 5.8e-26) (Figure 5F) as well as MHC score (Pearson R = −0.36, P = 4.3e-13) (Figure 5G). These results indicate that colon cancer patients with high TMB may have better responses to immunotherapy compared to patients with low TMB.
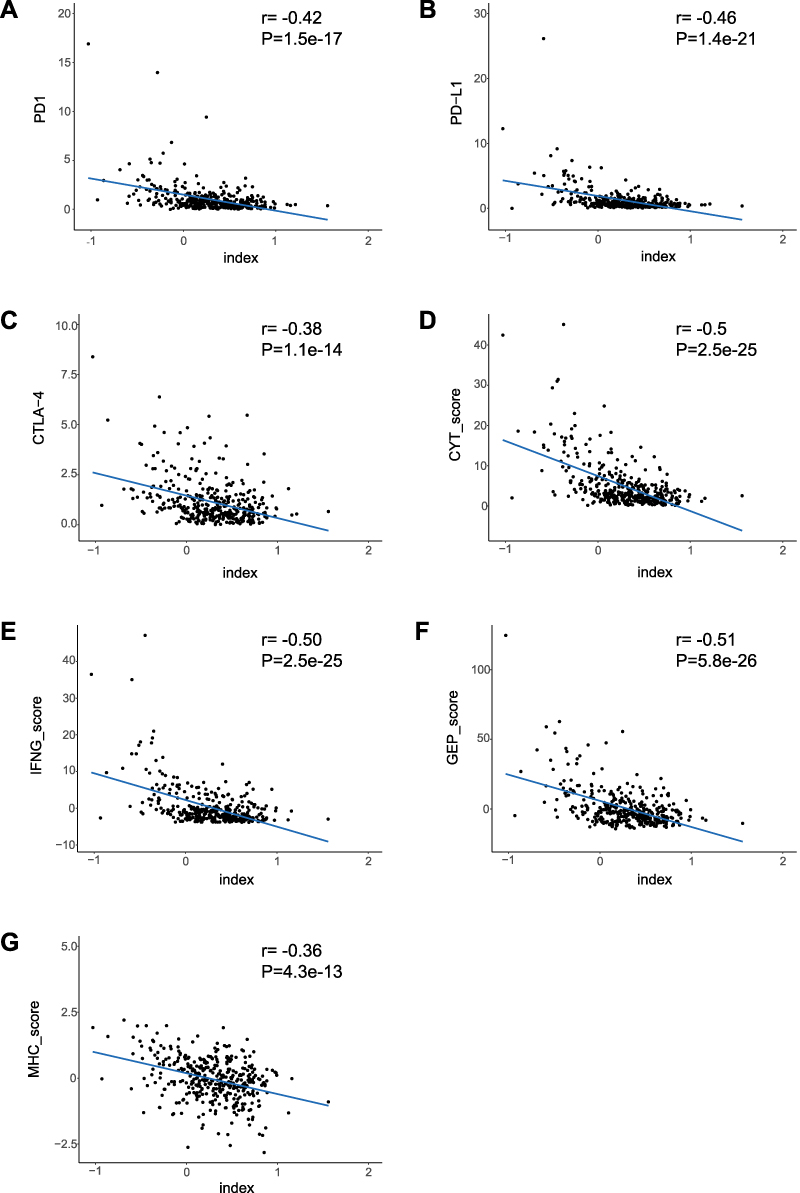 |
Figure 5 The association between the classifier index and immune features. (A–G) The correlation of the classifier index with PD1, PD-L1, CTLA-4, CYT score, IFN-γ score, GEP score, as well as MHC score. |
Multi-lncRNAs Based Classifier Index Predict for Prognosis
All patients were divided into the low- and high-index groups using the cut off value, −0.26, using the X-tile software. Patients in the high-index group had a better prognosis than those in the low-index group (P= 0.042, Figure 6A). The index of colon cancer patients was ranked, and the patients divided into the low- and high-index groups based on the cut-off value calculated above (Figure 6B).
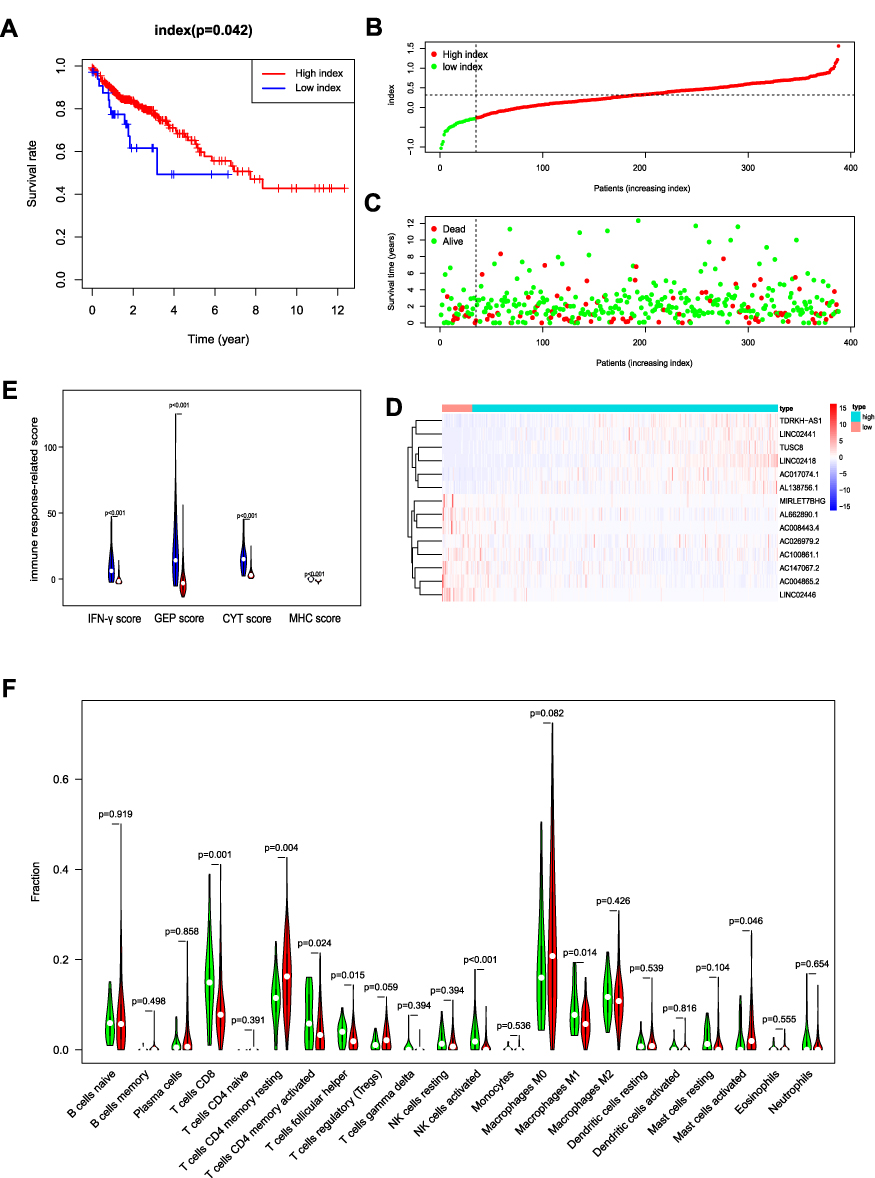 |
Figure 6 OS-related multi-lncRNAs based classifier index of colon cancer patients. (A). A higher index correlated with good survival outcomes (P= 0.042). (B) The classifier index distribution of colon cancer patients. (C) The overall survival of patients. (D) Heat map showing the different expression of 14 lncRNAs in low- and high-index groups. (E) IFN-γ score, GEP score, CYT score, and MHC score were all higher in the low-index group. Low-index group was marked with blue, high-index group was marked with red. (F) Wilcoxon rank-sum test revealed that the infiltration levels of CD8+ T cell, CD4+ memory activated T cell, follicular helper T cell, activated NK cell and M1 macrophage were higher in the low-index group, and the infiltration levels of CD4+ memory resting T cell, activated mast cell was higher in the high-index group. Green represented low-index group, red represented high-index group. |
The survival status and the corresponding index were plotted (Figure 6C). The different expression heat map of 14 lncRNAs, between the low- and high-index groups, was reported (Figure 6D); the blue bar indicates low expression and the red bar high expression. The patients with a high index had better survival status. As for immune response-related score, IFN-γ score, GEP score, CYT score, as well as MHC score were all higher in low-index group compared with high-index group (Figure 6E). The different infiltration levels of immune cells between low- and high-index groups were explored (Figure 6F). The CD8+ T, CD4+ memory activated T, follicular helper T, activated NK cells and M1 macrophage were higher in the low-index group compared to the high-index group, whereas the CD4+ memory resting T cells and activated mast cells were higher in the high-index group. These results illustrate that the multi-lncRNAs based classifier effectively predicts the TMB level of patients and may reveal the prognosis of patients.
Development a Nomogram for Predicting OS in Colon Cancer Patients
A nomogram, which integrated the classifier index, age, gender, pathological stages, AJCC-TNM stages, and CEA level, was developed to predict the overall survival of colon cancer patients (Figure 7A). A vertical line was drawn from each prognosis axis to the point axis, and then the total points are calculated by adding up all the points. A 1–3 year survival probability of patients was estimated using total points. Calibration plots were generated to validate the conformance between the predicted and actual survival outcomes (Figure 7B–D), which displayed good conformity. The C-index for OS was found to be 0.762. All of these revealed that our nomogram had a robust accuracy for predicting OS probability in colon cancer patients. What is more, the result of multivariate Cox regression analysis showed that classifier index could act as an independent indicator for postoperative survival outcomes (Figure 8).
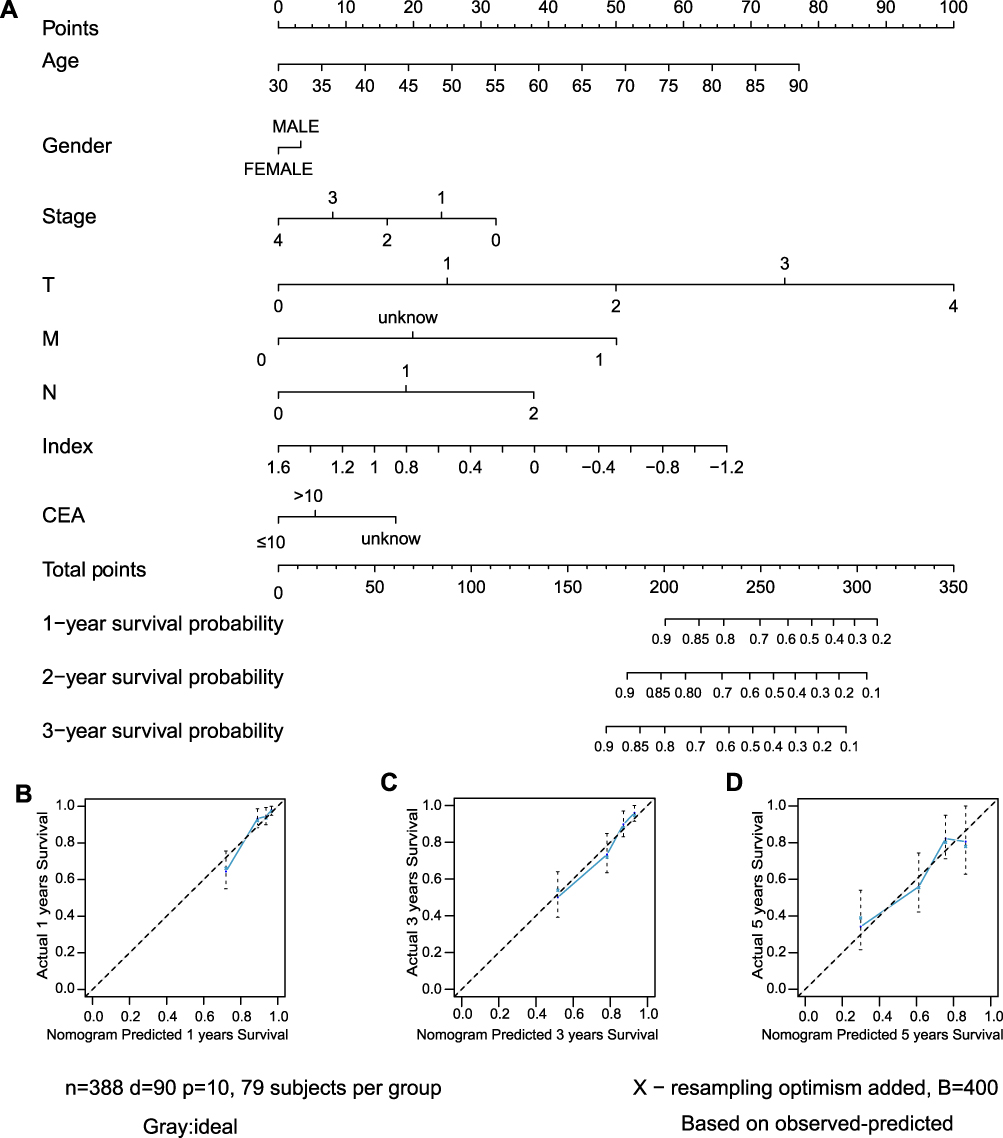 |
Figure 7 Construction of nomogram. (A) Nomogram predicting OS of patients. (B–D) The calibration plot of the nomogram at 1-year, 3-year and 5-year. |
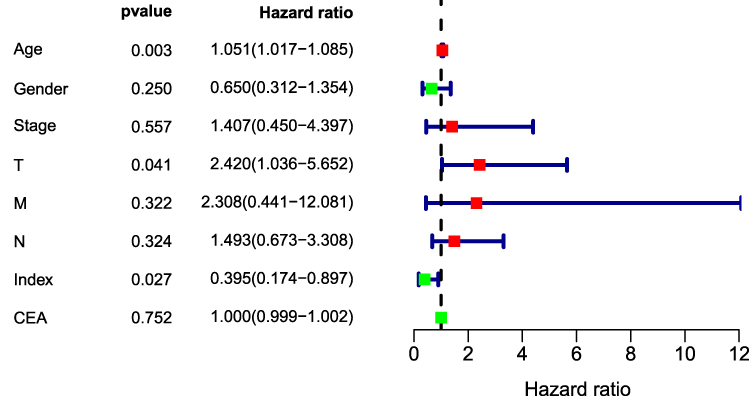 |
Figure 8 Multivariate Cox regression analysis of clinical factors in nomogram. |
The Differential Expression of lncRNAs of Classifier Between Normal and CRC Cell Lines
For further validation of classifier in clinical use, we quantified the expression level of 14 lncRNAs to determine whether there was a difference between normal and CRC cell lines using RT-qPCR. Compared with HIEC cell line, the expression of most lncRNAs was significantly different in CRC cell lines (P<0.05; Figure 9). In addition, there were also differences in lncRNAs expression between different CRC cell lines.
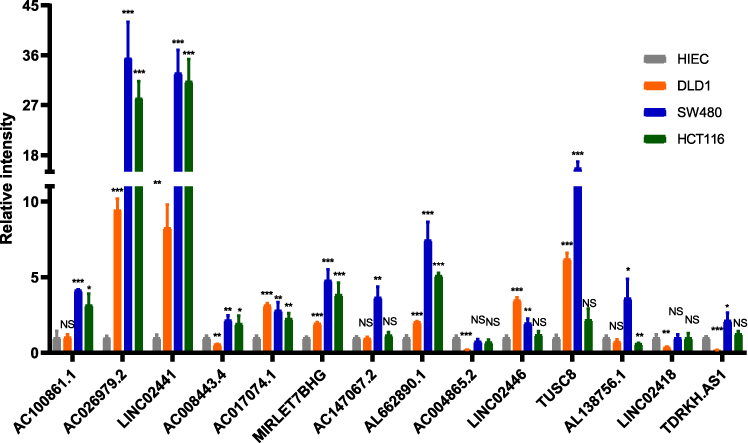 |
Figure 9 The expression of 14 lncRNAs by RT-qPCR (NS: no significance, P>0.05; *P<0.05; **P<0.01; ***P<0.001). |
Discussion
Colon adenocarcinoma is the most common pathological type of colon cancer. Immunotherapy has rapidly been regarded as an essential treatment for different kinds of solid tumors, including colon cancer. It is different from other conventional treatments by having long-term responses.31 However, only a portion of patients can benefit from immunotherapy while the rest have limited or no response. Therefore, it is important to identify patients who are sensitive to immunotherapy before treatment.
Biomarkers play an indispensable role in the diagnosis and treatment of colon cancer.32 The Tumor mutational burden (TMB) has been considered as one of the biomarkers for predicting responsiveness of patients to immunotherapy.33 For example, among Non-Small-Cell Lung Cancer patients receiving anti-PD-1/L1 treatment, patients with high TMB were associated with longer PFS than those with low TMB.34 TMB usually translates into a higher neoantigen load. Therefore, antigens that can stimulate the immune response are more likely to be expressed on the surface of tumor cells and recognized by cytotoxic T cells.35,36 Therefore, patients who respond to immunotherapy can be selected through the assessment of TMB levels. Measuring TMB using whole-exome sequencing (WES) or targeted sequencing panels is the current mainstream approaches; some studies have shown that TMB levels can be effectively measured using liquid biopsies/blood.37–39 Although liquid biopsy is less invasive and more easily repeatable than whole-exome sequencing (WES) or targeted sequencing panels, circulating DNA of tumor cells contributes a small proportion of circulating cell-free DNA.40 Some lncRNAs, associated with tumor immune infiltration, have been identified to improve prognosis and immunotherapy response of patients in non-small cell lung cancer and bladder cancer.41,42 In the view of the role that lncRNAs play in predicting responses to immunotherapy and survival outcomes, a multi-lncRNAs-based classifier was established that could identify a subgroup of colon cancer patients. The relationship of lncRNA expression patterns with TMB levels and survival outcomes was not previously studied. This study revealed that there were different expression patterns of lncRNAs between low-TMB and high-TMB patients, which could be used to distinguish between low- and high-TMB patients. Therefore, 14 lncRNAs were selected using the LASSO method to construct the classifier in the training set and were validated in the validation and the pooled sets. The ROC analysis was utilized to verify the robustness of the classifier and it showed that AUC was 0.70 in the training set, 0.71 in the validation set, and 0.70 in the pooled set. These results indicate that the classifier is practical in TMB prediction. In addition, classifier index is correlated with the expression of three ICIs, the immune cells infiltration, and immune response-related score in the pooled set. It may provide a novel insight into the selection of colon cancer patients for immunotherapy. To further validate the performance of the classifier, we performed RT-qPCR analysis for these lncRNAs in normal and three different types of CRC cell lines. LncRNAs expression was significantly different between normal and CRC cell lines. As for CRC cell lines, LINC02441, TUSC8, AL138756.1, LINC02418, as well as TDRKH.AS1 were higher expressed in SW480 cell line and LINC02446 were higher expressed in DLD1 or HCT 116 cell lines. In a previous study, Berg et al classified SW480 into microsatellite stability (MSS) and classified DLD1, HCT 116 into microsatellite instability (MSI).43 And Zhao et al44 found that there was a significantly positive correlation between TMB and MSI in patients with colorectal cancer. Hence, this result further improves the feasibility of the multi-lncRNAs based classifier in clinical application.
Some studies have explored whether lncRNAs are related to the initiation and prognosis of cancer.45 CAI et al demonstrated that lncRNAs can predict the overall survival of cancer patients.46 However, single lncRNA may not accurately predict the prognosis of patients. Wu et al demonstrated that multi-lncRNAs combination could enhance the accuracy of predictions.47 Clinical characteristics were closely related to the prognosis of colon cancer patients; age, gender, pathological stages, AJCC-TNM stages, CEA level, and vascular/lymph-vessel invasion are likely to serve as indicators of postoperative survival outcomes. However, cancer patients with the same clinical characteristics frequently show significantly different responses to uniform therapy and present diverse survival outcomes due to the heterogeneity of tumors. This study attempted to establish a nomogram that integrates age, gender, pathological stages, AJCC-TNM stages, classifier index, and CEA levels, to accurately predict the overall survival of colon cancer patients in the pooled set. The nomogram demonstrated a satisfactorily predictive ability to evaluate OS for colon cancer patients; it can be used as a tool to improve the management of colon cancer patients.
This study provides a multi-lncRNAs-based classifier to predict TMB levels of patients and a nomogram that integrates the classifier and clinical characteristics for the assessment of overall survival probability in colon cancer patients. However, there are some limitations to this study. First, it is a retrospective study based on the analysis of the TCGA database, which lacks validation in prospective clinical trials and other lager independent cohorts of patients. Second, the cut-off value that distinguishes the TMB levels may vary depending on the method, so study validation using other methods may be required. Third, several clinical-pathological characteristics, such as pathological grading and differentiation of tumor cells, were not complete, which may cause fluctuations of veracity. Also, the molecular mechanisms underlying these 14 lncRNAs in cancer-associated immune microenvironment and the prediction of survival outcomes in colon cancer patients are not clear.
Conclusion
Different expression levels of TMB were correlated with survival outcomes in colon cancer patients. We established and validated a multi-lncRNAs-based classifier that integrates the 14 lncRNAs, which could serve as biomarkers, to predict the TMB levels in colon cancer patients. The nomogram, including the classifier and several clinical characteristics, plays an important role in evaluating the postoperative overall survival in colon cancer patients. This nomogram may be used as a complement to the screening criteria for high-risk patients who require reinforced follow-up and active therapeutic intervention.
Ethics Approval and Consent to Participate
In this study, the patient data were acquired from the TCGA dataset according to the TCGA guidelines with complete informed consent.
Acknowledgments
This work was supported by funding from the Science and Technology Commission of Shanghai Municipality (No.16140900302).
Disclosure
The authors declare that they have no conflicts of interests for this work.
References
1. Bray F, Ferlay J, Soerjomataram I, Siegel RL, Torre LA, Jemal A. Global cancer statistics 2018: GLOBOCAN estimates of incidence and mortality worldwide for 36 cancers in 185 countries. CA Cancer J Clin. 2018;68(6):394–424. doi:10.3322/caac.21492
2. Brenner H, Chen C. The colorectal cancer epidemic: challenges and opportunities for primary, secondary and tertiary prevention. Br J Cancer. 2018;119(7):785–792. doi:10.1038/s41416-018-0264-x
3. Tjandra JJ, Chan MKY. Follow-up after curative resection of colorectal cancer: a meta-analysis. Dis Colon Rectum. 2007;50(11):1783–1799. doi:10.1007/s10350-007-9030-5
4. Kamal Y, Cheng C, Frost HR, Amos CI. Predictors of disease aggressiveness influence outcome from immunotherapy treatment in renal clear cell carcinoma. Oncoimmunology. 2019;8(1):e1500106. doi:10.1080/2162402X.2018.1500106
5. Hoos A. Development of immuno-oncology drugs – from CTLA4 to PD1 to the next generations. Nat Rev Drug Discov. 2016;15(4):235–247. doi:10.1038/nrd.2015.35
6. Kaufmann SHE. Immunology’s coming of age. Front Immunol. 2019;10:684. doi:10.3389/fimmu.2019.00684
7. Patel SP, Kurzrock R. PD-L1 expression as a predictive biomarker in cancer immunotherapy. Mol Cancer Ther. 2015;14(4):847–856. doi:10.1158/1535-7163.MCT-14-0983
8. Zito Marino F, Ascierto PA, Rossi G, et al. Are tumor-infiltrating lymphocytes protagonists or background actors in patient selection for cancer immunotherapy? Expert Opin Biol Ther. 2017;17(6):735–746. doi:10.1080/14712598.2017.1309387
9. Braun DA, Burke KP, Van Allen EM. Genomic approaches to understanding response and resistance to immunotherapy. Clin Cancer Res. 2016;22(23):5642–5650. doi:10.1158/1078-0432.CCR-16-0066
10. Gibney GT, Weiner LM, Atkins MB. Predictive biomarkers for checkpoint inhibitor-based immunotherapy. Lancet Oncol. 2016;17(12):e542–e551. doi:10.1016/S1470-2045(16)30406-5
11. Samstein RM, Lee C-H, Shoushtari AN, et al. Tumor mutational load predicts survival after immunotherapy across multiple cancer types. Nat Genet. 2019;51(2):202–206. doi:10.1038/s41588-018-0312-8
12. Chan TA, Yarchoan M, Jaffee E, et al. Development of tumor mutation burden as an immunotherapy biomarker: utility for the oncology clinic. Ann Oncol. 2019;30(1):44–56. doi:10.1093/annonc/mdy495
13. Schrock AB, Ouyang C, Sandhu J, et al. Tumor mutational burden is predictive of response to immune checkpoint inhibitors in MSI-high metastatic colorectal cancer. Ann Oncol. 2019;30(7):1096–1103. doi:10.1093/annonc/mdz134
14. Chalmers ZR, Connelly CF, Fabrizio D, et al. Analysis of 100,000 human cancer genomes reveals the landscape of tumor mutational burden. Genome Med. 2017;9(1):34. doi:10.1186/s13073-017-0424-2
15. Goodman AM, Kato S, Bazhenova L, et al. Tumor mutational burden as an independent predictor of response to immunotherapy in diverse cancers. Mol Cancer Ther. 2017;16(11):2598–2608. doi:10.1158/1535-7163.MCT-17-0386
16. Garofalo A, Sholl L, Reardon B, et al. The impact of tumor profiling approaches and genomic data strategies for cancer precision medicine. Genome Med. 2016;8(1):79. doi:10.1186/s13073-016-0333-9
17. Heeke S, Hofman P. Tumor mutational burden assessment as a predictive biomarker for immunotherapy in lung cancer patients: getting ready for prime-time or not? Transl Lung Cancer Res. 2018;7(6):631–638. doi:10.21037/tlcr.2018.08.04
18. Schumacher TN, Schreiber RD. Neoantigens in cancer immunotherapy. Science (New York, NY). 2015;348(6230):69–74. doi:10.1126/science.aaa4971
19. Anderson DM, Anderson KM, Chang C-L, et al. A micropeptide encoded by a putative long noncoding RNA regulates muscle performance. Cell. 2015;160(4):595–606. doi:10.1016/j.cell.2015.01.009
20. Nelson BR, Makarewich CA, Anderson DM, et al. A peptide encoded by a transcript annotated as long noncoding RNA enhances SERCA activity in muscle. Science (New York, NY). 2016;351(6270):271–275. doi:10.1126/science.aad4076
21. Wilusz JE. Long noncoding RNAs: re-writing dogmas of RNA processing and stability. Biochim Biophys Acta. 2016;1859(1):128–138. doi:10.1016/j.bbagrm.2015.06.003
22. Fatica A, Bozzoni I. Long non-coding RNAs: new players in cell differentiation and development. Nat Rev Genet. 2014;15(1):7–21. doi:10.1038/nrg3606
23. Bhan A, Soleimani M, Mandal SS. Long noncoding RNA and cancer: a new paradigm. Cancer Res. 2017;77(15):3965–3981. doi:10.1158/0008-5472.CAN-16-2634
24. Vishnubalaji R, Shaath H, Elango R, Alajez NM. Noncoding RNAs as potential mediators of resistance to cancer immunotherapy. Semin Cancer Biol. 2019.
25. Hu Q, Ye Y, Chan L-C, et al. Oncogenic lncRNA downregulates cancer cell antigen presentation and intrinsic tumor suppression. Nat Immunol. 2019;20(7):835–851. doi:10.1038/s41590-019-0400-7
26. Huang D, Chen J, Yang L, et al. NKILA lncRNA promotes tumor immune evasion by sensitizing T cells to activation-induced cell death. Nat Immunol. 2018;19(10):1112–1125. doi:10.1038/s41590-018-0207-y
27. Zhou Y, Zhu Y, Xie Y, Ma X. The role of long non-coding RNAs in immunotherapy resistance. Front Oncol. 2019;9:1292. doi:10.3389/fonc.2019.01292
28. Ayers M, Lunceford J, Nebozhyn M, et al. IFN-γ-related mRNA profile predicts clinical response to PD-1 blockade. J Clin Invest. 2017;127(8):2930–2940. doi:10.1172/JCI91190
29. Rooney MS, Shukla SA, Wu CJ, Getz G, Hacohen N. Molecular and genetic properties of tumors associated with local immune cytolytic activity. Cell. 2015;160(1–2):48–61. doi:10.1016/j.cell.2014.12.033
30. Li Y, Jiang T, Zhou W, et al. Pan-cancer characterization of immune-related lncRNAs identifies potential oncogenic biomarkers. Nat Commun. 2020;11(1):1000. doi:10.1038/s41467-020-14802-2
31. Ganesh K, Stadler ZK, Cercek A, et al. Immunotherapy in colorectal cancer: rationale, challenges and potential. Nat Rev Gastroenterol Hepatol. 2019;16(6):361–375. doi:10.1038/s41575-019-0126-x
32. Lech G, Słotwiński R, Słodkowski M, Krasnodębski IW. Colorectal cancer tumour markers and biomarkers: recent therapeutic advances. World j Gastroenterol. 2016;22(5):1745–1755. doi:10.3748/wjg.v22.i5.1745
33. Koeppel F, Blanchard S, Jovelet C, et al. Whole exome sequencing for determination of tumor mutation load in liquid biopsy from advanced cancer patients. PLoS One. 2017;12(11):e0188174. doi:10.1371/journal.pone.0188174
34. Rizvi H, Sanchez-Vega F, La K, et al. Molecular determinants of response to Anti-Programmed Cell Death (PD)-1 and Anti-Programmed Death-Ligand 1 (PD-L1) blockade in patients with non-small-cell lung cancer profiled with targeted next-generation sequencing. J clin oncol. 2018;36(7):633–641. doi:10.1200/JCO.2017.75.3384
35. Rizvi NA, Hellmann MD, Snyder A, et al. Cancer immunology. Mutational landscape determines sensitivity to PD-1 blockade in non-small cell lung cancer. Science (New York, NY). 2015;348(6230):124–128. doi:10.1126/science.aaa1348
36. Forde PM, Chaft JE, Smith KN, et al. Neoadjuvant PD-1 blockade in resectable lung cancer. N Engl J Med. 2018;378(21):1976–1986. doi:10.1056/NEJMoa1716078
37. Gandara DR, Paul SM, Kowanetz M, et al. Blood-based tumor mutational burden as a predictor of clinical benefit in non-small-cell lung cancer patients treated with atezolizumab. Nat Med. 2018;24(9):1441–1448. doi:10.1038/s41591-018-0134-3
38. Fenizia F, Pasquale R, Roma C, Bergantino F, Iannaccone A, Normanno N. Measuring tumor mutation burden in non-small cell lung cancer: tissue versus liquid biopsy. Transl Lung Cancer Res. 2018;7(6):668–677. doi:10.21037/tlcr.2018.09.23
39. Cortez MA, Anfossi S, Ramapriyan R, et al. Role of miRNAs in immune responses and immunotherapy in cancer. Genes Chromosomes Cancer. 2019;58(4):244–253. doi:10.1002/gcc.22725
40. Boeri M, Milione M, Proto C, et al. Circulating miRNAs and PD-L1 tumor expression are associated with survival in advanced NSCLC patients treated with immunotherapy: a Prospective Study. Clin Cancer Res. 2019;25(7):2166–2173. doi:10.1158/1078-0432.CCR-18-1981
41. Sun J, Zhang Z, Bao S, et al. Identification of tumor immune infiltration-associated lncRNAs for improving prognosis and immunotherapy response of patients with non-small cell lung cancer. J Immunother Cancer. 2020;8(1):e000110. doi:10.1136/jitc-2019-000110
42. Zhou M, Zhang Z, Bao S, et al. Computational recognition of lncRNA signature of tumor-infiltrating B lymphocytes with potential implications in prognosis and immunotherapy of bladder cancer. Brief Bioinform. 2020.
43. Berg KCG, Eide PW, Eilertsen IA, et al. Multi-omics of 34 colorectal cancer cell lines - a resource for biomedical studies. Mol Cancer. 2017;16(1):116. doi:10.1186/s12943-017-0691-y
44. Zhao Z, Li W, Zhang X, Ge M, Song C. Correlation between TMB and MSI in patients with solid tumors. J Clin Oncol. 2020;38:e15169–e15169. doi:10.1200/JCO.2020.38.15_suppl.e15169
45. Song J, Xu Q, Zhang H, et al. Five key lncRNAs considered as prognostic targets for predicting pancreatic ductal adenocarcinoma. J Cell Biochem. 2018;119(6):4559–4569. doi:10.1002/jcb.26598
46. Cai C, Yang L, Tang Y, et al. Prediction of overall survival in gastric cancer using a nine-lncRNA. DNA Cell Biol. 2019;38(9):1005–1012. doi:10.1089/dna.2019.4832
47. Wu B, Wang K, Fei J, et al. Novel three‑lncRNA signature predicts survival in patients with pancreatic cancer. Oncol Rep. 2018;40(6):3427–3437. doi:10.3892/or.2018.6761
 © 2021 The Author(s). This work is published and licensed by Dove Medical Press Limited. The full terms of this license are available at https://www.dovepress.com/terms.php and incorporate the Creative Commons Attribution - Non Commercial (unported, v3.0) License.
By accessing the work you hereby accept the Terms. Non-commercial uses of the work are permitted without any further permission from Dove Medical Press Limited, provided the work is properly attributed. For permission for commercial use of this work, please see paragraphs 4.2 and 5 of our Terms.
© 2021 The Author(s). This work is published and licensed by Dove Medical Press Limited. The full terms of this license are available at https://www.dovepress.com/terms.php and incorporate the Creative Commons Attribution - Non Commercial (unported, v3.0) License.
By accessing the work you hereby accept the Terms. Non-commercial uses of the work are permitted without any further permission from Dove Medical Press Limited, provided the work is properly attributed. For permission for commercial use of this work, please see paragraphs 4.2 and 5 of our Terms.