")
Back to Journals » OncoTargets and Therapy » Volume 12
Exploration of bladder cancer-associated methylated miRNAs by methylated DNA immunoprecipitation sequencing
Authors Gao X, Zheng W, Ye L, Wen X, Wang S , Cao H, Liu X, Huang D, Wang F, Zhang S
Received 25 October 2018
Accepted for publication 20 May 2019
Published 1 August 2019 Volume 2019:12 Pages 6165—6174
DOI https://doi.org/10.2147/OTT.S192248
Checked for plagiarism Yes
Review by Single anonymous peer review
Peer reviewer comments 4
Editor who approved publication: Dr William C. Cho
Xin Gao,1,* Wenwen Zheng,2,* Lili Ye,3 Xiaohong Wen,1 Shunlan Wang,1 Hui Cao,1 Xi Liu,1 Denggao Huang,1 Fei Wang,4 Shufang Zhang1
1Central Laboratory, Haikou People’s Hospital, Central South University Xiangya School of Medicine Affiliated Haikou Hospital, Haikou 570208, Hainan, People’s Republic of China; 2Department of Clinical Laboratory, The Sixth Affiliated Hospital of Sun Yat-Sen University, Guangzhou 510655, Guangdong, People’s Republic of China; 3Department of Clinical Laboratory, Jilin Provincial Tumor Hospital, Changchun 130012, People’s Republic of China; 4Department of Urology, People’s Hospital of Hainan Province, Haikou 570311, Hainan, People’s Republic of China
*These authors contributed equally to this work
Background: The current study aimed to explore the association between two epigenomic components, miRNA and DNA methylation, in bladder cancer (BC).
Methods: Eight paired samples of tumor tissue and matched adjacent normal tissues from BC patients were subjected to methylated DNA immunoprecipitation sequencing and sRNA-Seq for differentially methylated miRNA genes and differential miRNA analysis. The miRNAs regulated by DNA methylation were screened and their functions involved in BC were analyzed using Gene Ontology (GO) and the Kyoto Encyclopedia of Genes and Genomes (KEGG) as well as a miRNA–mRNA interaction network.
Results: The methylation levels of 212 genes were different between tumors and normal tissues with specific enrichment at transcription initiation and termination sites. Among these genes, 154 were hypermethylated and 58 were hypomethylated. GO and KEGG pathway enrichment analysis indicated that differentially methylated miRNA genes were mainly enriched in tumor-associated GO terms and signaling pathways. Pairwise statistical analysis of MeDIP-Seq and sRNA-Seq data showed that there are 154 and 165 candidate methylation-regulated genes in tumors and normal tissues, respectively. Notably, an interaction network indicated that the miRNAs regulated by methylation regulated a broad range of mRNAs associated with cancer development and progression. In particular, the most differentially expressed miRNAs were validated by qRT-PCR, such that miR-145-5p was downregulated and miR-182-5p was upregulated in patients with bladder cancer.
Conclusion: A large number of miRNA genes were modified by methylation in BC. Identification of changes in the expression of these miRNAs provides a great deal of important information for BC diagnosis.
Keywords: DNA methylation, 5-methylcytidine, miRNA, bladder cancer
Introduction
Bladder cancer (BC) is a highly prevalent disease of the urinary system in populations worldwide and is ranked as the fifth most common cancer in Western countries.1 In China, the incidence of BC is moderate though it increased year by year between 1998 and 2008 with an average annual growth rate of 4.6%.2 There are multiple risk factors that contribute to the etiology of BC, but smoking and urogenital schistosomiasis are believed to be two of the major risk factors.3–5 Recently studies have indicated that epigenetic changes including DNA methylation, histone modification, and microRNA (miRNA) regulation are associated with an increased risk of BC.6
Increasing evidence has demonstrated that aberrations in methylation affect tumor development and progression in BC.7–9 Methylation of cytosine is a type of genetic annotation which regulates how the genetic code is read and when gene information is transcribed.10 Methylation occurring at CpG sites generally leads to gene suppression or even silencing. Specifically, CpG hypermethylation in promoter regions is associated with a reduction in mRNA levels while CpG methylation in gene body regions often activates transcription.9 Changes in DNA methylation resulting in the silencing of tumor suppressor genes can promote cancer onset and development.11
miRNA is a type of endogenous non-coding RNA that regulates gene expression by inducing direct mRNA degradation or suppressing translation, resulting in abnormal cell behaviors such as cell cycle arrest, apoptosis, proliferation, metastasis, and drug resistance in several cancers inluding BC.12–17 Evidence has been proven that epigenetically regulated miRNAs are another important component of the epigenome and are widely distributed in multiple types of cancers exerting effects on tumor development and progression.18,19 Treatment with methylation inhibitors such as aza-2ʹ-deoxycytidine and 4-phenylbutyric acid can activate the expression of miRNAs and enhance their function in tumorigenesis.20,21
The expression of miRNA can be altered if the methylation occurs in a miRNA-encoding gene.22 Several miRNAs regulated by methylation have been identified in BC and suggested to be associated with the onset and progression of the cancer.14,23,24 However, there are still few comprehensively analyses of the relationship between miRNA expression and DNA methylation in BC. In the present study, we screened interactions between these two epigenomic components by high-throughput deep sequencing and methylated DNA immunoprecipitation sequencing (MeDIP-Seq) with eight paired samples of BC tissue and matched normal adjacent tissues. Further, we suggest a potential regulatory network of methylated miRNA.
Materials and methods
MeDIP-Seq
Following the manufacturer’s instructions, genomic DNA from eight tumors and matched normal adjacent tissues were isolated using a MagMedIP Kit (Diagenode, Denville, NJ, USA). Next, the methylated DNA was separated from the unmethylated fragments by immunoprecipitation using a monoclonal antibody against 5-methylcytidine (Diagenode, Denville, NJ, USA) as previously described.25 Illumina sequencing libraries of the enriched methylated DNA were prepared using NEBNext reagents according to the manufacturer’s recommendations (New England Biolabs, MA, USA). After quantitative evaluation of size distribution and concentration using an Agilent Bioanalyzer 2100 (Agilent Technologies, CA, USA), reads of 100 nucleotides (nt) were sequenced on an Illumina HiSeq 2000 platform (Illumina, CA, USA). All of the samples were obtained with written informed consent and analyzed anonymously. This study was approved by the Medical Ethical Committee of Affiliated Haikou Hospital of Xiangya Medical College, Central South University.
Methylation profiling and differentially methylated gene analysis
The MeDIP-Seq raw data from the Illumina HiSeq 2000 platform were processed according to the standard procedure of the BGI Group (Shenzhen, China). Reads were aligned to a human reference genome (hg19) using the Bowtie alignment algorithm with default parameters. Using a MACS software (MACS 1.4.0), a whole-genome methylation peak scan was performed and sequencing results for tumors and normal tissues were converted into peak values. Distribution trends for peak values across gene bodies and regions 2 kb directly upstream and downstream of the gene bodies were deduced. Genes with a fold change ≥1.5 and P<0.05 were defined as differentially methylated. Differentially methylated genes were further subjected to unsupervised hierarchical cluster analysis to obtain an overview of the differentially methylated genes in BC tumors. Gene ontology (GO) annotation and the Kyoto Encyclopedia of Genes and Genomes (KEGG) pathway analysis function prediction were performed using the open-source R package. P-values after correction, also termed Q-values were taken as the false discovery rate. GO terms or pathways with a value of Q <0.001 were considered significantly enriched.
sRNA-Seq and differentially expressed miRNA screening
Total RNA was extracted from eight tumors and matched adjacent normal tissues using TRiZol Reagent (Thermo Fisher Scientific, MA, USA) according to the manufacturer’s instructions. RNA quality was evaluated using an Agilent Bioanalyzer 2100 (Agilent). A sRNA library was constructed using TruSeq Small RNA Sample Preparation Kits (Illumina) according to the manufacturer’s protocols. The quality of the library was confirmed with an Agilent Bioanalyzer 2100 and sequencing was performed on an Illumina HiSeq2000 platform (Illumina).
For miRNA analysis, low quality, adapter-only, and unclipped reads were discarded. Remaining clean reads 15–30 nt in length were mapped to hg19 using SOAP V2.0. miRNA was identified and annotated using miRBase21 data (http://www.mirbase.org/ftp.shtml). To compare the expression of miRNA between tumors and normal tissues, miRNA reads were normalized to miRNA reads per million reads (RPM) and the average RPM levels of each miRNA were obtained. miRNA with a fold change ≥2 and a P-value <0.01 were considered to be significantly expressed.
miRNA–mRNA interaction network construction
To construct a miRNA–mRNA interaction network differentially expressed miRNAs detected indirectly from the total RNA of the eight paired tissue samples were mapped to the differentially methylated genes obtained by MeDIP-Seq. Overlapping miRNAs were used to generate a miRNA–mRNA interaction network. Candidate miRNA-target mRNA was predicted using miRanda and Target-Scan. An interaction network illustrating the regulatory relationship between the miRNAs and their corresponding mRNAs was drawn using Cytoscape software.
Quantitative real-time polymerase chain reaction (qRT-PCR)
Differentially expressed miRNAs identified by MeDIP-Seq and sRNA-Seq were confirmed by qRT-PCR. Briefly, total RNAs were extracted from tissues and reverse transcribed by an miRNA-specific stem-loop RT primer according to the manufacturer’s protocol. Each cDNA generated was amplified by quantitative PCR using TaqMan® miRNA assays (Thermo Fisher Scientific, MA,USA) using a mature miRNA-specific forward primer and the universal reverse primer. The reactions were incubated at 95 °C for 120 s, followed by 40 cycles of 95 °C for 15 s, and 60 °C for 30 s.
Results
Differentially methylated miRNA genes in BC patients
MeDIP-Seq was carried out to identify differences in the methylation of miRNA genes between BC tumors and normal tissues. As shown in Figure 1A, more than half of the methylated miRNA genes identified were found exclusively in one patient, while only a very small number were found in five of the eight patients studied (Figure 1A). Among these methylated miRNA genes, the number of hypermethylated genes was greater than the number of hypomethylated genes in five out of eight patients, and only three patients had a higher number of hypomethylated miRNA genes (Figure 1B). Analysis of the distribution of DNA methylation across gene bodies and regions 2 kb directly upstream and downstream of the gene bodies reveled two methylation peaks close to the transcription start and termination sites in both tumors and normal tissues (Figure 1C). Most of the changes in methylation between tumors and normal tissues also occurred in these two regions. To gain an overview of the differentially methylated miRNA genes identified, a heatmap was generated and distinct patterns of methylation of miRNA genes were observed in tumors and normal tissues. As shown in Figure 1D, a total of 212 genes were differentially methylated between tumors and normal tissues in BC patients. Of these, 154 genes were hypermethylated and 58 were hypomethylated in the tumor tissues. Higher levels of methylation were observed in tumors tissues than in normal controls. In a volcano plot, hyper- and hypomethylated genes were distributed in quadrants of fold change >1 and P-value <0.05, with larger genes concentrated in the hypermethylated quadrant (Figure 1E).
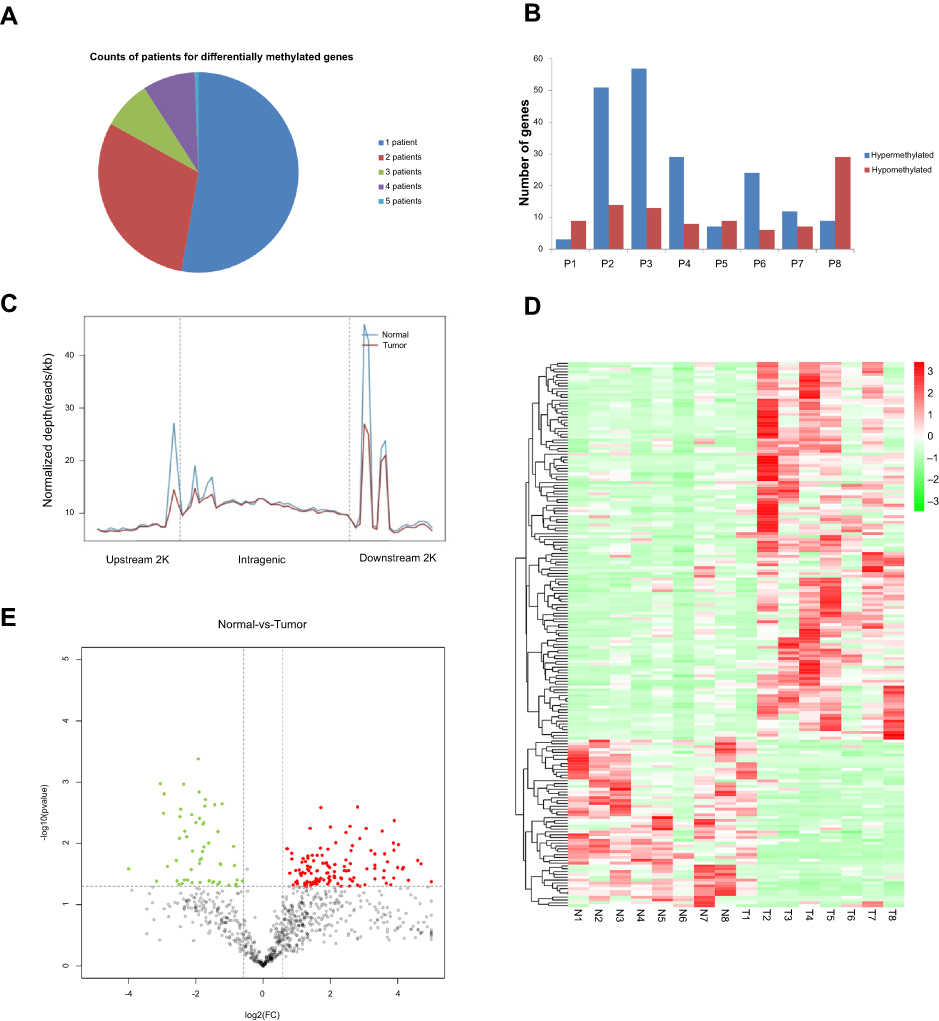 |
Figure 1 Determination of DNA methylation by MeDIP-Seq analysis. (A) Distribution of deferentially methylated genes encoding miRNAs in eight patients. (B) Number of hypo- and hypermethylated genes in eight patients. (C) Distribution of reads around gene bodies ±2 kb flanking regions. Upstream 2 kb, region 2 kb upstream of the transcription start site 2K; intragenic, the entire gene from the transcription start site to the end of the transcript; downstream 2 kb, 2 kb downstream of the end of the transcript. (D) Heatmap showing deferentially methylated miRNA-encoding genes. Each gene corresponds to each row. (E) Volcano plot showing the differentially expressed reads in tumors and normal tissues. Red points represents upregulated reads, green points represent downregulated reads, black points are not statistically significant. |
Functional prediction for differential methylated genes
Hyper- and hypomethylated genes encoding miRNAs were further subjected to GO and KEGG pathway enrichment analysis for function prediction. KEGG analysis showed that differentially methylated genes were mainly enriched in tumor-associated pathways such as the PI3K-Akt signaling pathway, the MAPK signaling pathway, the Ras signaling pathway, focal adhesion, and miRNAs and proteoglycans associated with cancer (Figure 2A). GO term analysis also determined that most genes were enriched in biological processes, followed by cellular components, with the most enrichment in single-organism cellular processes such as the regulation of nitrogen compound metabolism, cellular and cellular metabolic processes, and intracellular organelles (Figure 2B).
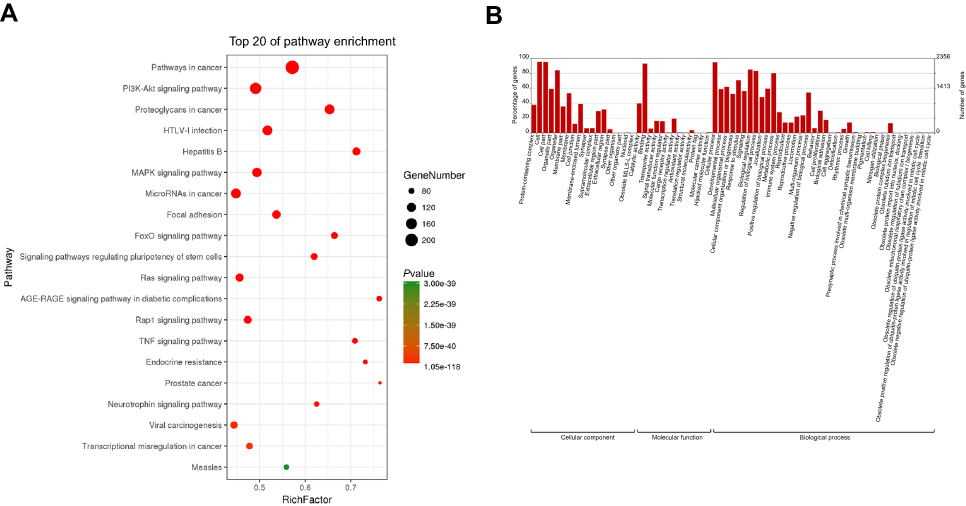 |
Figure 2 KEGG pathway enrichment and GO analysis of the differentially methylated miRNA genes. (A) Top 20 most enriched signaling pathways. Dot size reflects the number of genes enriched in each signaling pathway. Dot color indicates P-value. (B) GO enrichment analysis of all differentially methylated genes. |
Differential expression of miRNAs in BC tumors are associated with methylation of miRNA-encoding genes
To investigate the association between miRNA expression and the methylation of miRNA-encoding genes in tumor tissues, miRNA expression profiles were detected by high throughput sequencing for eight paired tumors and normal tissues. As shown in Figure 3A, cluster analysis revealed distinct profiles of miRNA expression between tumors and matched normal tissues. There were 83 upregulated and 59 downregulated miRNAs in the tumor tissues relative to the normal tissues (Figure 3A). A volcano plot also showed a large number of miRNAs that were up- or downregulated by more than 2-fold in tumor tissues (Figure 3B). Differentially expressed miRNAs were classified into four categories according to the region of methylation in their corresponding genes: both gene body and promoter modified; neither modified; only gene body modified; or only promoter modified. The average expression of miRNAs in each category was calculated. As shown in Figure 3C, there was no significant difference in these four groups of miRNAs between tumors and normal tissues. However, the average expression of unmodified miRNAs was higher, and that of miRNAs with methylation in the promoter region, gene body region, or both was lower (Figure 3C). To determine whether DNA methylation in miRNA-encoding genes was associated with the expression of miRNAs, methylated miRNA genes detected by MeDIP-Seq and miRNAs obtained by sRNA-Seq were merged. A total of 154 and 165 overlapping genes were identified in tumors and normal tissues, respectively (Figure 3D and E).
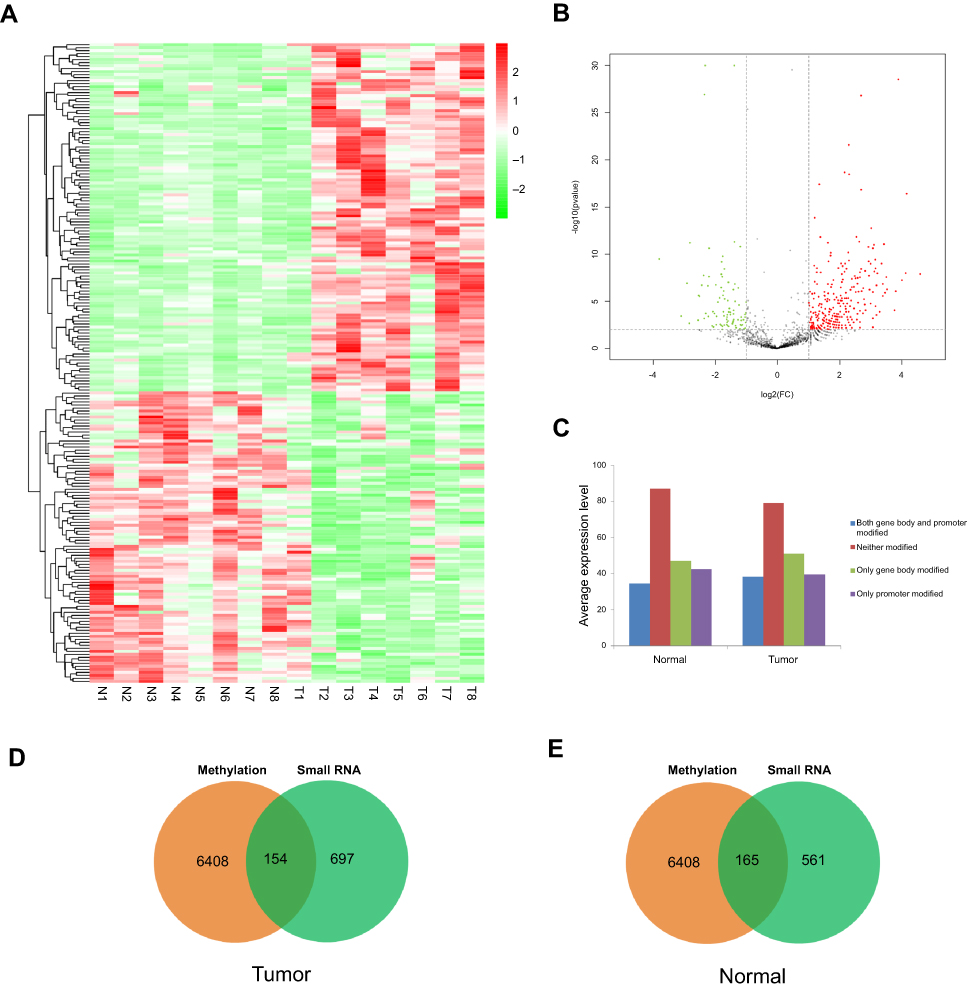 |
Figure 3 Differentially expressed miRNAs in BC tumor tissues are associated with methylation of miRNA-encoding genes. (A) Heatmap showing differential miRNA expression profiles in bladder cancer relative to normal tissues. (B) Volcano plot showing the differentially expressed miRNAs in tumor tissues compared with normal tissues. Red points represents up-regulated miRNA, green points represent downregulated miRNAs, black points are not statistically significant. (C) Expression levels of miRNAs corresponding to four genomic regions with different methylation modification levels: both gene body and promoter modified, neither modified, only gene body modified, only promoter modified. (D) Overlap of miRNA-encoding genes identified by MeDIP-Seq and sRNA-Seq in tumor tissues. (E) Overlap of miRNA-encoding genes identified by MeDIP-Seq and sRNA-Seq in normal tissues. |
Differentially expressed miRNAs regulated by methylation regulated a large number of mRNAs
Generally, miRNAs regulate gene expression by targeting the 3ʹUTR of mRNA. Changes in the expression of miRNA in tumor tissues may therefore affect a number of mRNAs. To generate a miRNA–mRNA interaction network, candidate mRNA targets of differentially expressed miRNAs that overlapped according to MeDIP-Seq and sRNA-Seq data were predicted. Target prediction revealed that numerous mRNAs were potentially regulated by these miRNAs. A miRNA–mRNA interaction network which contained four subsets and included 12 miRNAs and 278 mRNAs was constructed. The largest regulatory subnetwork was that of miR-145, which included 143 mRNAs, accounting for more than 50% of mRNAs in the entire network (Figure 4).
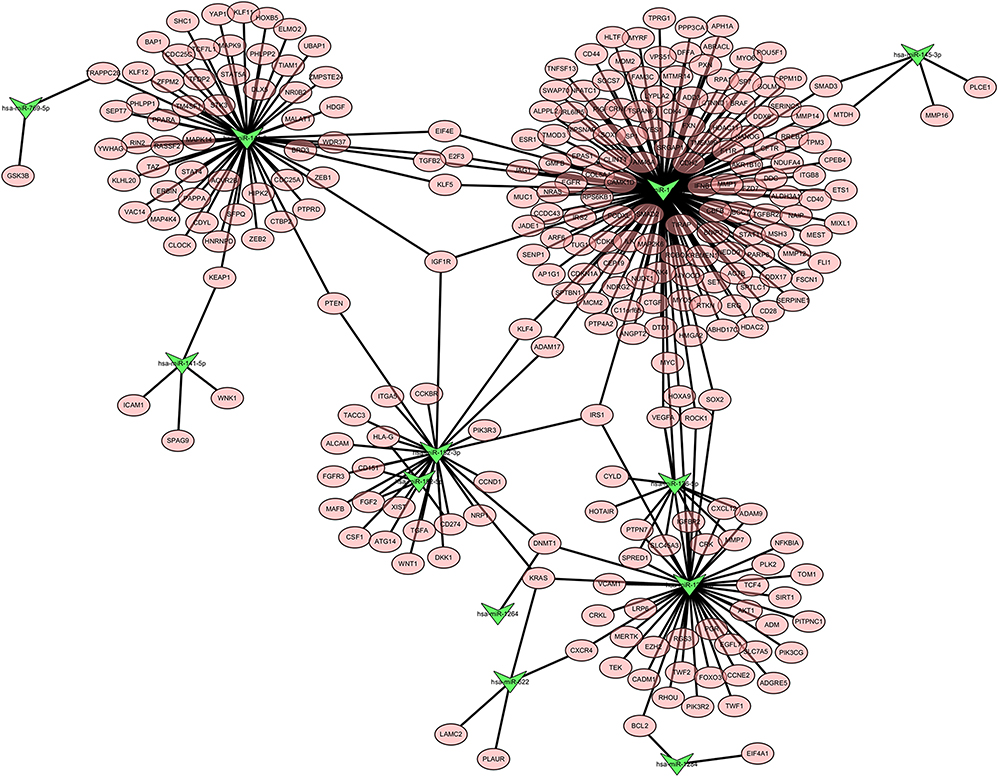 |
Figure 4 miRNA–mRNA regulatory network generated using miRNAs of differential methylated genes and mRNAs which containing predicted miRNA targets. Green triangle indicates miRNAs, pink oval represents mRNAs. |
To further validate the MeDIP-Seq and sRNA-Seq results, RT-PCR was used to evaluate two up-regulated (miR-1266-5p and miR-182-5p) and three down-regulated (miR-145-5p, miR-126-3p, and miR-152-3p) miRNAs in eight paired tumors and normal tissues. qRT-PCR results showed that miR-1266-5p and miR-182-5p were up-regulated in the BC tissues compared with the normal tissues, whereas miR-145-5p was down-regulated in the tumor tissues (Figure 5), which was consistent with the results of sRNA-Seq. However, miR-126-3p and miR-152-3p were up-regulated in the BC tissues, and qRT-PCR results were inconsistent with the sRNA-Seq results.
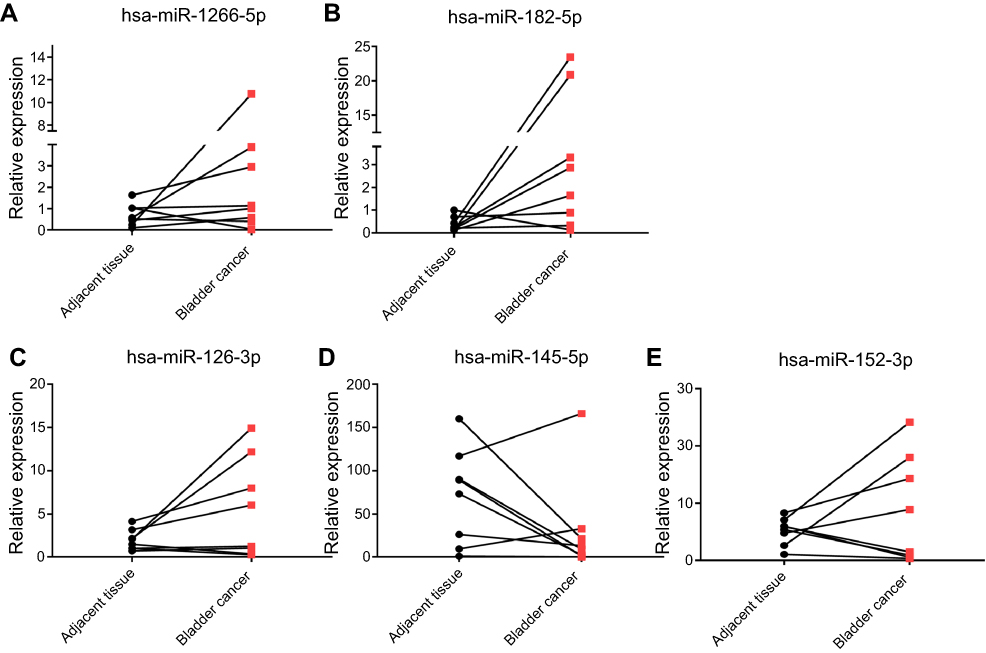 |
Figure 5 Validation of up-regulated [miR-1266-5p (A) and miR-182-5p (B)] and down-regulated [miR-145-5p (C), miR-126-3p (D), and miR-152-3p (E)] miRNAs by qRT-PCR. |
Discussion
DNA methylation and miRNAs are two important regulatory factors in human cancers. In the present study, we identified miRNA genes regulated by methylation by combining the profiles of methylated miRNA-encoding genes with the expression profiles of miRNAs in BC patients. Several differentially methylated miRNA-encoding genes were identified and predicted to regulate many miRNAs in BC. Further, we outlined a regulatory network of these differentially methylated miRNAs and highlighted the central role of miR-145 in the methylated miRNA–mRNA interaction network.
Previously, studies have discussed some aspects of the relationship between DNA methylation and miRNA in BC. However, previous studies such as that of Ma et al have mainly focused on the differences in methylation between sensitive and resistant HCC cell lines in response to 5-fluorouracil treatment;19 another study by Shimizu et al identified a set of epigenetically silenced miRNA genes in BC patients, but this was mainly based on a PCR-based method, which may not cover all miRNAs in addition to their counterpart genes information. Therefore, previous works may not have covered all possible methylation changes in miRNA genes.24 Unlike these studies, our current study provides a genome-wide profile of both DNA methylation state and miRNAs expression based on a high-throughput deep sequencing method, which means that the data reflects the global changes in methylation state and miRNA levels in BC tissues.
Previous studies have suggested that methylation levels are higher in gene bodies than in regions flanking the 5ʹ and 3ʹ ends of genes in human cells, bovine placentas, and arabidopsis.26–28 In the current study, partially consistent with previous finding, methylation levels were slightly increased in the gene bodies compared with the flanking regions. However, sharply increased methylation peaks were noted in upstream and downstream regions close to the transcription start and termination sites. These peaks were particular high in the BC tissues relative to normal tissues, suggesting that methylation in these regions may contribute to BC etiology.
Our research shows that methylation does have an effect on miRNA expression levels. Both promoter regions and the gene body regions exhibited the lowest expression of methylated miRNA genes, while unmethylated miRNA had the highest average expression level. Furthermore, integrated analysis using MeDIP-Seq and sRNA-Seq data revealed that DNA methylation in miRNA gene can partially explain the aberrant expression of a proportion of miRNAs in normal and cancer tissues. Previously, several miRNAs have been proven to be regulated by DNA methylation. For example, miR-193, a miRNA which has been shown to be hypermethylated, is downregulated in chemoresistant BC cells.29 Treatment with demethylase resulted in changes in the expression of miR-137, miR-124–2, miR-124–3, and miR-9–3, which are associated with growth and invasion in primary cancers.24 Methylation of the promoters of miR-34a and miR-126 is found in a variety of cancers, including BC.30,31 miR-200b, a miRNA associated with cisplatin treatment sensitivity, is upregulated after treatment with demethylase.32 Meanwhile, in the muscle-invasive bladder tumors, the miR-200b gene is hypermethylated and its expression is specifically silenced.33 Our findings provide more information regarding BC associated methylated miRNAs.
Of these miRNAs, we highlight the tumor suppressor, miR-145, which targets the greatest number of mRNAs in the methylated miRNA–mRNA interaction network produced in the present study. In particular, we confirmed the down-regulation of miR-145 in the bladder tumors with RT-PCR. It has been reported that miR-145 regulates tumor progression and metastasis in a wide range of cancer.34–37 Lower levels of miR-145 induced by DNA methylation have been evidenced to enhance cell behaviors such as proliferation, migration and invasion and could be used as potential prognostic biomarker for cancer therapy.38,39 Removal of the methylation suppresses cancer growth and metastasis.40 In terms of BC, miR-145 has been proven to inhibit BC cell growth, cell invasion and migration, and induce tumor apopotosis.41–44 These findings suggest that miR-145 plays an inhibitory role in tumor development and progress and that DNA methylation occurs with high frequency in cancer. In support of these findings, we observed the downregulation of miR-145 in the present study, and our methylated miRNA–mRNA interaction network shows that miR-145 regulates the biggest subnetwork of cancer-associated mRNAs, including c-Myc, SOX9, SP1, and FSCN1.34,36,45,46 Thus, it will be important for us to identify the role of methylated miR-145 in BC in future work.
Collectively, our data suggest that methylated miRNA genes are involved in the pathogenesis of BC and that drugs that regulate the expression of methylated miRNA genes, especially those related to cancer may be useful in BC therapy. In addition, the differentially methylated miRNAs genes identified in the current study may function as biomarkers for the early detection of BC.
Acknowledgments
This study was supported by the Hainan Provincial Natural Science Foundation of China (Grant No. 2017CXTD010), the Finance Science and Technology Project of Hainan Province (Grant No. ZDYD2019163 and ZDKJ2017007), the National Science Foundation of China (Grant No. 81760465, 81760461 and 81460450).
Disclosure
The authors report no conflicts of interest in this work.
References
1. Knowles MA, Hurst CD. Molecular biology of bladder cancer: new insights into pathogenesis and clinical diversity. Nat Rev Cancer. 2015;15(1):25. doi:10.1038/nrc3817
2. Su-jun H, Si-wei Z, Wan-qing C, Chang-ling L. Analysis of the status and trends of bladder cancer incidence in. Oncol Prog. 2013;11(1):89–95.
3. Freedman ND, Silverman DT, Hollenbeck AR, Schatzkin A, Abnet CC. Association between smoking and risk of bladder cancer among men and women. Jama. 2011;306(7):737–745. doi:10.1001/jama.2011.1142
4. Wang JB, Jiang Y, Wei WQ, et al. Estimation of cancer incidence and mortality attributable to smoking in China. Cancer Causes Control. 2010;21(6):959–965. doi:10.1007/s10552-010-9523-8
5. Zaghloul MS, Gouda I. Schistosomiasis and bladder cancer: similarities and differences from urothelial cancer. Expert Rev Anticancer Ther. 2012;12(6):753. doi:10.1586/era.12.49
6. Harbde LRA, Acker M, Kumar RA, Manoharan M. Epigenetics application in the diagnosis and treatment of bladder cancer. Can J Urol. 2015;22(5):7947–7951.
7. Kim EJ, Kim YJ, Jeong P, et al. Methylation of the RUNX3 promoter as a potential prognostic marker for bladder tumor. J Urol. 2008;180(3):1141–1145. doi:10.1016/j.juro.2008.05.002
8. Maruyama R, Toyooka S, Toyooka KO, et al. Aberrant promoter methylation profile of bladder cancer and its relationship to clinicopathological features. Cancer Res. 2001;61(24):8659–8663.
9. Catto JW, Azzouzi AR, Rehman I, et al. Promoter hypermethylation is associated with tumor location, stage, and subsequent progression in transitional cell carcinoma. J Clin Oncol. 2005;23(13):2903–2910. doi:10.1200/JCO.2005.03.163
10. Dor Y, Cedar H. Principles of DNA methylation and their implications for biology and medicine. Lancet. 2018;392(10149):777–786. doi:10.1016/S0140-6736(18)31268-6
11. Jones PA. DNA methylation and cancer. Adv Genet. 2002;285(1):89–95.
12. Motti ML, D’Angelo S, Meccariello R. MicroRNA, cancer and diet: facts and new exciting perspectives. Curr Mol Pharmacol. 2018;11(2):90–96.
13. Shi Z, Wei Q, Zhang M, She J. MicroRNAs in bladder cancer: expression profiles, biological functions, regulation, and clinical implications. Crit Rev Eukaryot Gene Expr. 2014;24(1):55–75. doi:10.1615/CritRevEukaryotGeneExpr.v24.i1
14. Deng H, Lv L, Li Y, et al. The miR-193a-3p regulated PSEN1 gene suppresses the multi-chemoresistance of bladder cancer. Biochim Biophys Acta. 2015;1852(3):520. doi:10.1016/j.bbadis.2015.08.002
15. Yoshitomi T, Kawakami K, Enokida H, et al. Restoration of miR-517a expression induces cell apoptosis in bladder cancer cell lines. J Urol. 2011;185(4):e347–e347. doi:10.1016/j.juro.2011.02.691
16. Wang X, Wu Q, Xu B, et al. miR‐124 exerts tumor suppressive functions on the cell proliferation, motility and angiogenesis of bladder cancer by fine‐tuning UHRF1. Febs J. 2015;282(22):4376–4388. doi:10.1111/febs.13502
17. Li J, Xu X, Meng S, et al. MET|[sol]|SMAD3|[sol]|SNAIL circuit mediated by miR-323a-3p is involved in regulating epithelial|[ndash]|mesenchymal transition progression in bladder cancer. Cell Death Dis. 2017;8(8):e3010. doi:10.1038/cddis.2017.331
18. Yang N, Coukos G, Zhang L. MicroRNA epigenetic alterations in human cancer: one step forward in diagnosis and treatment. Int J Cancer. 2008;122(5):963–968. doi:10.1002/ijc.23325
19. Ma K, He Y, Zhang H, et al. DNA methylation-regulated miR-193a-3p dictates resistance of hepatocellular carcinoma to 5-Fluorouracil via repression of SRSF2 expression. J Biol Chem. 2012;287(8):5639–5649. doi:10.1074/jbc.M111.291229
20. Saito Y, Liang G, Egger G, et al. Specific activation of microRNA-127 with downregulation of the proto-oncogene BCL6 by chromatin-modifying drugs in human cancer cells. Cancer Cell. 2006;9(6):435–443. doi:10.1016/j.ccr.2006.04.020
21. Dudziec E, Miah S, Choudhry HM, et al. Hypermethylation of CpG islands and shores around specific microRNAs and mirtrons is associated with the phenotype and presence of bladder cancer. Clin Cancer Res Off J Am Assoc Cancer Res. 2011;17(6):1287. doi:10.1158/1078-0432.CCR-10-2017
22. Niegisch G, Hoffmann MJ, Koutsogiannouli EA, Schulz WA. Epigenetics in urothelial cancer: pathogenesis, improving diagnostics and developing novel treatment options. Urologe. 2015;54:4.
23. Shivakumar M, Lee Y, Bang L, Garg T, Sohn K-A, Kim D. Identification of epigenetic interactions between miRNA and DNA methylation associated with gene expression as potential prognostic markers in bladder cancer. BMC Med Genomics. 2017;10(1):30. doi:10.1186/s12920-017-0269-y
24. Shimizu T, Suzuki H, Nojima M, et al. Methylation of a panel of microRNA genes is a novel biomarker for detection of bladder cancer. Eur Urol. 2013;63(6):1091–1100. doi:10.1016/j.eururo.2012.11.030
25. Li W, Huang Y, Sargsyan D, et al. Epigenetic alterations in TRAMP mice: epigenome DNA methylation profiling using MeDIP-seq. Cell Biosci. 2018;8(1):3. doi:10.1186/s13578-018-0201-y
26. Ball MP, Li JB, Gao Y, et al. Targeted and genome-scale strategies reveal gene-body methylation signatures in human cells. Nat Biotechnol. 2009;27(4):361–368. doi:10.1038/nbt.1533
27. Lister R. Genome-wide high-resolution mapping and functional analysis of DNA methylation. J Biomol Tech Jbt. 2007;18(1):83.
28. Su J, Wang Y, Xing X, Liu J, Zhang Y. Genome-wide analysis of DNA methylation in bovine placentas. BMC Genomics. 2014;15(1):1–11. doi:10.1186/1471-2164-15-12
29. Lv L, Deng H, Li Y, et al. The DNA methylation-regulated miR-193a-3p dictates the multi-chemoresistance of bladder cancer via repression of SRSF2/PLAU/HIC2 expression. Cell Death Dis. 2014;5(9):e1402. doi:10.1038/cddis.2014.367
30. Lodygin D, Tarasov V, Epanchintsev A, et al. Inactivation of miR-34a by aberrant CpG methylation in multiple types of cancer. Cell Cycle. 2008;7(16):2591–2600. doi:10.4161/cc.7.16.6533
31. Saito Y, Friedman JM, Chihara Y, Egger G, Chuang JC, Liang G. Epigenetic therapy upregulates the tumor suppressor microRNA-126 and its host gene EGFL7 in human cancer cells. Biochem Biophys Res Commun. 2009;379(3):726–731. doi:10.1016/j.bbrc.2008.12.098
32. Shindo T, Niinuma T, Nishiyama N, et al. Epigenetic silencing of miR-200b is associated with cisplatin resistance in bladder cancer. Oncotarget. 2018;9(36):24457–24469. doi:10.18632/oncotarget.25326
33. Wiklund ED, Bramsen JB, Hulf T, et al. Coordinated epigenetic repression of the miR-200 family and miR-205 in invasive bladder cancer. Int J Cancer. 2011;128(6):1327–1334. doi:10.1002/ijc.25577
34. Kano M, Seki N, Kikkawa N, et al. miR-145, miR-133a and miR-133b: tumor-suppressive miRNAs target FSCN1 in esophageal squamous cell carcinoma. Int J Cancer. 2010;127(12):2804–2814. doi:10.1002/ijc.25499
35. Spizzo R, Nicoloso MS, Lupini L, et al. miR-145 participates with TP53 in a death-promoting regulatory loop and targets estrogen receptor-α in human breast cancer cells. Cell Death Differ. 2010;17(2):246. doi:10.1038/cdd.2009.117
36. Qiu T, Zhou X, Wang J, et al. MiR-145, miR-133a and miR-133b inhibit proliferation, migration, invasion and cell cycle progression via targeting transcription factor Sp1 in gastric cancer. FEBS Lett. 2014;588(7):1168–1177. doi:10.1016/j.febslet.2014.02.054
37. Sachdeva M, Mo YY. miR-145-mediated suppression of cell growth, invasion and metastasis. Am J Transl Res. 2010;2(2):170.
38. Xia W, Chen Q, Wang J, et al. DNA methylation mediated silencing of microRNA-145 is a potential prognostic marker in patients with lung adenocarcinoma. Sci Rep. 2015;5:16901. doi:10.1038/srep16901
39. Ye Z, Shen N, Weng Y, et al. Low miR-145 silenced by DNA methylation promotes NSCLC cell proliferation, migration and invasion by targeting mucin 1. Cancer Biol Ther. 2015;16(7):1071–1079. doi:10.1080/15384047.2015.1046024
40. Liu SY, Li XY, Chen WQ, et al. Demethylation of the MIR145 promoter suppresses migration and invasion in breast cancer. Oncotarget. 2017;8(37):61731–61741.
41. Kou B, Gao Y, Du C, et al. miR-145 inhibits invasion of bladder cancer cells by targeting PAK1. Urol Oncol. 2014;32(6):846–854. doi:10.1016/j.urolonc.2014.01.003
42. Chiyomaru, A T, Enokida, H, Tatarano, S, et al. miR-145 and miR-133a function as tumour suppressors and directly regulate FSCN1 expression in bladder cancer. J Urol. 2010;183(4):883–891.
43. Ostenfeld MS, Bramsen JB, Lamy P, et al. miR-145 induces caspase-dependent and -independent cell death in urothelial cancer cell lines with targeting of an expression signature present in Ta bladder tumors. Oncogene. 2010;29(7):1073–1084. doi:10.1038/onc.2010.378
44. Matsushita R, Yoshino H, Enokida H, et al. Regulation of UHRF1 by dual-strand tumor-suppressor microRNA-145 (miR-145-5p and miR-145-3p): inhibition of bladder cancer cell aggressiveness. Oncotarget. 2016;7(19):28460–28487. doi:10.18632/oncotarget.8668
45. Shao Y, Qu Y, Dang S, Yao B, Ji M. MiR-145 inhibits oral squamous cell carcinoma (OSCC) cell growth by targeting c-Myc and Cdk6. Cancer Cell Int. 2013;13(1):51. doi:10.1186/1475-2867-13-51
46. Rani SB, Rathod SS, Karthik S, Kaur N, Muzumdar D, Shiras AS. MiR-145 functions as a tumor-suppressive RNA by targeting Sox9 and adducin 3 in human glioma cells. Neuro-oncology. 2013;15(10):1302. doi:10.1093/neuonc/not090
 © 2019 The Author(s). This work is published and licensed by Dove Medical Press Limited. The full terms of this license are available at https://www.dovepress.com/terms.php and incorporate the Creative Commons Attribution - Non Commercial (unported, v3.0) License.
By accessing the work you hereby accept the Terms. Non-commercial uses of the work are permitted without any further permission from Dove Medical Press Limited, provided the work is properly attributed. For permission for commercial use of this work, please see paragraphs 4.2 and 5 of our Terms.
© 2019 The Author(s). This work is published and licensed by Dove Medical Press Limited. The full terms of this license are available at https://www.dovepress.com/terms.php and incorporate the Creative Commons Attribution - Non Commercial (unported, v3.0) License.
By accessing the work you hereby accept the Terms. Non-commercial uses of the work are permitted without any further permission from Dove Medical Press Limited, provided the work is properly attributed. For permission for commercial use of this work, please see paragraphs 4.2 and 5 of our Terms.