")
Back to Journals » Journal of Hepatocellular Carcinoma » Volume 7
Experimental Study of Hepatocellular Carcinoma Treatment by Shikonin Through Regulating PKM2
Authors Liu T, Li S, Wu L , Yu Q, Li J, Feng J , Zhang J , Chen J, Zhou Y, Ji J, Chen K , Mao Y , Wang F, Dai W, Fan X, Wu J, Guo C
Received 7 November 2019
Accepted for publication 18 January 2020
Published 18 February 2020 Volume 2020:7 Pages 19—31
DOI https://doi.org/10.2147/JHC.S237614
Checked for plagiarism Yes
Review by Single anonymous peer review
Peer reviewer comments 3
Editor who approved publication: Dr Ahmed Kaseb
Tong Liu, 1–3,* Sainan Li, 2,* Liwei Wu, 2 Qiang Yu, 2, 4 Jingjing Li, 1 Jiao Feng, 2 Jie Zhang, 2, 4 Jiaojiao Chen, 2, 4 Yuting Zhou, 2, 4 Jie Ji, 2 Kan Chen, 2 Yuqing Mao, 5 Fan Wang, 6 Weiqi Dai, 7 Xiaoming Fan, 8 Jianye Wu, 1 Chuanyong Guo 1, 2
1Department of Gastroenterology, Putuo People’s Hospital, Tongji University School of Medicine, Shanghai 200060, People’s Republic of China; 2Department of Gastroenterology, Shanghai Tenth People’s Hospital, Tongji University School of Medicine, Shanghai 200072, People’s Republic of China; 3Department of Gastroenterology, Shandong Provincial Hospital of Shandong University, Ji’nan 250000, People’s Republic of China; 4Department of Gastroenterology, Shanghai Tenth People’s Hospital, School of Clinical Medicine of Nanjing Medical University, Shanghai 200072, People’s Republic of China; 5Department of Gerontology, Shanghai General Hospital, Shanghai Jiaotong University School of Medicine, Shanghai 200080, People’s Republic of China; 6Department of Oncology, Shanghai General Hospital, Shanghai Jiaotong University School of Medicine, Shanghai 200080, People’s Republic of China; 7Department of Gastroenterology, Shanghai Institute of Liver Diseases, Zhongshan Hospital of Fudan University, Shanghai 200032, People’s Republic of China; 8Department of Gastroenterology, Jinshan Hospital of Fudan University, Jinshan, Shanghai 201508, People’s Republic of China
*These authors contributed equally to this work
Correspondence: Jianye Wu
Department of Gastroenterology, Putuo People’s Hospital, Tongji University School of Medicine, Shanghai 200060, People’s Republic of China
Email [email protected]
Chuanyong Guo
Department of Gastroenterology, Shanghai Tenth People’s Hospital, Tongji University School of Medicine, Shanghai 200072, People’s Republic of China
Email [email protected]
Objective: Shikonin is a natural product with many activities, including anti-cancer effects. Pyruvate kinase type M2 (PKM2) plays a crucial role in the growth of tumor cells. However, the effect of shikonin on PKM2 in hepatocellular carcinoma (HCC) is unclear.
Methods: Cell viability, apoptosis level, glucose uptake, and lactate production were detected in HCC cells. Lentivirus-overexpressed and –shRNA of PKM2 were used to verify the key target of shikonin. A xenograft mouse model was used to detect the efficacy of shikonin and its combination with sorafenib in vivo.
Results: Shikonin inhibited proliferation and glycolysis and induced apoptosis in HCC cells. Either PKM2-overexpressed or PKM2-shRNA alleviated or enhanced this effect. The results of CCK-8 showed that shikonin significantly inhibited cell viability of HCC cells. The levels of glucose uptake and lactate production were dramatically decreased by shikonin-treated. Results of flow cytometry and Western blot showed that the levels of apoptosis of HCC cells were significantly increased in a dose-dependent manner after shikonin treatment. In addition, shikonin enhanced the anti-cancer effect of sorafenib in vitro and in vivo. Our results showed that SK combined with sorafenib markedly inhibits tumor growth in HCC-transplanted nude mice compared to SK or sorafenib alone.
Conclusion: By inhibiting PKM2, shikonin inhibited proliferation and glycolysis and induced cell apoptosis in HCC cells. The effect of shikonin on tumor cell proliferation, apoptosis and glycolsis will make it promising drug for HCC patients.
Keywords: shikonin, PKM2, glycolysis, apoptosis, proliferation, hepatocellular carcinoma
Introduction
Hepatocellular carcinoma (HCC) is one of the most common malignant tumors worldwide and a serious threat to human health.1–4 According to global epidemiologic data, the incidence and mortality of liver cancer rank sixth and third for cancer, respectively. Therefore, there is an urgent need to find an effective treatment for HCC patients.
PKM2, which is highly up-regulated in tumor cells, including HCC cells,5 plays a crucial role in tumor cell growth.6,7 Hoshino et al8 reported that PKM2 regulates cell proliferation. Goldberg et al9 demonstrated that knockdown of the PKM2 gene leads to tumor cell apoptosis. In addition, PKM2 catalyzes the final step of glycolysis, which catalyzes fructose bisphosphate to form pyruvate and adenosine 5′-triphosphate.10 Glycolysis is a metabolic hallmark of tumor cells.11 Tumor cells are highly dependent on glycolysis to provide energy. Therefore, PKM2 is considered to be a potential target to suppress the growth of tumors. Identification of a new drug that inhibits PKM2 expression would be clinically meaningful.
Shikonin (SK), which is isolated from Lithospermum erythrorhizon, has been reported to possess various therapeutic effects, including anti-inflammation,12,13 anti- ischemia/reperfusion injury,14,15 and anti-cancer.16,17 SK has minimal harm to normal cells and has anti-cancer effects on various tumor cells.18–20 Zhou et al21 showed that SK induces glioma cell necroptosis by increasing intracellular ROS. Zhao et al22 showed that the combination of erlotinib with SK could overcome erlotinib resistance and kill glioblastoma cells by inhibiting the epidermal growth factor receptor signaling. In addition, a previous study demonstrated that SK and its analogs suppressed tumor cell glycolysis by inhibiting PKM2 in MCF-7, A549, and HeLa cells;23 however, the effect of SK on the expression of PKM2 in HCC cells remains unclear.
In the present study we showed that PKM2 plays an important role in hepatoma cell proliferation, apoptosis, and glycolysis. SK suppresses cell proliferation and glycolysis and leads to cell apoptosis in HCC cells. Our results showed that SK inhibited the expression of PKM2. Either PKM2-overexpressed (PKM2-OE) or PKM2-shRNA alleviated or enhanced the effect of SK on cell proliferation, apoptosis, and glycolysis. In addition, SK improved the drug sensitivity of HCC cells to sorafenib, which is the first-line drug that can prolong the survival of patients with HCC. The results give us a better understanding of the mechanism of action of SK on tumor metabolism and proliferation, which may help find effective therapies for HCC patients.
Methods and Materials
Reagents
SK and dimethyl sulfoxide (DMSO) were purchased from Sigma-Aldrich (St. Louis, MO, USA). Sorafenib was obtained from Selleck (Selleck Chemicals, Shanghai, China). SK and sorafenib were dissolved in DMSO, and the final concentration of DMSO was < 0.1%. Antibodies against PKM2, caspase 3, caspase 9, PARP, CDK4, CDK6, cyclin D1, Bcl-2, Bax, and cyto C were purchased from Cell Signaling Technology (Danvers, MA, USA).
Cell Culture
HCC cells lines (LM3, SMMC-7721, Huh-7, and HepG2) and a normal liver cell line (LO2) were purchased from the Chinese Academy of Sciences Committee Type Culture Collection cell bank (Shanghai, China). HCC and LO2 cell lines were cultured in Dulbecco’s modified Eagle’s medium (DMEM; Logan, UT, USA) with high glucose and 10% fetal bovine serum at 37 °C in a 5% CO2 humidified atmosphere. All experiments were performed in triplicate.
Cell Proliferation and Combination Analysis
Cells were seeded in 96-well plates and incubated for 24-96h with different concentrations of SK. 10 μL CCK8 solution (Dojindo, Kumamoto, Japan) was added to each well. Plates were placed in the dark at 37°C for 2 h. Cell viability was determined by a microplate reader at 450 nm.
The IC50 and combination index (CI) were calculated using Compusyn software (Paramus, NJ, USA). A CI value equal to 1 indicated that SK and sorafenib had an additive effect, a CI value < 1 indicated that SK and sorafenib had a synergistic effect, and a CI value > 1 indicated that SK and sorafenib had an antagonistic effect.
Cell Cycle Analysis
HCC cells were treated with or without SK for 24 h and collected. Cells were permeabilized with cold 75% ethanol at −20°C overnight. Then, after washing twice with PBS, cells were incubated with 350 μL of PI/RNase staining buffer (BD Pharmingen, Franklin Lakes, NJ, USA) for 30 min at 4°C. The results were obtained using a BD FASCCanto II flow cytometer (Cytomics FC500; Beckman Coulter, Fullerton, CA, USA).
Apoptosis Analysis
HCC cells were treated with or without SK for 48 h in 6-well plates at a density of 1 × 10⁶ cells/mL. Cells were collected and centrifuged at 1000 rpm for 5 min. After washing twice with PBS and centrifuging, the sediments were suspended with 1 × binding buffer and stained with Annexin-V/PI (BD Biosciences, San Jose, CA, USA) for 15 min at room temperature. The cells were detected using a flow cytometer (Cytomics FC500). The results were analyzed by FlowJo software (version 10; FlowJo LLC, Ashland, OR, USA).
Hoechst 33342 Staining
HCC cells (LM3 and SMMC-7721) were treated with or without SK in 6-well plates for 24 h and collected. Cells were then washed with PBS for three times and fixed with 75% ethanol for 10 min. Hoechst 33342 dye diluted in PBS and added to the collected cells for 30 min in the dark. The apoptotic cells were characterized by bright blue fluorescence in the nucleus. The images were acquired using fluorescence microcopy (Leica, Wetzlar, Germany). The number of positive cells was calculated using Image-Pro Plus software 6.0 (n=6).
Glucose Uptake and Lactate Production
After washing twice with uptake buffer (140 mM NaCl, 2 mM KCl, 1 mM KH2PO4, 10 mM MgCl2, 1 mMCaCl2, 5 mM glucose, 5 mM L-alanine, 5 mM indomethacin, and 10 mM HEPES/Tris [pH 7.4]), the cells were cultured for 30 min at 37 °C in an uptake buffer containing 1 μCi/mL 2-DG. The cells were dissolved using 0.1% sodium dodecyl sulfate (SDS) and the radioactivity was detected on a liquid scintillation counter. Protein was then quantified to standardize the above results. Lactate production was measured by a microplate reader according to the manufacturer’s instructions.
Reverse Transcription (RT)-PCR and Quantitative Real Time (qRT)-PCR
Total RNA was extracted with TRIzol reagent according to the manufacturer’s instructions. Total RNA was used to transcribe into cDNA by using a reverse transcription kit (TaKaRa Biotechnology, Dalian, China). The protocol used was: 95°C × 3 min, 95°C × 3 s, 60°C × 30 s × 40 cycles. The qRT-PCR (Applied Biosystems, CA, USA) was performed to determine the gene expression according to the manufacturer’s protocol. The primers used in the study are shown in Table 1.
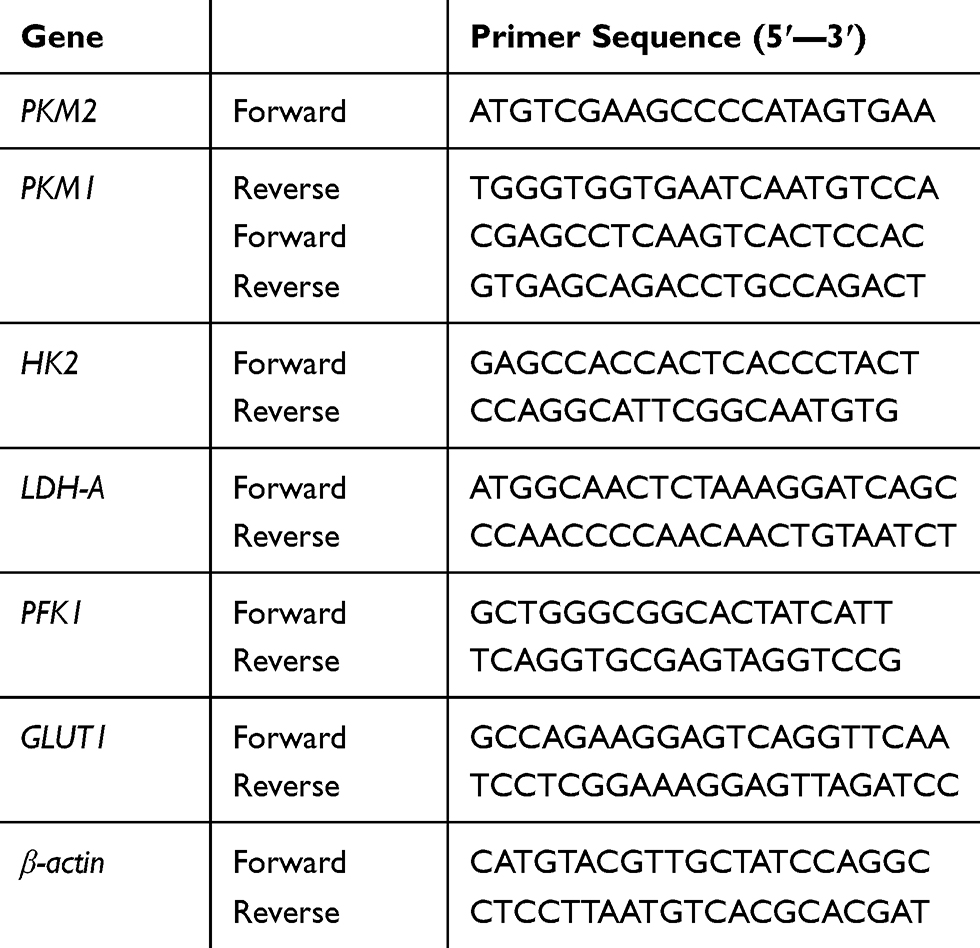 |
Table 1 Nucleotide Sequences of Primers Used for PCR |
Western Blot Analysis
The total protein of cells and tumors were extracted using a radioimmunoprecipitation assay (RIPA) with a protease inhibitor and separated by sodium dodecyl sulfate-polyacrylamide gel electrophoresis (SDS-PAGE). The protein concentration was detected by a BCA kit. After separation, the bands were transferred onto polyvinylidene fluoride membranes and blocked with 5% non-fat milk for 60 min at room temperature. Then, the membranes were probed with the corresponding primary antibodies at 4°C overnight, as follows using anti-: PKM2 (1:500); cleaved-caspase 9 (1:500); cleaved-caspase 3 (1:500); PARP (1:500); CDK4 (1:500); CDK6 (1:500); cyclin D1 (1:500); Bcl-2 (1:500); Bax (1:500); cyto C (1:500); and β-actin (1:1000). The membranes were washed three times with PBST, then incubated with the appropriate secondary antibodies (1:2000) for 60 min at 37°C. After incubation, the membranes were washed with PBST three times and probed using the Odyssey two-color infrared laser imaging system (LI-COR Biosciences, Lincoln, NB, USA).
Plasmid Construction, Lentivirus Packaging, and Infection
The PKM2 overexpressed or knockdown lentivirus was synthesized by BioLink Biotechnology (Shanghai, China). A full-length cDNA encoding the PKM2 sequence was amplified from 293T cDNA and cloned into the pLenO-DCE-CMV-MCS-GFP vector. Empty vector (EV) was used as a control. In addition, pLenR-GPH-ShRNA was constructed to generate knockdown of PKM2. A nonsense scrambled oligonucleotide was used as a control. To established a stable lentivirus transfection HCC cells, LM3 and SMMC-7721 cells were cultured in 6-well plates, and transfected with EV, PKM2-OE, or PKM2-shRNA lentivirus when 70–80% confluent. Transfection of HCC cells by lentivirus was performed using 5 μg/mL polybrene (Sigma-Aldrich) for 24 h. Transduced HCC cells were selected in puromycin. The transduction efficiency was determined by RT-PCR and Western blotting.
In vivo Animal Experiments
Four-week-old male BALB/C nude mice (Shanghai Laboratory Animal Center, Shanghai, China) were housed in a standard room with a 12-h light-dark cycle and free access to water and food. All animal experiments were performed in accordance with the National Institutes of Health Guidelines for the Care and Use of Laboratory Animals. The study was approved by the Animal Care and Use Committee of Shanghai Tongji University. This research was approved by the Science and Technology Commission of Shanghai Municipality (ID: SHDSYY-2017-2330). The mice were inoculated subcutaneously with LM3 HCC cells (5 × 10⁶). After one week, when the tumors were measurable, the mice were randomly assigned into 4 groups with 2 mice each.
Group I, NC: saline
Group II, SK5: 5 mg/(kg·d) SK
Group III, S10: 10 mg/(kg·d) sorafenib
Group IV, SK5 + S10: 5 mg/(kg·d) SK and 10 mg/(kg·d) sorafenib
SK and sorafenib were dissolved by DMSO and administered orally for 24 days. Mouse weight and tumor size were measured every 4 days. After a 24-day treatment, mice were anesthetized and sacrificed by cervical dislocation. Tumors underwent hematoxylin and eosin (H&E).
H&E Staining
The portion of tumor tissue was fixed with 4% paraformaldehyde for 24 h. Then, the specimen was dehydrated and embedded in paraffin. Sections were cut into 3 μm thick and stained with H&E. A light microscope was used to observe the histopathological changes.
Immunohistochemistry (IHC) Staining
Paraformaldehyde-immersed tissues were embedded in paraffin and cut in 3 μm thick sections. The sections were dewaxed and rehydrated, after an antigen retrieval process and blocking, the sections were incubated with primary antibodies against PKM2 overnight. The images were captured by an optional microscope.
Statistical Analysis
All experiments were repeated at least three times. Differences between groups were evaluated by one-way ANOVA using SPSS version 20.0 software (SPSS, Chicago, IL, USA). A P < 0.05 was considered statistically significant.
Results
PKM2 Plays an Important Role in HCC Cells
PKM2 plays an important role in tumor cell growth. Western blot and q-PCR were used to determine the expression of PKM2 protein and mRNA in HCC cell lines (LM3, SMMC-7721, HepG2, and Huh7) and normal liver cells (LO2). As shown in Figure 1A and B, compared with LO2, the mRNA and protein levels of PKM2 in the four HCC cells were increased to a different extent, and the highest increase was observed in SMMC-7721 and LM3 cells. Based on the above experimental results, we selected SMMC-7721 and LM3 for further investigation.
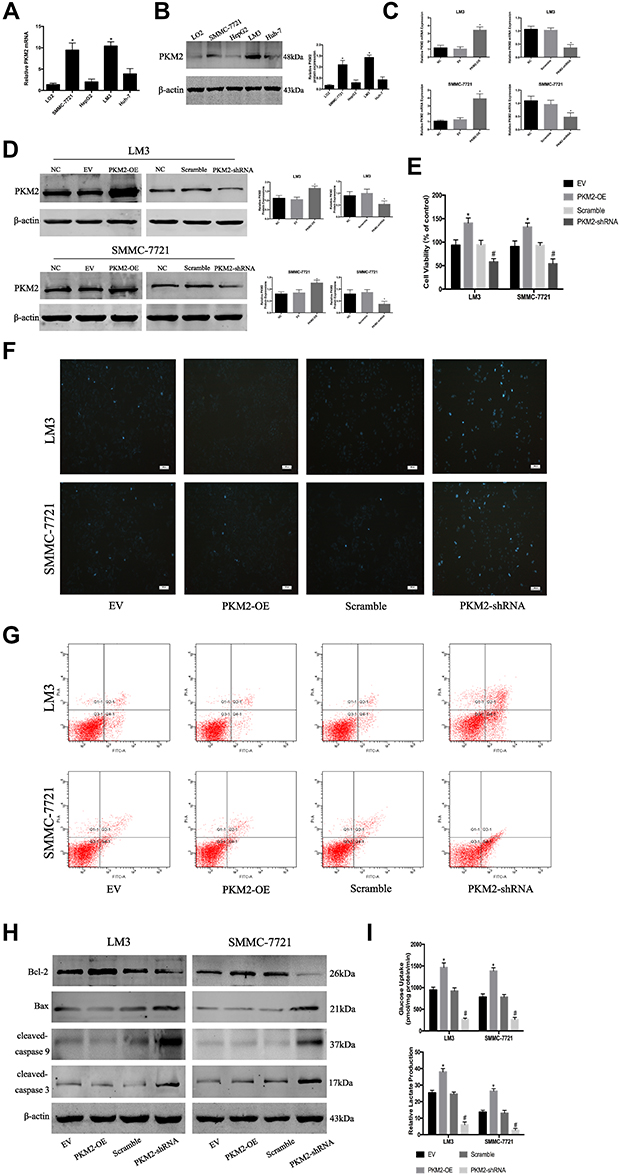 |
Figure 1 PKM2 plays an important role in HCC cells. (A) The expression of PKM2 mRNA was detected by RT-PCR. The data are expressed as the mean ± SD (n = 3, *P < 0.05 vs LO2). (B) Western blotting was used to determine the expression of PKM2 protein. β-actin was used as a loading control. The data are expressed as the mean ± SD (n = 3, *P < 0.05 vs LO2). (C) The expression of PKM2 mRNA in LM3 and SMMC-7721 cells was detected by RT-PCR after PKM2-OE or PKM2-shRNA use. Data are shown as the mean ± SD (n = 3, *P < 0.05 for PKM2-OE vs EV or for PKM2-shRNA vs scramble). (D) Expression of PKM2 protein in LM3 and SMMC-7721 cells was determined by Western blotting after PKM2-OE or PKM2-shRNA use. Data are shown as the mean ± SD (n = 3, *P < 0.05 for PKM2-OE vs EV or for PKM2-shRNA vs scramble). (E) CCK8 was used to detect cell viability after PKM2-OE or PKM2-shRNA use. The data are expressed as the mean ± SD (n = 3, *P < 0.05 for PKM2-OE vs EV; #P < 0.05 for PKM2-shRNA vs scramble). (F and G) Apoptosis of LM3 and SMMC-7721 cells was determined by Hoechst 33342 and flow cytometry after PKM2-OE or PKM2-shRNA use. (H) Expression of Bcl-2, Bax, cleaved-caspase 3, and cleaved-caspase 9 protein was detected by Western blotting. (I) LM3 and SMMC-7721 cells were cultured for 48 h. Glucose uptake and relative lactate production were analyzed. The data are shown as the mean ± SD (n = 3, *P < 0.05 for PKM2-OE vs EV; #P < 0.05 for PKM2-shRNA vs scramble). |
To investigate the effect of PKM2 on the proliferation of HCC cells, we constructed lentiviral vectors to up- and down-regulate PKM2 in LM3 and SMMC-7721 cells. EV or scramble was used as a control. As shown in Figure 1C and D, q-PCR and Western blot were used to evaluate the effect of viral infection. Our results showed that the expression of PKM2 in the PKM2-OE group was significantly increased compared with the EV group, while the expression of PKM2 in the PKM2-shRNA group was dramatically decreased compared with the scramble group. LM3 and SMMC-7721 cells infected with PKM2-OE and PKM2-shRNA were cultured for 48 h, and CCK8 was used to detect the proliferation of HCC cells. The results of the CCK8 assay indicated that cell viability in the PKM2-OE group was elevated compared with the EV group, and cell viability in the PKM2-shRNA group was significantly reduced compared with the scramble group (Figure 1E).
Flow cytometry and Hoechst 33342 were used to investigate the effect of PKM2 on HCC cell apoptosis. Hoechst 33342 dye solution can enter the cell membrane of normal cells and cause slight staining, which is increased when the cells undergo apoptosis. The results showed that apoptosis of LM3 and SMMC-7721 cells was slightly decreased in the PKM2-OE group compared with the EV group, but dramatically increased in the PKM2-shRNA group compared with the scramble group (Figure 1F and G). We also used Western blot to detect the expression of Bcl-2, Bax, cleaved-caspase 3, and cleaved-caspase 9 expression (Figure 1H). The results were consistent with flow cytometry and Hoechst 33342.
Glycolysis, a metabolic feature of malignant tumors, plays a crucial role in the rapid growth of tumor cells. Glycolysis is characterized by high glucose uptake and lactate production. Therefore, we examined glucose uptake and lactate production in supernatants of LM3 and SMMC-7721 cells infected with PKM2-OE and PKM2-shRNA (Figure 1I). The results showed that the glucose uptake and lactate production in the PKM2-OE group were significantly higher than the EV group, while the glucose uptake and lactate production in the PKM2-shRNA group were significantly lower than the scramble group.
Anti-Tumor Effects of SK in HCC Cells
Tumor cells are characterized by increased proliferation and resistance to cell death. Therefore, we investigated the effect of SK on the proliferation of HCC cells using CCK8. When we exposed HCC (SMMC-7721 and LM3) and normal cells (LO2) to SK (0–5 μM) for 48 h, HCC cell viability was markedly reduced in a dose-dependent manner (Figure 2A). Then, we treated HCC cells and LO2 cells with SK (3 μM) for 24, 48, 72, or 96 h. SK inhibited HCC cell viability in a time-dependent manner (Figure 2A). Based on the above results, 1, 2, and 3 μM doses of SK were selected for further study. The proliferation of tumor cells is closely related to the progression of the cell cycle. To explore whether or not shikonin regulates the HCC cell cycle to affect cell proliferation, we determined the cycle distribution of LM3 and SMMC-7721 cells treated with SK (1, 2, and 3 μM) for 24 h. To explore the mechanism of SK on the cell cycle regulation in HCC cells, we used Western blot to detect the expression of G0/G1 phase-related proteins (Cyclin D1, CDK4, and CDK6). Cyclin D1 is a specific protein in the G0/G1 phase. The transition of the cell cycle from G1 to S is regulated by Cyclin D1/CDK4/CDK6. The results showed that SK reduced the protein expression of these indicators (Figure 2B). We also used flow cytometry to determine the distribution of HCC cells after SK treatment. The results showed that the percentage of cells in the G0/G1 phase of LM3 and SMMC-7721 cells was significantly increased after SK treatment (Figure 2C).
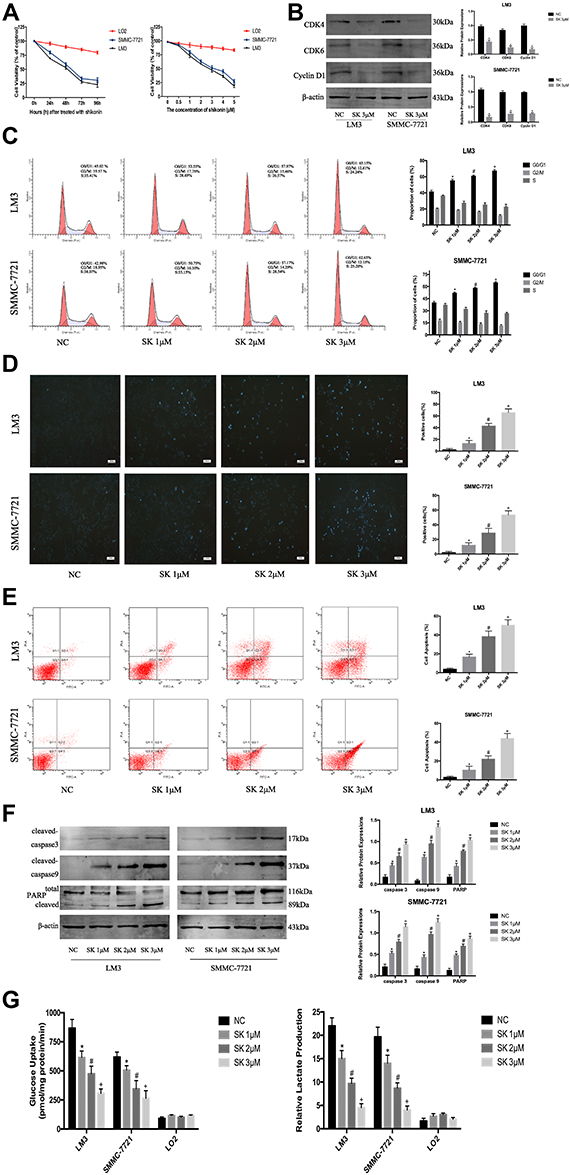 |
Figure 2 The anti-tumor effects of SK in HCC cells. (A) HCC cells (SMMC-7721 and LM3) and normal liver cells (LO2) were treated with SK (0–5 μM) for 48 h and cell viability was determined by CCK8 assays. HCC cells and normal liver cells were treated with SK (3 μM) for 24–96 h and cell viability was determined by CCK8 assays (n = 3). (B) Western blotting was used to detect the expression of G0/G1 phase-related proteins in LM3 and SMMC-7721 cells treated with SK (3 μM) for 24 h. Data are expressed as the mean ± SD (n = 3, *P < 0.05 for SK [3 μM] vs NC). (C) Cell cycle analysis of HCC cells treated with SK for 24 h. Proportion of cells in different phases of the cell cycle is shown (n = 3, *P < 0.05 for SK [1 μM] vs NC, #P < 0.05 for SK [2 μM] vs SK [1 μM], and +P < 0.05 for SK [3 μM] vs SK [2 μM] in G0/G1 phase). (D and E) Apoptosis of LM3 and SMMC-7721 was detected by Hoechst 33342 and flow cytometry (magnification 200 ×). The data are expressed as the mean ± SD (n = 3, *P < 0.05 for SK [1 μM] vs NC, #P < 0.05 for SK [2 μM] vs SK [1 μM], and +P < 0.05 for SK [3 μM] vs SK [2 μM]). (F) Expression of cleaved-caspase 3, cleaved-caspase 9, and PARP protein was detected by Western blotting. β-actin was used as a loading control. The gray values were calculated. The data are expressed as the mean ± SD (n = 3, *P < 0.05 for SK [1 μM] vs NC, #P < 0.05 for SK [2 μM] vs SK [1 μM], and +P < 0.05 for SK [3 μM] vs SK [2 μM]). (G) HCC cells (LM3 and SMMC-7721) and normal liver cells (LO2) were treated with SK for 48 h. Glucose uptake and relative lactate production were analyzed. The data are expressed as the mean ± SD (n = 3, *P < 0.05 for SK [1 μM] vs NC, #P < 0.05 for SK [2 μM] vs SK [1 μM], and +P < 0.05 for SK [3 μM] vs SK [2 μM]). |
Hoechst 33342, flow cytometry, and Western blot were used to demonstrate cell apoptosis. As shown in Figure 2D, cells in the NC group exhibited minimal blue staining; the fluorescence intensity increased with increasing doses of SK. Six areas were randomly selected and counted as positive cells. AnnexinV-FITC/PI staining showed that SK induced apoptosis in LM3 and SMMC-7721 cells in a dose-dependent manner (Figure 2E). Expressions of caspase3, caspase9, and PARP protein were determined by Western blot. SK significantly upregulated the expression of cleaved-caspase3, cleaved-caspase9, and cleaved PARP in LM3 and SMMC-7721 cells (Figure 2F). These results indicated that SK induced apoptosis of HCC cells.
In addition, LM3, SMMC-7721, and LO2 cells were treated with SK for 48 h to assess glucose uptake and lactate production. The results showed that SK markedly decreased glucose uptake and lactate production in a dose-dependent manner in LM3 and SMMC-7721 cells compared with the NC group. By contrast, SK had no effect on glucose uptake or lactate production in LO2 cells (Figure 2G).
SK Exerts Anti-Tumor Effects by Regulating PKM2 in HCC Cells
In the previous study, we confirmed that SK effectively inhibited glycolysis in HCC cells. To further explore the mechanism by which SK inhibited glycolysis, we investigated the expression of glycolytic enzyme mRNAs in LM3 and SMMC-7721 cells, such as HK2 (hexokinase 2), GLUT1 (Glucose transporter type 1), PKM2 (Pyruvate kinase isozyme type M2), PFK1 (phosphofructokinase 1), PFK2 (Phosphofructokinase 2), PKM1 (Pyruvate kinase M1), and LDH-A (Lactate dehydrogenase A). The results showed that SK significantly down-regulated the expression of PKM2 in both LM3 and SMMC-7721 cells (Figure 3A). Western blot was used to detect the expression of PKM2 protein after SK treatment (Figure 3B). The results were consistent with the results of q-PCR.
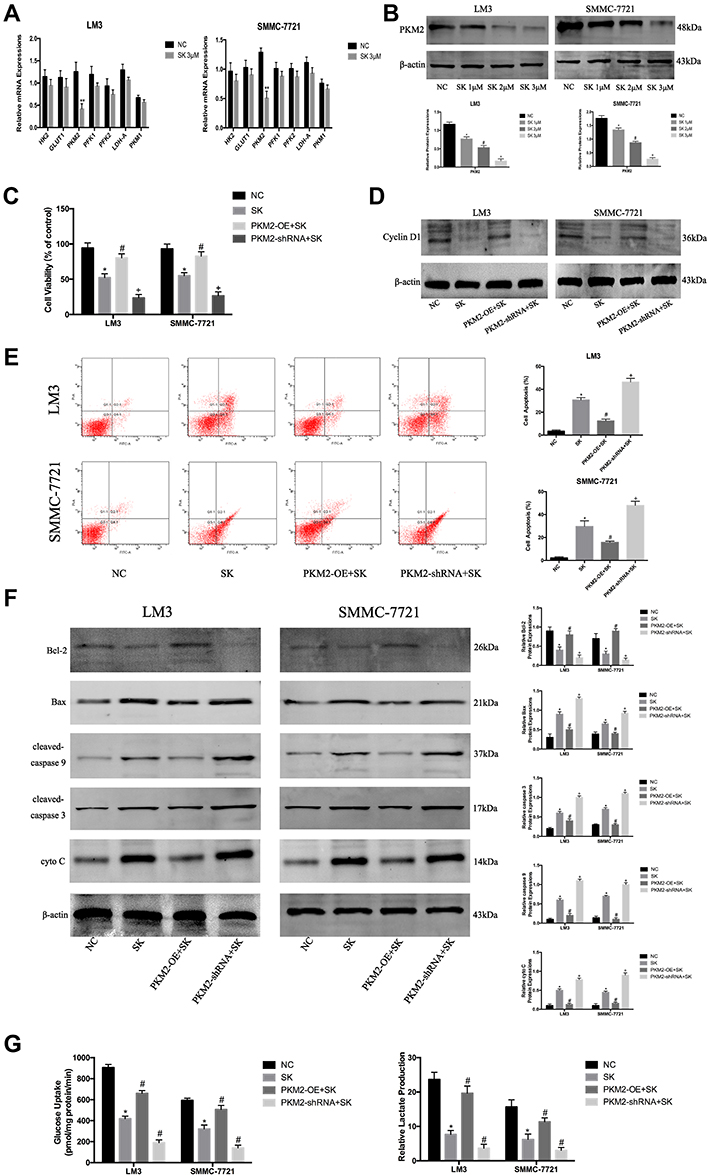 |
Figure 3 SK exerts anti-tumor effects by regulating PKM2 in HCC cells. (A) RT-PCR analysis of the effects of shikonin (SK) (3 μM) on mRNA expression of genes related to glycolysis in HCC cells. The data are shown as the mean ± SD (n = 3, **P< 0.01 for SK [3 μM] vs NC). (B) Western blotting analysis of PKM2 in LM3 and SMMC-7721 cells treated with SK (0, 1, 2, and 3 μM) for 48 h. The gray values were calculated (n = 3, *P < 0.05 for SK [1 μM] vs NC, #P < 0.05 for SK [2 μM] vs SK [1 μM], +P < 0.05 for SK [3 μM] vs SK [2 μM]). (C) CCK8 was used to determine cell viability. Data are shown as the mean ± SD (n = 3, *P < 0.05 for SK vs NC, #P < 0.05 for PKM2-OE + SK vs SK, +P < 0.05 for PKM2-shRNA + SK vs SK). (D) Western blotting analysis of cyclin D1 in LM3 and SMMC-7721 cells treated with SK. (E) Apoptosis of LM3 and SMMC-7721 cells was detected by flow cytometry (n = 3, *P < 0.05 for SK vs NC, #P < 0.05 for PKM2-OE + SK vs SK, +P < 0.05 for PKM2-shRNA + SK vs SK). (F) Expressions of Bcl-2, Bax, cleaved-caspase 9, cleaved-caspase 3, and cyto C proteins in LM3 and SMMC-7721 cells were determined by Western blotting. β-actin was used as a loading control. The gray values were calculated (n = 3, *P < 0.05 for SK vs NC, #P < 0.05 for PKM2-OE + SK vs SK, +P < 0.05 for PKM2-shRNA + SK vs SK). (G) Glucose uptake and relative lactate production were analyzed. The data are expressed as the mean ± SD (n = 3, *P < 0.05 for SK vs NC, #P < 0.05 for PKM2-OE + SK vs SK, +P < 0.05 for PKM2-shRNA + SK vs SK). |
To investigate the effect of SK by regulating PKM2 on the proliferation of HCC cells, we used 3 μM SK to treat original cells (SK), PKM2-OE cells (PKM2-OE+SK), and PKM2-shRNA cells (PKM2-shRNA+SK), and untreated liver cancer cells (NC) as controls. After SK treatment, the proliferation of each group in LM3 and SMMC-7721 cells was detected by CCK8 (Figure 3C). The cell viability of the PKM2-OE+SK group was significantly higher than the SK group, while the cell viability of the PKM2-shRNA+SK group was significantly lower than the SK group. Moreover, we used Western blot to detect the effect of SK on the expression of cyclin D1 protein after up- and down-regulation of PKM2 (Figure 3D). Compared with the SK group, the expression of cyclin D1 protein in the PKM2-OE+SK group was significantly increased, while the expression of cyclin D1 protein in the PKM2-shRNA+SK group was decreased compared with the SK group.
Flow cytometry and Western blot were used to detect the effect of SK by regulating PKM2 on HCC cell apoptosis. In LM3 and SMMC-7721 cells, the results of flow cytometry showed that compared with the SK group, the apoptosis level of the PKM2-OE+SK group was significantly decreased, while the apoptosis level of the PKM2-shRNA+SK group was significantly increased compared with the SK group (Figure 3E). We also used Western blot to determine the expression of apoptosis-related proteins in LM3 and SMMC-7721. As shown in Figure 3F, SK increased the expression of Bax, cyto C, cleaved-caspase 9, and cleaved-caspase 3, and decreased the expression of Bcl-2. In PKM2-OE group, the effects of SK on apoptosis were attenuated, while in PKM2-shRNA group the effects were enhanced. These results provided strong evidence that the anti-apoptotic effects of SK were closely related to PKM2 in HCC cells.
To investigate the effect of SK by regulating PKM2 on glycolysis in HCC cells, we detected glucose uptake and lactate production in each group (Figure 3G). The results showed that the glucose uptake and lactate production in the PKM2-OE+SK group were significantly higher than the SK group, while the glucose uptake and lactate production in the PKM2-shRNA+SK group showed a consistent downward trend with the SK group and the level was lower than the SK group.
SK Enhanced Sorafenib-Induced HCC Cell Growth Inhibition in vitro and in vivo
Sorafenib, a targeted drug, is the only effective drug used clinically to treat HCC patients; however, due to serious side effects and high cost, sorafenib is not widely used. Therefore, we combined SK and sorafenib to investigate the effects on cell proliferation in HCC cells. As shown in Figure 4A, compared to SK or sorafenib alone, the combination of SK and sorafenib (1:1) induced greater cell cytotoxicity in HCC cells. Median dose-effect analysis demonstrated that the CI in HCC cells was < 1, which indicated a synergistic effect (Figure 4B). In addition, we also used sorafenib alone to study the effects on cell viability in LM3 and SMMC-7721 cells (Figure 4C).
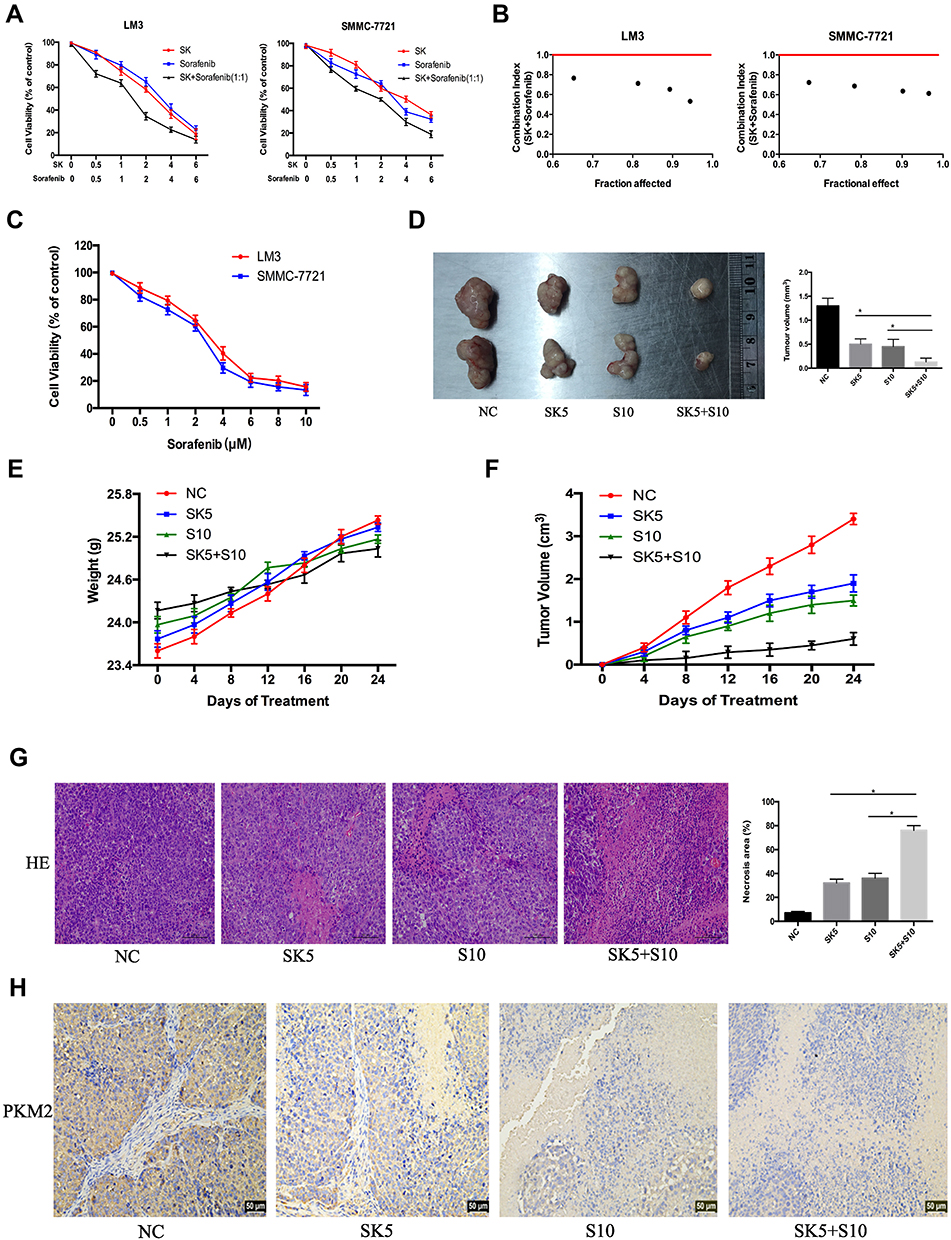 |
Figure 4 Effects of SK combined with sorafenib in vitro and in vivo. (A and B) LM3 and SMMC-7721 cells were treated with sorafenib combined with SK for 48 h. CCK8 assays were used to determine cell viability. Data are expressed as the mean ± SD. The combination index (CI) < 1 indicates synergistic effects. (C) LM3 and SMMC-7721 cells were treated with sorafenib (0–10 μM) for 48 h and cell viability was assessed by CCK8 assays. Data are expressed as the mean ± SD. (D) Tumors on day 24 (n = 2, *P < 0.05 for SK5 or S10 vs SK5 + S10). (E and F) Changes in mouse weight and tumor volume were recorded at the indicated time points. (G) H&E staining in tumor sections indicated levels of necrosis (magnification 200 ×, n = 3, *P < 0.05 for SK5 or S10 vs SK5 + S10). (H) IHC staining in tumor sections indicated the expression of PKM2 (magnification 200 ×). |
To verify these in vitro findings, we further performed in vivo studies. Saline, sorafenib (10 mg/kg), SK (5 mg/kg), and sorafenib (10 mg/kg) + SK (5 mg/kg) were used for further in vivo experiments. Mice received a daily dose of saline, SK, sorafenib, and SK combined with sorafenib by gavage for 24 days after the formation of tumors. Mice treated with SK or sorafenib alone had significantly smaller tumor volumes than saline-treated mice after 24 days of treatment. Combined treatment with SK and sorafenib induced greater tumor size reduction compared to treatment with SK or sorafenib alone (Figure 4D), indicating that SK increased the anti-tumor effect of sorafenib in vivo. The changes in mouse weight and tumor volume in the 24-day period are shown in Figure 4E and F. As shown in Figure 4G, H and E staining showed higher levels of necrosis in the combination group compared with the NC group and SK or sorafenib alone groups. The results of H&E staining further supported our conclusions. Taken together, these results provided strong evidence that SK enhanced sorafenib-induced HCC cell growth inhibition in vitro and in vivo.
Discussion
Tumor cells are immortalized cells whose development is closely related to cell proliferation, apoptosis, and energy metabolism. The ability to infinitely proliferate, resist death signals, and abnormal energy metabolism play crucial roles in the rapid growth of tumor cells, including HCC cells. Therefore, there is an urgent need to find effective treatment to mitigate with these malignant biological behaviors of HCC cells.
SK, isolated from Lithospermum erythrorhizon, has various biologic activities, including anti-tumor effects. A recent study showed that shikonin induces apoptosis and autophagy in the human melanoma cell line, A375, via ROS-mediated ER stress and the p38 pathway.24 Shikonin inhibits the growth of human prostate cancer cells through androgen receptors.25 By regulating the PI3K/Akt signaling pathway, shikonin exerts anti-tumor effects in non-small cell lung cancer, chronic granulocyte leukemia, and Burkitt’s lymphoma.26–28 In the present study, we investigated the anti-tumor effects of SK in HCC cells. Our results showed that SK significantly inhibited HCC cell proliferation and glycolysis, and promoted HCC cell apoptosis. However, the anti-tumor mechanism of SK still needs to be explored. Many studies have shown that PKM2 plays a crucial role in the growth of tumor cells. PKM2 regulates cell proliferation and differentiation, and knocking out PKM2 leads to tumor cell apoptosis and growth restriction.29–34 In addition, PKM2 is the rate-limiting enzyme in the last step of glycolysis, which catalyzes phosphoenolpyruvate-to-pyruvate. Down-regulation of PKM2 can affect the energy metabolism of tumor cells, thereby inhibiting the growth of tumor cells.35,36 In the present study, we demonstrated that PKM2 was elevated to varying degrees in HCC cells. We used lentivirus to up- and down-regulate PKM2 of LM3 and SMMC-7721 cells. We used the CCK8 assay to detect cell proliferation, detect apoptosis using flow cytometry and Hoechst 33342, and measure the level of glycolysis using glucose enzyme oxidation and lactic acid colorimetry. Our results showed that PKM2 promotes HCC cell proliferation and glycolysis, and inhibits HCC cell apoptosis. In conclusion, PKM2 plays a crucial role in the proliferation, apoptosis, and glycolysis of HCC cells. In view of the above research, we suspect the anti-tumor effects of SK are related to PKM2.
Several studies had shown that SK inhibits the growth of lung cancer cells and the glycolysis process of cervical cancer cells by inhibiting the expression of PKM2.23,37 Therefore, we used q-PCR and Western blot to detect the expression of PKM2 after SK treatment. Our results demonstrated that of all glycolytic enzymes, expression of PKM2 protein and mRNA was reduced to the greatest extent with SK treatment in both LM3 and SMMC-7721 cells. To further verify the indispensable role of PKM2 in the action of SK against liver cancer, we used lentivirus vector to up- or downregulate the PKM2 gene. Subsequently, we examined the effects of shikonin on proliferation, glycolysis, and apoptosis of hepatoma cells after PKM2 was up- or down-regulated. When PKM2 was up-regulated, the inhibitory effect of shikonin on proliferation and glycolysis of hepatoma cells and the promotion of apoptosis of hepatoma cells was weakened. When PKM2 was down-regulated, the inhibitory effect of shikonin on proliferation and glycolysis of hepatoma cells and the promotion of apoptosis of liver cancer cells was enhanced. These results demonstrated that PKM2 plays a crucial role in the action of SK against liver cancer. Taken together, SK inhibited HCC cell proliferation and glycolysis and promoted HCC cell apoptosis by PKM2.
Because most liver cancers cannot be treated surgically, chemotherapy is the main treatment. Sorafenib, a targeted drug, has been shown to be effective in prolonging HCC patient survival; however, the use of sorafenib is limited due to the high cost.38 Therefore, it is very meaningful to screen out a drug that can improve the sensitivity of sorafenib. Studies had shown that SK enhanced the sensitivity of non-small cell lung cancer to erlotinib and gefitinib.39 SK increased the sensitivity of A549 cells to adriamycin.40 Similar reports had been reported in liver cancer.41 The above studies provided ideas for the combination of SK and other anti-hepatocarcinoma drugs. In the present study, we evaluated the combined effects of SK and sorafenib both in vitro and in vivo experiments. Our results showed that SK enhanced sorafenib-induced cell growth inhibition in LM3 and SMMC-7721 cells. In addition, combination treatment induced greater tumor inhibition compared to treatment with sorafenib or SK alone in HCC-transplanted nude mice. H&E staining was used to determine the level of necrosis. SK combined with sorafenib induced increased necrosis compared to SK or sorafenib alone. Taken together, our results indicated that SK and sorafenib have synergistic effects against liver cancer, and SK increases the sensitivity of liver cancer to sorafenib.
In the present study, we found that SK significantly reduced the expression of PKM2, and inhibited the expression of cyclinD1, thereby inhibiting the proliferation of HCC cells. In contrast, a decrease in PKM2 expression affected the binding of PKM2 to Bcl-2, resulting in a decrease in the anti-apoptotic protein Bcl-2, and thereby promoting apoptosis of HCC cells. As a rate-limiting enzyme in the glycolysis process, PKM2 catalyzes the production of pyruvate by phosphoenolpyruvate (PEP). The decrease in PKM2 affected HCC cell energy metabolism and inhibited the process of glycolysis (Figure 5). In addition, we have shown that SK enhances the anti-tumor effects of sorafenib in HCC cells and an HCC-transplanted nude mice model. Our results showed that SK combined with sorafenib markedly inhibits tumor growth in HCC-transplanted nude mice compared to SK or sorafenib alone.
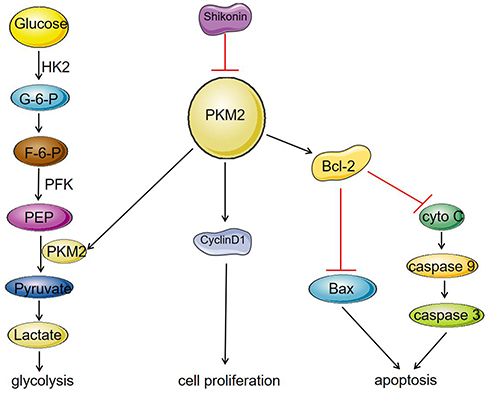 |
Figure 5 Mechanism of SK on inhibition of glycolysis and proliferation and induction of apoptosis in HCC cell lines. SK significantly reduced the expression of PKM2, and inhibited the expression of cyclinD1, thereby inhibiting the proliferation of HCC cells. On the other hand, a decrease in PKM2 expression affected the binding of PKM2 to Bcl-2, resulting in a decrease in the anti-apoptotic protein Bcl-2, which led to increase in the protein Bax, caspase 9, and caspase 3, thereby promoting apoptosis of HCC cells. As a rate-limiting enzyme in the glycolysis process, PKM2 can catalyze the production of pyruvate by phosphoenolpyruvate (PEP). The decrease in PKM2 affected HCC cell energy metabolism and inhibited the process of glycolysis. |
Conclusions
By inhibiting PKM2, shikonin inhibited proliferation and glycolysis and induced cell apoptosis in HCC cells. The effect of shikonin on tumor cell proliferation, apoptosis and glycolysis will make it promising drug for HCC patients.
Acknowledgments
We thank International Science Editing for editing this manuscript. This project was supported by the National Natural Science Foundation of China (No. 81670472; 81700502; 81800538), Shanghai Science and Technology Commission Sailing Program (No. 2018YF1420000), Shanghai Putuo District Science and Technology Commission Health System Innovation Program (ptkwws201901), and China Hepatitis Prevention Foundation WBN Liver Disease Research Fund (No. 2019031). Tong Liu and Sainan Li are co-first authors for this study.
Disclosure
The authors report no conflicts of interest in this work.
References
1. Hemming AW, Berumen J, Mekeel K. Hepatitis B and hepatocellular carcinoma. Clin Liver Dis. 2016;20:703–720. doi:10.1016/j.cld.2016.06.007
2. Aravalli RN, Steer CJ, Cressman EN. Molecular mechanisms of hepatocellular carcinoma. Hepatology. 2008;48:2047–2063. doi:10.1002/hep.22580
3. Khalaf AM, Fuentes D, Morshid AI, et al. Role of Wnt/β-catenin signaling in hepatocellular carcinoma, pathogenesis, and clinical significance. J Hepatocell Carcinoma. 2018;5:61–73. doi:10.2147/JHC.S156701
4. Stavraka C, Rush H, Ross P. Combined hepatocellular cholangiocarcinoma (cHCC-CC): an update of genetics, molecular biology, and therapeutic interventions. J Hepatocell Carcinoma. 2018;6:11–21. doi:10.2147/JHC
5. Xu Q, Liu X, Zheng X, Yao Y, Liu Q. PKM2 regulates Gli1 expression in hepatocellular carcinoma. Oncol Lett. 2014;8:1973–1979. doi:10.3892/ol.2014.2441
6. Yang W, Xia Y, Ji H, et al. Nuclear PKM2 regulates beta-catenin transactivation upon EGFR activation. Nature. 2011;480:118–122. doi:10.1038/nature10598
7. Azoitei N, Becher A, Steinestel K, et al. PKM2 promotes tumor angiogenesis by regulating HIF-1alpha through NF-kappaB activation. Mol Cancer. 2016;15:3. doi:10.1186/s12943-015-0490-2
8. Hoshino A, Hirst JA, Fujii H. Regulation of cell proliferation by interleukin-3-induced nuclear translocation of pyruvate kinase. J Biol Chem. 2007;282:17706–17711. doi:10.1074/jbc.M700094200
9. Goldberg MS, Sharp PA. Pyruvate kinase M2-specific siRNA induces apoptosis and tumor regression. J Exp Med. 2012;209:217–224. doi:10.1084/jem.20111487
10. Warburg O, Wind F, Negelein E. The metabolism of tumors in the body. J Gen Physiol. 1927;8:519–530. doi:10.1085/jgp.8.6.519
11. Ganapathy-Kanniappan S, Geschwind JF. Tumor glycolysis as a target for cancer therapy: progress and prospects. Mol Cancer. 2013;12:152. doi:10.1186/1476-4598-12-152
12. Liu T, Xia Y, Li J, et al. Shikonin attenuates concanavalin A-induced acute liver injury in mice via inhibition of the JNK pathway. Mediators Inflamm. 2016;2016:2748367. doi:10.1155/2016/2748367
13. Ishida T, Sakaguchi I. Protection of human keratinocytes from UVB-induced inflammation using root extract of Lithospermum erythrorhizon. Biol Pharm Bull. 2007;30:928–934. doi:10.1248/bpb.30.928
14. Liu T, Zhang Q, Mo W, et al. The protective effects of shikonin on hepatic ischemia/reperfusion injury are mediated by the activation of the PI3K/Akt pathway. Sci Rep. 2017;7:44785. doi:10.1038/srep44785
15. Wang Z, Liu T, Gan L, et al. Shikonin protects mouse brain against cerebral ischemia/reperfusion injury through its antioxidant activity. Eur J Pharmacol. 2010;643:211–217. doi:10.1016/j.ejphar.2010.06.027
16. Kim HJ, Hwang KE, Park DS, et al. Shikonin-induced necroptosis is enhanced by the inhibition of autophagy in non-small cell lung cancer cells. J Transl Med. 2017;15:123. doi:10.1186/s12967-017-1223-7
17. Gara RK, Srivastava VK, Duggal S, et al. Shikonin selectively induces apoptosis in human prostate cancer cells through the endoplasmic reticulum stress and mitochondrial apoptotic pathway. J Biomed Sci. 2015;22:26. doi:10.1186/s12929-015-0127-1
18. Tang JC, Ren YG, Zhao J, Long F, Chen JY, Jiang Z. Shikonin enhances sensitization of gefitinib against wild-type EGFR non-small cell lung cancer via inhibition PKM2/stat3/cyclinD1 signal pathway. Life Sci. 2018;204:71–77. doi:10.1016/j.lfs.2018.05.012
19. Li S, Zhang T, Xu W, et al. Sarcoma-targeting peptide-decorated Polypeptide nanogel intracellularly delivers shikonin for upregulated osteosarcoma necroptosis and diminished pulmonary metastasis. Theranostics. 2018;8:1361–1375. doi:10.7150/thno.18299
20. Wen X, Li J, Cai D, et al. Anticancer efficacy of targeted shikonin liposomes modified with RGD in breast cancer cells. Molecules. 2018;23:268. doi:10.3390/molecules23020268
21. Zhou Z, Lu B, Wang C, et al. RIP1 and RIP3 contribute to shikonin-induced DNA double-strand breaks in glioma cells via increase of intracellular reactive oxygen species. Cancer Lett. 2017;390:77–90. doi:10.1016/j.canlet.2017.01.004
22. Zhao Q, Kretschmer N, Bauer R, Efferth T. Shikonin and its derivatives inhibit the epidermal growth factor receptor signaling and synergistically kill glioblastoma cells in combination with erlotinib. Int J Cancer. 2015;137:1446–1456. doi:10.1002/ijc.29483
23. Chen J, Xie J, Jiang Z, Wang B, Wang Y, Hu Y. Shikonin and its analogs inhibit cancer cell glycolysis by targeting tumor pyruvate kinase-M2. Oncogene. 2011;30:4297–4306. doi:10.1038/onc.2011.137
24. Liu Y, Kang X, Niu G, et al. Shikonin induces apoptosis and prosurvival autophagy in human melanoma A375 cells via ROS-mediated ER stress and p38 pathways. Artif Cells Nanomed Biotechnol. 2019;47:626–635. doi:10.1080/21691401.2019.1575229
25. Jang SY, Jang EH, Jeong SY, Kim JH. Shikonin inhibits the growth of human prostate cancer cells via modulation of the androgen receptor. Int J Oncol. 2014;44:1455–1460. doi:10.3892/ijo.2014.2306
26. Li B, Yuan Z, Jiang J, Rao Y. Anti-tumor activity of shikonin against afatinib resistant non-small cell lung cancer via negative regulation of PI3K/Akt signaling pathway. Biosci Rep. 2018;38. doi:10.1042/BSR20181693
27. Chen Y, Wang T, Du J, et al. The critical role of PTEN/PI3K/AKT signaling pathway in shikonin-induced apoptosis and proliferation inhibition of chronic myeloid leukemia. Cell Physiol Biochem. 2018;47:981–993. doi:10.1159/000490142
28. Ni F, Huang X, Chen Z, Qiang W, Tong X. Shikonin exerts antitumor activity in Burkitt’s lymphoma by inhibiting C-MYC and PI3K/AKT/mTOR pathway and acts synergistically with doxorubicin. Sci Rep. 2018;8:3317. doi:10.1038/s41598-018-21570-z
29. Zheng B, Liu F, Zeng L, et al. Overexpression of pyruvate kinase type M2 (PKM2) promotes ovarian cancer cell growth and survival via regulation of cell cycle progression related with upregulated CCND1 and downregulated CDKN1A expression. Med Sci Monit. 2018;24:3103–3112. doi:10.12659/MSM.907490
30. You L, Zhu H, Wang C, et al. Scutellarin inhibits Hela cell growth and glycolysis by inhibiting the activity of pyruvate kinase M2. Bioorg Med Chem Lett. 2017;27:5404–5408. doi:10.1016/j.bmcl.2017.11.011
31. Sun H, Zhu A, Zhang L, Zhang J, Zhong Z, Wang F. Knockdown of PKM2 suppresses tumor growth and invasion in lung adenocarcinoma. Int J Mol Sci. 2015;16:24574–24587. doi:10.3390/ijms161024574
32. Yan XL, Zhang XB, Ao R, Guan L. Effects of shRNA-mediated silencing of PKM2 gene on aerobic glycolysis, cell migration, cell invasion, and apoptosis in colorectal cancer cells. J Cell Biochem. 2017;118:4792–4803. doi:10.1002/jcb.26148
33. Ao R, Guan L, Wang Y, Wang JN. Effects of PKM2 gene silencing on the proliferation and apoptosis of colorectal cancer LS-147T and SW620 cells. Cell Physiol Biochem. 2017;42:1769–1778. doi:10.1159/000479456
34. Zhao H, Han L, Jian Y, et al. Resveratrol induces apoptosis in human melanoma cell through negatively regulating Erk/PKM2/Bcl-2 axis. Onco Targets Ther. 2018;11:8995–9006. doi:10.2147/OTT
35. Yao A, Xiang Y, Si Y, et al. PKM2 promotes glucose metabolism through a let-7a-5p/Stat3/hnRNP-A1 regulatory feedback loop in breast cancer cells. J Cell Biochem. 2019;120:6542–6554. doi:10.1002/jcb.27947
36. Chen J, Yu Y, Chen X, et al. MiR-139-5p is associated with poor prognosis and regulates glycolysis by repressing PKM2 in gallbladder carcinoma. Cell Prolif. 2018;51:e12510. doi:10.1111/cpr.2018.51.issue-6
37. Zhao X, Zhu Y, Hu J, et al. Shikonin inhibits tumor growth in mice by suppressing pyruvate kinase M2-mediated aerobic glycolysis. Sci Rep. 2018;8:14517. doi:10.1038/s41598-018-31615-y
38. Personeni N, Pressiani T, Rimassa L. Lenvatinib for the treatment of unresectable hepatocellular carcinoma: evidence to date. J Hepatocell Carcinoma. 2019;6:31–39. doi:10.2147/JHC.S168953
39. Li YL, Hu X, Li QY, et al. Shikonin sensitizes wildtype EGFR NSCLC cells to erlotinib and gefitinib therapy. Mol Med Rep. 2018;18:3882–3890. doi:10.3892/mmr.2018.9347
40. Liu X, Sun G. Shikonin enhances Adriamycin antitumor effects by inhibiting efflux pumps in A549 cells. Oncol Lett. 2017;14:4270–4276. doi:10.3892/ol.2017.6702
41. Song J, Zhao Z, Fan X, et al. Shikonin potentiates the effect of arsenic trioxide against human hepatocellular carcinoma in vitro and in vivo. Oncotarget. 2016;7:70504–70515. doi:10.18632/oncotarget.12041
 © 2020 The Author(s). This work is published and licensed by Dove Medical Press Limited. The full terms of this license are available at https://www.dovepress.com/terms.php and incorporate the Creative Commons Attribution - Non Commercial (unported, v3.0) License.
By accessing the work you hereby accept the Terms. Non-commercial uses of the work are permitted without any further permission from Dove Medical Press Limited, provided the work is properly attributed. For permission for commercial use of this work, please see paragraphs 4.2 and 5 of our Terms.
© 2020 The Author(s). This work is published and licensed by Dove Medical Press Limited. The full terms of this license are available at https://www.dovepress.com/terms.php and incorporate the Creative Commons Attribution - Non Commercial (unported, v3.0) License.
By accessing the work you hereby accept the Terms. Non-commercial uses of the work are permitted without any further permission from Dove Medical Press Limited, provided the work is properly attributed. For permission for commercial use of this work, please see paragraphs 4.2 and 5 of our Terms.