")
Back to Journals » International Journal of General Medicine » Volume 15
Exosome-Derived miRNAs as Potential Biomarkers for Prostate Bone Metastasis
Authors Lu Z, Hou J, Li X, Zhou J, Luo B, Liang S , Lo RK, Wong TM, Kuang GM
Received 10 February 2022
Accepted for publication 16 May 2022
Published 1 June 2022 Volume 2022:15 Pages 5369—5383
DOI https://doi.org/10.2147/IJGM.S361981
Checked for plagiarism Yes
Review by Single anonymous peer review
Peer reviewer comments 2
Editor who approved publication: Dr Scott Fraser
Zhenquan Lu,1,* Jian Hou,1,* Xiao Li,2 Jun Zhou,2 Bingfeng Luo,1 Songwu Liang,1 Richard K Lo,1 Tak Man Wong,2 Guan-Ming Kuang2
1Department of Urology, The University of Hong Kong-Shenzhen Hospital, Shenzhen, Guangdong Province, People’s Republic of China; 2Department of Orthopaedics and Traumatology, The University of Hong Kong-Shenzhen Hospital, Shenzhen, Guangdong Province, People’s Republic of China
*These authors contributed equally to this work
Correspondence: Guan-Ming Kuang, Email [email protected]
Abstract:
Purpose: The purpose of this study was to identify the potential exosome-derived microRNAs (miRNAs) related to prostate cancer (Pca) bone metastasis.
Methods: Two datasets were collected. One dataset was from the authors’ institute, for which two groups of 10 patients each were designed: in the first one, the patients had early-stage localised Pca without bone metastasis, and in the other, the patients presented with Pca with bone metastasis. Then, the miRNA expression profiles of the blood exosomes were obtained and analysed. The other dataset was a public dataset of the miRNA expression transcriptome (GSE26964), which was downloaded from Gene Expression Omnibus (GEO). The results of both datasets were jointly analysed and the most bone-metastatic-related differentially expressed miRNAs (diff-miRNAs) were identified and further validated. Finally, a series of bioinformatics analyses were performed and the relationship between target genes of the diff-miRNAs and the pathogenesis and progression of bone metastasis of Pca were studied.
Results: From the authors’ dataset, in all, 313 diff-miRNAs were identified, of which 205 were up-regulated while 108 were down-regulated. From the GSE26964 dataset, 107 diff-miRNAs were found, of which 44 were up-regulated and 63 were down-regulated. Taking the intersection of the results of both datasets, four diff-miRNAs were identified: hsa-miR-125a-3p, hsa-miR-330-3p, hsa-miR-339-5p and hsa-miR-613. In all, 94 target genes of the four diff-miRNAs were predicted. After considering the intersection of the results from the GSE32269 dataset, we obtained 25 target genes. Although either positive or negative correlations were found among the diff-miRNAs with some of the target genes, there is a lack of evidence on how such correlations regulate the development and promotion of Pca bone metastasis.
Conclusion: Hsa-miR-125a-3p, hsa-miR-330-3p, hsa-miR-339-5p and hsa-miR-613 are potential biomarkers for Pca bone metastasis.
Keywords: prostate cancer, bone metastasis, exosomes, bioinformatics analysis, miRNAs
Introduction
Prostate cancer (Pca) is considered the most common malignant tumour in the male urological system.1 Approximately 90% of late-stage Pca patients present with bone metastasis. Pca patients with bone metastasis may have severe pain in the back and/or the extremities, leading to significant disabilities in daily activities (eg, difficulties in standing, walking and changing postures) and, consequently, patients are mainly wheelchair or bed bound. Furthermore, associated complications, such as urinary tract infection, pulmonary infection and deep vein thrombosis, may occur. As a result, the quality of life is significantly decreased, and the mortality rate is increased. However, we currently have a limited understanding of the underlying mechanism of Pca developing bone metastasis. Thus, we are unable to establish better strategies to prevent Pca from bone metastasis and to improve the life expectancy of late-stage Pca patients.
Recently, studies have shown that tumour cells release exosomes,2–5 which are small membrane vesicles (30–150 nm) that contain complex RNAs and proteins.6 Furthermore, miRNAs are non-coding small RNA molecules that bind to the 3’-untranslated region of the target mRNAs to regulate and alter the expression of the target genes. These miRNAs are transferred between cells via exosomes, which act as a communication tool between cells and thus modify the microenvironment in which tumour cells metastasise.7,8 Li et al9 found that miR-375 was overexpressed in exosomes derived from metastatic PCa cells. Duan et al10 found that PC-3-derived exosomes inhibited NF-κB signalling pathway activity by down-regulating the miR-214 expression, thereby inhibiting osteoclast differentiation and thus achieving the attenuation of PCa bone metastasis. Therefore, bone metastasis in PCa can be considered to be related to the interaction between tumour cells and the skeletal microenvironment, in which the miRNAs in the exosomes may play an important regulatory role as signalling molecules.11–13
Materials and Methods
Data Collection
The aim of this study was to identify the potential biomarkers related to the development and progression of Pca bone metastasis. The design of this study is shown in Figure 1. Two datasets were collected in this study. One dataset was from the authors’ institute, for which 20 Pca patients were recruited, and their blood samples were collected. Then, the miRNA expression profiles of the blood exosomes were obtained and analysed. The other dataset was a public dataset of the miRNA expression transcriptome (GSE26964), which was downloaded from Gene Expression Omnibus (GEO). The results of both datasets were jointly analysed, and the most bone-metastatic-related differentially expressed miRNAs (diff-miRNAs) were identified. The results were further validated by a real-time quantitative PCR (qRT-PCR) test. Finally, a series of bioinformatics analyses were performed, and the relationship between the target genes of the diff-miRNAs and the pathogenesis and progression of Pca bone metastasis were studied.
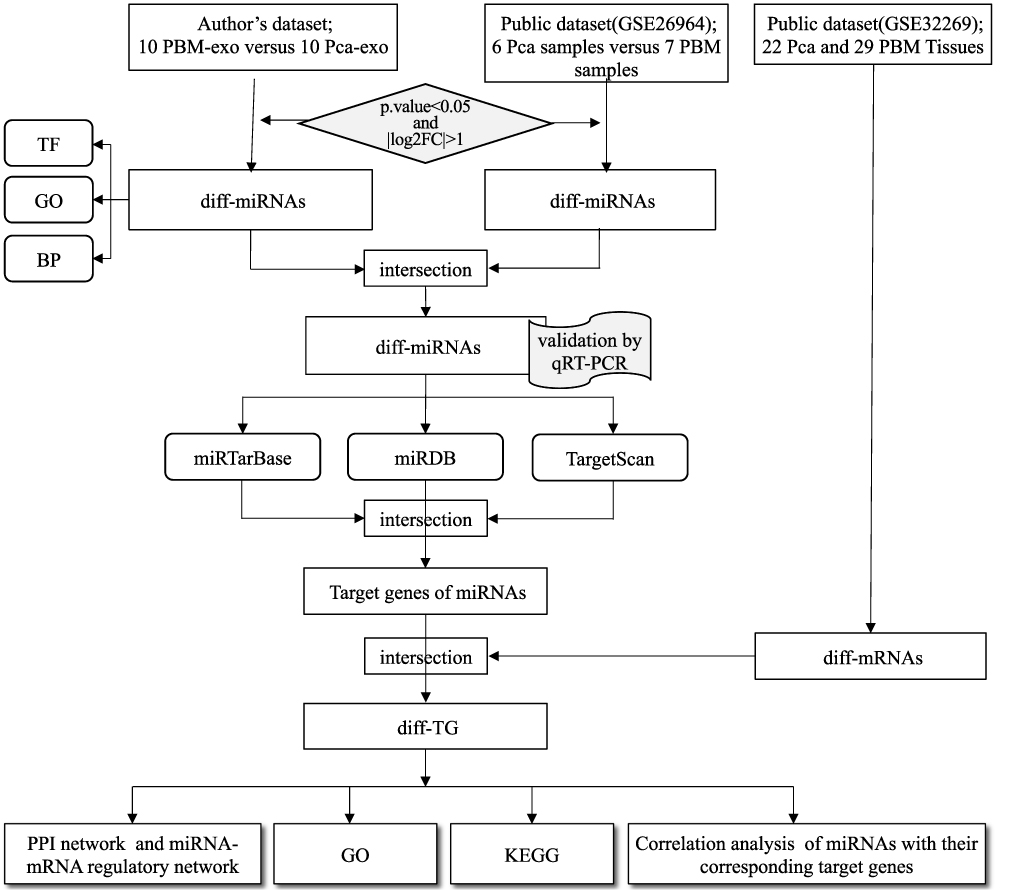 |
Figure 1 The flowchart of the study design. |
Authors’ Dataset Collection
In all, 20 Pca patients were recruited from the authors’ institute between May 2020 and January 2021 (Figure 1) (Table 1 supplementary material). The diagnosis of Pca was confirmed by prostate needle biopsy. Bone metastasis was assessed using a bone scan or a PET-CT scan. Two groups of 10 patients each were designed: in the first one, the patients had early-stage localised Pca without bone metastasis (Pca-exo group), and in the other, the patients presented with Pca with bone metastasis (PBM-exo group) (Table 1 supplementary material). This study was approved by the Ethics Committee of the authors’ institute [No. 2019(226)]. Next, 10 mL of peripheral venous blood was collected from each patient at the time of hospital admission. Informed consent was obtained before the collection of the blood sample. Anti-tumour therapy was not performed before the blood sample was taken. The samples were stored and processed in a standard manner, according to the literature.14 The exosomes of the blood samples were isolated, extracted and purified using the ExoQuick kit (System Biosciences).14 The morphology of the exosomes was then observed using transmission electron microscopy (TEM; JEM-200CX, Japan). The diameter distribution of particles in the exosome samples was measured by a nanoparticle tracking analysis using the NanoSight NS300 system (Malvern Panalytical, Malvern, UK). Identification of CD63 and TSG101 was performed by Western blot analysis. The total RNA of the exosomes was extracted using the miRNeasy Mini Kit (Qiagen, Hilden, Germany). A small RNA library was built according to the QIAseqTM miRNA Library Kit. The sequencing of the miRNA library was done using the Illumina HiSeq 2500 sequencing detector (Illumina, USA).
Public Dataset Collection
A search with the keywords “prostate cancer, bone metastasis and miRNA” was carried out in the GEO database (http://www.ncbi.nlm.nih.gov/geo/)(Figure 1). As a result, a miRNA expression transcriptome dataset, GSE26964, was found, which contained the miRNA expression profile data of six localised Pca without bone metastasis (Pca-exo) samples and seven Pca with bone metastasis (PBM-exo) samples. The miRNA expression data were then analysed using the Capitalbio Mammalian MicroRNA V3.0 (GPL8469) platform.15
Furthermore, another public dataset, GSE32269, containing 22 Pca tissue samples and 29 PBM tissue samples was downloaded from the GEO database (Figure 1). The mRNA expression profile data were analysed using the Affymetrix Human Genome U133A Array (GPL96) platform.
Analysis of Differentially Expressed miRNAs
The R package “Limma” was used to analyse the differentially expressed miRNAs (diff-miRNAs) between the Pca-exo and the PBM-exo groups in both the authors’ dataset and the public dataset (p-value < 0.05 and |log2FC| > 1)16 (Figure 1). The results of the diff-miRNAs from both datasets were combined and jointly analysed. Then, the intersection of the results of both datasets was taken, and the most bone-metastasis-related diff-miRNAs were identified (Figure 1). Furthermore, the expression levels of the diff-miRNAs were plotted using GraphPad software and statistically analysed using a t-test. A p-value of <0.01 indicated statistical significance.
Furthermore, for the results of the diff-miRNAs in the authors’ dataset, an online open-access tool FunRich (http://www.funrich.org/forum)17,18 was used to analyse the independent feature enrichment of the diff-miRNAs; the transcription factor (TF) enrichment analysis, GO enrichment analysis, and the biological pathways (Kyoto Encyclopedia of Genes and Genomes, KEGG) analysis were also performed.
Validation of the Diff-miRNAs
The identified diff-miRNAs were further validated by a real-time-quantitative PCR (RT-qPCR) test using the following human cell lines: prostate cancer bone metastasis cell line C4-2B, localised prostate cancer cell line 22RV1 and normal prostate epithelial cell line RWPE-1. The cell lines were obtained from the Shanghai Institute of Cell Science, Chinese Academy of Sciences. The RT-qPCR was performed according to the following procedures. In brief, TRIzol (Invitrogen; Thermo Fisher Scientific, Inc., Carlsbad, CA, USA) was adopted to extract the total RNA from the cells. The miRNA primers and the real-time fluorescent quantitative PCR testing kit were purchased from FulenGen Co., Ltd. (Guangzhou, China). U6 was used as an endogenous control. The relative quantification of the miRNA levels was determined using the ΔΔ C t method. Our first cDNA was synthesised using EntiLink™ 1st Strand cDNA Synthesis Kit (ELK Biotechnology, EQ003), and the real-time fluorescent quantitative PCR was completed on the StepOne™ Real-Time PCR instrument from Life Technologies; three double holes were made in each sample by using the EnTurbo™ SYBR Green PCR SuperMix kit (ELK Biotechnology, EQ001). The specific primer sequence list is shown in (Table 2 Supplementary material).
Target Genes Prediction and miRNA-mRNA Regulator Network Construction
Next, miRTarBase, TargetScan and miRDB were used to predict the target genes of diff-miRNAs (Figure 1). The intersection acquired from the abovementioned three databases was obtained, and the target genes within the intersection were identified. The R package “VennDiagram” was used to construct and visualise the target genes that have a relationship with the diff-miRNAs (Figure 1).
Thereafter, the identified target genes of diff-miRNAs were further filtered using the results of the diff-mRNAs of the GSE32269 dataset. As a result, the intersection of both datasets was obtained, and the target genes within the intersection were selected as the differentially expressed target genes (diff-TG) for further bioinformatics analysis (Figure 1, bottom row).
A gene interaction search tool (STRING) and Cytoscape software were used to detect the interactions between the diff-TGs, and the PPI networks and miRNA-mRNA regulatory networks were constructed accordingly. On the basis of the degree values, the central genes were calculated using the cytoHubba plugin. All parameters of the plug-in were kept as default values.
GO/KEGG Enrichment Analysis
A gene ontology (Go) analysis was performed using the online tool Metascape (http://metascape.org)19 to investigate the biological processes, cellular components and specific molecular functions of the identified target genes of the diff-miRNAs. Furthermore, an enrichment analysis was performed for the KEGG pathway, with a p-value of <0.05 as the threshold.
Correlation Analysis
The StarBase online database was used to perform the correlation analysis.20 Correlation scatter plots were drawn; r > 0 indicated a positive correlation between miRNA and mRNA, r < 0 indicated a negative correlation between miRNA and mRNA, and p < 0.05 indicated a statistically significant correlation between miRNA and mRNA.
Statistical Analysis
Differences among variables were verified using a t-test and a chi-square test. The statistical analysis was performed using R software (4.0.0). Heat maps were drawn using the software package HeatMap. SPSS version 20.0 and GraphPad Prism version 8.0 were used to analyse the data, and p < 0.05 indicated statistical significance.
Result
Exosomes Extraction and Characterization
All blood samples were collected smoothly and safely. The exosomes were successfully extracted, as shown in Figure 2. Exosome-specific proteins TSG101 and CD63 were highly expressed (Figure 2A) in the extracted extracellular vesicles, with an average diameter of 105.70 ± 43.82 nm (ranging from 30 to 150 nm) (Figure 2B), which was the expected range of exosomes. Moreover, the TEM analysis revealed that the vesicles had a cup-like morphology, which was characteristic of exosomes (Figure 2C).
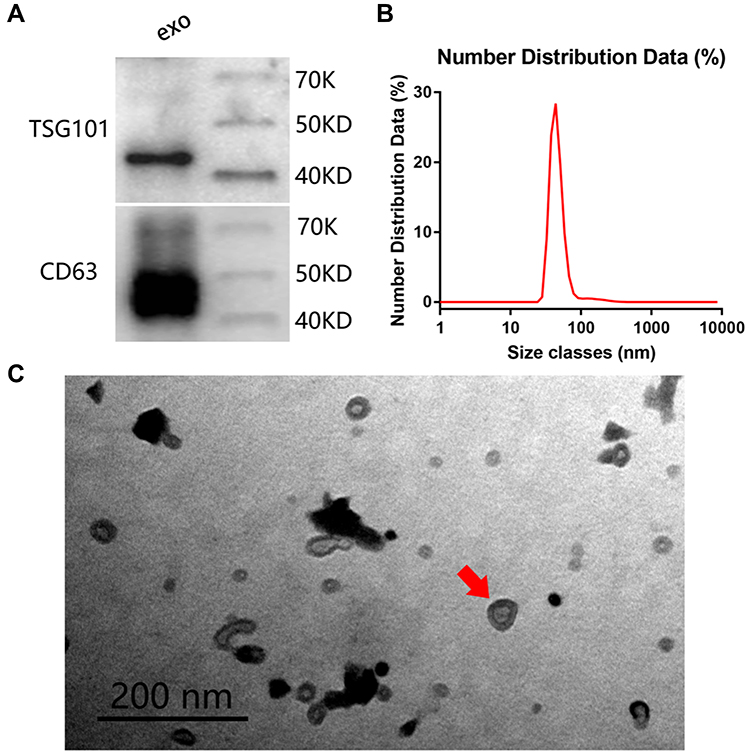 |
Figure 2 Exosomes identification: (A) Western blot to detect the expression of exosomal specific proteins TSG101 and CD63, exo: exosome, the grouping of gels/blots are cropped from different gels. (B) Nanosight detects the diameter distribution of exosomes. (C) The size and morphology of exosomes displayed under a transmission electron microscope, red arrow: a cup-like morphology, which is characteristic of exosomes. |
Diff-miRNAs Identification of Both Datasets
From the authors’ dataset, we obtained 313 diff-miRNAs, of which 205 were up-regulated while 107 were down-regulated (Figure 3A and B, supplementary material Table 3). From the public GSE26964 dataset, we extracted 107 diff-miRNAs, of which 44 were up-regulated and 63 were down-regulated (Figure 3C and D, supplementary material Table 4).
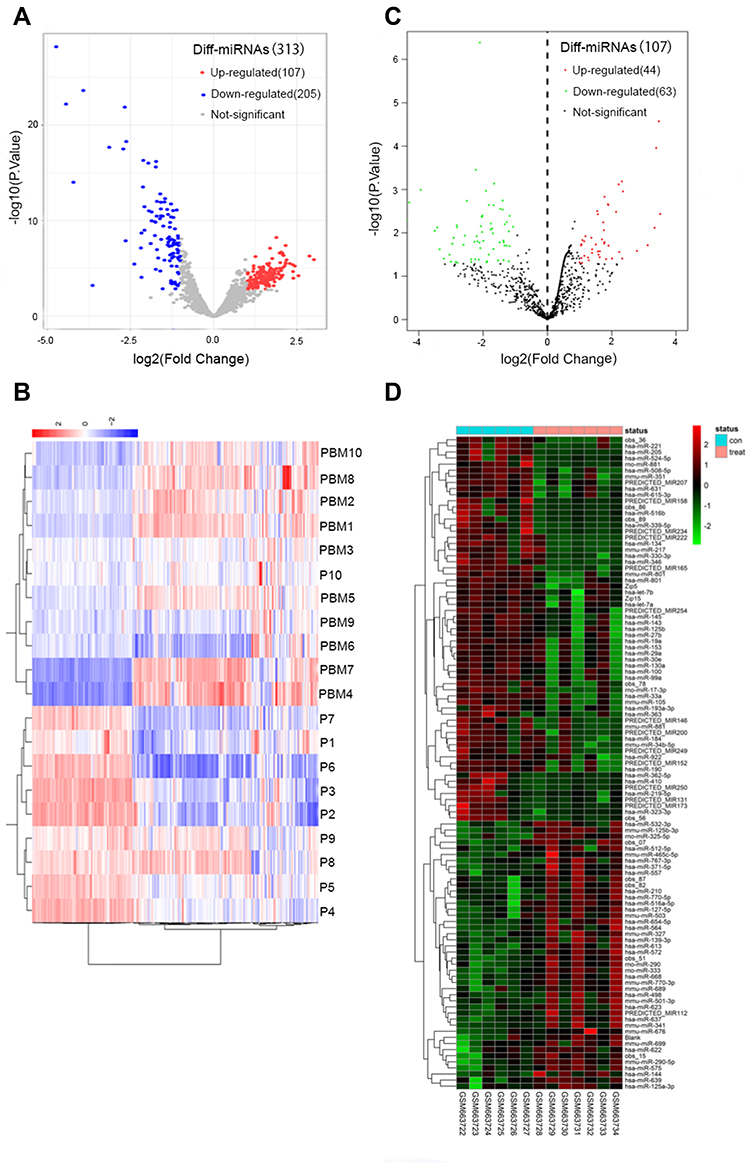 |
Figure 3 Diff-miRNA extraction: (A) GSE26964 diff-miRNAs volcano map, (B) PBM-exo diff-miRNAs volcano map, (C) GSE26964 diff-miRNAs heat map, (D) PBM-exo diff-miRNAs heat map. |
Enrichment Analysis of Diff-miRNAs of the Authors’ Dataset
Figure 4 shows the results of the enrichment analysis of the diff-miRNAs from the authors’ dataset. The transcription factors were mainly concentrated in EGR1, SP1, SP4, POU2F1, MEF2A, ZFP161, NFIC, RREB1, NKX6-1 and FOXA1 (Figure 4A), and SP1 had the highest percentage, while EGR1 was the most statistically significant. In BP (Figure 4B), they were mainly enriched in the regulation of nucleobase, nucleoside, nucleotide and nucleic acid metabolism; signal transduction; cell communication and transport. The results of CC (Figure 4C) revealed that diff-miRNAs were mainly enriched in the nucleus, cytoplasm, Golgi apparatus, lysosomes, early endosomes, actin cytoskeleton, endosomes, clathrin-coated vesicles and plasma membrane. In MF (Figure 4D), they were mainly enriched in transcription factor activity, protein serine/threonine kinase activity, GTPase activity, ubiquitin-specific protease activity, transcription regulator activity, receptor signalling complex scaffold activity and guanyl-nucleotide exchange factor activity. The results of KEGG (Figure 4E) revealed that diff-miRNAs were mainly enriched in beta1 integrin cell surface interactions, TRAIL signalling pathway, glypican pathway, proteoglycan syndecan-mediated signalling events, ErbB receptor signalling network and sphingosine 1-phosphate (S1P) pathway, integrin family cell surface interactions, alpha9 beta1 integrin signalling events, plasma membrane estrogen receptor signalling events and PDGF receptor signalling network.
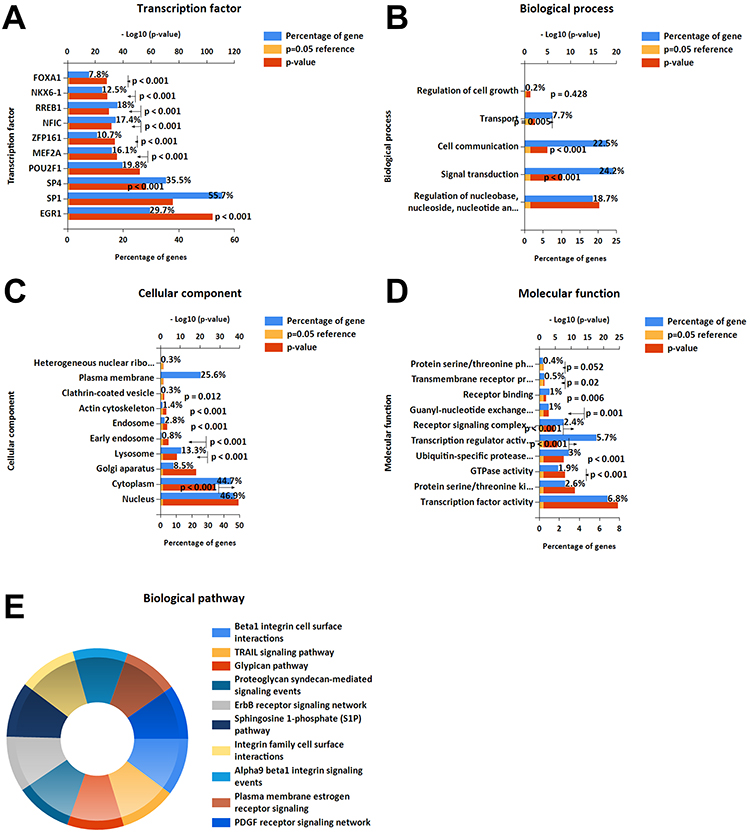 |
Figure 4 Enrichment analysis of the diff-miRNAs from the authors’ dataset: (A) transcription factor analysis, (B–D) GO analysis, (E) biological pathway analysis. |
Combinedly Analysis of Both Datasets
We combined the diff-miRNAs from both datasets and took the intersection; as a result, we obtained four diff-miRNAs for further studies (hsa-miR-125a-3p, hsa-miR-330-3p, hsa-miR-339-5p and hsa-miR-613, Figure 5A, supplementary material Tables 3 and 4).
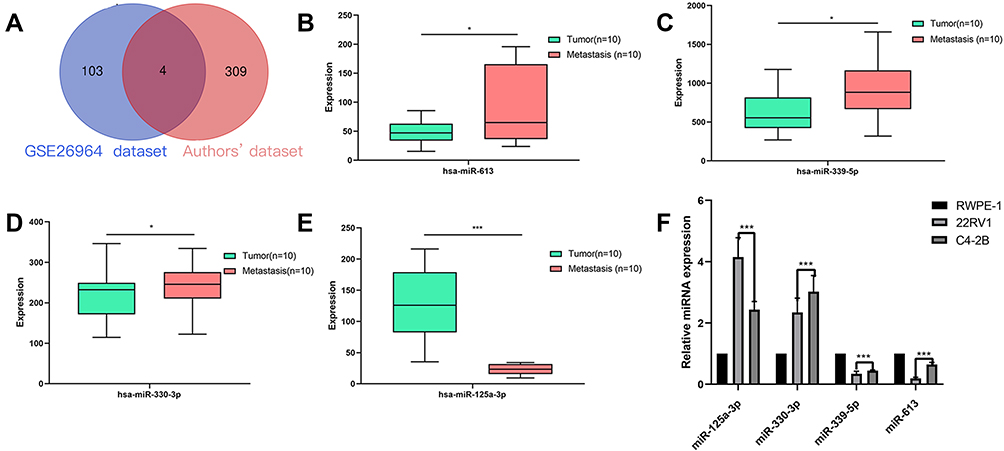 |
Figure 5 (A) Venn diagram shows the result of the intersection of diff-miRNAs between GSE26964 dataset and the authors’ dataset. (B–E) The expression of diff-miRNAs in PBM-exo. (F) The results of qRT-PCR show the effect of hsa-miR-125a-3p, hsa-miR-330-3p, hsa-miR-339-5p and hsa-miR-613 in the three cell lines of REPE-1, 22RV1, and C4-2B. Express the situation. *Means p<0.05, ***Means p<0.0001. |
Figures 5B–E show the expression of these four diff-miRNAs. The expression of hsa-miR-330-3p, hsa-miR-339-5p and hsa-miR-613 was increased in PBM-exo as compared to that in the Pca-exo group (Figures 5B–D). However, the expression of hsa-miR-125a-3p was significantly reduced in the PBM-exo group as compared to that in the Pca-exo group (Figures 5E).
Validation of the Identified Diff-miRNAs
Figure 5F shows the qRT-PCR results. The expression of miR-125a-3p was significantly decreased in the C4-2B (PBM) cell line as compared to that in the 22RV1 (localised Pca) cell line, while that of hsa-miR-330-3p, hsa-miR-339-5p and hsa-miR-613 was significantly increased in the C4-2B group as compared to that in the 22RV1 cell line. The above results validated the findings of the diff-miRNA expression test (Figures 5B–E), and thus, the relationship between the diff-miRNAs and the regulation of the Pca bone metastasis mechanism was observed. (The specific primer sequences are listed in supplementary material Table 2.)
Prediction of Diff-miRNAs Target Genes and miRNA-mRNA Regular Network Construction
Figure 6A shows the results of the target gene prediction. In all, 94 target genes were predicted in the intersections of the three databases: 20 genes from hsa-miR-330-3p, 7 genes from hsa-miR-339-5p, 32 genes from hsa-miR-613 and 35 genes from hsa-miR-125a-3p (Figure 6A). The gene regulatory network was constructed successfully by putting the above-mentioned 94 target genes of diff-miRNAs into the STRING database (Figure 6B). Furthermore, Cytoscape’s cytoHubba plug-in was used to optimise the visualisation of the network diagram, and the HUB genes were calculated using the degree algorithm accordingly. As a result, the top 15 target genes—KRAS, RHOA, BDNF, HNRNPA1, BRCA1, FYN, BCL2L11, NRG1, SETX, FXR1, BACE1, CDC37, TIMP3, PDCD4 and SGK1—were identified as the HUB genes that might play more important roles in Pca bone metastasis (Figure 6C, supplementary material Table 5).
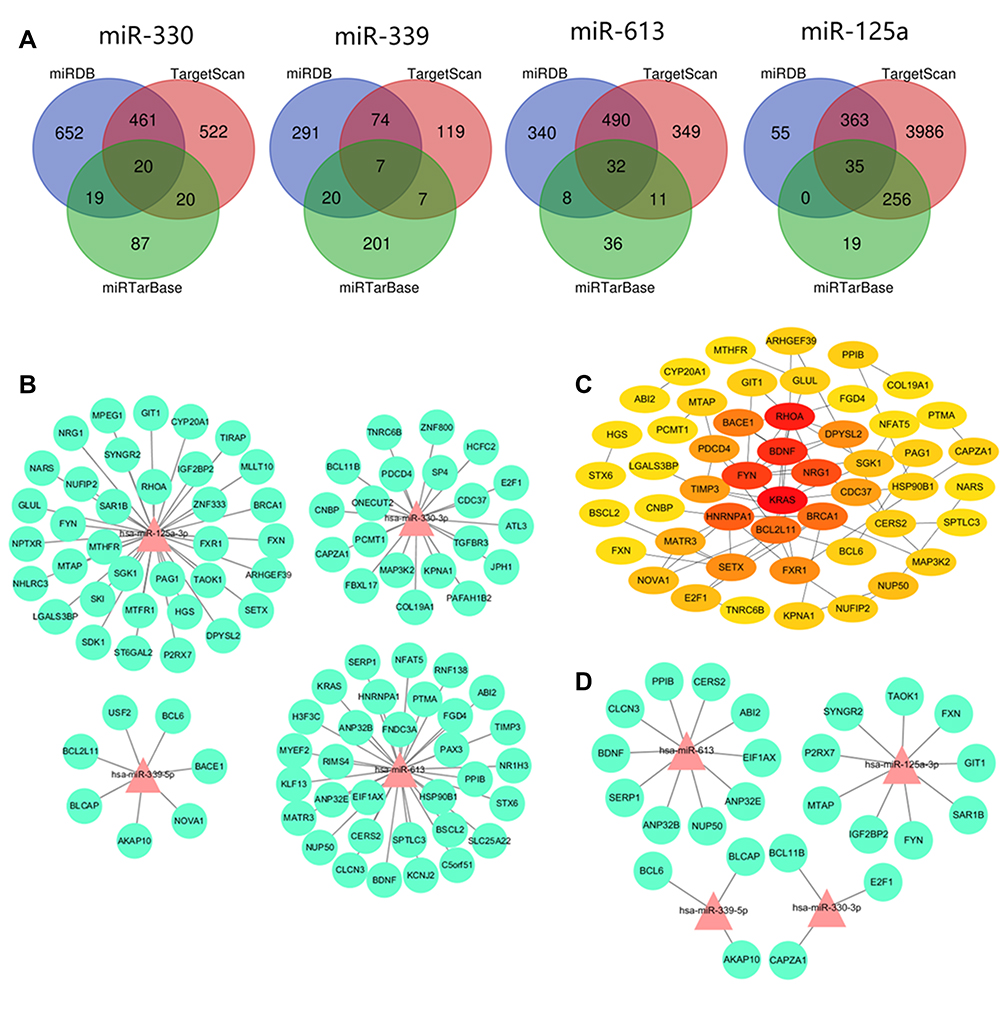 |
Figure 6 (A) The results of the target genes prediction. (B) The regulatory network diagram of miRNA-mRNA shows the regulatory relationship between hsa-miR-125a-3p, hsa-miR-330-3p, hsa-miR-339-5p and hsa-miR-613 and its target genes. (C) Interaction network diagram of the top 30 genes calculated based on the degree value by CytoHubba of Cytoscape. The color of the module reflects the comprehensive score of the gene (light yellow→red=low score→high score). (D) Shows the regulatory network diagram between hsa-miR-125a-3p, hsa-miR-330-3p, hsa-miR-339-5p and hsa-miR-613 and the diff-TGs after taken the intersection of the results of GSE32269 dataset. |
In contrast, from the GSE32269 dataset, we identified 3351 differentially expressed genes. We took the intersection of the abovementioned 94 genes and 3351 genes; as a result, we identified 25 differentially expressive target genes (diff-TGs). Furthermore, we put these 25 diff-TGs into the STRING database and successfully constructed the gene regulatory network, as shown in Figure 6D.
GO/KEGG Analysis of the Target Genes
A GO/KEGG analysis was performed on the 25 diff-TGs using the online tool metascape; the results are shown in Figure 7. We observed that these diff-TGs were mainly enriched in pathways such as the regulation of the cellular response to stress, signalling by ERBB2, signalling by receptor tyrosine kinases, heterocyclic catabolic process and the PI3 K-Akt signalling pathway (Figures 7A-D).
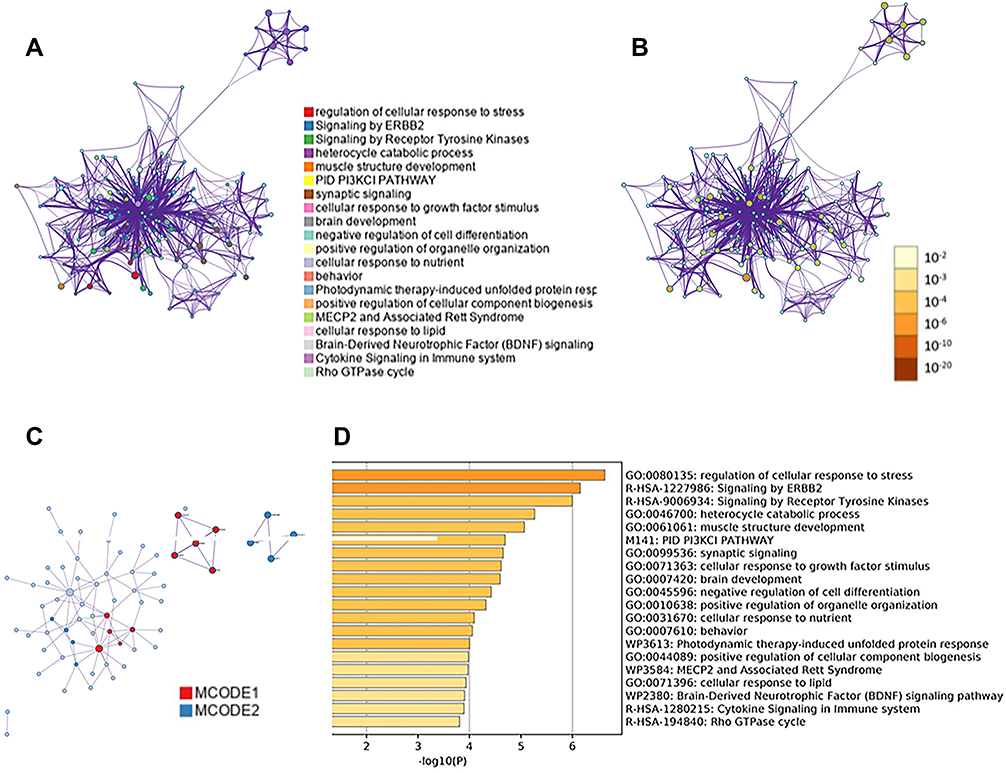 |
Figure 7 Target gene enrichment analysis of miRNAs. (A and B) The network diagram is a target gene enrichment network diagram based on Metascape, where (A) is colored based on the enrichment term, (B) is colored based on the P value; (C) shows the protein-protein (PPI) network of all target genes interaction map; (D) heat map shows the functional enrichment of the target gene. The smaller the P value, the darker the color. |
Correlation Analysis Between miRNAs and Predicted Target Genes
The online database starBase was used to conduct a correlation analysis of the 25 diff-TGs and diff-miRNAs. It revealed that hsa-miR-330-3p (Figure 8 1st row) and hsa-miR-125a-3p (Figure 8, 2nd and 3rd rows) were positively correlated with BCL11B and CAPZA1 but negatively correlated with E2F1. Furthermore, hsa-miR-125a-3p was negatively correlated with FXN, G1T1, SAR1B and SYNGR, while positively correlated with FYN, IGF2BP2, MTAP, P2RX7 and TAOK1. In contrast, hsa-miR-339-5p (Figure 8 4th row) was positively correlated with BCL6 and BLCAP but negatively correlated with AKAP10. These differences were statistically significant (p < 0.05). However, for the hsa-miR-613, we were unable to find any positive nor negative correlations between this miRNA and the predicted target genes in this study.
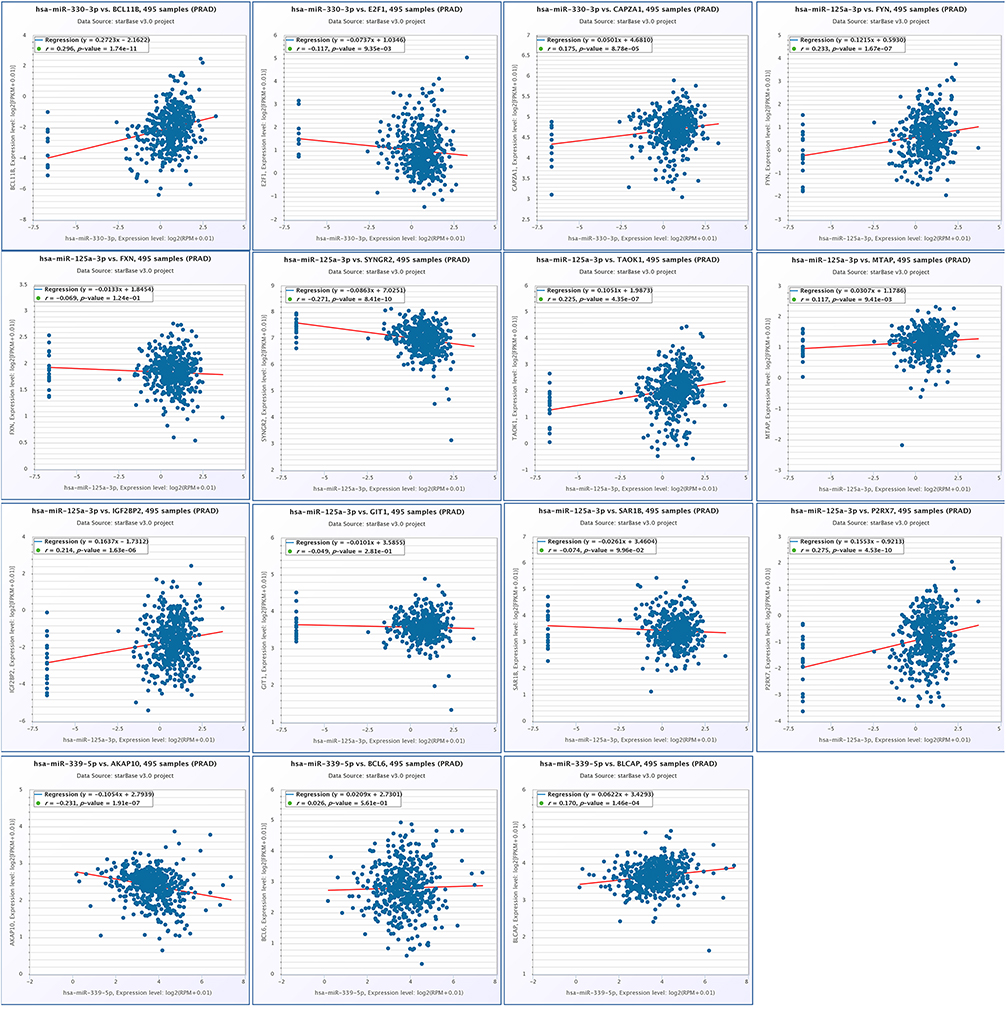 |
Figure 8 Correlation scatter diagram of genes after the intersection of hsa-miR-125a-3p, hsa-miR-330-3p, hsa-miR-339-5p, hsa-miR-613 and differential mRNA-target genes, r >0 indicates that there is a positive correlation between miRNA and mRNA, r<0 indicates that there is a negative correlation between miRNA and mRNA, and p<0.05 indicates that the correlation between miRNA and mRNA is statistically significant. |
Discussion
The purpose of this study was to identify plasma exosome-derived miRNAs that may be potential biomarkers for Pca bone metastasis. From the authors’ dataset, in all, 313 diff-miRNAs were identified, of which 205 were up-regulated while 108 were down-regulated. From the public GSE26964 dataset, 107 diff-miRNAs were found, of which 44 were up-regulated and 63 were down-regulated. Taking the intersection of the results of both datasets, we found four exosome-derived miRNAs: hsa-miR-125a-3p, hsa-miR-330-3p, hsa-miR-339-5p and hsa-miR-613. The results were further validated by qRT-PCR in three cell lines. We observed that hsa-miR-125a-3p was down-regulated, while hsa-miR-330-3p, hsa-miR-339-5p and hsa-miR-613 were up-regulated in the bone metastasis group as compared to those in the localised Pca group in current study.
Our findings of hsa-miR-125a-3p were consistent with the results of previous studies. It has been demonstrated that miR-125a-3p may regulate the migration of prostate cancer cells and that an overexpression of miR-125a-3p reduces the migration of prostate cancer PC3 cells and increases apoptosis.21 Moreover, miR-125a-3p targets the expression of GIT1 to inhibit the proliferation and differentiation of osteoblasts. Another study confirmed that miRNA-125a inhibits cell migration and invasion and regulates the expression of hyaluronic acid synthase 1 by targeting the signal transducers and activators of transcription 3 in renal cancer cells.22
In contrast, it has been reported that miR-330-3p, a core biomarker, is related to the development and progression of various tumours as a promoter23–26 or a suppressor.27,28 With the down-regulation of the expression of miR‑330‑3p, the development of osteosarcoma, which is one of the commonly seen bone malignant tumours, can be suppressed.28 A study by Li et al showed that the expression of miR-330-3p was inhibited by circ-0016068, thus promoting the overexpression of BMI-1 to enhance the proliferation, migration and invasion of Pca cells, as well as the metastasis of xenograft tumours.29 It was also shown that miR-330-3p was expressed at significantly lower levels in prostate cancer tissues compared with paired non-tumor tissue.29 However, our study demonstrated that miR-330-3p was up-regulated in the blood exosomes in PBM group in both of the authors’ dataset and the public GSE26964 dataset. It was also shown that miR-330-3p was expressed at significantly higher level in both of the prostate cancer bone metastasis cell line C4-2B and localised prostate cancer cell line 22RV1 as compared with the normal prostate epithelial cell line RWPE-1 in this study. Such findings are interesting and further studies are needed to clarify the underlying reasons why miR330-3p shows different expression results in different samples (tissue, exosomes and cell lines).
Moreover, the dysregulation of miR-339-5p is involved in the initiation and progression of several human cancers, including breast cancer 30 and lung cancer.31 Pan et al reported that miR-339-5p inhibits Pca cell proliferation, migration and invasion, acting as a suppressor gene. Wu et al reported that lncRNA SNHG17 up-regulates the expression of SNORA71B through the sponge adsorption of miR-339-5p, thereby promoting the progression of Pca.32 In our study, we found that miR-339-5p was up-regulated in the PBM-exo group. Such findings are in conflict with previous studies which have shown that miR-339-5p functions as a tumour suppressor rather than a promoter. Similar results for miR-613 were also demonstrated in our study: it was up-regulated in the PBM-exo group. However, Ren et al reported that miR-613 functions as a tumour suppressor and that the overexpression of miR-613 significantly suppresses Pca cell proliferation and invasion.33 Thus, the above results are not in agreement with our findings, and more studies are needed to further elucidate the role of miR-613 in Pca bone metastasis.
In the TF enrichment analysis of the identified 313 diff-miRNAs, EGR1 and SP1 were the two most prominent factors of the top 10 enriched transcription factors (Figure 4A). These results are consistent with the findings of previous studies. The abnormal expression of EGR1 had a direct effect on Pca bone metastasis by regulating the angiogenesis and osteoclast factors in Pca and, consequently, promoted metastasis.34 Another study demonstrated that the SP1/SAMD3 complex regulates miR-324-5p by inducing the overexpression of lncRNA PCAT7 to activate TGF-β signal transduction to form an active loop to promote Pca bone metastasis.35 Furthermore, the results of MF, in which the functions of the transcription factor activity and the transcription regulatory activity take the two highest percentages (Figure 4D), indicated that diff-miRNAs might regulate the activities of transcription factors and thus alter the activities of various downstream protein kinases. The results of the biological pathway (Figure 4E) revealed 10 pathways in which the diff-miRNAs were enriched; however, no pathway showed a significantly higher percentage than the others.
Figure 6 shows the interactions between diff-miRNAs and diff-TGs in the PPI regulatory network diagram. From the central gene analysis and the module analysis, we obtained 15 key target genes related to diff-miRNAs through 12 algorithms in the cytoHubba plugin, including KRAS, RHOA, BDNF, HNRNPA1, BRCA1, FYN, BCL2L11, NRG1, SETX, FXR1, BACE1, CDC37, TIMP3, PDCD4 and SGK1 (Figure 6C). A further enrichment analysis of the 15 HUB genes revealed that these target genes were mainly involved in the regulation of the cell response to stress, ERBB2 signal transduction, receptor tyrosine kinase signal transduction, heterocyclic catabolic processes and PI3K-Akt signal transduction pathway (Figure 7). A number of studies have confirmed that RHOA plays an important role in mediating Pca cell metastasis across the inner membrane.36–38 It has also been demonstrated that down-regulating the expression of BDNF may promote the progression of Pca by inducing an epithelial–mesenchymal transition and non-neural resistance.39,40 Moreover, Lyu et al found that down-regulating the expression of FYN can be achieved by inducing the phosphorylation of AMPK and activating the AMPK/mTOR signalling pathway to enhance the invasion and metastasis of cholangiocarcinoma.41 Xenogeneic ribonucleoprotein A1 (hnRNPA1) is a ubiquitous RNA splicing factor. Several studies have proven that hnRNPA1 is an independent predictor of poor prognosis for Pca and is significantly associated with lymph node metastasis, advanced tumour staging, positive surgical margins and early biochemical recurrence.42 PDCD4 is a tumour suppressor inhibited by androgen. Recent studies have shown that miR-21a can regulate the growth and castration resistance of Pca by targeting the expression of PDCD4.43 Adissu et al confirmed that the absence or low expression of the tissue inhibitor of metalloproteinase 3 (TIMP3) promotes the metastasis and invasion of Pca.44 Yang et al also confirmed that miR-17 promotes the invasion and metastasis of Pca by targeting the inhibition of the TIMP3 expression.45 However, few studies have reported the relationship between KRAS, FYN, NRG1, BCL2L11, DPYSL2, SETX, FXR1 and other genes with Pca metastasis. More studies are needed in the future to clarify the role of these genes in Pca metastasis.
In this study, 25 diff-TGs were identified after considering the intersection of the results from the GSE32269 dataset (Figure 6D). Although both positive and negative correlations were found among hsa-miR-330-3p (Figure 8 1st row), hsa-miR-125a-3p (Figure 8, 2nd and 3rd rows) and hsa-miR-339-5p (Figure 8 4th row) with the some of the diff-TGs, there is a lack of evidence on how such correlations regulate the development and promotion of Pca bone metastasis. Furthermore, we could not show the correlation of a number of diff-TGs with the diff-miRNAs in this study, possibly because of the limited data in the starBase; thus, more studies are needed to fill these research gaps. Finally, although the bioinformatic analysis in this study identified 4 diff-miRNAs associated with Pca bone metastasis, however, given the limited patient samples in the study, we were unable to show the identified diff-miRNAs may alter metastasis gene signature in prostate cancer. Future studies on larger cohort samples will be required for identification of important biomarkers for bone metastasis.
Conclusion
In summary, this study identified hsa-miR-125a-3p, hsa-miR-330-3p, hsa-miR-339-5p and hsa-miR-613 as potential biomarkers for Pca bone metastasis. Although we analysed the function, mechanism and downstream target gene regulation of these miRNAs, we were still unable to discover a detailed correlation between the diff-miRNAs and the diff-TGs and the manner in which such correlations regulated the bone metastasis of Pca. Thus, further experimental studies are required to fill these research gaps.
Abbreviations
Pca, prostate cancer; PBM, the patients presented with Pca with bone metastasis; Exo, exosome; Pca-exo, the group of localised Pca without bone metastasis sample; PBM-exo, the group of Pca with bone metastasis sample; GEO, Gene Expression Omnibus; diff-miRNAs, differentially expressed miRNAs; qRT-PCR, real-time quantitative PCR; TF, transcription factor; GO, Gene Ontology; KEGG, Kyoto Encyclopedia of Genes and Genomes; diff-TG, the differentially expressed target genes; CC, cellular component; MF, molecular function; BP, biological process; HUB genes, the key genes; S1P, sphingosine 1-phosphate; KRAS, KRAS Proto-Oncogene, GTPase; RHOA, Ras Homolog Family Member A; BDNF, Brain Derived Neurotrophic Factor; HNRNPA1, Heterogeneous Nuclear Ribonucleoprotein A1; BRCA1, BRCA1 DNA Repair Associated; FYN, FYN Proto-Oncogene, Src Family Tyrosine Kinase; BCL2L11, BCL2 Like 11; NRG1, Neuregulin 1; SETX, Senataxin; FXR1, FMR1 Autosomal Homolog 1; BACE1, Beta-Secretase 1; CDC37, Cell Division Cycle 37, HSP90 Cochaperone; TIMP3, TIMP Metallopeptidase Inhibitor 3; PDCD4, Programmed Cell Death 4; SGK1, Serum/Glucocorticoid Regulated Kinase 1; ERBB2, Erb-B2 Receptor Tyrosine Kinase 2; PI3K, Phosphatidylinositol-4,5-Bisphosphate 3-Kinase Catalytic Subunit Delta; Akt, AKT Serine/Threonine Kinase 1; GIT1, GIT ArfGAP 1; BMI-1, BMI1 Proto-Oncogene, Polycomb Ring Finger; SNORA71B, Small Nucleolar RNA, H/ACA Box 71B; EGR1, Early Growth Response 1; SAMD3, Sterile Alpha Motif Domain Containing 3; TGF-β, Transforming Growth Factor Beta 1; BDNF, Brain Derived Neurotrophic Factor.
Availability of Data and Materials
The datasets generated or analysed in the current study are available in the Gene Expression Omnibus (GEO), and the dataset numbers include GSE26964 and GSE32269.The author’s dataset was obtained from the Orthopaedic Research Centre, The University of Hong Kong Shenzhen Hospital.
Ethics Approval and Consent to Participate
The study was conducted according to the guidelines of the Declaration of Helsinki and written informed consent was obtained from each participant. This study was approved by the Ethics Committee of The University of Hong Kong Shenzhen Hospital [No. 2019(226)] and registered with Chinese Clinical Trial Registry (ChiCTR,www.chictr.org.cn) on December 2019 (ChiCTR1900028399).
Acknowledgments
The authors thank Na Jin from Chi Biotech for technical support with exosomes isolation and miRNA-seq.
Funding
This study was supported by High Level-Hospital Program, Health Commission of Guangdong Province, China (HKUSZH201901012), Research project of Health Commission of Guangdong Province, China(B2021176) and National Natural Science Foundation of China (81802959).
Disclosure
The authors declare that they have no financial nor non-financial competing interests that are directly or indirectly related to the work submitted for publication.
References
1. Ferlay J, Soerjomataram I, Dikshit R, et al. Cancer incidence and mortality worldwide: sources, methods and major patterns in GLOBOCAN 2012. Int J Cancer. 2015;136(5):E359–E386. doi:10.1002/ijc.29210
2. Ruivo CF, Adem B, Silva M, Melo SA. The biology of cancer exosomes: insights and new perspectives. Cancer Res. 2017;77(23):6480–6488. doi:10.1158/0008-5472.CAN-17-0994
3. Soung YH, Ford S, Zhang V, Chung J. Exosomes in cancer diagnostics. Cancers. 2017;9(12):1. doi:10.3390/cancers9010008
4. Zhou Y, Xia L, Lin J, et al. Exosomes in nasopharyngeal carcinoma. J Cancer. 2018;9(5):767–777. doi:10.7150/jca.22505
5. Di Vizio D, Morello M, Dudley AC, et al. Large oncosomes in human prostate cancer tissues and in the circulation of mice with metastatic disease. Am J Pathol. 2012;181(5):1573–1584. doi:10.1016/j.ajpath.2012.07.030
6. Feng Z, Chen H, Fu T, Zhang L, Liu Y. miR-21 modification enhances the performance of adipose tissue-derived mesenchymal stem cells for counteracting urethral stricture formation. J Cell Mol Med. 2018;22(11):5607–5616. doi:10.1111/jcmm.13834
7. Suetsugu A, Honma K, Saji S, Moriwaki H, Ochiya T, Hoffman RM. Imaging exosome transfer from breast cancer cells to stroma at metastatic sites in orthotopic nude-mouse models. Adv Drug Deliv Rev. 2013;65(3):383–390. doi:10.1016/j.addr.2012.08.007
8. Kosaka N, Yoshioka Y, Fujita Y, Ochiya T. Versatile roles of extracellular vesicles in cancer. J Clin Invest. 2016;126(4):1163–1172. doi:10.1172/JCI81130
9. Li S-L, An N, Liu B, Wang S-Y, Wang J-J YY. Exosomes from LNCaP cells promote osteoblast activity through miR-375 transfer. Oncol Lett. 2019;17(5):4463–4473. doi:10.3892/ol.2019.10110
10. Duan Y, Tan Z, Yang M, et al. PC-3-derived exosomes inhibit osteoclast differentiation by downregulating miR-214 and blocking NF-kappa B signaling pathway. Biomed Res Int. 2019;2019. doi:10.1155/2019/8650846
11. Hashimoto K, Ochi H, Sunamura S, et al. Cancer-secreted hsa-miR-940 induces an osteoblastic phenotype in the bone metastatic microenvironment via targeting ARHGAP1 and FAM134A.
12. Ye Y, Li S-L, Ma -Y-Y, et al. Exosomal miR-141-3p regulates osteoblast activity to promote the osteoblastic metastasis of prostate cancer. Oncotarget. 2017;8(55):94834–94849. doi:10.18632/oncotarget.22014
13. Corcoran C, Rani S, O’Driscoll L. miR-34a is an intracellular and exosomal predictive biomarker for response to docetaxel with clinical relevance to prostate cancer progression. Prostate. 2014;74(13):1320–1334. doi:10.1002/pros.22848
14. Liao B, Zhou M-X, Zhou F-K, et al. Exosome-derived MiRNAs as biomarkers of the development and progression of intracranial aneurysms. J Atheroscler Thromb. 2020;27(6):545–610. doi:10.5551/jat.51102
15. Cai C, Wang H, He HH, et al. ERG induces androgen receptor-mediated regulation of SOX9 in prostate cancer. J Clin Invest. 2013;123(3):1109–1122. doi:10.1172/JCI66666
16. Brauns A-K, Heine M, Toedter K, Baumgart-Vogt E, Luers GH, Schumacher U. A defect in the peroxisomal biogenesis in germ cells induces a spermatogenic arrest at the round spermatid stage in mice. Sci Rep. 2019;9(1):9. doi:10.1038/s41598-018-36956-2
17. Fonseka P, Pathan M, Chitti SV, Kang T, Mathivanan S. FunRich enables enrichment analysis of OMICs datasets. J Mol Biol. 2021;433(11):11. doi:10.1016/j.jmb.2020.166747
18. Pathan M, Keerthikumar S, Chisanga D, et al. A novel community driven software for functional enrichment analysis of extracellular vesicles data. J Extracell Vesicles. 2017;6:1321455.
19. Zhou Y, Zhou B, Pache L, et al. Metascape provides a biologist-oriented resource for the analysis of systems-level datasets. Nat Commun. 2019;10(1):10. doi:10.1038/s41467-018-07709-6
20. Li J-H, Liu S, Zhou H, Qu L-H, Yang J-H. starBase v2.0: decoding miRNA-ceRNA, miRNA-ncRNA and protein-RNA interaction networks from large-scale CLIP-Seq data. Nucleic Acids Res. 2014;42(D1):D92–D97. doi:10.1093/nar/gkt1248
21. Ninio-Many L, Grossman H, Levi M, et al. MicroRNA miR-125a-3p modulates molecular pathway of motility and migration in prostate cancer cells. Oncoscience. 2014;1(4):250–261. doi:10.18632/oncoscience.30
22. Sun M, Guo S, Yao J, et al. MicroRNA-125a suppresses cell migration, invasion, and regulates hyaluronic acid synthase 1 expression by targeting signal transducers and activators of transcription 3 in renal cell carcinoma cells. J Cell Biochem. 2019;120(2):1894–1902. doi:10.1002/jcb.27503
23. Scheye T, Escande G, Labbe A, et al. An intracardiac needle without thoracic penetration. Chir Pediatr. 1988;29(5):287–288.
24. He D, Yang X, Kuang W, Huang G, Liu X, Zhang Y. The novel circular RNA circ-PGAP3 promotes the proliferation and invasion of triple negative breast cancer by regulating the miR-330-3p/Myc Axis. Onco Targets Ther. 2020;13:10149–10159. doi:10.2147/OTT.S274574
25. Zhu B, Liu W, Liu H, Xu Q, Xu W. LINC01094 down-regulates miR-330-3p and enhances the expression of MSI1 to promote the progression of glioma. Cancer Manag Res. 2020;12:6511–6521. doi:10.2147/CMAR.S254630
26. Rahmati Y, Alivand M, Mollanoori H. MiR-330-3p and miR-485-5p as biomarkers for glioblastoma: an integrated bioinformatics and experimental study. Comput Biol Chem. 2021;92:107458.
27. Cheng Y, Zhu H, Gao W. MicroRNA-330-3p represses the proliferation and invasion of laryngeal squamous cell carcinoma through downregulation of Tra2 beta-mediated Akt signaling. Mol Cell Probes. 2020;52:101574
28. Qin G, Wu X. Hsa_circ_0032463 acts as the tumor promoter in osteosarcoma by regulating the miR-330-3p/PNN axis. Int J Mol Med. 2021;47(5):5. doi:10.3892/ijmm.2021.4925
29. Li Q, Wang W, Zhang M, Sun W, Shi W, Circular LF. RNA circ-0016068 promotes the growth, migration, and invasion of prostate cancer cells by regulating the miR-330-3p/BMI-1 axis as a competing endogenous RNA. Front Cell Dev Biol. 2020;8:8. doi:10.3389/fcell.2020.00008
30. Bertoli G, Cava C, Castiglioni I. MicroRNAs: new biomarkers for diagnosis, prognosis, therapy prediction and therapeutic tools for breast cancer. Theranostics. 2015;5(10):1122–1143. doi:10.7150/thno.11543
31. Schmidt N. An adrenalin rush. Can J Surg. 1989;32(1):3–4.
32. Wu G, Hao C, Qi X, et al. LncRNA SNHG17 aggravated prostate cancer progression through regulating its homolog SNORA71B via a positive feedback loop. Cell Death Dis. 2020;11(5):5. doi:10.1038/s41419-020-2569-y
33. Ren W, Li C, Duan W, et al. MicroRNA-613 represses prostate cancer cell proliferation and invasion through targeting Frizzled7. Biochem Biophys Res Commun. 2016;469(3):633–638. doi:10.1016/j.bbrc.2015.12.054
34. Li L, Ameri AH, Wang S, et al. EGR1 regulates angiogenic and osteoclastogenic factors in prostate cancer and promotes metastasis. Oncogene. 2019;38(35):6241–6255. doi:10.1038/s41388-019-0873-8
35. Lang C, Dai Y, Wu Z, et al. SMAD3/SP1 complex-mediated constitutive active loop between lncRNA PCAT7 and TGF-beta signaling promotes prostate cancer bone metastasis. Mol Oncol. 2020;14(4):808–828. doi:10.1002/1878-0261.12634
36. Brown M, Roulson JA, Hart CA, Tawadros T, Clarke NW. Arachidonic acid induction of Rho-mediated transendothelial migration in prostate cancer. Br J Cancer. 2014;110(8):2099–2108. doi:10.1038/bjc.2014.99
37. Venkadakrishnan VB, DePriest AD, Kumari S, et al. Protein Kinase N1 control of androgen-responsive serum response factor action provides rationale for novel prostate cancer treatment strategy. Oncogene. 2019;38(23):4496–4511. doi:10.1038/s41388-019-0732-7
38. Xiang Y, Zhang L, Huang Y, Ling J, Zhuo W. Microarray-based data mining reveals key genes and potential therapeutic drugs for Cadmium-induced prostate cell malignant transformation. Environ Toxicol Pharmacol. 2019;68:141–147. doi:10.1016/j.etap.2019.03.014
39. Li W, Dou Z, We S, et al. Long noncoding RNA BDNF-AS is associated with clinical outcomes and has functional role in human prostate cancer. Biomed Pharmacother. 2018;102:1105–1110. doi:10.1016/j.biopha.2018.03.118
40. Li T, Yu Y, Song Y, et al. Activation of BDNF/TrkB pathway promotes prostate cancer progression via induction of epithelial-mesenchymal transition and anoikis resistance. FASEB J. 2020;34(7):9087–9101. doi:10.1096/fj.201802159RRR
41. Lyu S-C, Han -D-D, Li X-L, et al. Fyn knockdown inhibits migration and invasion in cholangiocarcinoma through the activated AMPK/mTOR signaling pathway. Oncol Lett. 2018;15(2):2085–2090. doi:10.3892/ol.2017.7542
42. Moeller K, Wecker AL, Hoeflmayer D, et al. Upregulation of the heterogeneous nuclear ribonucleoprotein hnRNPA1 is an independent predictor of early biochemical recurrence in TMPRSS2: eRGfusion-negative prostate cancers. Virchows Archiv. 2020;477(5):625–636. doi:10.1007/s00428-020-02834-4
43. Zennami K, Choi SM, Liao R, et al. PDCD4 is an androgen-repressed tumor suppressor that regulates prostate cancer growth and castration resistance. Mol Cancer Res. 2019;17(2):618–627. doi:10.1158/1541-7786.MCR-18-0837
44. Adissu HA, McKerlie C, Di Grappa M, et al. Timp3 loss accelerates tumour invasion and increases prostate inflammation in a mouse model of prostate cancer. Prostate. 2015;75(16):1831–1843. doi:10.1002/pros.23056
45. Yang X, Du WW, Li H, et al. Both mature miR-17-5p and passenger strand miR-17-3p target TIMP3 and induce prostate tumor growth and invasion. Nucleic Acids Res. 2013;41(21):9688–9704. doi:10.1093/nar/gkt680
 © 2022 The Author(s). This work is published and licensed by Dove Medical Press Limited. The full terms of this license are available at https://www.dovepress.com/terms.php and incorporate the Creative Commons Attribution - Non Commercial (unported, v3.0) License.
By accessing the work you hereby accept the Terms. Non-commercial uses of the work are permitted without any further permission from Dove Medical Press Limited, provided the work is properly attributed. For permission for commercial use of this work, please see paragraphs 4.2 and 5 of our Terms.
© 2022 The Author(s). This work is published and licensed by Dove Medical Press Limited. The full terms of this license are available at https://www.dovepress.com/terms.php and incorporate the Creative Commons Attribution - Non Commercial (unported, v3.0) License.
By accessing the work you hereby accept the Terms. Non-commercial uses of the work are permitted without any further permission from Dove Medical Press Limited, provided the work is properly attributed. For permission for commercial use of this work, please see paragraphs 4.2 and 5 of our Terms.