")
Back to Journals » International Journal of Chronic Obstructive Pulmonary Disease » Volume 13
Exercise capacity in COPD patients with exercise-induced pulmonary hypertension
Authors Skjørten I, Hilde JM , Melsom MN, Hisdal J , Hansteen V, Steine K, Humerfelt S
Received 31 December 2017
Accepted for publication 8 May 2018
Published 31 October 2018 Volume 2018:13 Pages 3599—3610
DOI https://doi.org/10.2147/COPD.S161175
Checked for plagiarism Yes
Review by Single anonymous peer review
Peer reviewer comments 3
Editor who approved publication: Dr Richard Russell
Ingunn Skjørten,1,2 Janne Mykland Hilde,3 Morten Nissen Melsom,1 Jonny Hisdal,4 Viggo Hansteen,5 Kjetil Steine,2,3 Sjur Humerfelt6
1Department of Pulmonary Medicine, LHL Hospital Gardermoen, Jessheim, 2Faculty of Medicine, University of Oslo, Oslo, 3Department of Cardiology, Akershus University Hospital, Lørenskog, 4Section of Vascular Investigations, Oslo University Hospital-Aker, 5Department of Cardiology, Oslo University Hospital-Aker, 6Clinic of Allergology and Respiratory Medicine, Oslo, Norway
Background: Pulmonary hypertension (PH) in patients with COPD is associated with reduced exercise capacity. A subgroup of COPD patients has normal mean pulmonary artery pressure (mPAP) at rest, but develops high mPAP relative to cardiac output (CO) during exercise, a condition we refer to as exercise-induced pulmonary hypertension (EIPH). We hypothesized that COPD patients with EIPH could be identified by cardiopulmonary exercise test (CPET) and that these patients have lower exercise capacity and more abnormal CPET parameters compared to COPD patients with normal hemodynamic exercise response.
Methods: Ninety-three stable outpatients with COPD underwent right heart catheterization with the measurement of mPAP, CO, and capillary wedge pressure at rest and during supine exercise. Resting mPAP <25 mmHg with ΔmPAP/ΔCO slope above or below 3 mmHg/L/min were defined as COPD-EIPH and COPD-normal, respectively. Pulmonary function tests and CPET with arterial blood gases were performed. Linear mixed models were fitted to estimate differences between the groups with adjustment for gender, age, and airflow obstruction.
Results: EIPH was observed in 45% of the study population. Maximal workload was lower in COPD-EIPH compared to COPD-normal, whereas other CPET measurements at peak exercise in % predicted values were similar between the two groups. After adjustment for gender, age, and airflow obstruction, patients with COPD-EIPH showed significantly greater increase in oxygen uptake, ventilation, respiratory frequency, heart rate, and lactate with increasing work load, as well as more reduction in pH compared to those with normal hemodynamic responses.
Conclusion: COPD-EIPH could not be discriminated from COPD-normal by CPET. However, COPD-EIPH experienced a higher cost of exercise in terms of higher oxygen uptake, ventilation, respiratory frequency, heart rate, and lactate for a given increase in workload compared to COPD-normal.
Keywords: COPD, pulmonary hypertension, right heart catheterization, cardiopulmonary exercise test
Introduction
COPD may cause pulmonary hypertension (PH), a complication associated with reduced exercise capacity1,2 and worse prognosis.3,4 A subgroup of COPD patients with normal mean pulmonary artery pressure (mPAP) at rest experiences a substantial increase in mPAP during exercise, a condition that can be described as exercise-induced pulmonary hypertension (EIPH). The impact of EIPH on exercise capacity in COPD patients has not been explored previously. The stress imposed on the right ventricle by EIPH may result in altered physiological responses that can be assessed by cardiopulmonary exercise test (CPET).
The definition of PH was changed by an expert consensus in 2008, whereby a rise in mPAP above 30 mmHg during exercise was omitted from the definition.5 This has led to a discussion about how to classify hemodynamic pathology during exercise.6–10 As healthy individuals may have mPAP >30 mmHg during exercise,11 the former definition, which included only mPAP, often failed to discriminate pathologic from normal responses. This has resulted in a more complex evaluation of the pulmonary circulation during exercise, where composite variables are calculated. Among healthy individuals, the change in mPAP is related to the work performed, as an increase in mPAP is driven by increased cardiac output (CO). Thus, the slope of ΔmPAP/ΔCO has been proposed to define EIPH, as a steep slope indicates pathology.12 A rise in mPAP during exercise beyond what is expected from CO reflects pathology due to reduced vessel distensibility (precapillary pathology) or increased left atrial pressure (postcapillary pathology).13 COPD induces precapillary vasculopathy; however, a postcapillary component due to left ventricle diastolic dysfunction with increased left atrial pressure is common in patients with COPD.14–16 In order to avoid postcapillary contribution to mPAP and ΔmPAP/ΔCO slope, patients with left heart disease were excluded from the study. Our group has previously reported ΔmPAP/ΔCO relationships in COPD outpatients with varying degrees of airflow obstruction, suggesting that ΔmPAP/ΔCO slope >3 mmHg/L/min defines an abnormal hemodynamic exercise response representing EIPH.17
The present study aimed to investigate exercise performance and physiological responses during CPET in COPD patients with and without EIPH defined as resting mPAP <25 mmHg and a ΔmPAP/ΔCO slope >3 mmHg/L/min. We hypothesized that COPD patients with EIPH could be identified by CPET and that these patients have lower exercise capacity and more abnormal CPET parameters compared to COPD patients with normal hemodynamic exercise response.
Methods
Study subjects
The present cross-sectional study consecutively included 93 outpatients with COPD at Oslo University Hospital, Aker from 2006 to 2010. Patients were Caucasians, aged 40–75 years with stable disease and >10 pack-years of tobacco consumption. Patients underwent thorough pre-inclusion screening. The COPD diagnosis was confirmed by post-bronchodilator spirometry. Clinical examination and electrocardiogram at rest and during exercise were performed to exclude patients with conditions affecting left ventricle function. Obstructive sleep apnea syndrome, pulmonary embolism, systemic hypertension ≥160/90 mmHg, and use of beta-blockers were reasons for exclusion. A detailed description of the inclusion process and study procedures has been published previously.17,18
The study was approved by the Regional Ethics Committee South East Norway (274-07127a 1.2007.1085) and performed according to the Declaration of Helsinki. Written informed consent was obtained from all participants.
Study protocol
All study tests were performed within 2 consecutive days. Patients were instructed to take their regular medication. All tests were performed without supplemental oxygen.
Spirometry, body plethysmography, and diffusion capacity for carbon monoxide (DLCO) measurements (MasterScreen PFT; Jaeger, Würzburg, Germany) were performed according to guidelines.19 Prior to exercise, patients ventilated with maximum effort for 10 seconds to estimate the maximal voluntary ventilation.
CPET
CPET was performed on cycle ergometer with breath by breath measurement (Oxycon Delta; Jaeger) with all patients breathing ambient air. The same incremental protocol was applied for all patients, starting with 4 minutes of unloaded pedaling at 60 rpm, 4 minutes of 25 W, followed by increases of 10 W every 2 minutes until exhaustion. Variables for each exercise level were recorded every 30 seconds, and median value for each level was noted. Oxygen pulse was calculated by dividing V.O2 by HR. Ventilatory equivalent for CO2 (V.E/V.CO2) was calculated and V.E/V.CO2 nadir was defined as the lowest value on the curve during exercise. Norwegian reference values for CPET were applied.20 A radial artery cannula was inserted for blood samples at rest and repeatedly during exercise. Systemic blood pressure was measured invasively through the radial artery line.
Echocardiography
Echocardiography was performed <120 minutes prior to right heart catheterization (RHC) as previously described.21 Left ventricular (LV) ejection fraction and volumes were calculated by the biplane Simpson method using apical four- and two-chamber views.22 Indexed left atrial volume was calculated using the four- and two-chamber views at end-systole.22 Right ventricular (RV) functional parameters were obtained as previously reported.21 The mitral inflow measurements included peak early filling (E) and late diastolic filling (A) velocity and the E/A ratio by pulsed Doppler.23 Early diastolic (E’) peak velocity assessed by pulsed tissue Doppler imaging was measured in the four-chamber view at the bases of the septal and lateral mitral leaflet and averaged, and E/E’ was calculated as a surrogate for LV filling pressure.23
RHC at rest
RHC at rest (Mac-Lab; GE Healthcare, Milwaukee, WI, USA) was performed via the antecubital or femoral vein with the patient in the supine position. Zero reference level was at mid-axillary line at right atrial level. CO was estimated by thermodilution technique, averaging three or five measurements.24 Measurements of mPAP, right atrial pressure, pulmonary arterial wedge pressure (PAWP), and right ventricle pressure were performed at end expiration. Pulmonary vascular resistance (PVR) was calculated as (mPAP−PAWP)/CO.
RHC during exercise
RHC during exercise was performed with dynamic supine leg exercise (Ergomed 840L; Siemens , Erlangen, Germany), starting with 4 minutes unloaded pedaling at 60 rpm, then 20 W for 4 minutes, followed by 10 W increases every 2 minutes until exhaustion. PAWP and mPAP were measured at every load level, whereas CO was measured only at peak exercise.
Exercise hemodynamics
Exercise-induced increase in mPAP was interpreted relative to increase in CO (ΔmPAP/ΔCO slope), and >3 mmHg/L/min was used as cut off for pathology. ΔmPAP/ΔCO slope was calculated from measurements at rest and peak exercise.
Patients with resting mPAP ≥25 mmHg and PAWP <15 mmHg were defined as COPD-PH. Patients with resting mPAP <25 mmHg, resting PAWP <15 mHg, and ΔmPAP/ΔCO slope above or below 3 mmHg/L/min were defined as COPD-EIPH or COPD-normal, respectively.
Statistical methods
Continuous variables were reported as mean and standard deviation. Differences among three groups were assessed with one-way analysis of variance (ANOVA) or Kruskal–Wallis test and differences between two groups with independent-samples Student’s t-test or Mann–Whitney U-test as appropriate. To analyze between-group differences in CPET parameters, linear mixed models (LMMs) were fitted for repeated measures. An unstructured covariance matrix was used to model dependencies among measurements for each patient at multiple time points during exercise. Each time point represented a specific load. Measurements at all time points (loads) were considered, including rest. Models for each outcome included terms for time point (load level), grouping of patients (COPD-normal, COPD-EIPH, and COPD-PH), and interaction between load level and group. Furthermore, LMMs were adjusted for gender, age, and FEV1 (L) to test for potential confounders. Estimates of intercept and slope for each CPET parameter were calculated, where the intercept represented the calculated level of a variable at baseline and the slope represented the change in a variable with increasing load. COPD-EIPH was the defined reference group. p-values <0.05 were considered statistically significant, and all tests were two-sided. Analyses were performed using IBM SPSS Statistics, version 24 (IBM Corporation, Armonk, NY, USA).
Results
PH was identified in 22 patients. Among the remaining patients with mPAP <25 mmHg at rest, 42 demonstrated abnormal exercise response with ΔmPAP/ΔCO slope >3 mmHg/L/min. Only 29 patients had normal hemodynamic responses at rest and during exercise.
There were no differences between COPD-EIPH and COPD-normal regarding spirometric parameters, but both the groups had significantly less airflow obstruction than COPD-PH (Table 1). Compared to COPD-normal, COPD-EIPH had higher residual volume and lower DLCO.
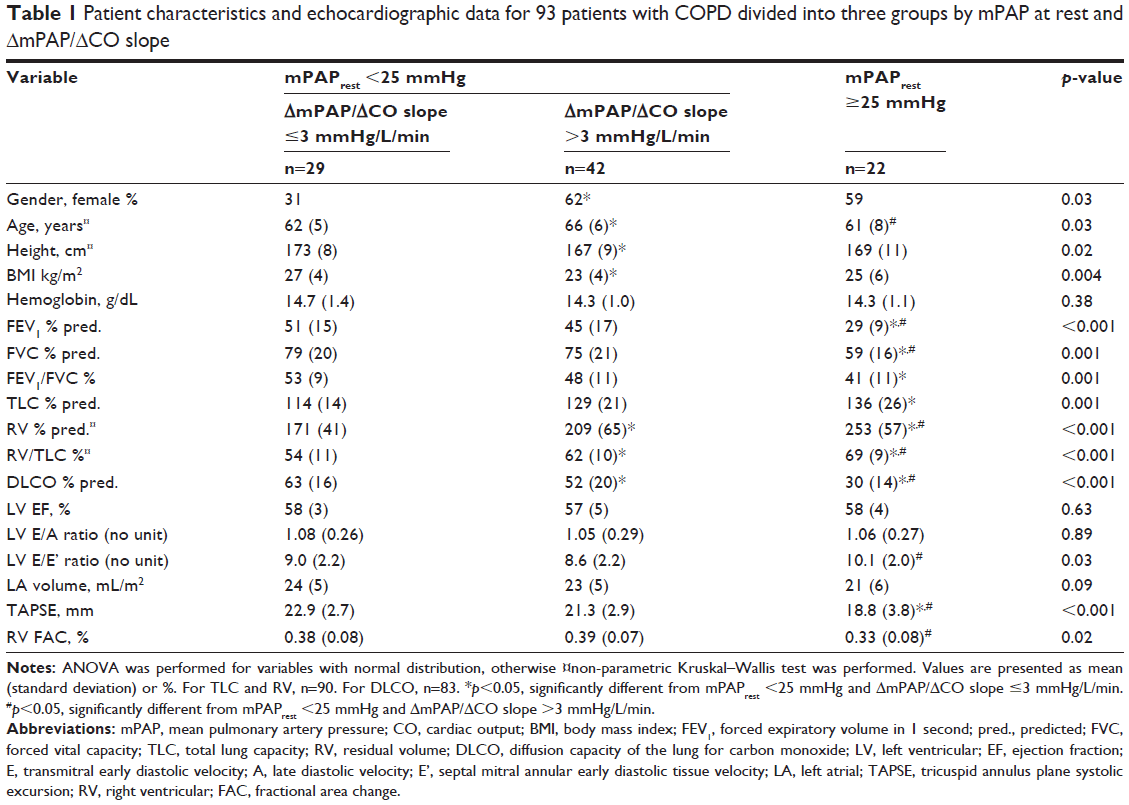 | Table 1 Patient characteristics and echocardiographic data for 93 patients with COPD divided into three groups by mPAP at rest and ΔmPAP/ΔCO slope |
The EIPH group included 62% women, which was significantly different from COPD-normal with 31% women (Table 1). The EIPH group was older compared to the other groups (Table 1).
All patients had PAWP <15 mmHg at rest. During exercise, there were no differences in mean peak PAWP for the three groups (Table 2), and mean peak PAWP was considered to be within normal limits. However, PAWP peak in the range 21–26 mmHg was observed in five, seven, and two patients in the COPD-normal, COPD-EIPH, and COPD-PH groups, respectively. As PAWP peak currently has no clearly defined upper limit of normal, these patients were not excluded from final analyses. Moreover, analyses omitting patients with exercise PAWP >20 mmHg were similar to analyses of the entire study population. Echocardiographic data (Table 1) did not indicate overt diastolic dysfunction, LV E/A was similar between the groups. Although LV E/E’ was higher in COPD-PH compared to COPD-EIPH, mean values in all groups were within normal limits. Echocardiographic evaluation of left ventricle ejection fraction (LV EF) and right ventricle fractional area change (RV FAC) was similar between COPD-EIPH and COPD-normal, indicating preserved systolic function (Table 1).
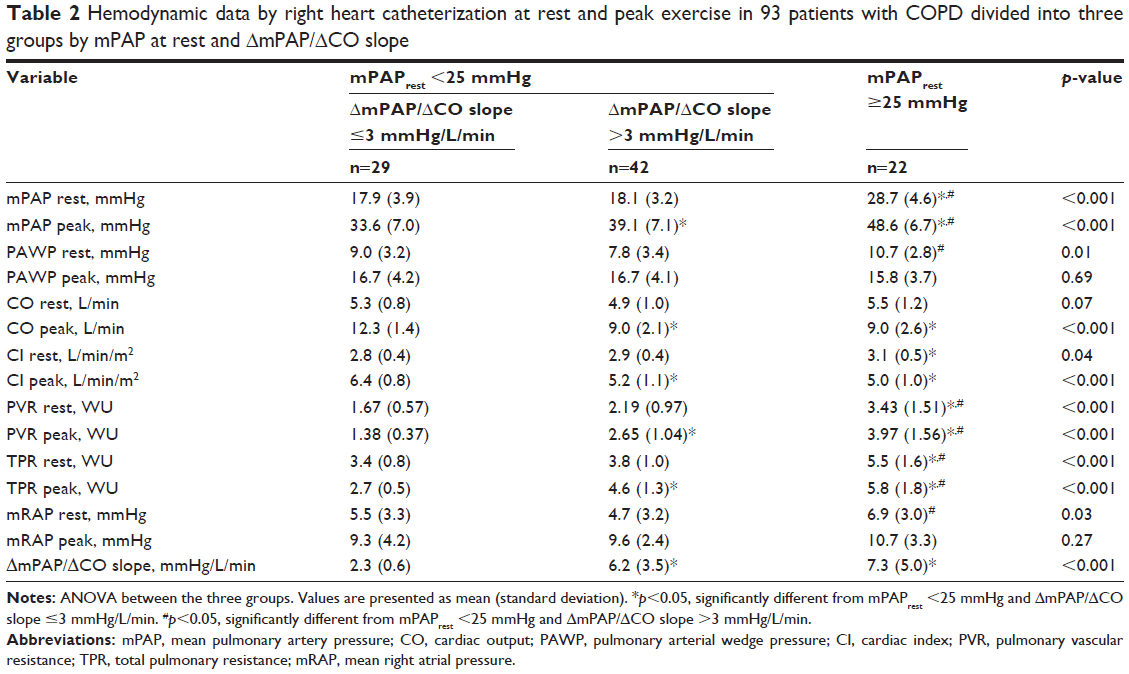 | Table 2 Hemodynamic data by right heart catheterization at rest and peak exercise in 93 patients with COPD divided into three groups by mPAP at rest and ΔmPAP/ΔCO slope |
CPET
At peak exercise, there were no significant differences between COPD-EIPH and COPD-normal in % predicted values for V.O2, ventilation, oxygen pulse, or lactate, but one or both groups differed from COPD-PH (Table 3). Heart rate (HR) and systemic blood pressure at peak exercise were similar in all three groups. Equal, but slightly reduced ventilatory efficiency was observed for COPD-EIPH and COPD-normal, as V.E/V.CO2 slope was 34 and 35, respectively. V.E/V.CO2 nadir was higher in COPD-PH compared to COPD-normal, but similar in COPD-EIPH and COPD-normal. Mean exercise time was 15 minutes, with a wide range of 2–30 minutes.
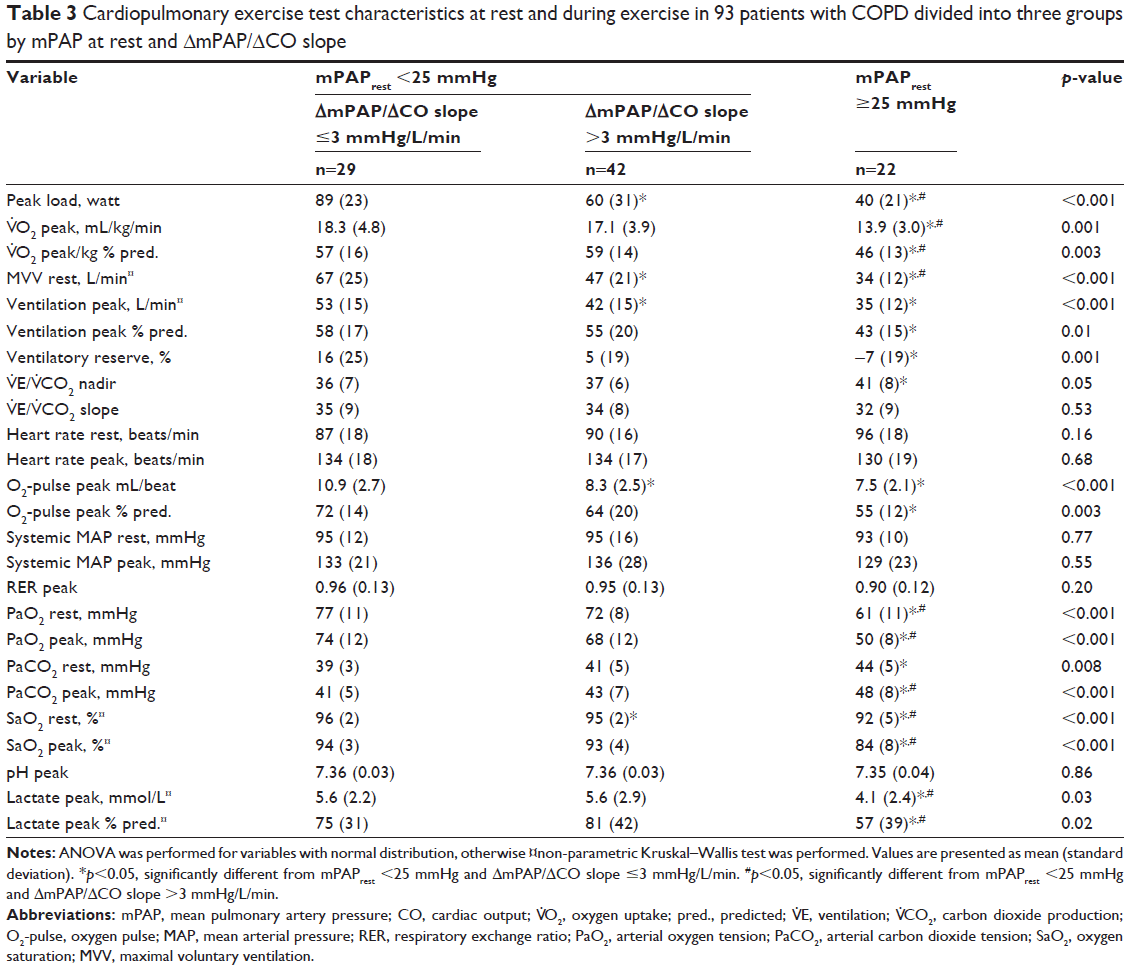 | Table 3 Cardiopulmonary exercise test characteristics at rest and during exercise in 93 patients with COPD divided into three groups by mPAP at rest and ΔmPAP/ΔCO slope |
Figure 1 shows the development of central CPET variables during the entire course of exercise for each individual, as well as the average for the three groups. Similar to the visual impression in Figure 1, ANOVA confirmed that there were no differences between COPD-EIPH and COPD-normal for PaO2 and PaCO2, but both the groups were different from COPD-PH (Table 3). For the other CPET variables, the pattern was less consistent, and we must emphasize that with increasing load, few patients were represented in the calculation of the mean. Moreover, the variables in Figure 1A are dependent on gender and age distribution, which were different between the groups. Another aspect is the difference in exercise performance between the groups; they all achieved different mean work load (p<0.001) (Table 3). This difference would influence CPET results. For example, all groups had similar peak HR, but due to different peak work load, the HR response could still be different between the groups.
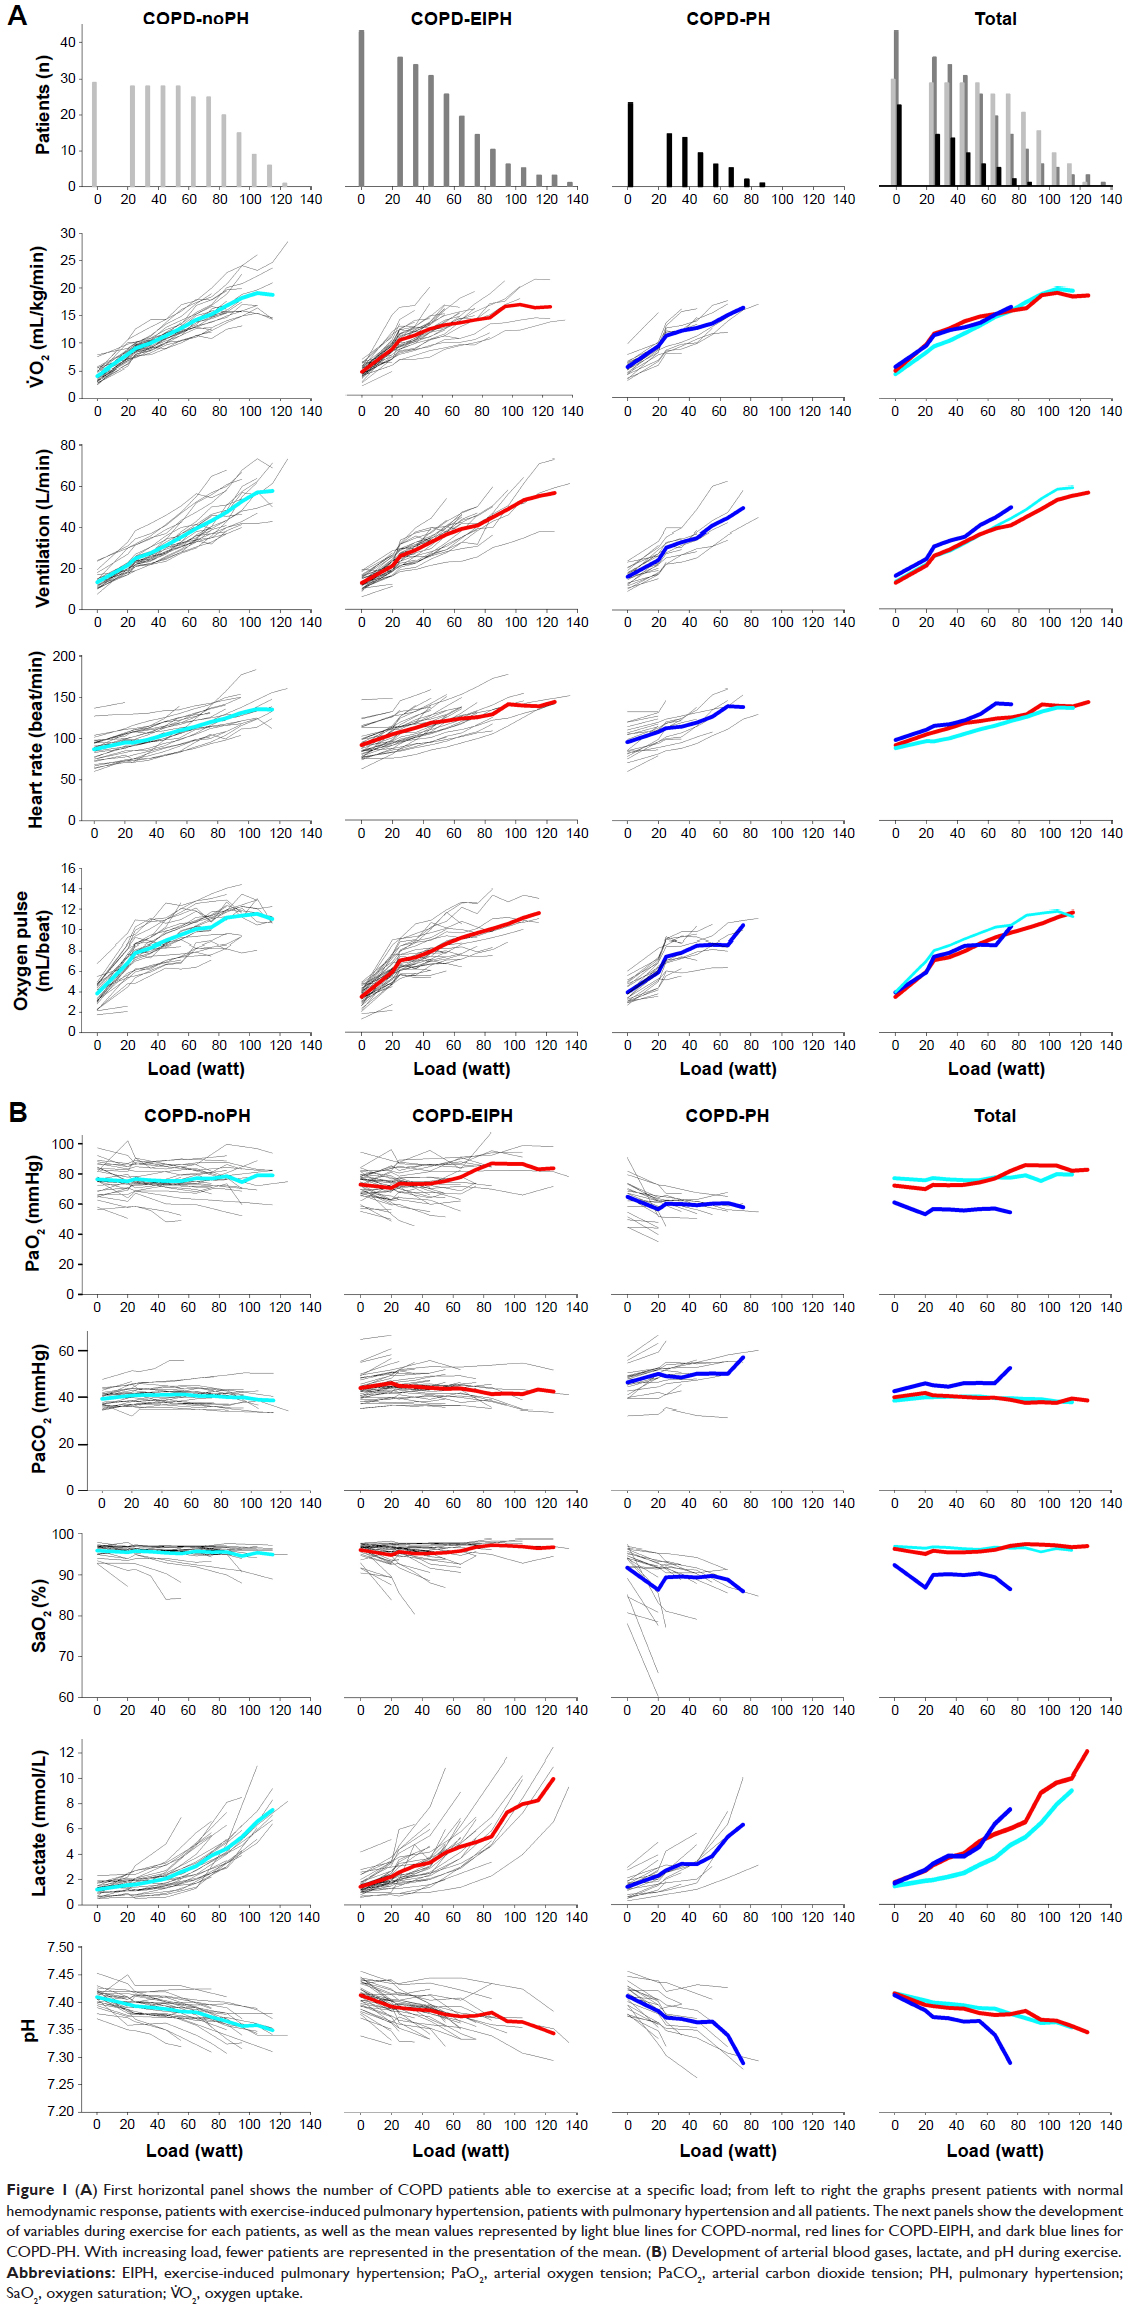 | Figure 1 (A) First horizontal panel shows the number of COPD patients able to exercise at a specific load; from left to right the graphs present patients with normal hemodynamic response, patients with exercise-induced pulmonary hypertension, patients with pulmonary hypertension and all patients. The next panels show the development of variables during exercise for each patients, as well as the mean values represented by light blue lines for COPD-normal, red lines for COPD-EIPH, and dark blue lines for COPD-PH. With increasing load, fewer patients are represented in the presentation of the mean. (B) Development of arterial blood gases, lactate, and pH during exercise. |
To be able to compare the three groups despite the differences, we have fitted a LMM which included the values of a variable at rest and all exercise levels for each patient, and adjusted for gender, age, and FEV1. Estimates of intercept and slope, as well as the difference between COPD-EIPH and the two other groups, are shown in Table 4. The intercept did not differ between COPD-EIPH and COPD-normal for any of the variables. The slope, however, was significantly different between COPD-EIPH and COPD-normal for several CPET parameters. With increasing load, considering all measurements during exercise after adjustment for gender, age, and FEV1, COPD-EIPH showed a steeper slope with higher increase in V.O2 (p<0.001), ventilation (p=0.05), respiratory frequency (p=0.004), HR (p<0.001), and lactate (p=0.002) compared to COPD-normal (Table 4). For the same variables, there were no differences between COPD-EIPH and COPD-PH. COPD-EIPH demonstrated a modest, but significant reduction in pH compared to COPD-normal (p=0.005). For PaO2, we observed that the intercept was lower (p<0.001) and the decline steeper (p<0.001) in COPD-PH compared to COPD-EIPH, whereas there were no differences between COPD-EIPH and COPD-normal. For PaCO2, we observed a more pronounced increase during exercise in COPD-PH compared to COPD-EIPH, but no differences between COPD-EIPH and COPD-normal.
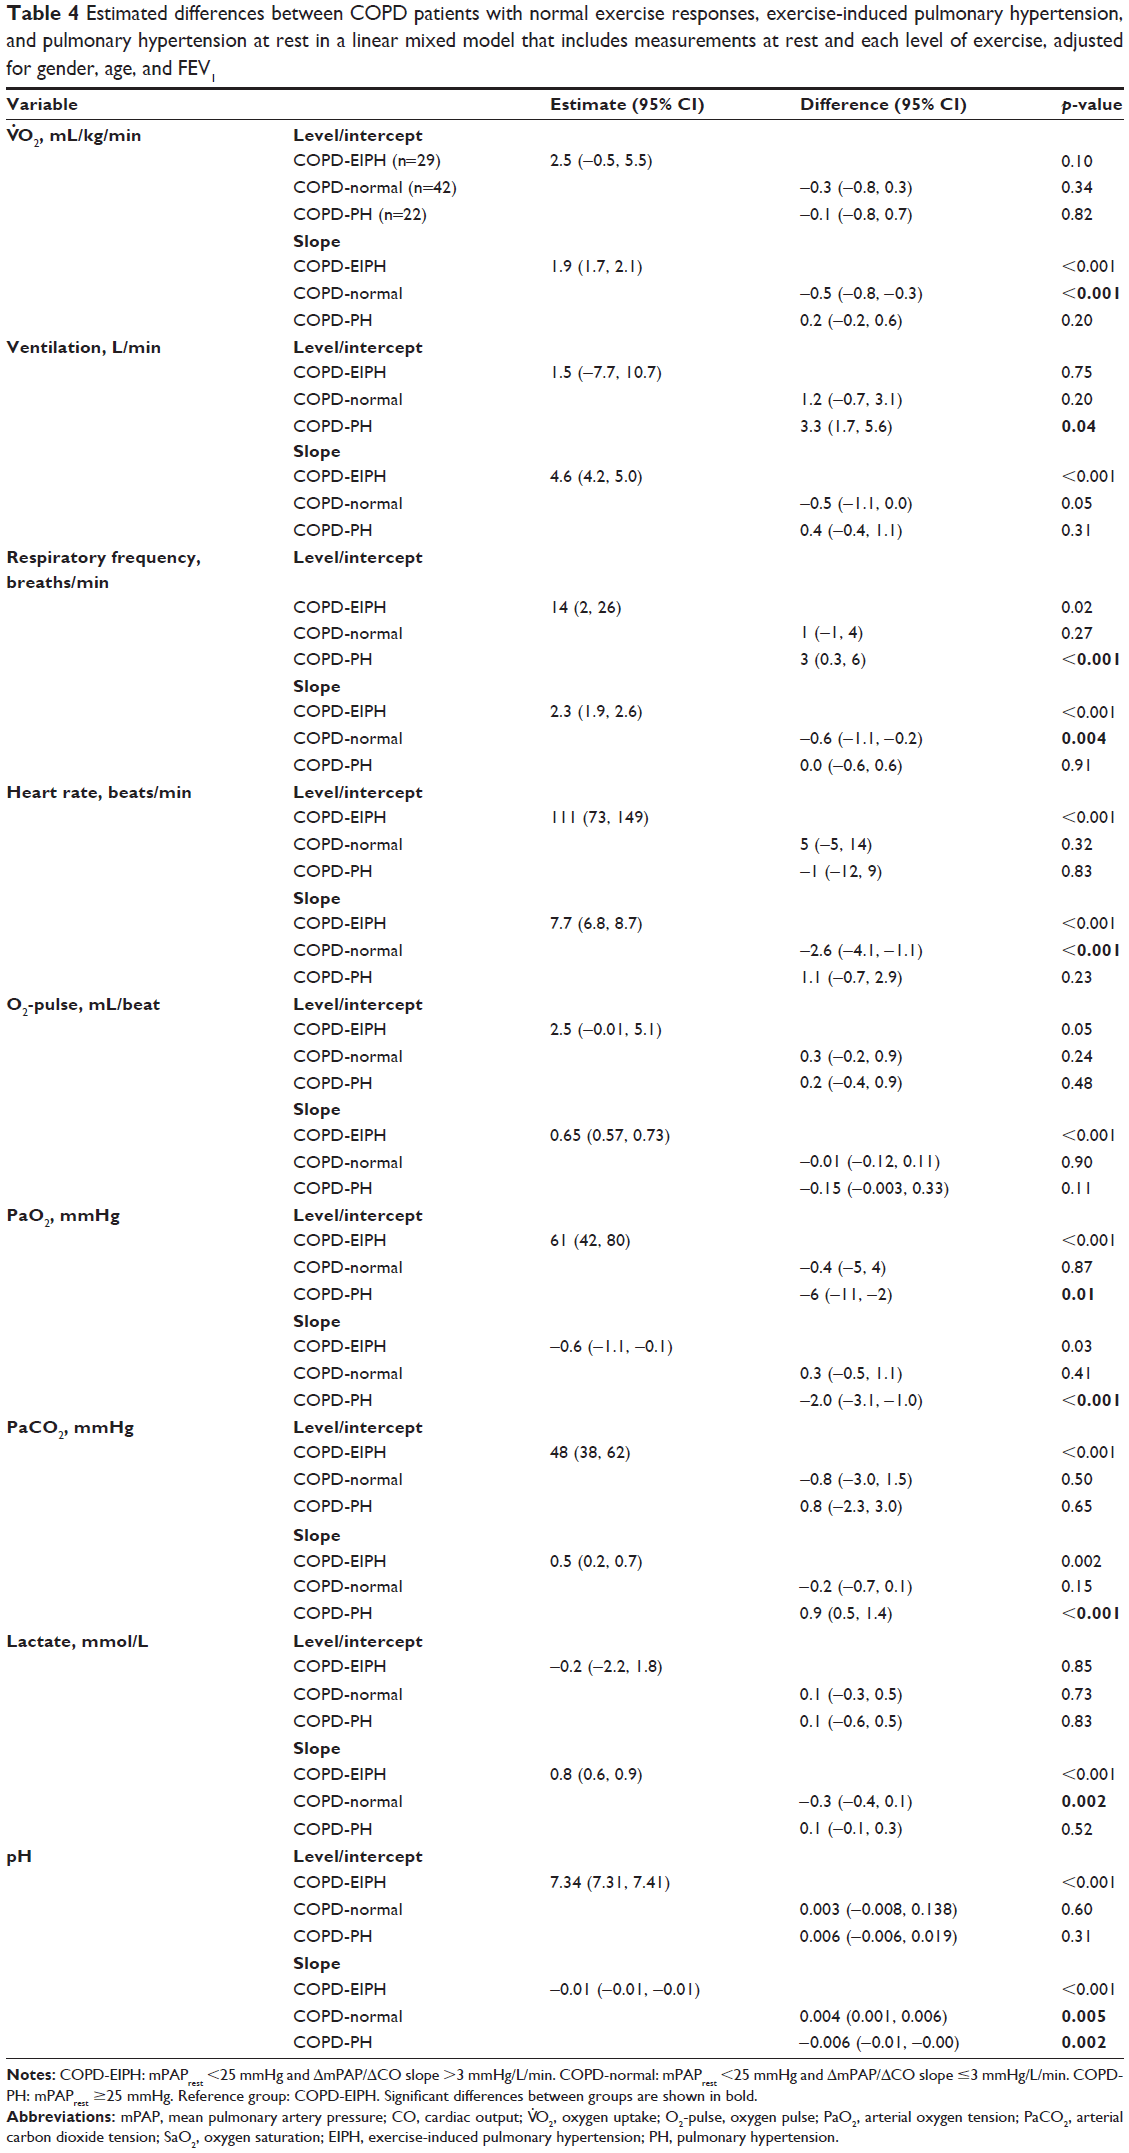 | Table 4 Estimated differences between COPD patients with normal exercise responses, exercise-induced pulmonary hypertension, and pulmonary hypertension at rest in a linear mixed model that includes measurements at rest and each level of exercise, adjusted for gender, age, and FEV1 |
Discussion
CPET
In this study of stable outpatients with COPD in whom LV disease was excluded in advance, we have identified patients characterized by normal mPAP at rest accompanied by a disproportionate increase in mPAP relative to CO during exercise, representing EIPH. This group could not be identified by CPET results at peak exercise. As differences in gender and age affected some of the CPET variables, it was relevant to compare the measurements as % predicted values, which were similar between the COPD-EIPH and COPD-normal groups. However, when we applied a statistical model that included measurements at every load level and adjusted for gender, age, and FEV1, the patients with COPD-EIPH experienced a higher cost of exercise in terms of higher oxygen uptake, ventilation, respiratory frequency, HR, and lactate for a given increase in workload compared to those classified as COPD-normal. The increased ventilation likely reflects ventilation perfusion mismatch caused by lung parenchymal pathology and/or cardio-circulatory abnormality. Reduced ventilatory efficiency with slightly elevated V.E/V.CO2 slope and V.E/V.CO2 nadir further supports this explanation. The higher respiratory frequency indicates restricted tidal volumes and could be secondary to dynamic hyperinflation with reduced inspiratory capacity. This assumption is supported by higher residual volume and lower DLCO, indicating more emphysema in patients with COPD-EIPH compared to those classified as COPD-normal. The cost of extra ventilation could explain the higher V.O2 at a given external load. The higher HR reflects cardiovascular stress or deconditioning; as there was no significant difference in PaO2, tachycardia induced by hypoxemia seems less likely. The higher lactate and lower pH is associated with anaerobic exercise and inability to increase CO; this could be caused by the high mPAP during exercise or by deconditioning.
PaO2 and PaCO2 were similar in the COPD-EIPH and COPD-normal groups. As low PaO2 is associated with increased mPAP at rest,3,25,26 we were surprised to find that the brisk increase in mPAP relative to CO during exercise in COPD-EIPH compared to COPD-normal was not associated with lower PaO2. However, similar PaO2 in EIPH and hemodynamically normal patients was also observed by Degani-Costa et al in a study of patients with interstitial lung disease.27 As all the significant differences we observed between COPD-EIPH and COPD-normal in LMM analyses are related to the slope rather than the intercept, we conclude that the change in a CPET variable for a given increase in workload is the best way to describe differences.
As all patients performed the same exercise protocol, we observed a wide range in the duration of exercise. The fit patients exercised for a longer period than recommended for CPET; however, test results would most probably have been the same with a shorter duration. The chosen exercise protocols allowed us to apply the LMMs and to compare similar exercise levels for CPET and RHC.
Age and gender differences
When patients with mPAP <25 mmHg were divided into two groups by the ΔmPAP/ΔCO slope, differences in age (p=0.02, t-test) and gender (p=0.01) distribution were observed. All patients were ≥50 years old. Fourteen patients (33%) with COPD-EIPH were aged ≥70 years, in contrast to three patients (10%) classified as COPD-normal, and 70% of patients aged ≥70 years were defined as COPD-EIPH. A steeper ΔmPAP/ΔCO slope with advancing age is in line with the findings in healthy individuals.28–30 Accordingly, age must be considered as a potential confounder in the observed characteristics of patients with EIPH. The difference in gender distribution, with significantly more women in the COPD-EIPH group compared to COPD-normal, was more unexpected. In a study based on exercise stress echocardiography, Argiento et al found similar mPAP–flow relationship for both the genders.28 During exercise, healthy male patients achieved higher workload and CO, accompanied by higher mPAP, compared to healthy female patients, but the ΔmPAP/ΔCO slope was similar. Calculation of distensibility coefficient α demonstrated that women below the age of 50 years have more distensible vessels, an effect that tapers off after menopause.28 All our patients were older than 50 years, and very few studies have compared gender differences in ΔmPAP/ΔCO slope for healthy patients above this age. Our results suggest that the gender difference observed reflects that the women included in our study actually had more dysfunctional pulmonary circulation.
PAWP and diastolic dysfunction
In our study population, a steep ΔmPAP/ΔCO slope was associated mainly with precapillary pathology of the pulmonary circulation. However, a steep slope may potentially result from LV pathology with increased PAWP. All patients had normal PAWP at rest. Mean PAWP peak was within normal limits and identical (16.7 mmHg) for COPD-normal and COPD-EIPH. However, in COPD-normal and COPD-EIPH, five (17%) and seven (17%) patients, respectively, experienced a PAWP peak of 21–26 mmHg. In the COPD-EIPH group, four of the seven patients with high PAWP peak had PVR >1.5 WU, indicating predominantly precapillary pathology, but for the other patients with high PAWP peak, diastolic dysfunction could not be completely ruled out.
Clinical relevance
Due to differences in gender, age, and pulmonary function between the three groups, a direct comparison of CPET characteristics in COPD-normal and COPD-EIPH was difficult, and we were not able to discern CPET differences between the two groups in unadjusted analyses. After applying LMMs adjusted for these differences, several CPET variables differed between the groups, but as significant differences only appeared after multivariable adjustment, they may have more theoretical than clinical value; thus CPET does not appear to represent a suitable method to identify COPD-EIPH. Nevertheless, evaluation of the physiologic responses across an entire course of exercise provides insights to the physiology of COPD. The clinical relevance of diagnosing PH in COPD remains under debate31 and that of EIPH is even more uncertain.31–33 However, a brisk increase in mPAP with exercise in COPD patients may be prognostic for subsequently developing PH34 associated with increased morbidity and mortality.3,4 Increase in ΔmPAP/ΔCO slope over time may indicate reduced V.O2 and exercise capacity, as recently shown in patients with scleroderma.35 We therefore recommend that hemodynamic dysfunction is considered more often in the evaluation of patients with COPD.
Limitations
Our results may not be applicable to the general COPD population as patients with common comorbidities affecting left heart function were excluded.
The ΔmPAP/ΔCO slope is defined by two measurement points, as CO was measured at rest and peak exercise. Multiple measurements of both mPAP and CO during exercise would have increased the accuracy of the slope.
Measurements of inspiratory capacity in order to assess dynamic hyperinflation were unfortunately not performed. It is likely that some of the study patients experienced dynamic hyperinflation to an extent that affected hemodynamic measurements. Exercise hemodynamics is difficult to interpret in COPD patients due to the augmented pressure swings during the respiratory cycle.36,37 The intrathoracic pressure is most positive at end-expiration, where we have performed our hemodynamic measurements, and this may add to the intravascular pressure.13,36,37 We have not been able to correct our invasive measurements for intrathoracic pressure, thus mPAP and PAWP may be overestimated in some patients. However, for the patients defined as EIPH by the relative change in mPAP to CO, the absolute value has less impact, as all measurements were performed at end-expiration.
Reference values for CPET are based on treadmill exercise, thus % predicted V.O2 may be slightly underestimated; however, this would not be expected to significantly affect the evaluation of differences between the groups.
Conclusion
In this CPET study of COPD outpatients where LV disease was excluded in advance, we have identified a group of patients presenting with EIPH characterized by normal mPAP at rest accompanied by an disproportionate increase in mPAP relative to CO during exercise with ΔmPAP/ΔCO slope >3 mmHg/L/min. EIPH is common in COPD and was observed in 45% of the study population. COPD-EIPH could not be discriminated from COPD-normal by a direct comparison of CPET data. However, when we considered the entire course of exercise and adjusted for differences in age, gender, and airflow obstruction, we observed that patients with COPD-EIPH experienced a higher cost of exercise in terms of greater increase in oxygen uptake, ventilation, respiratory frequency, HR, and lactate for a given increase in workload compared to patients with normal hemodynamic responses. This indicates that there are physiological differences between the two groups. Hemodynamic responses during exercise are important, and further studies, for both healthy controls and COPD patients, are requested.
Acknowledgments
The study has been funded by the Norwegian Extra Foundation (ref: 2008/2/0076), South-Eastern Norway Regional Health Authority (ref: 2007006), and Oslo University Hospital. The sponsors were not involved in study design, analysis, or the writing of the manuscript. Thanks to staff at Oslo University Hospital who have participated in data collection.
Disclosure
The authors report no conflicts of interest in this work.
References
Sims MW, Margolis DJ, Localio AR, Panettieri RA, Kawut SM, Christie JD. Impact of pulmonary artery pressure on exercise function in severe COPD. Chest. 2009;136(2):412–419. | ||
Thirapatarapong W, Armstrong HF, Bartels MN. Comparing cardiopulmonary exercise testing in severe COPD patients with and without pulmonary hypertension. Heart Lung Circ. 2014;23(9):833–840. | ||
Andersen KH, Iversen M, Kjaergaard J, et al. Prevalence, predictors, and survival in pulmonary hypertension related to end-stage chronic obstructive pulmonary disease. J Heart Lung Transplant. 2012;31(4):373–380. | ||
Cuttica MJ, Kalhan R, Shlobin OA, et al. Categorization and impact of pulmonary hypertension in patients with advanced COPD. Respir Med. 2010;104(12):1877–1882. | ||
Galie N, Hoeper MM, Humbert M, et al. Guidelines for the diagnosis and treatment of pulmonary hypertension: the Task Force for the Diagnosis and Treatment of Pulmonary Hypertension of the European Society of Cardiology (ESC) and the European Respiratory Society (ERS), endorsed by the International Society of Heart and Lung Transplantation (ISHLT). Eur Heart J. 2009;30(20):2493–2537. | ||
Herve P, Lau EM, Sitbon O, et al. Criteria for diagnosis of exercise pulmonary hypertension. Eur Respir J. 2015;46(3):728–737. | ||
Lewis GD, Bossone E, Naeije R, et al. Pulmonary vascular hemodynamic response to exercise in cardiopulmonary diseases. Circulation. 2013;128(13):1470–1479. | ||
Saggar R, Lewis GD, Systrom DM, Champion HC, Naeije R, Saggar R. Pulmonary vascular responses to exercise: a haemodynamic observation. Eur Respir J. 2012;39(2):231–234. | ||
Oliveira RK, Waxman AB, Agarwal M, Badr Eslam R, Systrom DM. Pulmonary haemodynamics during recovery from maximum incremental cycling exercise. Eur Respir J. 2016;48(1):158–167. | ||
Kovacs G, Herve P, Barbera JA, et al. An official European Respiratory Society statement: pulmonary haemodynamics during exercise. Eur Respir J. 2017;50(5):1700578. | ||
Kovacs G, Berghold A, Scheidl S, Olschewski H. Pulmonary arterial pressure during rest and exercise in healthy subjects: a systematic review. Eur Respir J. 2009;34(4):888–894. | ||
Lewis GD, Murphy RM, Shah RV, et al. Pulmonary vascular response patterns during exercise in left ventricular systolic dysfunction predict exercise capacity and outcomes. Circ Heart Fail. 2011;4(3):276–285. | ||
Naeije R, Vanderpool R, Dhakal BP, et al. Exercise-induced pulmonary hypertension: physiological basis and methodological concerns. Am J Respir Crit Care Med. 2013;187(6):576–583. | ||
Lam CS, Roger VL, Rodeheffer RJ, Borlaug BA, Enders FT, Redfield MM. Pulmonary hypertension in heart failure with preserved ejection fraction: a community-based study. J Am Coll Cardiol. 2009;53(13):1119–1126. | ||
Naeije R. In defence of exercise stress tests for the diagnosis of pulmonary hypertension. Heart. 2011;97(2):94–95. | ||
Paulus WJ, Tschope C. A novel paradigm for heart failure with preserved ejection fraction: comorbidities drive myocardial dysfunction and remodeling through coronary microvascular endothelial inflammation. J Am Coll Cardiol. 2013;62(4):263–271. | ||
Hilde JM, Skjorten I, Hansteen V, et al. Haemodynamic responses to exercise in patients with COPD. Eur Respir J. 2013;41(5):1031–1041. | ||
Skjorten I, Hilde JM, Melsom MN, et al. Cardiopulmonary exercise test and PaO2 in evaluation of pulmonary hypertension in COPD. Int J Chron Obstruct Pulmon Dis. 2018;13:91–100. | ||
Miller MR, Hankinson J, Brusasco V, et al. Standardisation of spirometry. Eur Respir J. 2005;26(2):319–338. | ||
Edvardsen E, Scient C, Hansen BH, Holme IM, Dyrstad SM, Anderssen SA. Reference values for cardiorespiratory response and fitness on the treadmill in a 20- to 85-year-old population. Chest. 2013;144(1):241–248. | ||
Hilde JM, Skjorten I, Grotta OJ, et al. Right ventricular dysfunction and remodeling in chronic obstructive pulmonary disease without pulmonary hypertension. J Am Coll Cardiol. 2013;62(12):1103–1111. | ||
Lang RM, Bierig M, Devereux RB, et al. Recommendations for chamber quantification: a report from the American Society of Echocardiography’s Guidelines and Standards Committee and the Chamber Quantification Writing Group, developed in conjunction with the European Association of Echocardiography, a branch of the European Society of Cardiology. J Am Soc Echocardiogr. 2005;18(12):1440–1463. | ||
Nagueh SF, Appleton CP, Gillebert TC, et al. Recommendations for the evaluation of left ventricular diastolic function by echocardiography. Eur J Echocardiogr. 2009;10(2):165–193. | ||
Galie N, Humbert M, Vachiery JL, et al. 2015 ESC/ERS Guidelines for the diagnosis and treatment of pulmonary hypertension: The Joint Task Force for the Diagnosis and Treatment of Pulmonary Hypertension of the European Society of Cardiology (ESC) and the European Respiratory Society (ERS): Endorsed by: Association for European Paediatric and Congenital Cardiology (AEPC), International Society for Heart and Lung Transplantation (ISHLT). Eur Heart J. 2016;37(1):67–119. | ||
Chaouat A, Bugnet AS, Kadaoui N, et al. Severe pulmonary hypertension and chronic obstructive pulmonary disease. Am J Respir Crit Care Med. 2005;172(2):189–194. | ||
Skjorten I, Hilde JM, Melsom MN, Hansteen V, Steine K, Humerfelt S. Pulmonary artery pressure and PaO2 in chronic obstructive pulmonary disease. Respir Med. 2013;107(8):1271–1279. | ||
Degani-Costa LH, Levarge B, Digumarthy SR, Eisman AS, Harris RS, Lewis GD. Pulmonary vascular response patterns during exercise in interstitial lung disease. Eur Respir J. 2015;46(3):738–749. | ||
Argiento P, Vanderpool RR, Mule M, et al. Exercise stress echocardiography of the pulmonary circulation: limits of normal and sex differences. Chest. 2012;142(5):1158–1165. | ||
Oliveira RK, Agarwal M, Tracy JA, et al. Age-related upper limits of normal for maximum upright exercise pulmonary haemodynamics. Eur Respir J. 2016;47(4):1179–1188. | ||
Kovacs G, Olschewski A, Berghold A, Olschewski H. Pulmonary vascular resistances during exercise in normal subjects: a systematic review. Eur Respir J. 2012;39(2):319–328. | ||
Naeije R, Boerrigter BG. Pulmonary hypertension at exercise in COPD: does it matter? Eur Respir J. 2013;41(5):1002–1004. | ||
Coghlan JG, Bogaard HJ. Exercise pulmonary haemodynamics: a test in search of purpose. Eur Respir J. 2016;47(5):1315–1317. | ||
Naeije R, Vonk Noordegraaf A, Kovacs G. Exercise-induced pulmonary hypertension: at last! Eur Respir J. 2015;46(3):583–586. | ||
Kessler R, Faller M, Weitzenblum E, et al. “Natural history” of pulmonary hypertension in a series of 131 patients with chronic obstructive lung disease. Am J Respir Crit Care Med. 2001;164(2):219–224. | ||
Kovacs G, Avian A, Wutte N, et al. Changes in pulmonary exercise haemodynamics in scleroderma: a 4-year prospective study. Eur Respir J. 2017;50(1):1601708. | ||
Boerrigter BG, Waxman AB, Westerhof N, Vonk-Noordegraaf A, Systrom DM. Measuring central pulmonary pressures during exercise in COPD: how to cope with respiratory effects. Eur Respir J. 2014;43(5):1316–1325. | ||
Kovacs G, Avian A, Pienn M, Naeije R, Olschewski H. Reading pulmonary vascular pressure tracings. How to handle the problems of zero leveling and respiratory swings. Am J Respir Crit Care Med. 2014;190(3):252–257. |
 © 2018 The Author(s). This work is published and licensed by Dove Medical Press Limited. The full terms of this license are available at https://www.dovepress.com/terms.php and incorporate the Creative Commons Attribution - Non Commercial (unported, v3.0) License.
By accessing the work you hereby accept the Terms. Non-commercial uses of the work are permitted without any further permission from Dove Medical Press Limited, provided the work is properly attributed. For permission for commercial use of this work, please see paragraphs 4.2 and 5 of our Terms.
© 2018 The Author(s). This work is published and licensed by Dove Medical Press Limited. The full terms of this license are available at https://www.dovepress.com/terms.php and incorporate the Creative Commons Attribution - Non Commercial (unported, v3.0) License.
By accessing the work you hereby accept the Terms. Non-commercial uses of the work are permitted without any further permission from Dove Medical Press Limited, provided the work is properly attributed. For permission for commercial use of this work, please see paragraphs 4.2 and 5 of our Terms.