")
Back to Journals » Clinical Epidemiology » Volume 12
Excess Body Weight and Incidence of Type 1 and Type 2 Endometrial Cancer: The Norwegian Women and Cancer Study
Authors Sollberger TL, Gavrilyuk O , Rylander C
Received 14 March 2020
Accepted for publication 5 June 2020
Published 31 July 2020 Volume 2020:12 Pages 815—824
DOI https://doi.org/10.2147/CLEP.S253866
Checked for plagiarism Yes
Review by Single anonymous peer review
Peer reviewer comments 2
Editor who approved publication: Professor Irene Petersen
Tanja Lise Sollberger,1 Oxana Gavrilyuk,2 Charlotta Rylander3
1Department of Anesthesiology, University Hospital of North Norway, Tromsø, Norway; 2Department of Clinical Oncology, Norwegian Radium Hospital, Oslo, Norway; 3Department of Community Medicine, UiT the Arctic University of Norway, Tromsø, Norway
Correspondence: Charlotta Rylander
Department of Community Medicine, UiT the Arctic University of Norway, Tromsø 9037, Norway
Tel +47 77644831
Email [email protected]
Purpose: Excess body weight has been associated with increased risk of 13 cancer types and is a particularly strong risk factor for endometrial cancer (EC). Only a few previous studies have assessed the relationship between excess body weight and EC subtypes. In this study, we aimed to investigate the associations between excess weight and incidence of type 1 and type 2 EC.
Patients and Methods: We used data from 151,537 participants in the Norwegian Women and Cancer (NOWAC) cohort of which 935 were diagnosed with type 1 and 263 with type 2 EC during follow-up. Height and body weight were self-reported. Multivariable Cox proportional hazard regression was used to assess the associations between body mass index (BMI) and type 1 and type 2 EC.
Results: For every 2 kg/m2 increase in BMI, the risk of type 1 EC increased by 21% (HR=1.21, 95% CI: 1.18, 1.24) and the risk of type 2 EC by 10% (HR=1.10, 95% CI: 1.03, 1.16) (pheterogeneity = 0.009). During the period 1991 to 2016, 24.0% (95% CI: 20.0% to 27.8%) of type 1 EC cases was attributable to excess body weight. Avoiding obesity could have prevented 6.6% (95% CI: 3.4% to 9.7%) of type 2 EC cases.
Conclusion: Excess body weight was associated with both type 1 and type 2 EC in a dose-dependent manner and the association was significantly stronger in type 1 EC. These findings could support the hypothesis that estrogen plays a more important role in the development of type 1 ECs than in type 2 EC.
Keywords: obesity, overweight, cancer of the corpus uteri, uterus cancer, subtypes, body fatness
Introduction
Over the last 40 years, the prevalence of obesity (body mass index [BMI] ≥30.0 kg/m2) has nearly tripled worldwide and reached 39% in adults in 2016.1 Norway is no exception, and the latest regional health examinations in Northern Norway reported an obesity prevalence of 20.9% in men and 18.5% in women in 2007–08.2 Similar or higher estimates have been reported from another regional health survey in Norway.3
Excess body weight, here defined as body mass index (BMI) ≥25.0 kg/m2, is a risk factor for several lifestyle diseases including different types of cancer.4 Endometrial cancer (EC) stands out to have a particularly strong association with excess weight.4–7 EC is traditionally divided into two main subtypes, type 1 and type 2 EC, based on differences in clinical and histological observations.8 This dualistic model describes in general two pathways of carcinogenesis; however, the classification into type 1 and type 2 EC has been debated and new methods like immunohistochemical and genetic analyses have challenged this simplistic categorization.9 Previous research has reported differences in risk factors between the two subtypes, including excess body weight; however, several studies had also limited sample size which restrained their ability to address the associations with type 2 EC.10–16 A recent meta-analysis concluded that there are highly suggestive evidence for an association between obesity and type 1 and type 2 EC.17 Others have called for more studies addressing the associations between obesity and histological and molecular subtypes of EC.7 As the prognosis of the two subtypes are vastly different and the prevalence of overweight and obesity continues to increase, further investigations of the associations between excess body weight and subtype-specific EC in large prospective cohort studies are highly relevant. Thus, the main aim of this study was to assess the associations between excess body weight and type 1 and type 2 EC, in a large population-based cohort of Norwegian women.
Patients and Methods
Study Design and Participants
The Norwegian Women and Cancer (NOWAC) study is a national population-based cohort study initiated in 1991 with the aim of exploring associations between lifestyle and cancer among Norwegian women.18 Women aged 30–70 years were randomly selected from the National Registry and invited to participate in the study through a mailed invitation letter to their home address that also included a detailed questionnaire. The overall response rate in NOWAC was 53% and the external validity has been proven to be good.19
Totally 172,472 women completed the first questionnaire in 1991–2007 and were qualified for inclusion in the study. Participants who died or emigrated before the start of follow-up (n=31), past or prevalent cancer cases (other than non-melanoma skin cancer) at enrolment (n=6681), women reporting hysterectomy (n=9992) and those with missing information on height and/or weight (n=4124) were excluded. Further, women with implausible information on age at menarche (<8 years or >20 years), age at first birth (<12 years), age at menopause (<25 years or >60 years) (n=108), height or weight (height <100 cm or >230 cm; weight <30 kg or >200 kg) (n=4) were also excluded. Thus, the final study sample included 151,532 women from whom complete information about height and weight at baseline were available (Figure 1).
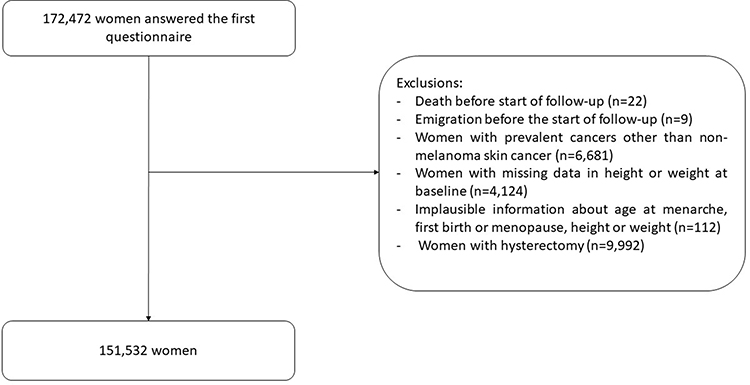 |
Figure 1 Flowchart of study participants. |
Cancer Incidence, Death, and Emigration
The NOWAC study receives annual updates from the Cancer Registry of Norway in order to identify study participants diagnosed with cancer during the preceding year. Information on the date of diagnosis and histology of the tumor is also included. In the present study, women diagnosed with a first primary invasive malignant neoplasm of the uterus (International Classification of Diseases 10th Revision [ICD-10]: C54) were identified. Endometrial cancer cases were identified from morphology codes 8380, 8382, 8480, 8481, 8560, 8570, 8020, 8041, 8045, 8255, 8310, 8441, 8460 or 8323 from the International Classification of Disease for Oncology ICD-O-3. The classification into type 1 and type 2 EC was based on the FIGO Cancer report about cancer of the corpus uteri, the WHO Classification of Tumors as well as literature reviews.20,21 Type 1 EC grade 3+ tumors were classified as type 2 EC. Information about deaths and emigration was extracted from the Causes of Death Registry and the National Registry. The end of follow-up was December 31, 2016.
Assessment of Body Mass Index and Covariates
BMI was calculated from self-reported information on weight and height and categorized into four groups: underweight; BMI <18.5 kg/m2, normal weight; 18.5≤ BMI <25.0 kg/m2, overweight; 25.0 ≤ BMI <30.0 kg/m2 and obesity BMI >30.0kg/m.222 Cigarette smoking (never, ever and current smoking), diabetes mellitus (DM; no, yes), physical activity (PA) level (low, medium and high), coffee consumption (1 to <4, ≥4 to <8, ≥8 cups/day), education level (<10 years, 10–12 years and >12 years), age at menarche (≤12 years, 13–14 years and ≥15 years), menopausal status (premenopausal, perimenopausal, postmenopausal and unknown), use of oral contraceptives (OC, never, ever), use of hormonal intrauterine device (IUD, never, ever) and menopausal hormone therapy (MHT, never, ever) were considered as potential covariates. In addition, we included information about hormonal intrauterine device (IUD) and a combined variable of age at first full-term pregnancy and parity (nullipara; age at first birth <30 years and one child; age at first birth ≥30 years and one child; two or more children and age at first birth <30 years and two or more children and age at first birth ≥30 years).
Statistical Analysis
Differences in demographics and lifestyle across BMI categories at baseline were assessed with one-way ANOVA, t-tests and chi-square tests. Cox proportional hazard regressions were used to explore the associations between BMI as continuous and categorical exposure metrics and the incidence rates of type 1 and type 2 EC while controlling for potential confounding variables. Age was used as timescale. Entry time was age at inclusion, and exit time was age at cancer diagnosis, death, emigration, hysterectomy or end of follow-up, whichever occurred first. To determine which covariates to include in the two regression models, we drew a directed acyclic graph (DAG) including excess body weight, PA, smoking, DM, coffee consumption, education, age at menarche, parity combined with age at first birth, menopause status, OC, IUD, MHT, and EC (Figure 2). The DAG assumes a causal effect of excess body weight on EC, indicated by the direct arrow from excess body weight to EC.23 We assumed that age, PA, smoking, menopausal status, age at first birth/parity and education were common causes of excess body weight and EC (confounders), and were therefore included in the regression models. Age at menarche was related to excess body weight during adulthood via the unmeasured variable “excess body weight during childhood” but had no direct effect on adult excess body weight. However, to close the backdoor path “adult excess body weight-excess body weight during childhood-age at menarche- EC”, we had to adjust our models for age at menarche. The other variables (IUD, DM, OC, MHT, coffee consumption) were mediators and not included in the regression models. For instance, we assumed that excess body weight is a cause of DM that in turn increases the risk of EC.
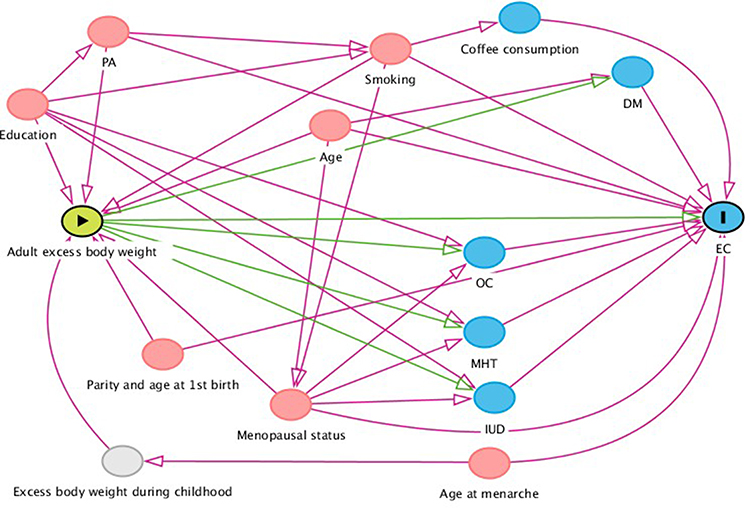 |
Figure 2 Directed acyclic graph (DAG) illustrating the assumptions about the causal relationship between excess body weight and endometrial cancer (EC). Red circles indicate confounders, blue circles mediators/colliders. The grey circle refers to an unmeasured variable. Abbreviations: DM, diabetes mellitus; EC, endometrial cancer; IUD, intrauterine device; MHT, menopausal hormone therapy; PA, physical activity; OC, oral contraceptives. |
We fitted one regression model per EC subtype. Women who were diagnosed with another EC type were censored at the time of diagnosis (standard competing risk framework). To test for linear trend across BMI groups, the group identifier was replaced by the median BMI of each group and included in the multivariable models. To evaluate whether the association between excess body weight and EC varied between type 1 and type 2 EC, we used a chi-squared (contrast) test.24 Additionally, to model the relationship between EC risk and BMI in continuous scale and to allow for non-linear effects, we fitted regression models with natural cubic spline transformations (4 knots) of the exposure variable (BMI). The knots were placed at equally spaced percentiles. We evaluated non-linearity by testing the null hypothesis of the second and third spline coefficients jointly equalled zero. Due to the limited number of type 2 EC cases, we did not evaluate interactions. Participants were excluded from the analysis if they had missing information on any of the included variables. Departures from the proportional hazard assumption were assessed by inspection of the Schoenfeldt’s residuals and Nelson-Aalen plots.
We performed two sensitivity analyses based on different definitions of type 1 and type 2 EC. The first sensitivity analysis categorized all type 1 EC with grade 3+ as type 1 EC, instead of as type 2 EC.13,14,25,26 The second sensitivity analysis grouped all tumors with morphology code 8140 (EC-not other specified [NOS]) as type 1 EC, except all grade 3+ tumours that were classified as type 2 EC.10,25,26
By assuming a causal relationship between exposure and outcome as well as independence between risk factors, it is possible to estimate the population attributable fraction (PAF) in a national representative cohort like the NOWAC study. PAF describes the preventable proportion of the disease incidence related to the exposure over a certain time-period.27 To estimate the burden of type 1 and type 2 EC attributable to excess body weight, we calculated PAF with 95% confidence intervals using the PUNAFCC Stata package. We estimated PAF for two hypothetical scenarios; i) the proportion of incident cases that could have been prevented if overweight or obese women were of normal or underweight, and ii) the proportion of incident cases that could have been prevented by avoiding obesity.
A two-sided p-value of 0.05 or less was considered statistically significant. All statistical analyses were performed using STATA Version 15.1 (Stata Corp LLC, Texas, USA).
Results
The majority (63.8%) of study participants were of normal weight; 26.0% overweight, 8.1% obese and 2.1% underweight. Participants with excess body weight (BMI ≥ 25.0 kg/m2) were older, more likely to be never or former smokers, less likely to be physically active, reported higher prevalence of DM, lower coffee consumption and lower education level than women in normal weight. Further, women with excess body weight experienced earlier menarche, were more likely to be postmenopausal, used less often OC and more often MHT compared to women in normal weight. There was no difference in use of IUD between women with excess body weight and women in normal weight (Table 1).
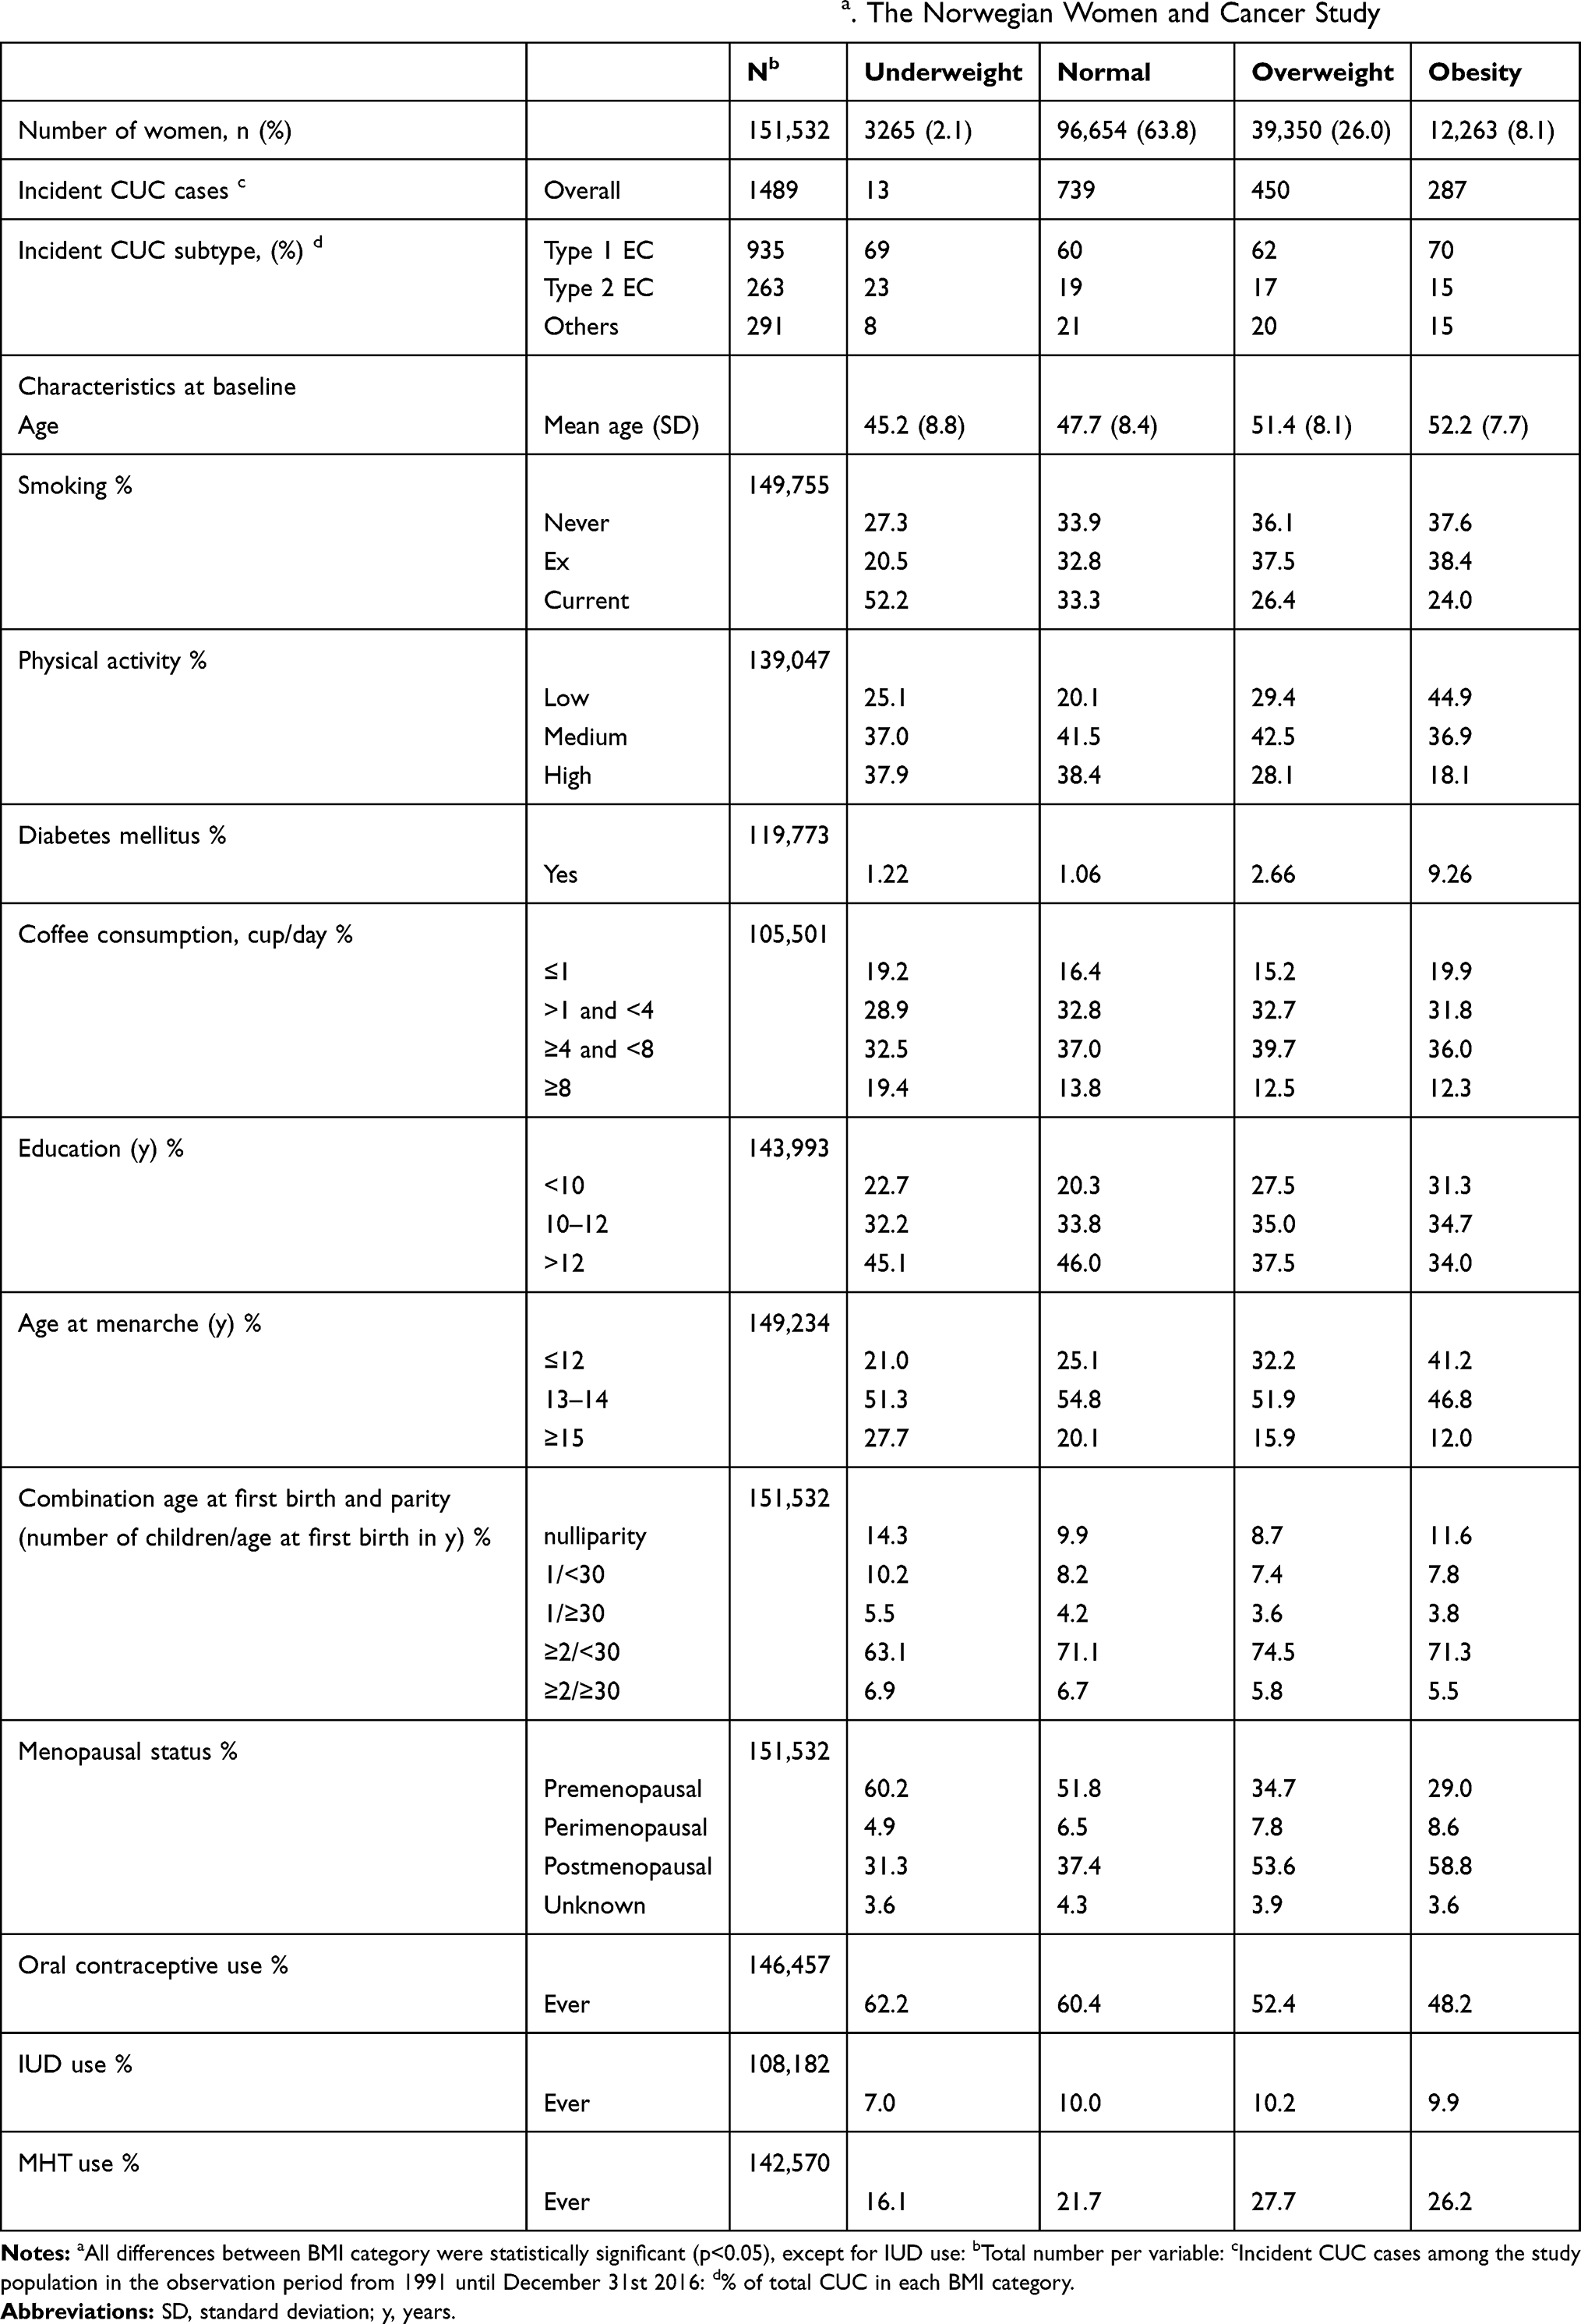 |
Table 1 Demographic Characteristics of the Study Sample at Baselinea. The Norwegian Women and Cancer Study |
During the mean follow-up time of 18 years, 1489 incident cases of cancer of the corpus uteri (CUC) were diagnosed, of which 935 were classified as type 1 EC, 263 as type 2 EC and 291 were other CUCs. The mean age at diagnosis was 62.3 (standard deviation [SD] 7.3) years for type 1 EC and 63.3 (SD 7.3) years for type 2 EC.
Compared with women in normal weight, women with overweight had 49% increased risk of type 1 EC (HR=1.49, 95% CI: 1.26, 1.76) but no increased risk of type 2 EC (HR=1.11, 95% CI: 0.81, 1.52) (pheterogeneity = 0.109). Women with obesity had more than three times higher incidence of type 1 EC (HR=3.31, 95% CI: 2.73, 4.02) and 89% higher rate of type 2 EC (HR=1.89, 95% CI: 1.26, 2.85) (pheterogeneity = 0.015). There were linear trends in risk estimates of type 1 (ptrend<0.001) and type 2 (ptrend=0.006) EC across BMI groups, and there were no evidence of non-linear effects (Figure 3). Every 2 kg/m2 increase in BMI was associated with 21% (HR=1.21, 95% CI: 1.18, 1.24) increased risk of type 1 EC and 10% (HR=1.10, 95% CI: 1.03, 1.16) increased risk of type 2 EC (pheterogeneity = 0.009). All models fulfilled the assumptions of proportional hazards.
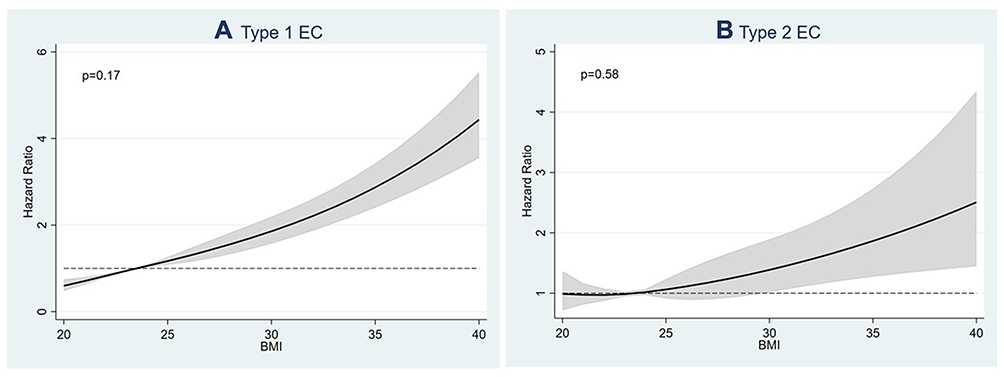 |
Figure 3 Associations between body mass index (BMI) and (A) type 1 and (B) type 2 endometrial cancer (EC). BMI is modelled as a continuous exposure metric using restricted cubic spline transformations with 4 knots. The p-value corresponds to the null hypothesis that the regression coefficient for the second and third spline transformations equaled zero, ie, a test of non-linearity. |
When all type 1 EC with grade 3+ were classified as type 1 EC, we found a significant increased risk of type 1 EC (per 2 kg/m2 increase: HR=1.19, 95% CI: 1.17, 1.22), but not of type 2 EC (HR=1.07, 95% CI: 0.98, 1.18) (pheterogeneity=0.027). Further, when classifying all tumours with histological code “8140” (adenocarcinoma, NOS) as type 1 EC, the risk of type 1 EC increased by 20% per 2 kg/m2 increase in BMI (HR=1.20, 95% CI: 1.18, 1.23) and the risk of type 2 EC by 10% (HR=1.11, 95% CI: 1.04, 1.16) (pheterogeneity=0.003).
Given a causal relationship, preventing excess body weight could have avoided 24.1% (95% CI: 20.1% to 28.0%) of type 1 EC cancers among Norwegian women from 1991 to 2016. If women with obesity had been of over-, normal- or underweight, 13.5% (95% CI: 12.2% to 14.9%) of type 1 EC could have been prevented. The estimate for the proportion of avoidable type 2 EC cases by preventing excess body weight was 9.4% (95% CI: 0.0% to 18.2%), whereas avoiding obesity could have prevented 6.6% (95% CI: 3.4% to 9.7%) of type 2 EC cases (Table 3).
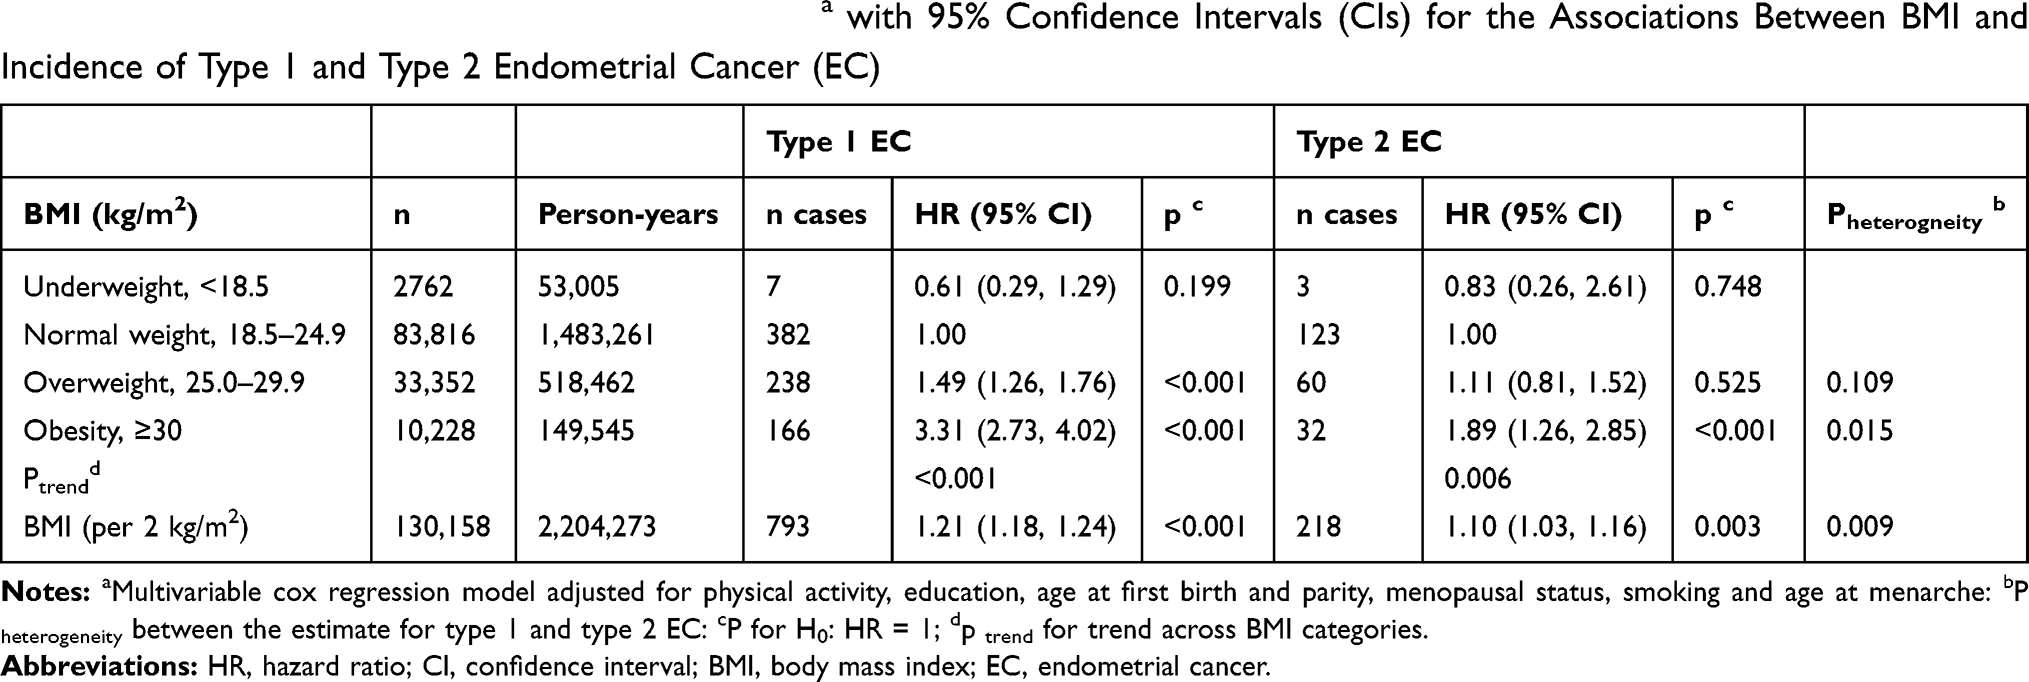 |
Table 2 Multivariable Adjusted Hazard Ratios (HRs)a with 95% Confidence Intervals (CIs) for the Associations Between BMI and Incidence of Type 1 and Type 2 Endometrial Cancer (EC) |
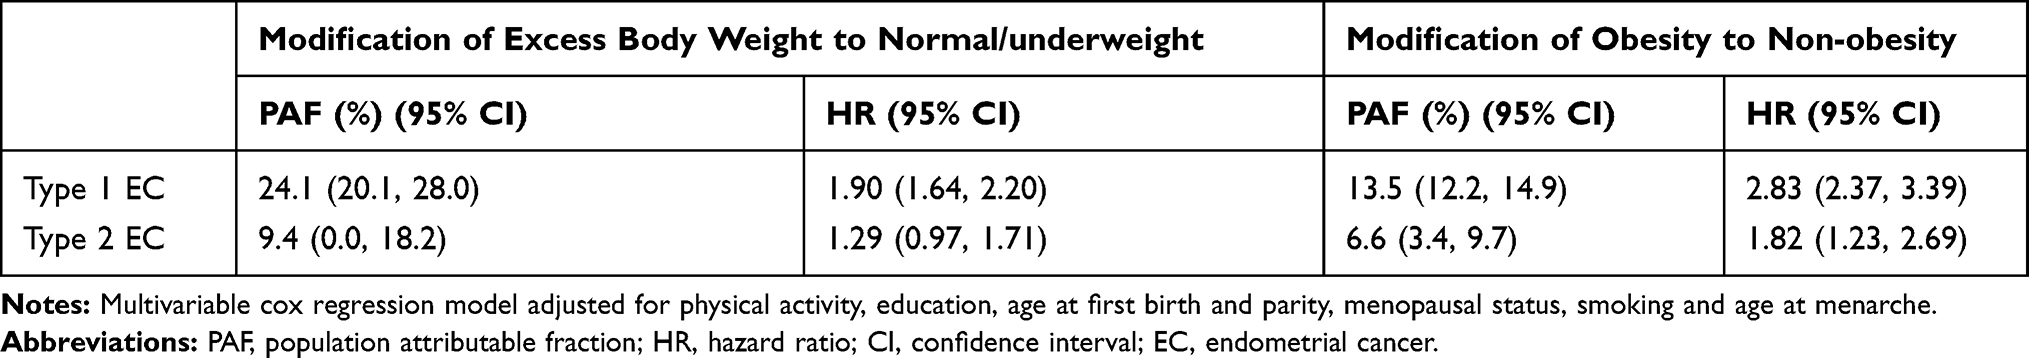 |
Table 3 Population Attributable Fractions (PAF) and 95% Confidence Intervals (CI) of Type 1 and 2 Endometrial Cancer (EC) in Women in Norway in 1991–2016 Attributable to Excess Body Weight and Obesity |
Discussion
In this study of 151,532 women from Norway, we found that excess body weight was associated with both type 1 and type 2 EC in a dose-dependent manner. For each 2 kg/m2 increase in BMI, the incidence rates of type 1 and type 2 EC increased by 21% and 10%, respectively, and the association was significantly stronger in type 1 EC than in type 2 EC. Assuming a causal effect of excess body weight on EC, we estimated that almost every fourth case of type 1 EC in Norway in 1991–2016 could have been prevented, if women had avoided excess weight. For type 2 EC, almost 7% of the disease incidence in that same period was attributable to obesity. The PAF estimate for type 2 EC for the modification of overweight and obesity to normal/underweight was borderline significant, clearly driven by the non-significant association between overweight and type 2 EC (Tables 2 and 3). Important, our baseline questionnaire was collected in 1991–2008 and the prevalence of obesity among the participants was only 8% by that time, which is relatively low compared to more recent numbers reported from regional health examinations in Norway.2,3 As the PAF is dependent on the prevalence of exposure, one could expect a larger impact of excess body weight on the burden of type1 and type 2 EC today and in the future. Thus, our results clearly emphasize the preventive potential of maintaining a healthy weight, also in regards to type 2 EC, which has a much poorer prognosis than type 1 EC.1–3
Our results of positive and significant associations between excess body weight and both type 1 and type 2 EC, and a significantly stronger association with type 1 EC, are in line with several previous studies.11,12,14,15,28–30 For instance, in a pooled analysis with individual-level data from 24 studies, Setiawan and colleagues showed that BMI was significantly and positively associated with both type 1 and type 2 ECs, and that the association was significantly stronger in type 1 EC.10 Additionally, a recent meta-analysis also concluded that both subtypes are associated with obesity.17 Collectively, our results clearly indicate that excess body weight is a risk factor not only for type 1 EC but also for type 2 EC. The fact that the association seems stronger in type 1 EC may indicate that estrogens are more important for the development of type 1 EC than for type 2.
A challenge when studying risk factors for EC subtypes is the classification of EC into type 1 and type 2 as there is no common definition. In this study, we classified all type 1 ECs with grade 3+ as type 2 EC, in addition to the type 2 tumors confirmed by histology, in accordance with recommendations from the American Cancer Society, the FIGO cancer report and several other reports.31–34 From a clinical point of view, grade 3+ tumors behave like type 2 ECs, as they are more aggressive than grade 1 and grade 2 endometrioid ECs. Nevertheless, we conducted two sensitivity analyses to explore the effects of different classifications. When all tumors were classified according to their histological profile and the grade was not taken into account, we observed a significantly stronger association between BMI and type 1 EC compared to type 2 EC (pheterogeneity=0.027). However, BMI was no longer significantly associated with type 2 EC HR=1.07 (95% CI: 0.98, 1.17), which may be explained by the considerably smaller number of type 2 tumors using this classification (n=103) compared to the other (n=218). This is in line with McCollough et al that observed a positive association between BMI and type 2 EC, although the association was driven by high-grade endometrioid tumors (type 1 grade 3 tumors) that were classified as type 2 EC. There was a low number of type 2 tumors determined from histology only, which limited further analyses in that study.11
In our second sensitivity analysis, 8140 (adenocarcinoma NOS) tumors were classified as type 1 EC, whereas in the main analysis they were excluded. The result from this analysis is in line with our main findings, showing positive associations between increasing BMI and both EC subtypes, and a significantly stronger association with type 1 EC. Thus, in this study, the choice of including or excluding adenocarcinoma NOS did not affect our conclusions. However, the previous sensitivity analysis clearly showed that the choice of classification may have a large impact on the conclusions from a study as we observed no significant association between BMI and type 2 EC when grade 3+ type 1 EC tumors were classified as type 1 EC. A crucial first step for the classification is the histological determination by a pathologist. Already here, the agreement between different pathologists is moderate (the interobserver agreement for the FIGO system κ = 0.41) and several studies have confirmed limited reproducibility in determination of histological code and grading of ECs.31–33,35 However, the reproducibility was improved when a binary grading system was used that divided tumors into low-grade and high-grade lesions. Still, the cut-off between grades 2 and 3 is not always clear and an objective for discussions.31,36,37 An additional challenge is that researchers do not always describe the histological codes and their classification in detail, which may lead to misunderstandings and challenges to compare results across studies. This could easily be avoided if all studies reported their classification by means of ICD-O-3 codes.
The strengths of this study include the large and national representative sample, the linkage to national registries that ensures complete information about death, emigration and cancer diagnosis and the detailed information about sociodemographic, reproductive and lifestyle variables that we included in our analyses. However, the information from the Cancer Registry of Norway was limited to the histological and morphological codes. There were no possibilities to review the histological slides and discuss the classification and determination of type 1 and type 2 EC with the help of this information. For the same reason, it was not possible to assess BMI in relation to the distinct molecular subgroups of EC based on the cancer genome atlas (TCGA), which could be seen upon as a limitation of the study as type 1 and type 2 EC have different molecular features.38
As NOWAC is representative for the general female population, we had the opportunity to estimate PAFs for excess body weight in relation to EC subtypes, which is rare and provides an estimate that is easily communicated to the public. Nevertheless, the PAF calculation did not account for death as a competing risk, and therefore our PAF estimates could have been slightly overestimated. It is also important to emphasize that the PAF estimate is derived from an observational study and not from a randomized controlled trial. It should therefore be interpreted with caution, as we cannot fully disregard that our study was not affected by unmeasured confounding, and/or information bias that could influence the inferences. For instance, height and weight were self-reported which could introduce potential misclassification. The accuracy of the self-reported information on weight and height in NOWAC has however been validated and discrepancies between self-reported and directly measured BMI in women were small.39 Despite under-reporting in the overweight and obese group, the authors concluded that the self-reported weight and height data provided a valid ranking of BMI of middle-aged Norwegian women. Further, we can assume that potential misclassification of height and weight is non-differential between EC cases and non-cases, as the information about height and weight was collected prior to the diagnosis of the disease.
Conclusion
This study adds to the evidence that excess body weight is a risk factor for both type 1 and type 2 EC, although the association is significantly stronger in type 1 EC.
Abbreviations
CI, confidence interval; CUC, cancer of the uterine corpus; DAG, directed acyclic graphs; DM, diabetes mellitus; BMI, body mass index; EC, Endometrial cancer; FIGO, International Federation of Gynecology and Obstetrics; HR, hazard ratio; ICD, International classification of diseases and related health problems; ICD-O, International classification of diseases for oncology; IUD, intrauterine device; MHT, menopausal hormone therapy; NOWAC, the Norwegian Women and Cancer study; OC, oral contraceptives; PAF, population attributable fraction; SD, standard deviation.
Data Sharing Statement
To access the data supporting the findings presented, kindly contact the person in charge of the NOWAC Study (https://site.uit.no/nowac/contact-information/).
Ethical Approval and Informed Consent
The NOWAC study was approved by the Regional Committee for Medical Research Ethics and the Norwegian Data Inspectorate (P REK NORD 141/2008) and was performed in accordance with the Declaration of Helsinki. All participants provided written informed consent.
Acknowledgments
The authors thank the staff and participants of the NOWAC study for their valuable contributions.
Author Contributions
All authors contributed to data analysis, drafting or revising the article, gave final approval of the version to be published, and agree to be accountable for all aspects of the work.
Disclosure
The authors report no conflicts of interest in this work.
References
1. World Health Organization. Obesity and overweight. [Published 2018;
2. Jacobsen BK, Aars NA. Changes in body mass index and the prevalence of obesity during 1994–2008: repeated cross-sectional surveys and longitudinal analyses. The tromso study. BMJ Open. 2015;5(6):e007859. doi:10.1136/bmjopen-2015-007859
3. Midthjell K, Lee CM, Langhammer A, et al. Trends in overweight and obesity over 22 years in a large adult population: the HUNT Study, Norway. Clin Obes. 2013;3(12):12–20. doi:10.1111/cob.12009
4. Lauby-Secretan B, Scoccianti C, Loomis D, Grosse Y, Bianchini F, Straif K. Body fatness and cancer – viewpoint of the IARC working group. N Engl J Med. 2016;375(8):794–798. doi:10.1056/NEJMsr1606602
5. Bhaskaran K, Douglas I, Forbes H, dos-Santos-Silva I, Leon DA, Smeeth L. Body-mass index and risk of 22 specific cancers: a population-based cohort study of 5.24 million UK adults. Lancet. 2014;384(9945):755–765. doi:10.1016/S0140-6736(14)60892-8
6. Renehan AG, Soerjomataram I, Tyson M, et al. Incident cancer burden attributable to excess body mass index in 30 European countries. Int J Cancer. 2010;126(3):692–702. doi:10.1002/ijc.24803
7. Shaw E, Farris M, McNeil J, Friedenreich C. Obesity and endometrial cancer. Recent Results Cancer Res. 2016;208:107–136.
8. Bokhman JV. Two pathogenetic types of endometrial carcinoma. Gynecol Oncol. 1983;15(1):10–17. doi:10.1016/0090-8258(83)90111-7
9. Suarez AA, Felix AS, Cohn DE. Bokhman Redux: endometrial cancer “types” in the 21st century. Gynecol Oncol. 2017;144(2):243–249. doi:10.1016/j.ygyno.2016.12.010
10. Setiawan VW, Yang HP, Pike MC, et al. Type I and II endometrial cancers: have they different risk factors? J Clin Oncol. 2013;31(20):2607–2618. doi:10.1200/JCO.2012.48.2596
11. McCullough ML, Patel AV, Patel R, et al. Body mass and endometrial cancer risk by hormone replacement therapy and cancer subtype. Cancer Epidemiol Biomarkers Prev. 2008;17(1):73–79. doi:10.1158/1055-9965.EPI-07-2567
12. Felix AS, Weissfeld JL, Stone RA, et al. Factors associated with Type I and Type II endometrial cancer. Cancer Causes Control. 2010;21(11):1851–1856. doi:10.1007/s10552-010-9612-8
13. Yang HP, Wentzensen N, Trabert B, et al. Endometrial cancer risk factors by 2 main histologic subtypes: the NIH-AARP diet and health study. Am J Epidemiol. 2013;177(2):142–151. doi:10.1093/aje/kws200
14. Amankwah EK, Friedenreich CM, Magliocco AM, et al. Anthropometric measures and the risk of endometrial cancer, overall and by tumor microsatellite status and histological subtype. Am J Epidemiol. 2013;177(12):1378–1387. doi:10.1093/aje/kws434
15. Lindemann K, Vatten LJ, Ellstrom-Engh M, Eskild A. The impact of BMI on subgroups of uterine cancer. Br J Cancer. 2009;101(3):534–536. doi:10.1038/sj.bjc.6605158
16. Kawachi A, Shimazu T, Budhathoki S, et al. Association of BMI and height with the risk of endometrial cancer, overall and by histological subtype: a population-based prospective cohort study in Japan. Eur J Cancer Prev. 2019;28(3):196–202. doi:10.1097/CEJ.0000000000000449
17. Kalliala I, Markozannes G, Gunter MJ, et al. Obesity and gynaecological and obstetric conditions: umbrella review of the literature. BMJ. 2017;359:j4511. doi:10.1136/bmj.j4511
18. Lund E, Dumeaux V, Braaten T, et al. Cohort profile: the Norwegian Women and Cancer Study–NOWAC–Kvinner og kreft. Int J Epidemiol. 2008;37(1):36–41. doi:10.1093/ije/dym137
19. Lund E, Kumle M, Braaten T, et al. External validity in a population-based national prospective study – the Norwegian Women and Cancer Study (NOWAC). Cancer Causes Control. 2003;14(10):1001–1008. doi:10.1023/B:CACO.0000007982.18311.2e
20. Amant F, Mirza MR, Koskas M, Creutzberg CL. Cancer of the corpus uteri. Int J Gynaecol Obstet. 2015;131(Suppl 2):S96104. doi:10.1016/j.ijgo.2015.06.005
21. Kurman RJ, Carcangiu ML, Herrington CS, Young RH, eds. WHO Classification of Tumours of Female Reproductive Organs. 6. Lyon, France: International Agency for Research on Cancer; 2014.
22. World Health Organization. Physical status: the use and interpretation of anthropometry. Geneva 1995. Technical report Series No. 854. Available from: https://www.who.int/childgrowth/publications/physical_status/en/.
23. Hernán MA, Robins JM. Graphical representation of causal effects. In: Causal Inference: What If. Boca Raton: Chapman & Hall/CRC; 2020:69–82.
24. Wang M, Spiegelman D, Kuchiba A, et al. Statistical methods for studying disease subtype heterogeneity. Stat Med. 2016;35(5):782–800. doi:10.1002/sim.6793
25. Uccella S, Mariani A, Wang AH, et al. Dietary and supplemental intake of one-carbon nutrients and the risk of type I and type II endometrial cancer: a prospective cohort study. Ann Oncol. 2011;22(9):2129–2136. doi:10.1093/annonc/mdq724
26. Borch KB, Weiderpass E, Braaten T, Jareid M, Gavrilyuk OA, Licaj I. Physical activity and risk of endometrial cancer in the Norwegian Women and Cancer (NOWAC) study. T J Cancer. 2017;140(8):1809–1818.
27. Rockhill B, Newman B, Weinberg C. Use and misuse of population attributable fractions. Am J Public Health. 1998;88(1):15–19. doi:10.2105/AJPH.88.1.15
28. Crosbie EJ, Zwahlen M, Kitchener HC, Egger M, Renehan AG. Body mass index, hormone replacement therapy, and endometrial cancer risk: a meta-analysis. Cancer Epidemiol Biomarkers Prev. 2010;19(12):3119–3130. doi:10.1158/1055-9965.EPI-10-0832
29. Bjorge T, Engeland A, Tretli S, Weiderpass E. Body size in relation to cancer of the uterine corpus in 1 million Norwegian women. Int J Cancer. 2007;120(2):378–383. doi:10.1002/ijc.22260
30. Stevens VL, Jacobs EJ, Patel AV, Sun J, Gapstur SM, McCullough ML. Body weight in early adulthood, adult weight gain, and risk of endometrial cancer in women not using postmenopausal hormones. Cancer Causes Control. 2014;25(3):321–328. doi:10.1007/s10552-013-0333-7
31. Clarke BA, Gilks CB. Endometrial carcinoma: controversies in histopathological assessment of grade and tumour cell type. J Clin Pathol. 2010;63(5):410–415. doi:10.1136/jcp.2009.071225
32. McAlpine J, Leon-Castillo A, Bosse T. The rise of a novel classification system for endometrial carcinoma; integration of molecular subclasses. J Pathol. 2018;244(5):538–549. doi:10.1002/path.5034
33. Han G, Sidhu D, Duggan MA, et al. Reproducibility of histological cell type in high-grade endometrial carcinoma. Mod Pathol. 2013;26(12):1594–1604. doi:10.1038/modpathol.2013.102
34. Creasman WT, Kohler MF, Odicino F, Maisonneuve P, Boyle P. Prognosis of papillary serous, clear cell, and grade 3 stage I carcinoma of the endometrium. Gynecol Oncol. 2004;95(3):593–596. doi:10.1016/j.ygyno.2004.08.019
35. Scholten AN, Smit VT, Beerman H, van Putten WL, Creutzberg CL. Prognostic significance and interobserver variability of histologic grading systems for endometrial carcinoma. Cancer. 2004;100(4):764–772. doi:10.1002/cncr.20040
36. Alvarez T, Miller E, Duska L, Oliva E. Molecular profile of grade 3 endometrioid endometrial carcinoma: is it a type I or type II endometrial carcinoma? T Am J Surg Pathol. 2012;36(5):753–761. doi:10.1097/PAS.0b013e318247b7bb
37. Lax SF, Kurman RJ, Pizer ES, Wu L, Ronnett BM. A binary architectural grading system for uterine endometrial endometrioid carcinoma has superior reproducibility compared with FIGO grading and identifies subsets of advance-stage tumors with favorable and unfavorable prognosis. Am J Surg Pathol. 2000;24(9):1201–1208. doi:10.1097/00000478-200009000-00002
38. Bell DW, Ellenson LH. Molecular genetics of endometrial carcinoma. Annu Rev Pathol. 2019;14:339–367. doi:10.1146/annurev-pathol-020117-043609
39. Skeie G, Mode N, Henningsen M, Borch KB. Validity of self-reported body mass index among middle-aged participants in the Norwegian Women and Cancer study. Clin Epidemiol. 2015;7:313–323. doi:10.2147/CLEP.S83839
 © 2020 The Author(s). This work is published and licensed by Dove Medical Press Limited. The full terms of this license are available at https://www.dovepress.com/terms.php and incorporate the Creative Commons Attribution - Non Commercial (unported, v3.0) License.
By accessing the work you hereby accept the Terms. Non-commercial uses of the work are permitted without any further permission from Dove Medical Press Limited, provided the work is properly attributed. For permission for commercial use of this work, please see paragraphs 4.2 and 5 of our Terms.
© 2020 The Author(s). This work is published and licensed by Dove Medical Press Limited. The full terms of this license are available at https://www.dovepress.com/terms.php and incorporate the Creative Commons Attribution - Non Commercial (unported, v3.0) License.
By accessing the work you hereby accept the Terms. Non-commercial uses of the work are permitted without any further permission from Dove Medical Press Limited, provided the work is properly attributed. For permission for commercial use of this work, please see paragraphs 4.2 and 5 of our Terms.