")
Back to Journals » International Journal of Nanomedicine » Volume 15
Evidence Supporting the Safety of Pegylated Diethylaminoethyl-Chitosan Polymer as a Nanovector for Gene Therapy Applications
Authors Rondon EP, Benabdoun HA, Vallières F, Segalla Petrônio M , Tiera MJ , Benderdour M, Fernandes JC
Received 4 March 2020
Accepted for publication 4 July 2020
Published 20 August 2020 Volume 2020:15 Pages 6183—6200
DOI https://doi.org/10.2147/IJN.S252397
Checked for plagiarism Yes
Review by Single anonymous peer review
Peer reviewer comments 3
Editor who approved publication: Dr Thomas Webster
Elsa Patricia Rondon,1 Houda Abir Benabdoun,1 Francis Vallières,1 Maicon Segalla Petrônio,2 Marcio José Tiera,2 Mohamed Benderdour,1 Julio Cesar Fernandes1
1Orthopedic Research Laboratory, Hôpital Du Sacré-Cœur De Montréal, Université De Montréal, Montréal, Québec, Canada; 2Institute of Biosciences, Humanities and Exact Sciences, Department of Chemistry and Environmental Sciences, UNESP-São Paulo State University, São José Do Rio Preto, São Paulo State, Brazil
Correspondence: Julio Cesar Fernandes Tel +1 514-338-2222 Ext. 2489
Email [email protected]
Purpose: Diethylaminoethyl-chitosan (DEAE-CH) is a derivative with excellent potential as a delivery vector for gene therapy applications. The aim of this study is to evaluate its toxicological profile for potential future clinical applications.
Methods: An endotoxin-free chitosan (CH) modified with DEAE, folic acid (FA) and polyethylene glycol (PEG) was used to complex small interfering RNA (siRNA) and form nanoparticles (DEAE12-CH-PEG-FA2/siRNA). Based on the guidelines from the International Organization for Standardization (ISO), the American Society for Testing and Materials (ASTM), and the Nanotechnology Characterization Laboratory (NCL), we evaluated the effects of the interaction between these nanoparticles and blood components. In vitro screening assays such as hemolysis, hemagglutination, complement activation, platelet aggregation, coagulation times, cytokine production, and reactive species, such as nitric oxide (NO) and reactive oxygen species (ROS), were performed on erythrocytes, plasma, platelets, peripheral blood mononuclear cells (PBMC) and Raw 264.7 macrophages. Moreover, MTS and LDH assays on Raw 264.7 macrophages, PBMC and MG-63 cells were performed.
Results: Our results show that a targeted theoretical plasma concentration (TPC) of DEAE12-CH-PEG-FA2/siRNA nanoparticles falls within the guidelines’ thresholds: < 1% hemolysis, 2.9% platelet aggregation, no complement activation, and no effect on coagulation times. ROS and NO production levels were comparable to controls. Cytokine secretion (TNF-α, IL-6, IL-4, and IL-10) was not affected by nanoparticles except for IL-1β and IL-8. Nanoparticles showed a slight agglutination. Cell viability was > 70% for TPC in all cell types, although LDH levels were statistically significant in Raw 264.7 macrophages and PBMC after 24 and 48 h of incubation.
Conclusion: These DEAE12-CH-PEG-FA2/siRNA nanoparticles fulfill the existing ISO, ASTM and NCL guidelines’ threshold criteria, and their low toxicity and blood biocompatibility warrant further investigation for potential clinical applications.
Keywords: chitosan, nanoparticles, siRNA, biocompatibility assays, gene therapy, toxicity
Introduction
Biocompatibility studies on nanoformulations for biomedical applications have been a subject of increasing interest in the last decades, as they are being submitted to the Food and Drug Administration (FDA) and marketed. A review of the 51 nanomedicines currently approved by the FDA, and some of the 77 products undergoing clinical trials have been the subject of a previous study.1 Pursuing the preclinical development of a new formulation depends not only on its efficacy, but also on its safety. Nowadays, regulatory agencies, standards development organizations, and laboratory research teams develop screening methodologies to improve the assessment of the estimated biological response to a specific nanomaterial.
Over the past decade, our laboratory has developed a modified chitosan (CH) with excellent potential for gene therapy applications and evaluated its different therapeutic uses.2 CH, a natural polymer composed of glucosamine units, showed good biocompatibility and biodegradability properties.3 Its versatility allows it to be used in several fields, including wastewater treatment, agriculture, textiles, food protection and cosmetics.4 It has a tremendous potential for biomedical and pharmaceutical applications as a drug delivery vehicle,5 in vaccine systems,6 tissue engineering, wound dressing, diagnosis,7 and gene therapy,8 among others.
In terms of toxicity outcomes, CH and its derivatives, show low blood toxicity, as they generally do not induce significant hemolysis and do not affect the complement activation system.9–11 However, the data on blood compatibility are contradictory. There were reports that this polymer can induce hemagglutination,9 or impact platelet activation and clotting time,10 depending on its physicochemical characteristics. Cell viability can also be differentially affected, depending on CH modifications and the cell type studied. For example, HUVEC cell line survival increases when incubated with a CH-heparin nanoparticles coating on anodized NiTi (nickel-titanium),12 while a glycol CH-nanogel induces slight cell toxicity on Raw 264.7 macrophages, 3T3 fibroblasts and HMEC.13 Similarly, in L929 cells, viability is not affected by lauroyl sulfated CH microparticles,11 whereas CH/polyglutamic acid hollow spheres affect the viability of HUVEC and HUASMC, in a cell, time, size, and charge-dependent manner.10
The physicochemical differences in all these nanoformulations explain most of the variability in hematocompatibility and cytotoxicity responses. Another factor is the heterogeneity in screening protocols, coupled with the general assumption that CH is biocompatible, resulting in a limited number of reports on its hemagglutination and oxidative stress response. Finally, the lack of information on endotoxin contamination in CH formulations makes it difficult to interpret results from cytokine up-regulation, as the presence of endotoxins alone can induce the production of important pro-inflammatory mediators, such as tumor necrosis factor alpha (TNF-α) and interleukin-6 (IL-6).14 These facts underscore the need to follow available guidelines when evaluating the toxicological profile of a newly synthesized nanoparticle.
A good starting point for biocompatibility studies are the guidelines from the International Organization for Standardization (ISO), the American Society for Testing and Materials (ASTM), and the Nanotechnology Characterization Laboratory (NCL), which provide protocols and recommendations to perform preclinical studies on nanoformulations. Reviews of standards, guidelines and agencies are available in several reports.15–18
Our goal is to design safe and functionalized nanoparticles that release their therapeutic cargo, namely small interfering RNA (siRNA), to target cells with minimal toxicity to tissues. As we aim for a parenteral administration, we decided to use the existing guidelines to achieve validated outcomes before proceeding to a clinical application. The present study systematically evaluates the safety of a pegylated diethylaminoethyl CH (DEAE12-CH-PEG-FA2), with or without siRNA-SSB complexation. This derivative showed a high in vitro transfection efficiency on varied cell lines19 and its in vivo therapeutic efficacy was demonstrated in a murine collagen antibody-induced arthritis model.2 Among the assays proposed by ISO 10,993–4:2009,20 ISO/TR 16,197,17 ASTM F1903,21 ASTM E56.03 committee,22 and NCL protocols,23 the following were chosen: endotoxin contamination, physicochemical characterization, cytotoxicity assay, hemotoxicity (hemolysis, hemagglutination, complement activation, platelet aggregation and coagulation tests), inflammatory response (cytokines) and oxidative stress response (reactive oxygen species (ROS) and nitric oxide (NO)).
Materials and Methods
Materials
Medical grade deacetylated CH (ChitoClear®, 43,010, 270 kDa) was obtained from Primex ehf (Siglufjordur, Iceland). RPMI 1640 medium, EMEM medium, fetal bovine serum (FBS), 0.25% trypsin-EDTA solution, penicillin-streptomycin (P/S) and lymphocyte separation medium (LSM) were purchased from WISENT Bioproduct Inc (Montréal, Qc, Canada). siRNA-SSB (GenBank accession number NM_009278) with the oligonucleotide sequence: antisense 5ʹ-uuacauuaaagucuguuguTT-3ʹ; and sense 5ʹ-acaacagacuuuaauguaaTT-3ʹ (as mentioned by Abrams et al,24 and Seitzer et al)25 with a 2ʹ-O-Me-rA (rC, rG, rU) modification, was purchased from Alpha DNA S.E.N.C. (Montréal, Qc, Canada). Pyrogen-free consumables (Biosphere® plus certified) were purchased from Sarstedt (Montréal, Qc, Canada). Other chemicals or solutions, if not otherwise stated, were purchased from Sigma Aldrich Canada (Oakville, ON, Canada). Raw 264.7 macrophage and MG-63 cells were purchased from American Type Culture Collection (ATCC, Manassas, VA, USA).
Ethics Committee
Experiments with human blood were approved by the Hôpital du Sacré-Cœur de Montréal - Centre Intégré Universitaire de Santé et de Services Sociaux du Nord de l’Ile de Montréal (CIUSSS NIM) - Research Ethics Committee (Protocol # 2017–1462). Informed consent was obtained from healthy donor volunteers who were not ill nor under medication at the time of blood sample collection. PBMC were collected from healthy volunteers who provided blood samples. The CIUSSS NIM Research Ethics Committee approved the use of these cells and the corresponding experimental procedures (Protocol # 2017–1462).
Synthesis of DEAE12-CH-PEG-FA2
Groups of diethylaminoethyl (DEAE), polyethylene glycol (PEG - 3 kDa spacer) and folic acid (FA) were grafted to the CH structure. DEAE12-CH conjugation was prepared as described by Oliveira et al.26 Final conjugation of DEAE12-CH and PEG-FA was performed as reported by Cho et al,27 with slight modifications, described in our previous study.28
Limulus Amebocyte Lysate (LAL) Assay
All the materials used for this test were purchased pyrogen-free. One sample from each stage of synthesis, prepared at 1 mg/mL, was analyzed for the presence of endotoxins by LAL assay (88,282, Thermo Fisher, Saint-Laurent, Qc, Canada), according to NCL method STE-1.129 and the manufacturer’s instructions. The kit’s detection levels were in the 0.1 EU/mL to 1 EU/mL range.
Characterization of Modified CH
Polymer characterization was performed as described in our previous studies.26,28 Nuclear magnetic resonance (1H-NMR) was used to assess the degree of CH deacetylation (DDA) and the DEAE percentage incorporated into the polymer structure. The percentage of PEG-FA incorporated was calculated by measuring FA absorbance (λ363nm) in a nanophotometer, using CH-DEAE as a blank. An extinction coefficient of 6165 M−1 cm−1 (FA)28 was used for calculations. The molecular weight (MW) of the CH polymer was evaluated by gel permeation chromatography (GPC). Additional Information about DEAE12-CH-PEG-FA2 characterization is described in our previous study.19
Nanoparticle Preparation in DPBS pH 7.2
DEAE12-CH-PEG-FA2 was dissolved overnight in a 0.1 M HCL solution, then heated at 50°C for 30 min, adjusted with Dulbecco’s Phosphate-Buffered Saline (DPBS) to the desired final concentration, and finally filtered with a 0.45 μm polyether sulfone membrane filter. To prepare DEAE12-CH-PEG-FA2/siRNA-SSB nanoparticles, siRNA-SSB and modified CH stock solutions were added to DPBS and vortexed immediately at moderate speed for 1 min. Nanoparticles were always freshly prepared prior to each experiment.
Characterization of DEAE12-CH-PEG-FA2/siRNA Nanoparticles in DPBS pH 7.2
The size and charge (zeta potential) were evaluated with a Zetasizer Nano ZS90 (Malvern Instruments Ltd., Malvern, UK), using a 1 mL nanoparticle solution containing 0.02 mM of siRNA. Size versus (vs) time studies were performed to analyze the particle’s stability for 24 h. DEAE12-CH-PEG-FA2/siRNA nanoparticles at amino groups/phosphate groups (N/P) ratios of 5:1, 10:1, 15:1, 20:1, 30:1 and 40:1 were prepared as indicated above. The DEAE12-CH-PEG-FA2/siRNA nanoparticle formation was evaluated by 2% agarose gel electrophoresis, by loading 10 μL of nanoparticle solution with 0.5 μg of siRNA.
Nanoparticle Concentrations Selection for in vitro Assays and Controls
DEAE12-CH-PEG-FA2/siRNA nanoparticle concentrations were chosen according to a theoretical therapeutic dose for their future use in vivo. Thus, a theoretical plasma concentration (TPC) for in vitro assays was calculated, based on NCL recommendations30 and FDA directives.31 Our previous work showed the efficiency of a 50 μg siRNA-TNFα/intraperitoneal injection/mouse in a mouse model of arthritis.2 These results and those in the literature gave us a framework to determine the dose that we could test in vivo for a future intravenous administration in a mouse model. Thereby, the dose of 30 μg siRNA-SSB/intravenous injection/mouse (1.5 mg/kg, for a 20 g mouse) was chosen as the target dose to be complexed with DEAE12-CH-PEG-FA2. Based on NCL guidelines,30 an equivalent human dose (0.1219 mg/kg) was calculated and the corresponding TPC (1.52 μg/mL siRNA-SSB). Table 1 summarizes the concentrations used for in vitro assays.
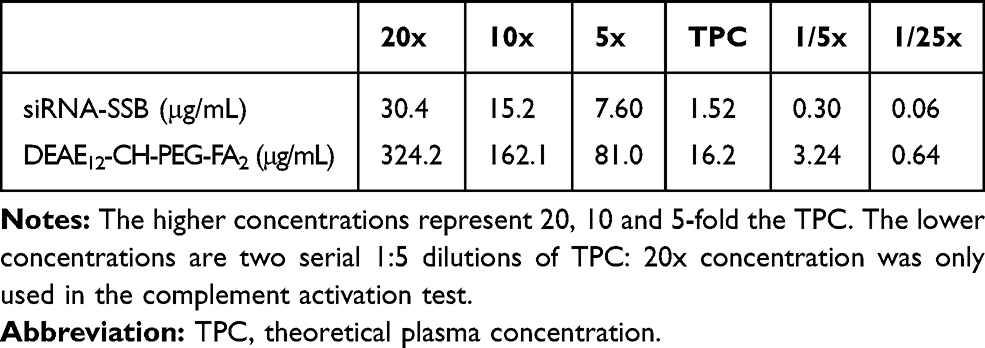 |
Table 1 Nanoparticle Concentrations in vitro |
This study evaluates the safety of our pegylated diethylaminoethyl CH (DEAE12-CH-PEG-FA2) with or without siRNA-SSB complexation. Positive and negative controls were used in each assay to confirm the cells’ ability to respond to a given substance. Cell-free particle controls were conducted to verify nanoparticle interference with the assay.
Cell Cytotoxicity
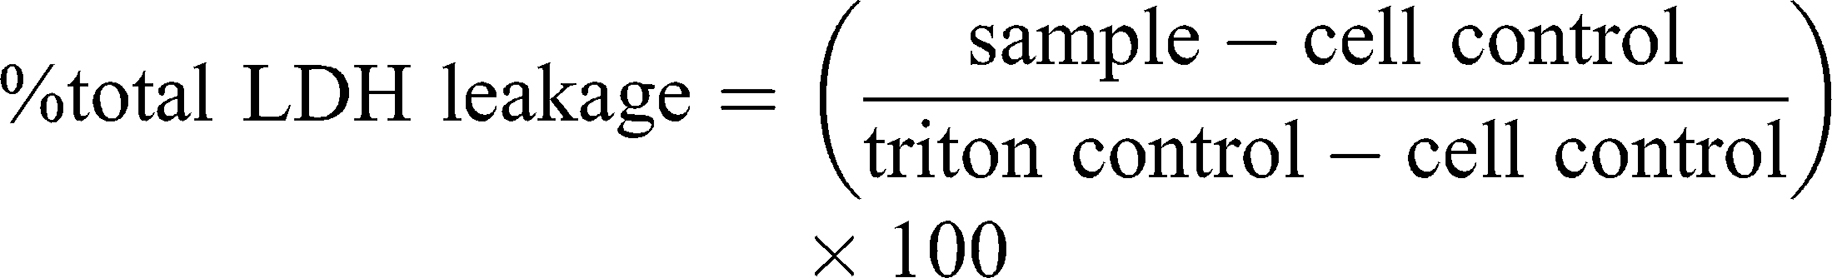
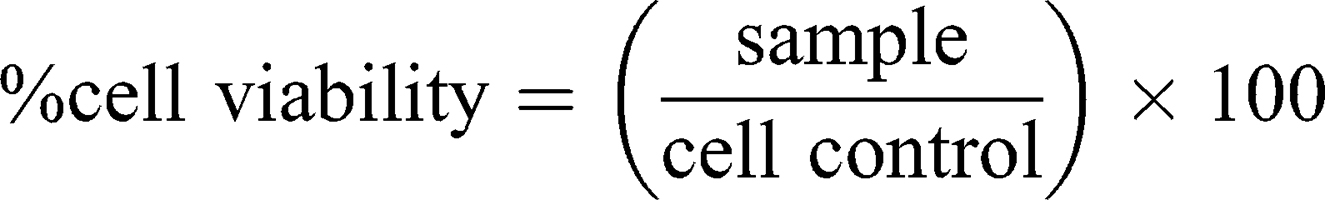
This assay is based on slightly modified ASTM E2526-08 (2013)32 and NCL GTA-2 (2015)33 guidelines. Cell viability, in response to DEAE12-CH-PEG-FA2/siRNA nanoparticles, was measured by MTS (3-(4,5-dimethylthiazol-2-yl)-5-(3-carboxymethoxyphenyl)-2-(4-sulfophenyl)-2H-tetrazolium, G5421, Promega, Madison, WI, USA) and lactate dehydrogenase release (LDH, 11,644,793,001, Roche, Laval, QC, Canada) assays on human MG-63 cells, murine Raw 264.7 macrophages and human peripheral blood mononuclear cells (PBMC). Briefly, MG-63 and Raw 264.7 cells were plated in a 96-well plate at a confluence of 1.5 x 10⁴ cells/well (EMEM medium) and 3.5 x 10⁴ cells/well (RPMI medium), respectively. Cells were incubated in 10% FBS phenol red-free medium for 24 h at 37°C. Then, medium was replaced with fresh medium (1% FBS) containing samples and incubated for 4, 24, and 48 h at 37°C. PBMC were isolated based on NCL method ITA-10, using LSM.34 PBMC were collected, washed, resuspended in 1% FBS RPMI 1640 medium, and incubated with samples at 2 x 10⁵ cells/well in a 96-well plate. After the exposure period, MTS and LDH assays were performed according to the manufacturer’s instructions, with absorbance readings at 490 nm in a microplate reader (EL800, Bio-Tek instruments). DPBS was used as the negative control. Hydrogen peroxide (500 μM H2O2) and triton X-100 (1% v/v) were used as positive controls for the MTS and LDH assays, respectively. Cell-free particle interference controls were treated in the same experimental conditions. Cell viability and cytotoxicity were calculated with the following equations:
As the guidelines did not mention an acceptable threshold for the MTS assay, ISO 10,993–5 criteria were used, where a viability <70% is considered toxic.35
Hemolysis Assay
This assay is based on ASTM E2524-08 (2013)36 with some modifications. In summary, human blood was collected in Na-heparin tubes. Plasma-free hemoglobin (PFH) and total blood hemoglobin (TBH) were determined and treated according to the procedure described in the guideline. Then, 20 μL of diluted whole blood, 20 μL of samples and 140 μL of DPBS were incubated in microcentrifuge tubes for 3 h at 37°C. A minus blood interference control was also prepared. Then, tubes were centrifuged for 8 min at 2000×g. The quantitative hemolysis determination was carried out by mixing 100 μL of the sample’s supernatant with 100 μL of cyanmethemoglobin reagent (hemoglobin reagent, Pointe Scientific, Canton, MI, USA). The absorbance was read at 490 nm and a standard curve (0.025 to 0.8 mg/mL) prepared with human hemoglobin was used for calculations. Triton X-100 (10%) and DPBS served as positive and negative controls, respectively. Percentage hemolysis was calculated with the following equation:
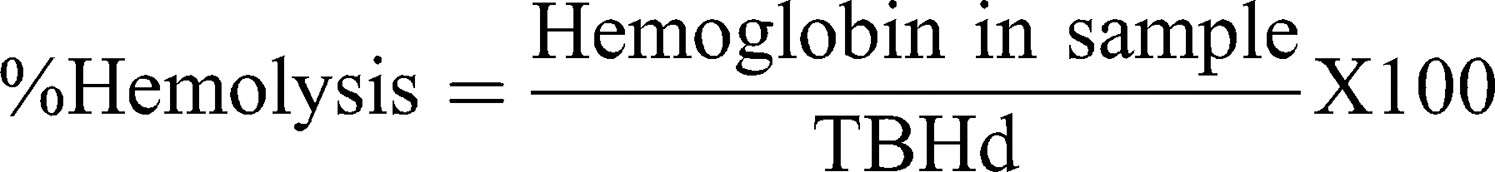
Hemolysis >5% indicates a positive hemolytic response according to ASTM guidelines.36
Hemagglutination Test
The chosen method is the one reported by Banerjee et al,37 Lima et al,38 and Stavitsky et al,39 with minor modifications. Briefly, human blood collected in Na-heparin tubes was centrifuged at 1500 RPM for 12 min to isolate erythrocytes. Plasma was discarded and red blood cells were washed 3 times with a 0.9% NaCl solution. Finally, a 2% cell suspension in NaCl was prepared and incubated with nanoparticles in a 96-well U-bottom plate for 1 h at 37°C. DPBS and lectin from Phaseolus vulgaris were used as negative and positive controls, respectively. Wells were photographed and scored according to the scale proposed by Stavitsky et al,39
“+ + + + compact granular agglutinate;
+ + + Smooth mat on bottom of tube with folded edges;
+ + Smooth mat on bottom of tube, edges somewhat ragged;
+ Narrow ring of red around the edge of smooth mat;
± Smaller area of tube covered than +, and heavier ring around the edge;
- discrete red button in center at the bottom of the tube.”
Complement Activation Assay
This test was performed according to NCL method ITA-5.1 (2015)40 with some modifications. Briefly, whole human blood was drawn in tubes containing sodium citrate. Plasma was collected after blood centrifugation at 2500×g for 10 min. Then, equivalent volumes of plasma and samples were mixed and incubated for 30 min at 37°C. 8.1 Units of cobra venom factor (CVF) and DPBS were used as positive and negative controls, respectively. Next, Laemmli buffer was added and tubes were heated at 95°C for 5 min. Samples were finally loaded at 10 μg/well in an 8% SDS-polyacrylamide gel and transferred electrophoretically onto a nitrocellulose membrane for protein immunodetection. The primary antibodies deployed were the anti-C3/C3b antibody (1:500, ab11871, Abcam, Toronto, ON, Canada), and the serum loading control anti-transferrin antibody (1:1000, ab109503, Abcam, Toronto, ON, Canada). After serial washes, the primary antibodies were revealed by the corresponding HRP-conjugated secondary antibodies. According to NCL guidelines,40 a sample with ≥2 folds the density of DPBS, for the C3c fragment, was considered positive.
Platelet Aggregation Test
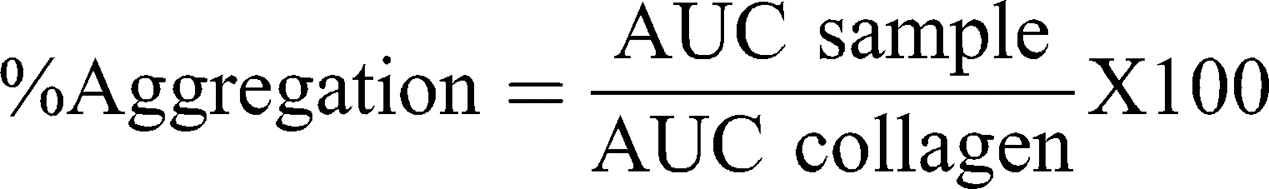
This test was performed according to NCL method ITA-2.2 (2015)41 with some modifications. Briefly, whole human blood was collected in sodium citrate tubes. Platelet-rich plasma (PRP) and platelet poor plasma (PPP) were obtained by blood centrifugation at 200xg for 8 min and 2500×g for 10 min, respectively. Then, 6 min runs were performed at 37°C in a platelet aggregation profiler (PAP-8E, Bio/Data Corporation) using 225 μL of PRP and 25 μL of samples. A baseline correction was performed using PPP and samples for possible particle interference. Collagen (100 μg/mL) and DPBS were the positive and negative controls, respectively. Non-treated PRP runs at the beginning and the end of the assay were used as internal test controls. The percentage of aggregation was calculated with the following equation, where AUC represents the area under the curve:
A platelet aggregation >20% was considered a positive response according to NCL Method ITA-2.1 (2015).42
Plasma Coagulation Test
This assay was carried out according to NCL method ITA-12 (2015).43 Briefly, whole human blood was collected in sodium citrate tubes. Plasma was collected after blood centrifugation at 2500×g for 10 min. Then, samples were incubated with plasma in a microcentrifuge tube for 30 min at 37°C, and finally centrifuged at 17000×g for 5 min. After exposure, activated partial thromboplastin time (APTT), prothrombin time (PT) and thrombin time (TT) were measured using the STA-R Evolution coagulometer (Diagnostica Stago). Non-treated plasma and DPBS were used as internal and negative controls, respectively. Normal limits for plasma clotting time, established by the certified clinical laboratory at Hôpital du Sacré-Cœur de Montréal, were: APTT 28 ≤ 40s, PT 11 ≤ 15s, and TT 14 ≤ 21s.
Cytokine Assay
This assay was performed based on NCL method ITA-10 (2015).34 Briefly, human PBMC were re-suspended in a 10% FBS RPMI 1640 medium. Cells (1 x 10⁶/well) were incubated with samples for 24 h at 37°C. Lipopolysaccharides (LPS, tlrl-peklps, 20 ng/mL, Invivogen, San Diego, CA, USA) and DPBS were the positive and negative controls, respectively. Following exposure, supernatants were collected and centrifuged at 12,000 RPM for 15 min. Cytokines (TNF-α, IL-1β, IL-6, IL-8, IL-4 and IL-10) were measured with ELISA kits (PeproTech, Rocky Hill, NJ, USA).
Nitric Oxide (NO) Determination
This assay determines NO production based on NCL method ITA-7 (2015).44 Briefly, murine Raw 264.7 cells were plated at a confluence of 1 x 10⁵ cells/well in 10% FBS RPMI medium (phenol red free) and incubated for 24 h at 37°C. Then, medium was replaced with fresh medium containing samples and incubated for 48 h at 37°C. After the exposure period, supernatants were collected and centrifuged at 12,000 RPM for 10 min. Nitrite (NO2−) quantitative determination was carried out with the Greiss reagent as indicated in the protocol. The absorbance was measured at 562 nm and a standard curve (0.12 μM to 250 μM) prepared with sodium nitrite in complete medium was used for calculations. LPS (100 ng/mL) and DPBS were used as the positive and negative controls, respectively. A cell-free interference control was prepared and taken through all the experimental steps.
Reactive Oxygen Species (ROS) Assay
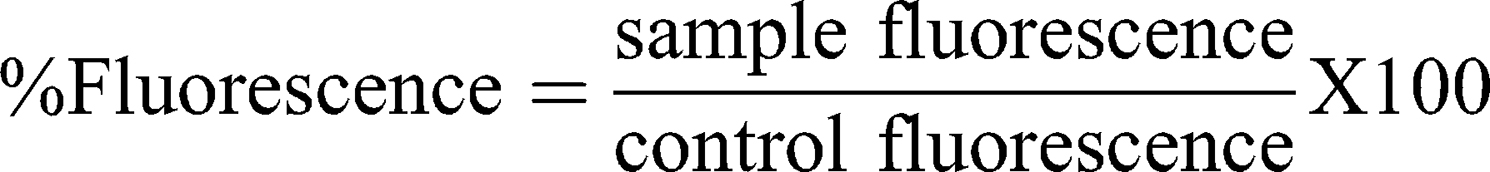
This test measures ROS production based on NCL method GTA-7 (2010),45 with some modifications. Briefly, murine Raw 264.7 cells were plated in a black 96-well plate at a confluence of 8.5 x 10⁴ cells/well in 10% FBS RPMI medium (phenol red free) and incubated for 24 h at 37°C. Then, the plate was incubated with a 20 μM DCFH-DA probe solution for 30 min. Cells were further incubated with Hanks’ Balanced Salt solution (HBSS) containing the samples for 6 h at 37°C. The first reading was performed at t=0 before adding the samples, and subsequently at 0.5, 1, 2, 3, 4, 5 and 6 h after exposure time. A microplate reader with Fluorescence Polarization (Polar Star Optima, BMG Labtech) set up at ex. 485 nm and em. 530 nm was used. H2O2 (500 μM) and diethyl maleate (DEM, 5 mM) served as positive controls and DPBS as the negative control. A cell-free interference control was prepared and taken through all the experimental steps, except for probe pre-incubation. The ROS percentage was calculated with:
Statistical Analysis
Data were analyzed with GraphPad Prism software version 6. Figures show the standard error of the mean ± SEM. Statistical significance (*p<0.05, **p<0.01, ***p<0.001, ****p<0.0001) was assessed by One-way Anova or Two-way Anova with adjusted correction for multiple comparisons using Dunnett’s test (not matching or pairing). All results are from at least three independent experiments unless stated otherwise in the figure legend. For experiments with human blood, each independent experiment was from a distinct healthy blood donor. When the guidelines did not provide an acceptable threshold for the test, the negative control was used as a baseline to determine a statistically significant difference with the tested samples, as recommended by ASTM F1903.21
Results
Characterization of Modified CH (DEAE12-CH-PEG-FA2)
To evaluate the effect of DEAE and PEG-FA insertion on the CH structure, we calculated the percentage of each chemical group attached on the polymer chain, and estimated the MW of the new synthesized derivative. A diagram representing the synthesis procedure is available in supplementary figure S1. The DDA of the original non-modified CH was determined by 1H-NMR at 97.4%, with a MW of 270 kDa, as measured with GPC. The degree of substitution (DS) of the DEAE groups inserted in the CH was 12%. The percentage of PEG-FA in the CH structure was 2.02%, as measured with a nanophotometer at λ 363 nm. The theoretical value of the average molar mass (MM) per DEAE12-CH-PEG-FA2 residue was determined by 1H-NMR and calculated as 243.7 g/mol, using the DDA, degree of acetylation (DA), and DS values. Final MW of this derivative, according to GPC, was 259 kDa. Figure S2 shows GPC traces for the original and modified CH. DEAE12-CH-PEG-FA2 polymer is partly soluble in water after long stirring periods. Once HCl is added to water in equimolar amounts to those of the amino groups, other solutions like DPBS pH 7.2 can be added to reach the desired final concentration, and the polymer remains soluble at neutral pH. The final pH will be the one used in the solution to reach the concentration to be tested, in our case pH 7.2. LAL assay, carried out on different samples of the synthesis process, revealed that our DEAE12-CH-PEG-FA2 was free of endotoxin contamination (endotoxin levels were not detectable or inferior to 0.1 EU/mL). A representation of the DEAE12-CH-PEG-FA2 chemical structure, its 1H-NMR spectrum and general properties are shown in Figure 1.
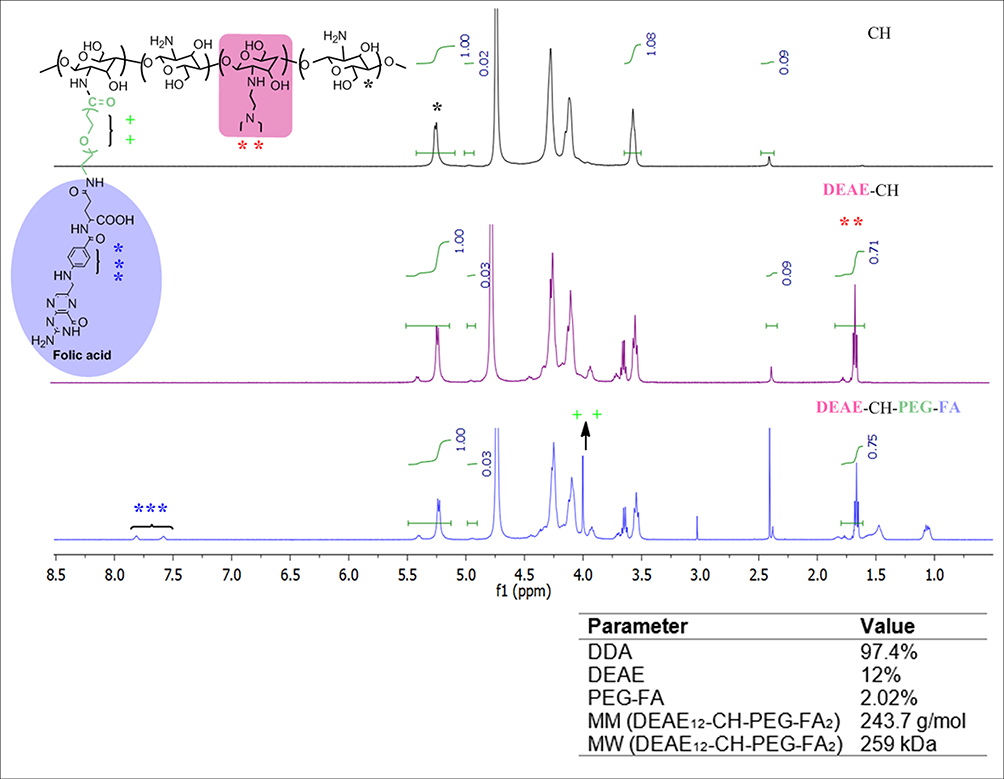 |
Figure 1 Chemical structure and characterization of DEAE12-CH-PEG-FA2 modified CH. DEAE12-CH-PEG-FA2 chemical structure (left-top). 1H-NMR spectrum of deacetylated CH (right-top panel, DDA 97.4%), DEAE12-CH (middle panel) and DEAE12-CH-PEG-FA2 (right-bottom panel). DEAE12-CH-PEG-FA2 properties (right-bottom). |
Characterization of DEAE12-CH-PEG-FA2/siRNA Nanoparticles in DPBS pH 7.2
The electrophoresis assays were carried out to determine the ideal N/P ratio between DEAE12-CH-PEG-FA2 and siRNA to form nanoparticles and complex the payload. Therefore, we chose a N/P ratio of 15:1, as there was no siRNA release during the agarose gel migration, which reflects good complexation (Figure 2A). Size and zeta potential assays (Figure 2B and C) for a N/P ratio of 15:1 showed nanoparticles of 208 ± 33 nm, with a polydispersity index (PDI) of 0.15 ± 0.04, and a charge of +8.9 ± 0.7 mV. Size vs time studies (Figure 2D and E) showed stable nanoparticles for a N/P ratio of 15:1, ranging from 194 ± 10 nm (PDI 0.15 ± 0.0) at t=0 to 224 ± 6 nm (PDI 0.18 ± 0.02) at 24 h. Overall, this 24 h kinetic experiment showed good particle homogeneity from N/P ratios of 15:1 to 40:1 for all time points, with sizes <235 nm and PDI <0.2.
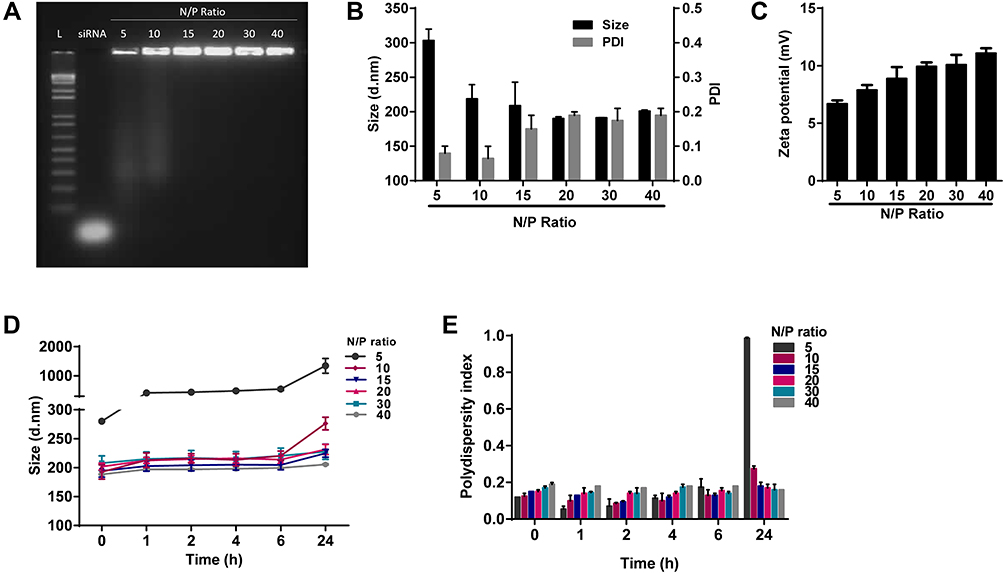 |
Figure 2 Characterization of DEAE12-CH-PEG-FA2/siRNA nanoparticles in DPBS pH 7.2. Nanoparticles had DEAE12-CH-PEG-FA2/siRNA N/P ratios of 5:1, 10:1, 15:1, 20:1, 30:1 and 40:1. (A) Nanoparticles agarose electrophoresis using 0.5 μg of siRNA/well. Lane 1: ladder (1kb pairs); lane 2 free siRNA; lane 3–8: DEAE12-CH-PEG-FA2/siRNA nanoparticles at the indicated N/P ratios. (B) Nanoparticle size and PDI with 0.02 mM of siRNA/optical-cell. (C) Zeta potential of nanoparticles at the indicated N/P ratios. (D) Nanoparticle size vs time and (E) their corresponding PDI. All values are expressed as the mean ± SEM of two independent experiments. |
Cell Viability and Toxicity
The effect of DEAE12-CH-PEG-FA2/siRNA nanoparticles or free DEAE12-CH-PEG-FA2 on cell viability was tested using three types of cells and two assay methods. MTS determines cell viability and LDH release indicates a loss in membrane integrity, which is associated with cell death.32 Compared to Raw 264.7 cells and PBMC, MG-63 cells had the best viability and the lowest LDH release. For TPC, MG-63 cell viability was evaluated at 93.3 ± 2.7% (p<0.05) after 24 h of incubation and decreased to 76.0 ± 5.1% (p<0.01) after 48 h (Figure 3A). The LDH level varied from 1.8 ± 0.5% to 5.4 ± 1.7% (p<0.01) for the same time periods (Figure 3B). Although cell viability of Raw 264.7 macrophages was more affected at 10x and 5x concentrations (Figure 3C), cell viability at TPC was still 78.3 ± 4.7% (p<0.05) and 71.8 ± 3.0% (p<0.0001) after 24 and 48 h of incubation, respectively. A dose-dependent response associated with time points was observed. LDH release was estimated at 45.9 ± 5.8% (p<0.0001) and 88.0 ± 7.3% (p<0.0001), following treatment for 24 and 48 h (Figure 3D). For its part, PBMC cell viability at TPC remained at 81.0 ± 2.9% and 107.5 ± 19.5% after 24 and 48 h of incubation, respectively (Figure 3E). LDH release reached 12.3 ± 1.4% (p<0.01) and 8.8 ± 3.5% after 24 and 48 h post-exposure (Figure 3F). The viability threshold for this test is >70% according to ISO 10,993–5,35 meaning that our nanoparticles still meet the criteria for MG-63 cells and PBMC. Even though the viability of Raw 264.7 macrophage cells was >70% when evaluated by MTS assay, LDH release results showed a much higher mortality rate which does not reflect MTS data.
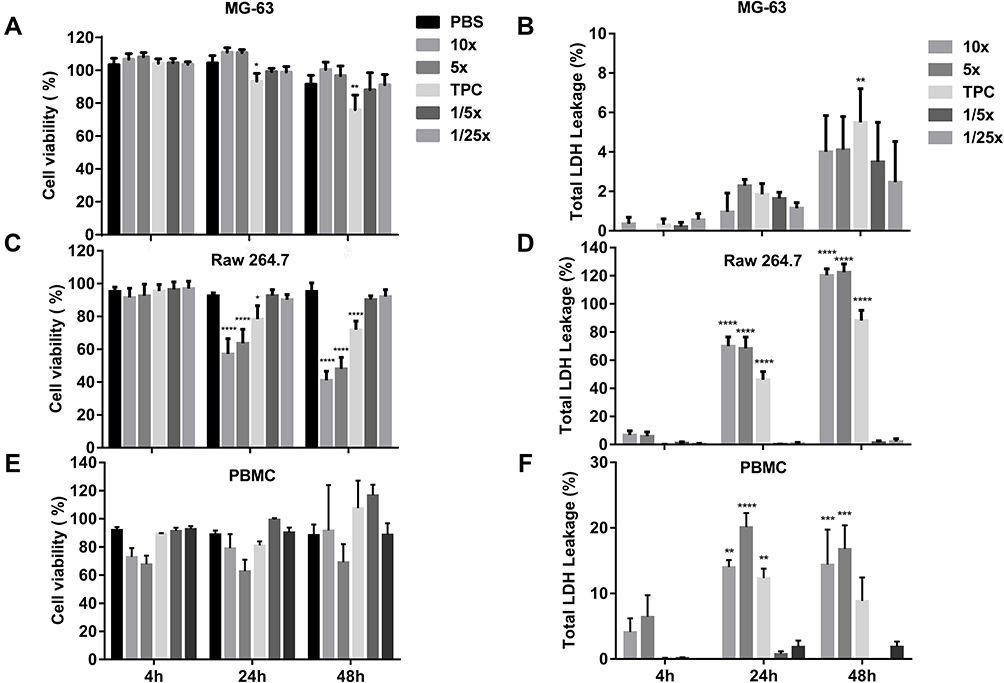 |
Figure 3 Cell viability and toxicity of DEAE12-CH-PEG-FA2/siRNA nanoparticles. The cytotoxic effect of nanoparticles was evaluated using the MTS (A, C, E) and LDH assays (B, D, F) in MG-63 cells, Raw 264.7 macrophage cells and PBMC. Cells were incubated with samples for 4, 24 and 48 h at 37°C. After the exposure time, MTS and LDH tests were performed. DPBS was used as the negative control. 500 μM H2O2 and 1% v/v triton X-100 were used as positive controls for MTS and LDH assays, respectively. *p<0.05, **p<0.01, ***p<0.001, ****p<0.0001 are significantly different from the negative control. Data are expressed as the mean ± SEM of three independent experiments and were analyzed by Two-way ANOVA (post hoc Dunnett’s test). Blood samples for PBMC were collected from three different healthy human donors. See Table 1 for DEAE12-CH-PEG-FA2 and siRNA concentrations. |
Free DEAE12-CH-PEG-FA2 showed similar cell viability for all cell types, at different incubation times and particle concentrations, as measured by the MTS assay and LDH release (Figure S3A–F).
Hemocompatibility of Nanoparticles
In order to define the hemotoxicity profile of our DEAE12-CH-PEG-FA2/siRNA nanoparticles and free DEAE12-CH-PEG-FA2, a set of experiments were performed to evaluate the effect of their interaction with human blood components, namely cells, proteins and mediators. All tested nanoparticle and free DEAE12-CH-PEG-FA2 concentrations with hemolysis assay (Figure 4A and S4A) were under the ASTM threshold of 5%.36 A platelet aggregation test (Figure 4B) has shown that all concentrations (except for 10x) meet the guideline threshold of <20% for platelet clotting. TPC and 5x induced platelet clotting at 2.9 ± 1.1% and 15.6 ± 8.6%, respectively, with no statistically significant difference compared to DPBS. For free DEAE12-CH-PEG-FA2 (Figure S4B) aggregation was inferior to 20% for all concentrations, with a clot formation of 5.3 ± 1.4% for TPC. The hemagglutination assay showed a weak agglutination with the formation of a smooth mat of red blood cells on the well bottom (Figure 4C) for all concentrations, except for 10x which showed a mild aggregation. Free DEAE12-CH-PEG-FA2 had similar outcomes as well (Figure S4C).
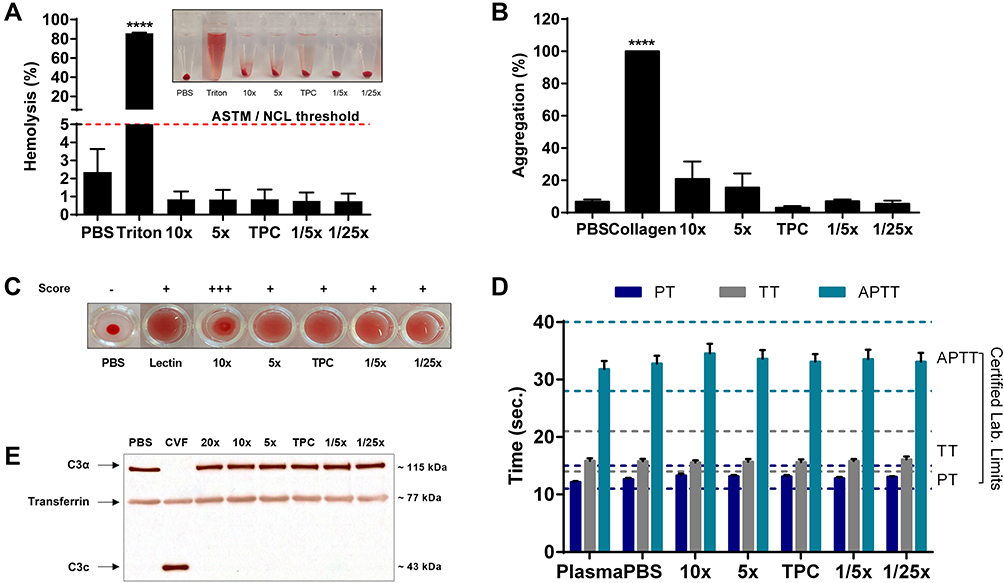 |
Figure 4 Hemocompatibility of DEAE12-CH-PEG-FA2/siRNA nanoparticles. (A) Hemolysis percentage induced by nanoparticles and visual inspection of tubes after the centrifugation step (inset). Human blood was incubated with samples for 3 h at 37°C. DPBS and triton represent the negative and positive controls, respectively. Pink dash line shows the 5% threshold of ASTM from which a sample is considered to have hemolytic properties. Data are expressed as the mean ± SEM of three independent experiments and were analyzed by One-way ANOVA (post hoc Dunnett’s test). (B) Nanoparticle platelet aggregation profiles after platelet-rich plasma was incubated with samples for a 6 min run at 37°C. PBS and collagen represent the negative and positive controls, respectively. Data are expressed as the mean ± SEM of three independent experiments and were analyzed by One-way ANOVA (post hoc Dunnett’s test). (C) Hemagglutination activity produced by nanoparticles in an erythrocyte suspension after 1 h of incubation at 37°C. DPBS and lectin represent the negative and positive controls, respectively. Pictures represent one of three independent experiments with similar results. The agglutination analysis was performed as described in the methods. (D) Effect of particles on plasma coagulation times: prothrombin time (PT), thrombin time (TT) and activated partial thromboplastin time (APTT). Measures were taken after a 30 min incubation of human plasma with samples at 37°C. The normal coagulation time limits are indicated with a colored dash line (PT 11 ≤ 15s (dark blue), TT 14 ≤ 21s (gray) and APTT 28 ≤ 40s (light green)). Non-treated plasma and DPBS were used as internal controls for the test. Data are expressed as the mean ± SEM of four independent experiments and were analyzed by Two-way ANOVA (post hoc Dunnett’s test). (E) Complement activation assay showing the expression levels of a native C3α chain (~115 kDa) and its cleavage product C3c (~43 kDa), after human plasma exposure to nanoparticles for 30 min at 37°C. DPBS and CVF represent the negative and positive controls, respectively. Transferrin (~77 kDa) was used as a serum loading control. Blots represent one of three independent experiments with similar results. For all experiments, blood samples were collected from at least three healthy human donors. ****p<0.0001 are significantly different from the negative control. See Table 1 for DEAE12-CH-PEG-FA2 and siRNA concentrations. |
Plasma clotting times, measured with the APTT, PT and TT assays, showed that all DEAE12-CH-PEG-FA2/siRNA nanoparticle concentrations were within the normal clinical limits established for the test (Figure 4D). For TPC, the clotting times were as follows: 13.1 ± 0.2s for PT, 33.1 ± 1.3s for APTT and 15.6 ± 0.4s for TT; while for DPBS they were: 12.6 ± 0.2s for PT, 32.7 ± 1.3s for APTT and 15.8 ± 0.4s for TT, with no statistically significant difference. Free DEAE12-CH-PEG-FA2 showed similar responses (Figure S4D).
A Western blot analysis of the native C3α chain cleavage (~115 kDa) to split product C3c (~43 kDa), evaluated the activation of any of the three major pathways of the complement system (classical, alternative and lectin). Figure 4E shows that all nanocomplexes meet the guideline criteria, as none of the DEAE12-CH-PEG-FA2/siRNA nanoparticle concentrations led to complement system activation, as indicated by the absence of C3c cleaved products, contrary to the positive control (CVF). Free DEAE12-CH-PEG-FA2 showed the same effect as nanocomplexes (Figure S4E). Transferrin (~77 kDa) was used as a serum loading control, showing equal protein content between samples.
Nanoparticle Potential to Induce Cytokines
A key test to estimate one of the possible immune responses to cell-particle interactions is to quantify the production of pro- and anti-inflammatory cytokines. In PBMC, no statistically significant differences in TNF-α (Figure 5A) and IL-6 (Figure 5B) secretion were observed, in any of the DEAE12-CH-PEG-FA2/siRNA nanoparticles or free DEAE12-CH-PEG-FA2 concentrations tested when compared to DPBS. TNF-α expression levels at TPC were 287.8 ± 67.0 pg/mL vs 84.5 ± 44.5 pg/mL for DPBS, while for LPS they were 1117 ± 185.2 pg/mL. IL-6 levels reached 150.2 ± 44.1 pg/mL for TPC vs 55 ± 49.2 pg/mL for DPBS, and 927.8 ± 117.1 pg/mL for LPS. On the other hand, IL-8 and IL-1β (Figure 5C and D) were both secreted in response to DEAE12-CH-PEG-FA2/siRNA nanoparticles. The former reached 4082 ± 1313 pg/mL at TPC vs 418.3 ± 200.0 pg/mL for DPBS and 7539 ± 2079 pg/mL for LPS, while the latter reached 629.8 ± 111.0 pg/mL for TPC vs 100.6 ± 45.6 pg/mL for DPBS (p< 0.01) and 502.8 ± 148.3 pg/mL for LPS. Finally, IL-10 (Figure 5E) and IL-4 (Figure 5F) expression levels were not statistically significant compared to DPBS. Similar secretion profiles were observed when cells were incubated with free DEAE12-CH-PEG-FA2 (Figure S5A–F).
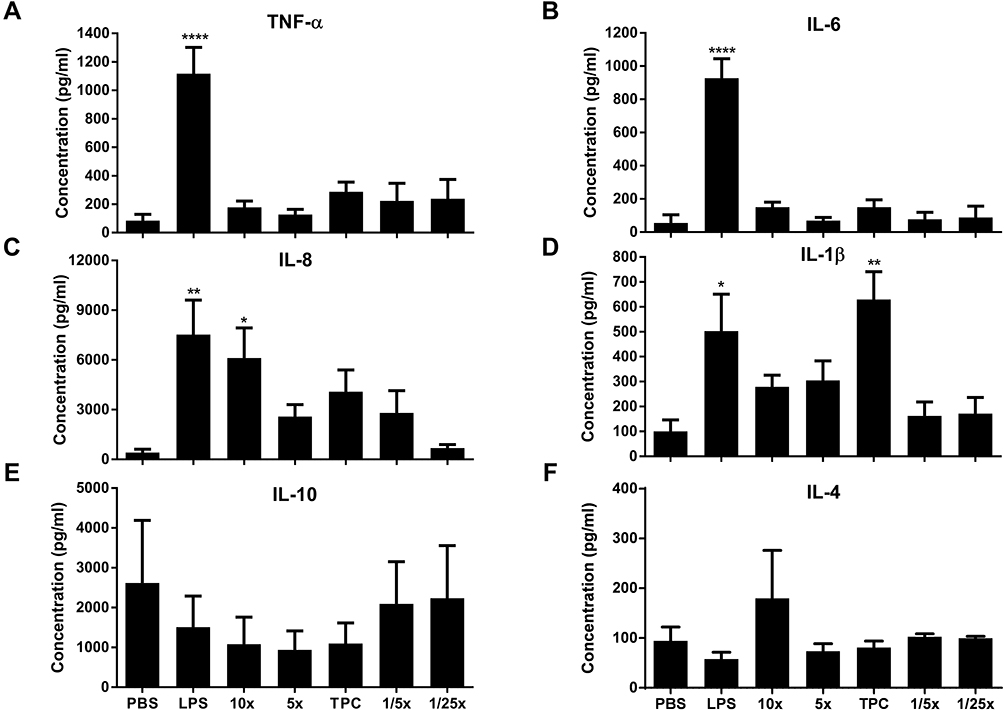 |
Figure 5 Nanoparticle potential to induce cytokines. (A) TNF-α, (B) IL-6, (C) IL-8, (D) IL-1β, (E) IL-10, and (F) IL-4 cytokines were detected by ELISA, after PBMC incubation with nanoparticles for 24 h at 37°C. DPBS and LPS (20 ng/mL) were used as negative and positive controls, respectively. Data are expressed as the mean ± SEM of five independent experiments, each one from a different healthy human donor, except for IL-4 where N=4. *p<0.05, **p<0.01, ****p<0.0001 are significantly different from the negative control. Data were analyzed by One-way ANOVA (post hoc Dunnett’s test). See Table 1 for DEAE12-CH-PEG-FA2 and siRNA concentrations. |
NO and ROS Production
Nanoparticles have the capacity to produce ROS and impair the normal intracellular redox homeostasis, overriding the antioxidant capacity of cells.17 NO and ROS are effector molecules released by activated macrophages to defend the cell from pathogens. Therefore, the detection of ROS and NO can help estimate the effect of DEAE12-CH-PEG-FA2/siRNA nanoparticles or free DEAE12-CH-PEG-FA2 on cell responses.
Our results on NO production showed no statistically significant difference for any of the tested particle concentrations, when compared to the negative control DPBS (Figure 6A). Similar results were found with free DEAE12-CH-PEG-FA2 (Figure S6A).
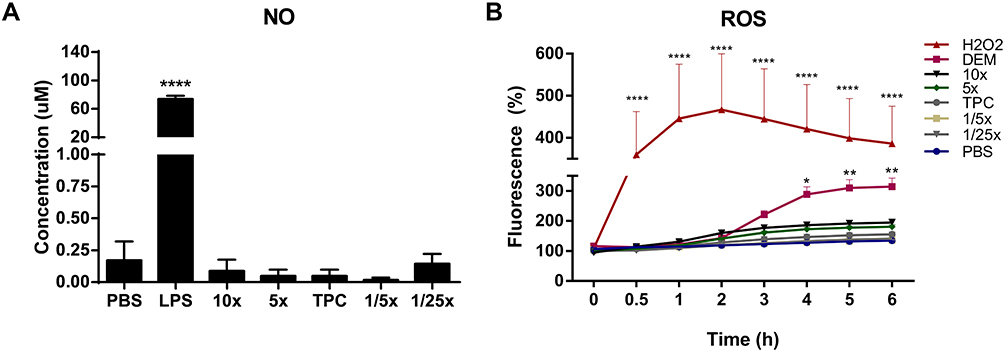 |
Figure 6 Nitric oxide (NO) and reactive oxygen species (ROS) production in response to nanoparticles. (A) NO concentration produced by Raw 264.7 macrophage cells in response to nanoparticles. Cells were incubated with samples for 48 h at 37°C. NO2− concentration was measured in cell supernatants using the Greiss reagent. DPBS and LPS (100 ng/mL) were used as negative and positive controls, respectively. Data were analyzed by One-way ANOVA (post hoc Dunnett’s test). (B) ROS induction by nanoparticles in Raw 264.7 cells. Cells were exposed to samples for 6 h, after pre-incubation with 20 μM of DCFH-DA probe. Fluorescence readings (ex. 485 nm and em. 530 nm) were performed at the indicated time points. 500 μM H2O2 and 5 mM DEM were used as positive controls. DPBS in blue represents the negative control. Data were analyzed by Two-way ANOVA (post hoc Dunnett’s test). Data from NO and ROS are expressed as the mean ± SEM of three independent experiments. *p<0.05, **p<0.01, ****p<0.0001 are significantly different from the negative control. See Table 1 for DEAE12-CH-PEG-FA2 and siRNA concentrations. |
As for ROS, Figure 6B shows no statistically significant difference between samples and the negative control DPBS. Conversely, there was an increase in ROS production for the H2O2 and DEM positive controls, from the start of exposure for the former, and 2 h after incubation for the latter. Free DEAE12-CH-PEG-FA2 had a similar response for all tested concentrations (Figure S6B).
Discussion
In the last decades, CH has garnered significant interest because of its many applications in several biomedical fields, as well as for its physicochemical properties and biocompatibility. On the nanoscale, the therapeutic potential of this polysaccharide as a drug delivery system and as a vector of genetic payloads, among others, has been acknowledged.3 We have previously reported that adding DEAE to the main CH chain modifies its pKa characteristics, improving the buffering capacity of nanoparticles, as well as their endosomal escape and the release of cargo in the cytoplasm, which enhances their transfection efficiency.19,26 As previously shown, adding FA to our nanovector also improves the capacity to target cells expressing the folate receptor (FR).28 Herein, we synthesized stable DEAE12-CH-PEG-FA2/siRNA nanoparticles at physiological pH (7.2), as demonstrated by the uniformity in size and PDI measurements over 24 h at a N/P ratio of 15:1. This characteristic improves their potential for therapeutic applications as it makes their use in biological conditions possible. CH interacts electrostatically with genetic materials to form nanoparticles without the need for organic solvents, thanks to its positively charged surface. Therefore, a simple nanoparticle preparation in a DPBS solution (pH 7.2) was favored, according to ASTM and NCL recommendations, as it prevents additives/surfactants toxicity.46,47
In our study, we followed the guidelines from ISO,48 ASTM,49 and NCL,23 which were adapted to our intended route of exposure, potential cellular targets and equipment/reagent availability. This allowed us to estimate the biological response to CH in two ways: complexed with siRNA and in free form. The protocols chosen evaluated the interaction between nanocomplexes and blood components, as our nanoparticles are intended to pass through the bloodstream before reaching their target. All the in vitro studies were performed with TPC as the principal concentration, derived from a potential therapeutic dose in an in vivo study. Moreover, we achieved a modified CH polymer synthesis with undetectable levels of endotoxin contamination (<0.1 EU/mL), to avoid interference with the in vitro outcomes.
In the present study, PBMC were studied for their potential cell-particle interactions in the bloodstream. PBMC (only monocytes) and Raw 264.7 cells express FR over their surface,50,51 which may be recognized by the folate ligand grafted to the CH structure. For their part, MG-63 cells were of interest as they do not express FR,28,52 making it possible to correlate the effect of folate targeting to the overall cell viability results. Cytotoxicity studies revealed that cell viability and LDH release were dose, time and cell-type dependent. As expected, both MG-63 and PBMC cell viability were not significantly affected at the three lowest concentration levels (TPC, 1/5x and 1/25x) and for all incubation times (4, 24 and 48 h). This suggests a low toxicity profile for our nanoparticles, which could be explained by the limited presence of FR on their surface. On the other hand, cell viability of Raw 264.7 macrophages decreased significantly in a dose and time-dependent manner. We hypothesize that the phagocytic role of these cells increases through the interaction between FR on the cell’s surface and folic ligands conjugated to the CH structure, which may explain their reduced viability. This hypothesis is supported by Yang et al,51 who report that folic acid on CH nanoparticles enhanced specific internalization and gene silencing in activated Raw 264.7 macrophages. Finally, the increasing level of LDH release from Raw 264.7 cells incubated with both DEAE12-CH-PEG-FA2/siRNA nanoparticles and free DEAE12-CH-PEG-FA2 could be the result of a cell death process or a change in cell surface permeability.53 The discrepancy between MTS and LDH results in these cells could be explained by the transient formation of nanoscale holes on the cellular membrane during particle internalization,54,55 leading to LDH release56 in the culture medium. This could occur without it being correlated to cell death activation. Therefore, cell mitochondria could still process the MTS substrate and give acceptable viability results, as those obtained for Raw 264.7 cells, despite the high levels of LDH release observed. Different CH-based nanoparticles have been tested in Raw 264.7 macrophages and PBMC. Overall, cell viability is frequently above 70% when evaluated by MTS assay or its derivatives (MTT, XTT, etc.).57–61 For instance, Raw 264.7 cells treated with a mannosylated CH-graft-polyethylenimine copolymer showed ~95% viability after a 24 h exposure at concentrations around our TPC.57 In PBMC, CH gold nanoparticles showed low cytotoxicity for concentrations up to 75 μM.60 However, most of the studies do not evaluate LDH release, making toxicity comparisons difficult, since the methodology used to evaluate cytotoxicity differs between research groups. Finally, it is clear that the CH nanoformulation, its physicochemical characteristics, tested concentrations, and percentage of cellular uptake, all contribute to the variations in cell viability results.
In the next step, hemocompatibility screening gave promising results for DEAE12-CH-PEG-FA2/siRNA nanoparticles when it came to blood-contact purposes. The interaction between erythrocyte and DEAE12-CH-PEG-FA2/siRNA nanoparticles or free DEAE12-CH-PEG-FA2 meet the ASTM threshold of <5% for hemolytic properties. This weak hemolytic response can be attributed, in part, to the attachment of PEG molecules to the CH structure, which enhanced their hemocompatible properties.62 Thereafter, we assessed plasma coagulation times and platelet aggregation properties, as data from the literature indicates that nanoparticles may trigger platelet adhesion or deplete coagulation factors, leading to thrombogenicity and bleeding.30,63 Our results showed that DEAE12-CH-PEG-FA2/siRNA nanoparticles and free DEAE12-CH-PEG-FA2 meet the established clinical limits for the test, as they did not influence any of the main coagulation pathways (intrinsic (APTT), extrinsic (PT) and common (TT)). Moreover, platelet aggregation satisfied the <20% aggregation threshold for the four lowest nanocomplex concentrations (5x, TPC, 1/5x and 1/25x), establishing their low platelet clotting properties. Finally, the results from the complement activation test also fulfill the guideline requirements as nanoparticles were unable to cleave the C3α chain molecule. This is an important characteristic to avoid allergic and anaphylactic reactions63 when aiming for systemic administration.
However, the hemagglutination assay showed a slight aggregation of red blood cells at all concentrations of DEAE12-CH-PEG-FA2/siRNA nanoparticles or free DEAE12-CH-PEG-FA2. This weak cell adhesion occurred without loss of membrane integrity, as the low hemoglobin release in the hemolysis test showed. Lima et al,38 found that the contact between CH nanoparticles and erythrocytes creates a net that could trigger hemagglutination. The polymer’s positive charge could explain this, as it may allow an electrostatic interaction with the negative surface of red blood cells, and activate the agglutination process.38 This hypothesis is supported by the findings of Fan et al,64 who confirmed that CH nanoparticles can easily attach to erythrocyte membranes. Our nanoparticles showed a zeta potential of +8.9 ± 0.7mV (N/P ratio of 15:1), which is considered a neutral surface charge according to NCL Method PCC-2.65 However, it should be noted that the erythrocytes were resuspended in a NaCl solution (pH 5.5), as recommended in the hemagglutination protocol. Thus, we assume that a decrease in pH may have protonated the CH amine groups and raised the density of the positive charge, increasing its interaction with red blood cells. Hence, the characterization of nanocomplexes with the same medium used for in vitro assays is appropriate. Unfortunately, it was not possible to exactly reproduce the testing conditions for a DLS measure, as interference made it impossible to detect an acceptable reading. Interestingly, current hemagglutination assays still lack a validated quantitative and predictive technique. However, the search for alternative methods is beyond the framework of this study.
We also analyzed the ability of nanoparticles to modulate cytokine expression, namely TNF-α, IL-1β, IL-6, IL-8, IL-4 and IL-10, as they play a key role in the inflammatory regulation processes.66 Overall, most of the cytokine expression levels were not affected by our nanoparticles, although IL-8 and IL-1β were induced at some concentrations. Cytokines, such as TNF-α, IL-1β and IL-6, have a significant function in the acute inflammatory process, causing swelling and redness.67 This response is increased when neutrophils are enrolled and activated, led by IL-8 chemokine.67 It is interesting to see that only the IL-1β and IL-8 levels were significantly released in our study, whereas TNF-α and IL-6 remained unaltered. It is also important to note that IL-8 induction was only statistically significant for the highest concentration tested, which was intended to achieve some toxicological response. TNF-α and IL-1β are the primary cytokines that trigger and maintain inflammatory responses.68 The fact that IL-1β was induced but TNF-α was not seems to reflect an incomplete activation of the inflammatory pathway by DEAE12-CH-PEG-FA2/siRNA nanoparticles. This hypothesis is supported by the normal levels of IL-10 induced by our nanocomplexes, as this cytokine is substantially secreted during an inflammatory response to counterbalance the effects of pro-inflammatory mediators.69 Similarly to IL-10, IL-4 secretion was comparable to baseline. As IL-4 is a mediator involved in IgE induction68 throughout an allergic reaction, its normal levels let us surmise that our CH is safe (as a derivative of shrimps’ exoskeleton) from a hypersensitivity response.
IL-1β and IL-6 are known to cause fever and are therefore useful as pyrogenic markers when testing pharmaceutical preparations.30 The fact that the LAL assay had a negative outcome, and IL-6 expression levels were low, allowed us to confirm that our CH nanoformulation is free of endotoxin contamination. High expression levels of IL-1β have been associated to CH’s capacity to activate the NLRP3 inflammasome pathway in human PBMC, mouse peritoneal macrophages and mouse bone marrow–derived macrophages (BMMΦ).70 BMMΦ cells released a significant level of IL-1β in response to CH without secretion of other pro-inflammatory cytokines, such as TNF-α and IL-6, supporting our results.70 Similarly, Feng et al71 have reported an IL-1β production by Raw 264.7 macrophage cells, after stimulation with oligochitosans, which may be related to the recognition of this molecule by mannose receptors on the cell’s surface. There are three main theories regarding the activation of the inflammasome pathway: the production of ROS, the destabilization of lysosomes during particle escapement, and the K+efflux.70 According to our results, neither DEAE12-CH-PEG-FA2/siRNA nanoparticles nor free DEAE12-CH-PEG-FA2 produced ROS, which suggests that inflammasome activation is not caused by ROS in this study. With regard to the lysosome translocation theory, we speculate that during nanoparticle escape from these organelles the inflammasome system could be activated, which may explain the production of IL-1β. In turn, IL-1β, as a mediator of the acute response, may have an effect on immune cells to produce IL-8. CH has been recognized as an immunostimulatory agent,72 as an adjuvant in vaccines,73 and as a polymer with anti-inflammatory properties.74 This last characteristic could set it apart from other polymers with a history of more consistent inflammatory reactions, such as PEI,67 where intracellular stress and apoptotic cell death processes are involved.75 In any case, deeper mechanistic studies about the inflammasome pathways and other CH signaling pathways are needed, to improve our understanding of the processes involved in the cellular response to CH.
Finally, oxidative stress studies showed that neither DEAE12-CH-PEG-FA2/siRNA nanoparticles nor free DEAE12-CH-PEG-FA2 induced ROS or NO production by Raw 264.7 macrophage cells. These outcomes are interesting as nanoparticle-induced oxidative stress is involved in inflammatory response, cytotoxicity and genotoxicity.76 CH has been associated with antioxidant activity thanks to its ROS scavenging ability.77 For instance, CH has shown anti-oxidative properties in a LPS-injected mouse model via the restoration of glutathione levels and catalase activity.78 Other CH modifications, such as gallic acid grafted onto O-carboxymethyl CH (GA-g-CMCS), showed a protective action against hydrogen peroxide treated cells, reducing ROS production and restoring superoxide dismutase, catalase and glutathione peroxidase activity.79 Also noteworthy is the literature data showing the capacity of CH to produce ROS and consequently oxidative stress. Jesus et al80 found that ROS production in Raw 264.7 macrophage cells was associated with the %DDA of their CH polymer. Thus an 80% DDA in CH nanoparticles and polymer were able to induce ROS in a concentration-dependent manner, while a 93% DDA did not. Moreover, Sarangapani et al81 found that with a particular size of positively charged CH nanoparticles, the oxidative stress mechanism can be triggered through ROS generation and the depletion of glutathione, becoming selectively cytotoxic for leukemia cells. Similarly, Martinez et al60 proposed CH gold nanoparticles (CH-AuNPs) to induce ROS production as a possible treatment for cancer cells. Reactive nitrogen species (RNS) production by phagocytes, especially NO, are key molecules to measure nanoparticle-induced injury,76 and results reported in the literature are contradictory as for ROS. Thus, some CH formulations have the ability to induce NO production as part of the oxidative stress response,59 while others have no effect.80 It was also reported that CH possesses the ability to reduce the LPS-induced NO levels by Raw 264.7 macrophages.80,82 This conflicting data can be explained by the preparation procedures of the CH samples and their physicochemical characteristics, such as composition, size, charge and surface reactivity.76
Taking into consideration the general results from all assays, and the fact that DPBS outcomes are comparable to those of non-treated cells, we concluded that this particle suspension medium did not influence the data. Therefore, as DEAE12-CH-PEG-FA2/siRNA nanoparticles and free DEAE12-CH-PEG-FA2 had similar biological responses, we deduced that CH is the component with the strongest effect in the nanoformulation. This study allowed us to evaluate in vitro, the potential biological response to an in vivo dose of 30 μg siRNA-SSB/mouse (1.5 mg/kg) complexed with 320 μg of DEAE12-CH-PEG-FA2/dose. As in vitro assays may predict the toxicity of in vivo studies,30 a dose ranging between TPC and 1/5x concentration will be considered for the animal model.
This basic toxicological screening provides a strong starting point to evaluate the safety profile of nanomaterials (see Table 2). New complementary standard guidelines addressing nanotoxicology are available in several FDA83,84 and ISO85 reports. Guideline implementation makes it possible to compare outcomes from different studies across laboratories, as the experimental conditions are already established by the different organizations. Finally, relevant aspects, such as endotoxin contamination and nanoparticle characterization, have to be addressed early on, at the preclinical development stage, to avoid inconsistencies with in vitro results, to improve our interpretation and to correlate biological responses.
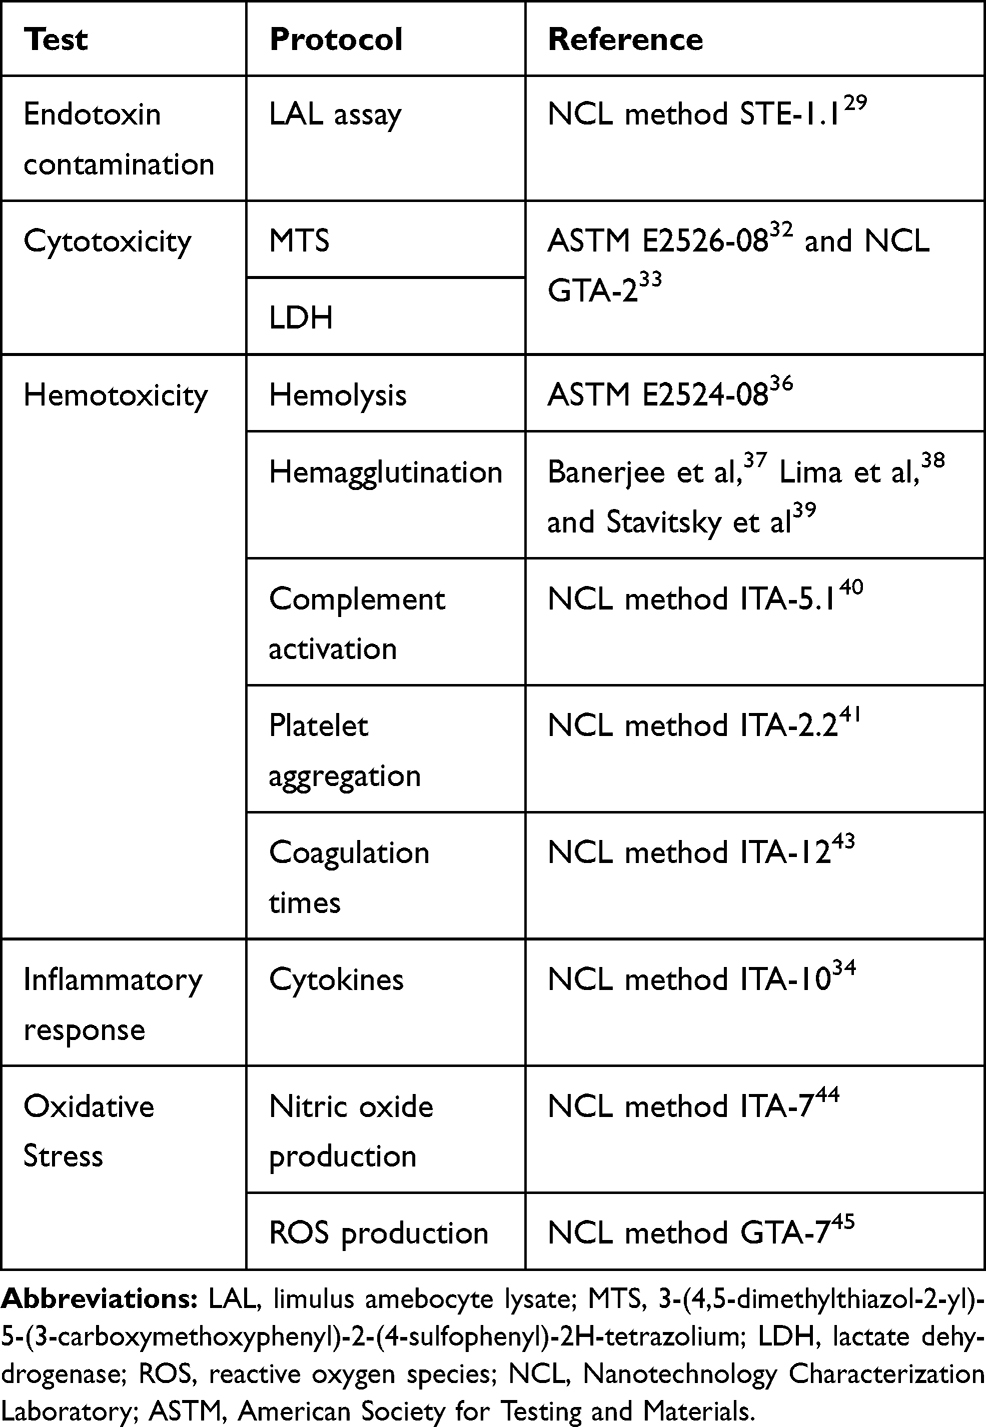 |
Table 2 Toxicological Screening Guidelines |
Conclusion
This study supports the application of endotoxin-free DEAE12-CH-PEG-FA2/siRNA nanoparticles for potential blood-contact purposes, thanks to their low hemotoxicity. This is illustrated by their weak hemolytic and platelet aggregation properties, and the absence of effect on complement system and coagulation times. Their size, siRNA complexation and stability over time are suitable for various applications. We observed that cytotoxicity is related to dose, cell type and exposure times. Moreover, their low oxidative stress response and cytokine production make them a promising candidate for gene therapy applications, especially in inflammatory conditions, warranting further investigation. Complementary studies will be carried out to clarify the mechanisms involved in LDH release and the IL-1β levels observed in our study. Based on its toxicological profile reported herein, we conclude that this DEAE12-CH-PEG-FA2/siRNA platform is safe for potential biomedical applications administered intravenously, orally or topically. Future trials of our nanoparticles will address the biodistribution and toxicity of particles in a mouse model, using an in vivo imaging system as well as monitoring of the biomarkers for organ function.
Abbreviations
APTT, activated partial thromboplastin time; ASTM, American Society for Testing and Materials; AUC, area under the curve; BMMΦ, mouse bone marrow–derived macrophages; CH, chitosan; CVF, cobra venom factor; DA, degree of acetylation; DDA, degree of deacetylation; DEAE, diethylaminoethyl; DEM, diethyl maleate; DPBS, Dulbecco’s phosphate-buffered saline; DS, degree of substitution; FA, folic acid; FDA, Food and Drug Administration; FR, folate receptors; GPC, permeation chromatography; H2O2, hydrogen peroxide; HBSS, Hanks’ balanced salt solution; H-NMR, nuclear magnetic resonance; IL, interleukin; ISO, International Organization for Standardization; LAL, limulus amebocyte lysate; LDH, lactate dehydrogenase; LPS, lipopolysaccharides; MM, molar mass; MTS, 3-(4,5-dimethylthiazol-2-yl)-5-(3-carboxymethoxyphenyl)-2-(4-sulfophenyl)-2H-tetrazolium; MW, molecular weight; N/P, amino groups/phosphate groups; NCL, Nanotechnology Characterization Laboratory; NiTi, nickel-titanium; NO, nitric oxide; OECD, Organization for Economic Cooperation and Development; PBMC, peripheral blood mononuclear cells; PEG, polyethylene glycol; PEI, polyethylenimine; PFH, plasma-free hemoglobin; PPP, platelet poor plasma; PRP, platelet-rich plasma; PT, prothrombin time; ROS, reactive oxygen species; SEM, standard error of the mean; siRNA, small interfering RNA; TBH, total blood hemoglobin; TNF-α, tumor necrosis factor alpha; TPC, theoretical plasma concentration; TT, thrombin time.
Data Sharing Statement
Supporting data are available from authors.
Ethics Approval and Informed Consent
Experiments with human blood were approved by the Research Ethics Committee from Hôpital du Sacré-Cœur de Montréal (Protocol # 2017-1462). Informed consent was obtained from healthy donor volunteers who were not ill nor under medication at the time of blood sample collection.
Acknowledgment
This work was done in Montréal (QC, Canada) and Sao Jose do Rio Preto (SP, Brazil).
Author Contributions
All authors made substantial contributions to conception and design, acquisition of data, or analysis and interpretation of data; took part in drafting the article or revising it critically for important intellectual content; gave final approval of the version to be published; and agree to be accountable for all aspects of the work.
Disclosure
The authors report grants from Ministère de l’Économie, de la Science et de l’Innovation du Québec, the Chaire de Recherche en Orthopédie de l’Université de Montréal à l’Hôpital du Sacré-Coeur de Montréal, the Centre de Recherche of Hôpital du Sacré-Coeur de Montréal (Canada) and FAPESP (Brazil) during the conduct of the study. Elsa Patricia Rondon, Houda Abir Benabdoun and Francis Vallières report scholarships from the Fonds de Recherche du Québec – Santé (FRQS). Maicon Segalla Petronio reports scholarship from FAPESP (Brazil). The authors report no other potential conflicts of interest in this work.
References
1. Bobo D, Robinson KJ, Islam J, Thurecht KJ, Corrie SR. Nanoparticle-based medicines: a review of FDA-approved materials and clinical trials to date. Pharm Res. 2016;33(10):2373–2387. doi:10.1007/s11095-016-1958-5
2. Shi Q, Rondon-Cavanzo E-P, Dalla Picola IP, et al. In vivo therapeutic efficacy of TNFα silencing by folate-PEG-chitosan-DEAE/siRNA nanoparticles in arthritic mice. Int J Nanomed. 2018;13:387–402. doi:10.2147/IJN.S146942
3. Shi Q, Tiera MJ, Zhang X, Dai K, Benderdour M, Fernandes JC. Chitosan-DNA/siRNA nanoparticles for gene therapy. IntechOpen Limited ed. London, UK. In: Yuan X, editor. Non-Viral Gene Therapy. 19. 2011:455–480
4. Muxika A, Etxabide A, Uranga J, Guerrero P, De La Caba K. Chitosan as a bioactive polymer: processing, properties and applications. Int J Biol Macromol. 2017;105:1358–1368. doi:10.1016/j.ijbiomac.2017.07.087
5. Abdelhamid HN, El-Bery HM, Metwally AA, Elshazly M, Hathout RM. Synthesis of CdS-modified chitosan quantum dots for the drug delivery of Sesamol. Carbohydr Polym. 2019;214:90–99. doi:10.1016/j.carbpol.2019.03.024
6. Zhao D, Yu S, Sun B, Gao S, Guo S, Zhao K. Biomedical applications of chitosan and its derivative nanoparticles. Polymers. 2018;10(4):462. doi:10.3390/polym10040462
7. Mohebbi S, Nezhad MN, Zarrintaj P, et al. Chitosan in biomedical engineering: a critical review. Curr Stem Cell Res Ther. 2019;14(2):93–116. doi:10.2174/1574888X13666180912142028
8. Dowaidar M, Nasser Abdelhamid H, Hällbrink M, Langel Ü, Zou X. Chitosan enhances gene delivery of oligonucleotide complexes with magnetic nanoparticles–cell-penetrating peptide. J Biomater Appl. 2018;33(3):392–401. doi:10.1177/0885328218796623
9. Guo X, Sun T, Zhong R, et al. Effects of chitosan oligosaccharides on human blood components. Front Pharmacol. 2018;9:1412. doi:10.3389/fphar.2018.01412
10. Dash BC, Réthoré G, Monaghan M, Fitzgerald K, Gallagher W, Pandit A. The influence of size and charge of chitosan/polyglutamic acid hollow spheres on cellular internalization, viability and blood compatibility. Biomaterials. 2010;31(32):8188–8197. doi:10.1016/j.biomaterials.2010.07.067
11. Shelma R, Sharma CP. Development of lauroyl sulfated chitosan for enhancing hemocompatibility of chitosan. Colloids Surf B Biointerfaces. 2011;84(2):561–570. doi:10.1016/j.colsurfb.2011.02.018
12. Mohammadi F, Golafshan N, Kharaziha M, Ashrafi A. Chitosan-heparin nanoparticle coating on anodized NiTi for improvement of blood compatibility and biocompatibility. Int J Biol Macromol. 2019;127:159–168. doi:10.1016/j.ijbiomac.2019.01.026
13. Pereira P, Pedrosa SS, Correia A, et al. Biocompatibility of a self-assembled glycol chitosan nanogel. Toxicol in Vitro. 2015;29(3):638–646. doi:10.1016/j.tiv.2014.11.004
14. Magalhães PO, Lopes AM, Mazzola PG, Rangel-Yagui C, Penna T, Pessoa JA. Methods of endotoxin removal from biological preparations: a review. J Pharm Pharm Sci. 2007;10(3):388–404.
15. Halamoda‐Kenzaoui B, Holzwarth U, Roebben G, Bogni A, Bremer‐Hoffmann S. Mapping of the available standards against the regulatory needs for nanomedicines. Wiley Interdiscip Rev Nanomed Nanobiotechnol. 2019;11(1):e1531. doi:10.1002/wnan.1531
16. Urbán P, Liptrott NJ, Bremer S. Overview of the blood compatibility of nanomedicines: A trend analysis of in vitro and in vivo studies. Wiley Interdiscip Rev Nanomed Nanobiotechnol. 2019;11(3):e1546. doi:10.1002/wnan.1546
17. ISO/TR 16197:2014(E). Nanotechnologies compilation and description of toxicological screening methods for manufactured nanomaterials. Available from: www.iso.org.
18. Locascio L, Reipa V, Zook J, Pleus R. Nanomaterial toxicity: emerging standards and efforts to support standards development. In: Murashov V, Howard J, editors. Nanotechnology Standards. Springer Science & Business Media; 2011:179–208.
19. de Souza RHFV, Dalla Picola IP, Shi Q, et al. Diethylaminoethyl-chitosan as an efficient carrier for siRNA delivery: improving the condensation process and the nanoparticles properties. Int J Biol Macromol. 2018;119:186–197. doi:10.1016/j.ijbiomac.2018.07.072
20. EN ISO 10993–4:2009. Biological evaluation of medical devices part 4: selection of tests for interactions with blood. Available from: www.iso.org.
21. ASTM F1903–10. Standard practice for testing for biological responses to particles in vitro. West Conshohocken, PA:ASTM International; 2010. DOI: 10.1520/F1903-10.
22. American Society for Testing and Materials [homepage on the Internet]. E56.03 environment, health, and safety. Available from: https://www.astm.org/COMMIT/SUBCOMMIT/E5603.htm.
23. Nanotechnology Characterization Laboratory [homepage on the Internet]. Assay cascade protocols. Available from: https://ncl.cancer.gov/resources/assay-cascade-protocols.
24. Abrams MT, Koser ML, Seitzer J, et al. Evaluation of efficacy, biodistribution, and inflammation for a potent siRNA nanoparticle: effect of dexamethasone co-treatment. Mol Ther. 2010;18(1):171–180. doi:10.1038/mt.2009.208
25. Seitzer J, Zhang H, Koser M, Pei Y, Abrams M. Effect of biological matrix and sample preparation on qPCR quantitation of siRNA drugs in animal tissues. J Pharmacol Toxicol Methods. 2011;63(2):168–173. doi:10.1016/j.vascn.2010.09.005
26. Oliveira F, Dalla Picola IP, Shi Q, et al. Synthesis and evaluation of diethylethylamine–chitosan for gene delivery: composition effects on the in vitro transfection efficiency. Nanotechnology. 2013;24(5):055101. doi:10.1088/0957-4484/24/5/055101
27. Cho KC, Jeong JH, Chung HJ, Joe CO, Kim SW, Park TG. Folate receptor-mediated intracellular delivery of recombinant caspase-3 for inducing apoptosis. J Control Release. 2005;108(1):121–131. doi:10.1016/j.jconrel.2005.07.015
28. Fernandes JC, Qiu X, Winnik FM, et al. Low molecular weight chitosan conjugated with folate for siRNA delivery in vitro: optimization studies. Int J Nanomed. 2012;7:5833–5845. doi:10.2147/IJN.S35567
29. Nanotechnology Characterization Laboratory [homepage on the Internet]. Neun BW, Ilinskaya AN, Dobrovolskaia MA. NCL method STE-1.1 detection and quantification of gram negative bacterial endotoxin contamination in nanoparticle formulations by end point chromogenic LAL assay. Version 1.3. Available from: https://ncl.cancer.gov/resources/assay-cascade-protocols.
30. Dobrovolskaia MA, McNeil SE. Understanding the correlation between in vitro and in vivo immunotoxicity tests for nanomedicines. J Control Release. 2013;172(2):456–466. doi:10.1016/j.jconrel.2013.05.025
31. Food and Drug Administration [homepage on the Internet]. Estimating the maximum safe starting dose in initial clinical trials for therapeutics in adult healthy volunteers; 2005. Available from: https://www.fda.gov/regulatory-information/search-fda-guidance-documents/estimating-maximum-safe-starting-dose-initial-clinical-trials-therapeutics-adult-healthy-volunteers.
32. ASTM E2526-08(2013), Standard Test Method for Evaluation of Cytotoxicity of Nanoparticulate Materials in Porcine Kidney Cells and Human Hepatocarcinoma Cells. West Conshohocken, PA:ASTM International;2013. doi:10.1520/E2526-08R13.
33. Nanotechnology Characterization Laboratory [homepage on the Internet]. Stern ST, Adiseshaiah PP, Potter TM. NCL method GTA-2 hep G2 hepatocarcinoma cytotoxicity assay. Version 1.2. Available from: https://ncl.cancer.gov/resources/assay-cascade-protocols.
34. Nanotechnology Characterization Laboratory [homepage on the Internet]. Potter TM, Neun BW, Rodriguez J, Ilinskaya AN, Dobrovolskaia MA. NCL method ITA-10 preparation of human whole blood and peripheral blood mononuclear cell cultures to analyze nanoparticle potential to induce inflammatory cytokines, chemokines and interferons in vitro. Version 1.2. Available from: https://ncl.cancer.gov/resources/assay-cascade-protocols.
35. EN ISO 10993-5:2009. Biological evaluation of medical devices - Part 5: tests for in vitro cytotoxicity. Available from: www.iso.org.
36. ASTM E2524-08(2013). Standard test method for analysis of hemolytic properties of nanoparticles. West Conshohocken, PA:ASTM International; 2013. doi:10.1520/E2524-08R13,.
37. Banerjee N, Sengupta S, Roy A, Ghosh P, Das K, Das S. Functional alteration of a dimeric insecticidal lectin to a monomeric antifungal protein correlated to its oligomeric status. PLoS One. 2011;6(4):e18593. doi:10.1371/journal.pone.0018593
38. Lima J, Sarmento RR, Souza J, et al. Evaluation of hemagglutination activity of chitosan nanoparticles using human erythrocytes. Biomed Res Int. 2015;2015.
39. Stavitsky AB, Jarchow C. Micromethods for the study of proteins and antibodies: I. Procedure and general applications of hemagglutination and hemagglutination-inhibition reactions with tannic acid and protein-treated red blood cells. J Immunol. 1954;72(5):360–367.
40. Nanotechnology Characterization Laboratory [homepage on the Internet]. Neun BW, Ilinskaya AN, Dobrovolskaia MA. NCL method ITA-5.1 qualitative analysis of total complement activation by western blot. Version 1.2. Available from: https://ncl.cancer.gov/resources/assay-cascade-protocols.
41. Nanotechnology Characterization Laboratory [homepage on the Internet]. Rodriguez J, Neun BW, Ilinskaya AN, Dobrovolskaia MA. NCL method ITA-2.2 analysis of platelet aggregation by light transmission aggregometry. Version 1.2. Available from: https://ncl.cancer.gov/resources/assay-cascade-protocols.
42. Nanotechnology Characterization Laboratory [homepage on the Internet]. Rodriguez J, Neun BW, Ilinskaya AN, Dobrovolskaia MA. NCL method ITA-2.1 analysis of platelet aggregation by cell counting. Version 1.2. Available from: https://ncl.cancer.gov/resources/assay-cascade-protocols.
43. Nanotechnology Characterization Laboratory [homepage on the Internet]. Rodriguez J, Neun BW, Ilinskaya AN, Dobrovolskaia MA. NCL method ITA-12 analysis of nanoparticle effects on plasma coagulation times in vitro. Version 1.2. Available from: https://ncl.cancer.gov/resources/assay-cascade-protocols.
44. Nanotechnology Characterization Laboratory [homepage on the Internet]. Rodriguez J, Neun BW, Ilinskaya AN, Dobrovolskaia MA. NCL method ITA-7 detection of nitric oxide production by the macrophage cell line RAW264.7. Version 1.2. Available from: https://ncl.cancer.gov/resources/assay-cascade-protocols.
45. Nanotechnology Characterization Laboratory [homepage on the Internet]. Stern ST, Zolnik BS. NCL method GTA-7 hepatocyte primary ROS assay. Version 1.1. Available from: https://ncl.cancer.gov/resources/assay-cascade-protocols.
46. Ginzburg AL, Truong L, Tanguay RL, Hutchison JE. Synergistic toxicity produced by mixtures of biocompatible gold nanoparticles and widely used surfactants. ACS Nano. 2018;12(6):5312–5322. doi:10.1021/acsnano.8b00036
47. Nadesh RND, P R S, Vadakumpully S, et al. Hematotoxicological analysis of surface-modified and -unmodified chitosan nanoparticles. J Biomed Mater Res A. 2013;101(10):2957–2966. doi:10.1002/jbm.a.34591
48. International Organization for Standardization [homepage on the Internet]. ISO/TC 229 nanotechnologies. Available from: https://www.iso.org/committee/381983/x/catalogue/.
49. American Society for Testing and Materials [homepage on the Internet]. Nanotechnology standards. Available from: https://www.astm.org/Standards/nanotechnology-standards.html.
50. Shen J, Hilgenbrink AR, Xia W, et al. Folate receptor‐β constitutes a marker for human proinflammatory monocytes. J Leukoc Biol. 2014;96(4):563–570. doi:10.1189/jlb.2AB0713-372R
51. Yang C, Gao S, Kjems J. Folic acid conjugated chitosan for targeted delivery of siRNA to activated macrophages in vitro and in vivo. J Mater Chem B. 2014;2(48):8608–8615. doi:10.1039/C4TB01374C
52. Wang X, Yao S, Ahn H-Y, et al. Folate receptor targeting silica nanoparticle probe for two-photon fluorescence bioimaging. Biomed Opt Express. 2010;1(2):453–462. doi:10.1364/BOE.1.000453
53. Contini C, Schneemilch M, Gaisford S, Quirke N. Nanoparticle–membrane interactions. J Exp Nanosci. 2018;13(1):62–81. doi:10.1080/17458080.2017.1413253
54. Lin J, Alexander-Katz A. Cell membranes open “doors” for cationic nanoparticles/biomolecules: insights into uptake kinetics. ACS Nano. 2013;7(12):10799–10808. doi:10.1021/nn4040553
55. Leroueil PR, Berry SA, Duthie K, et al. Wide varieties of cationic nanoparticles induce defects in supported lipid bilayers. Nano Lett. 2008;8(2):420–424. doi:10.1021/nl0722929
56. Hong S, Leroueil PR, Janus EK, et al. Interaction of polycationic polymers with supported lipid bilayers and cells: nanoscale hole formation and enhanced membrane permeability. Bioconjug Chem. 2006;17(3):728–734. doi:10.1021/bc060077y
57. Jiang H-L, Kim Y-K, Arote R, et al. Mannosylated chitosan-graft-polyethylenimine as a gene carrier for raw 264.7 cell targeting. Int J Pharm. 2009;375(12):133–139. doi:10.1016/j.ijpharm.2009.03.033
58. Xiao B, Ma P, Ma L, et al. Effects of tripolyphosphate on cellular uptake and RNA interference efficiency of chitosan-based nanoparticles in Raw 264.7 macrophages. J Colloid Interface Sci. 2017;490:520–528. doi:10.1016/j.jcis.2016.11.088
59. Yang Y, Xing R, Liu S, et al. Immunostimulatory effects of sulfated chitosans on RAW 264.7 mouse macrophages via the activation of PI3 K/Akt signaling pathway. Int J Biol Macromol. 2018;108:1310–1321. doi:10.1016/j.ijbiomac.2017.11.042
60. Martínez-Torres AC, Zarate-Triviño DG, Lorenzo-Anota HY, Ávila-Ávila A, Rodríguez-Abrego C, Rodríguez-Padilla C. Chitosan gold nanoparticles induce cell death in HeLa and MCF-7 cells through reactive oxygen species production. Int J Nanomed. 2018;13:3235–3250. doi:10.2147/IJN.S165289
61. Alinejad V, Somi MH, Baradaran B, et al. Co-delivery of IL17RB siRNA and doxorubicin by chitosan-based nanoparticles for enhanced anticancer efficacy in breast cancer cells. Biomed Pharmacother. 2016;83:229–240. doi:10.1016/j.biopha.2016.06.037
62. Balan V, Verestiuc L. Strategies to improve chitosan hemocompatibility: a review. Eur Polym J. 2014;53:171–188. doi:10.1016/j.eurpolymj.2014.01.033
63. Dobrovolskaia MA, Aggarwal P, Hall JB, McNeil SE. Preclinical studies to understand nanoparticle interaction with the immune system and its potential effects on nanoparticle biodistribution. Mol Pharm. 2008;5(4):487–495. doi:10.1021/mp800032f
64. Fan W, Yan W, Xu Z, Ni H. Erythrocytes load of low molecular weight chitosan nanoparticles as a potential vascular drug delivery system. Colloids Surf B Biointerfaces. 2012;95:258–265. doi:10.1016/j.colsurfb.2012.03.006
65. Nanotechnology Characterization Laboratory [homepage on the Internet]. Clogston JD. NCL method PCC-2 measuring zeta potential of nanoparticles. Version 1.1. Available from: https://ncl.cancer.gov/resources/assay-cascade-protocols.
66. Shankar E, Ramasubramanian A. Hemocompatibility of Nanoparticles. In: Sitharaman B, editor. Nanobiomaterials handbook. CRC Press; 2016:1–31.
67. Elsabahy M, Wooley KL. Cytokines as biomarkers of nanoparticle immunotoxicity. Chem Soc Rev. 2013;42(12):5552–5576. doi:10.1039/c3cs60064e
68. Feghali CA, Wright TM. Cytokines in acute and chronic inflammation. Front Biosci. 1997;2(1):d12–d26. doi:10.2741/A171
69. O’Shea JJ, Murray PJ. Cytokine signaling modules in inflammatory responses. Immunity. 2008;28(4):477–487. doi:10.1016/j.immuni.2008.03.002
70. Bueter CL, Lee CK, Wang JP, Ostroff GR, Specht CA, Levitz SM. Spectrum and mechanisms of inflammasome activation by chitosan. J Immunol. 2014;192(12):5943–5951. doi:10.4049/jimmunol.1301695
71. Feng J, Zhao L, Yu Q. Receptor-mediated stimulatory effect of oligochitosan in macrophages. Biochem Biophys Res Commun. 2004;317(2):414–420. doi:10.1016/j.bbrc.2004.03.048
72. Fong D, Hoemann CD. Chitosan immunomodulatory properties: perspectives on the impact of structural properties and dosage. Future Sci OA. 2017;4(1):FSO225. doi:10.4155/fsoa-2017-0064
73. Carroll EC, Jin L, Mori A, et al. The vaccine adjuvant chitosan promotes cellular immunity via DNA sensor cGAS-STING-dependent induction of type I interferons. Immunity. 2016;44(3):597–608. doi:10.1016/j.immuni.2016.02.004
74. Azuma K, Osaki T, Minami S, Okamoto Y. Anticancer and anti-inflammatory properties of chitin and chitosan oligosaccharides. J Funct Biomater. 2015;6(1):33–49. doi:10.3390/jfb6010033
75. Beyerle A, Irmler M, Beckers J, Kissel T, Stoeger T. Toxicity pathway focused gene expression profiling of PEI-based polymers for pulmonary applications. Mol Pharm. 2010;7(3):727–737. doi:10.1021/mp900278x
76. Manke A, Wang L, Rojanasakul Y. Mechanisms of nanoparticle-induced oxidative stress and toxicity. Biomed Res Int. 2013;2013:942916. doi:10.1155/2013/942916
77. Ngo D-H, Vo T-S, Ngo D-N, et al. Biological effects of chitosan and its derivatives. Food Hydrocoll. 2015;51:200–216. doi:10.1016/j.foodhyd.2015.05.023
78. Qiao Y, Bai X-F, Du Y-G. Chitosan oligosaccharides protect mice from LPS challenge by attenuation of inflammation and oxidative stress. Int Immunopharmacol. 2011;11(1):121–127. doi:10.1016/j.intimp.2010.10.016
79. Bai R, Yong H, Zhang X, Liu J, Liu J. Structural characterization and protective effect of gallic acid grafted O-carboxymethyl chitosan against hydrogen peroxide-induced oxidative damage. Int J Biol Macromol. 2020;143:49–59. doi:10.1016/j.ijbiomac.2019.12.037
80. Jesus S, Marques AP, Duarte A, et al. Chitosan nanoparticles: shedding light on immunotoxicity and hemocompatibility. Front Bioeng Biotechnol. 2020;8:100. doi:10.3389/fbioe.2020.00100
81. Sarangapani S, Patil A, Ngeow YK, Elsa Mohan R, Asundi A, Lang MJ. Chitosan nanoparticles’ functionality as redox active drugs through cytotoxicity, radical scavenging and cellular behaviour. Integr Biol. 2018;10(5):313–324. doi:10.1039/C8IB00038G
82. Xu Q, Liu M, Liu Q, Wang W, Du Y, Yin H. The inhibition of LPS-induced inflammation in RAW264. 7 macrophages via the PI3K/Akt pathway by highly N-acetylated chitooligosaccharide. Carbohydr Polym. 2017;174:1138–1143. doi:10.1016/j.carbpol.2017.07.051
83. Food and Drug Administration [homepage on the Internet]. Nanotechnology/nanotoxicology; 2019. Available from: https://www.fda.gov/medical-devices/cdrh-research-programs/nanotechnologynanotoxicology.
84. Food and Drug Administration [homepage on the Internet]. Nanotechnology task force report; 2007. Available from: https://www.fda.gov/science-research/nanotechnology-programs-fda/nanotechnology-task-force-report-2007#definitions.
85. ISO/TR 10993–22:2017. Biological evaluation of medical devices part 22: guidance on nanomaterials. Available from: www.iso.org.
 © 2020 The Author(s). This work is published and licensed by Dove Medical Press Limited. The full terms of this license are available at https://www.dovepress.com/terms.php and incorporate the Creative Commons Attribution - Non Commercial (unported, v3.0) License.
By accessing the work you hereby accept the Terms. Non-commercial uses of the work are permitted without any further permission from Dove Medical Press Limited, provided the work is properly attributed. For permission for commercial use of this work, please see paragraphs 4.2 and 5 of our Terms.
© 2020 The Author(s). This work is published and licensed by Dove Medical Press Limited. The full terms of this license are available at https://www.dovepress.com/terms.php and incorporate the Creative Commons Attribution - Non Commercial (unported, v3.0) License.
By accessing the work you hereby accept the Terms. Non-commercial uses of the work are permitted without any further permission from Dove Medical Press Limited, provided the work is properly attributed. For permission for commercial use of this work, please see paragraphs 4.2 and 5 of our Terms.