")
Back to Journals » International Journal of Women's Health » Volume 14
Evaluation of Triglyceride Glucose Index and Homeostasis Model of Insulin Resistance in Patients with Polycystic Ovary Syndrome
Authors Zheng Y , Yin G, Chen F, Lin L , Chen Y
Received 29 August 2022
Accepted for publication 13 December 2022
Published 23 December 2022 Volume 2022:14 Pages 1821—1829
DOI https://doi.org/10.2147/IJWH.S387942
Checked for plagiarism Yes
Review by Single anonymous peer review
Peer reviewer comments 2
Editor who approved publication: Professor Elie Al-Chaer
Yitong Zheng,1,* Guoshu Yin,1,* Fu Chen,2 Ling Lin,3,4 Yongsong Chen1
1Department of Endocrinology and Metabolism, The First Affiliated Hospital of Shantou University Medical College, Shantou, People’s Republic of China; 2Department of Nutrition, The First Affiliated Hospital of Shantou University Medical College, Shantou, People’s Republic of China; 3Department of Rheumatology and Immunology, The First Affiliated Hospital of Shantou University Medical College, Shantou, People’s Republic of China; 4Department of Rheumatology, Shantou University Medical College, Shantou, People’s Republic of China
*These authors contributed equally to this work
Correspondence: Ling Lin, Department of Rheumatology and Immunology, The First Affiliated Hospital of Shantou University Medical College, Shantou, People’s Republic of China, Tel +86-0754-88258290, Fax +86-0754-88259850, Email [email protected] Yongsong Chen, Department of Endocrinology and Metabolism, The First Affiliated Hospital of Shantou University Medical College, Shantou, People’s Republic of China, Tel +86-0754-88258290, Fax +86-0754-88259850, Email [email protected]
Purpose: To use the triglyceride glucose (TyG) index to evaluate insulin resistance (IR) in patients with polycystic ovary syndrome (PCOS) and to explore alternative indicators for early identification of IR.
Patients and Methods: This study included 114 patients with PCOS and 61 healthy volunteers. Pearson or Spearman correlations were calculated to compare the association between the TyG index and triglyceride glucose body mass index (TyG-BMI) with homeostatic model assessment for IR (HOMA-IR), homeostasis model assessment for β-cell function (HOMA-β), quantitative insulin sensitivity check index (QUICKI), and fasting glucose-to-insulin ratio (FG-IR). The receiver operating characteristic (ROC) curve was used to evaluate the sensitivity and specificity of the TyG index and TyG-BMI in identifying IR (defined as HOMA-IR ≥ 2.5) in patients with PCOS.
Results: Correlation analyses revealed that the TyG index of the PCOS group was positively correlated with HOMA-IR (r=0.515, P< 0.01) and HOMA-β (r=0.348, P< 0.01), but negatively correlated with QUICKI (r=− 0.532, P< 0.01) and FG-IR (r=− 0.394, P< 0.01). The ROC curve of IR defined by HOMA-IR showed that the AUC value of TyG-BMI was the highest, at 0.796 (95% confidence interval (CI): 0.710– 0.866, P< 0.001) when the cut-off point was 191.53, with 85.3% sensitivity and 73.9% specificity values. For the TyG index, the AUC was 0.781 (95% CI: 0.693– 0.853, P< 0.001) when 8.51 was the cut-off point, with a sensitivity of 63.2% and specificity of 87.0%.
Conclusion: This study found that the TyG index and TyG-BMI performed better than traditional lipid ratios, such as triglycerides/high density lipoprotein cholesterol (TG/HDL-C), in predicting IR and may be used as markers of IR in Chinese patients with PCOS.
Keywords: triglyceride glucose body mass index, triglycerides/high density lipoprotein cholesterol, quantitative insulin sensitivity check index, fasting glucose-to-insulin ratio
Introduction
Polycystic ovary syndrome (PCOS) is the most common endocrine and metabolic disease in women of childbearing age, as well as a common cause of infertility.1 Hyperandrogenemia (HA) and insulin resistance (IR) are the primary etiologies and endocrine characteristics of the disorder.2 IR may be observed in 50–70% of women with PCOS and normal body mass index (BMI), while the proportion may be higher in those that are obese.3 In addition, PCOS is associated with a variety of comorbidities, including metabolic syndrome, type 2 diabetes, dyslipidemia, and hepatic steatosis.4 In the condition, the ovaries are stimulated by IR and high insulin levels to produce more androgens.5 Therefore, early detection of IR in these patients is crucial.
Despite being the gold standard for assessing IR, the hyperinsulinemic-euglycemic clamp (HIEC) is currently only suitable for scientific research and is difficult to use broadly in clinical practice due to its high cost and time-consuming nature.6 The homeostatic model assessment for IR (HOMA-IR) is correlated to the HIEC and may be used for large-scale, epidemiological research.7 However, as insulin levels are rarely measured in health examinations and clinical practice, obtaining HOMA-IR may also be difficult.
The clearance of triglycerides (TG)-rich lipoproteins from the plasma is delayed in insulin-resistant states, resulting in hypertriglyceridemia. The traditional lipid ratios of total cholesterol (TC)/high-density lipoprotein cholesterol (HDL-C), TG/HDL-C, low-density lipoprotein cholesterol (LDL-C)/HDL-C, and TG and IR (determined using the HOMA-IR) have been reported to be significantly correlated in patients with PCOS.8
The triglyceride glucose (TyG) index, derived from fasting TG and blood glucose (FBG) levels, may be a simple and low-cost alternative in identifying IR in healthy patients.9 When compared to traditional lipid ratios, the TyG index had the strongest association with HOMA-IR.10 According to a systematic review, with HIEC and HOMA-IR as reference tests, the TyG index had the highest sensitivity and specificity, at 96% and 99%, respectively,6 and has been confirmed in other studies to be associated with the risk of diabetes, atherosclerotic cardiovascular disease, and ischemic stroke.11–14 In addition, the triglyceride glucose body mass index (TyG-BMI), which includes BMI, may also be a simple and practical alternative for determining IR in non-diabetic subjects.15 However, only a few studies currently exist that examine the relationship between the TyG index and PCOS. Notably, the relationship between TG and IR may vary based on ethnicity. It is essential to evaluate the value of TyG index in predicting IR in a Chinese population.16
Hence, we aimed to assess the performance of the TyG index, the TyG-BMI, and traditional lipid ratios in identifying IR and compare them with the HOMA-IR. We aimed to determine whether the TyG index was a clinical surrogate marker for IR among Chinese women diagnosed with PCOS.
Materials and Methods
Participants
This study included patients with PCOS who visited the Department of Endocrinology and Metabolism or Nutrition at the First Affiliated Hospital of Shantou University Medical College from July 2018 to December 2021. All patients with PCOS had been newly diagnosed and had not received PCOS-related treatment. Patients were diagnosed according to the 2003 Rotterdam criteria, and at least two of the following three items were required: (1) oligo-ovulation and/or anovulation, (2) clinical and/or biochemical signs of hyperandrogenism, and (3) polycystic ovaries. PCOS was diagnosed after excluding other causes of hyperandrogenemia or ovulation dysfunction, such as Cushing’s syndrome, 21-hydroxylase deficiency, thyroid disease, androgen-secreting tumors, congenital adrenal hyperplasia, and hyperprolactinemia.17
In addition, we enrolled 61 healthy, premenopausal women from the general community who met the following criteria: (1) regular menstrual cycles; (2) no clinical signs of hyperandrogenemia, such as hirsutism, acne, alopecia, or seborrhea; and (3) normal ovarian morphology by transvaginal ultrasound examination. Women who had breastfed or been pregnant in the past year were excluded from this study. This study was approved by the Ethics Committee of the First Affiliated Hospital of the Shantou University Medical College (ChiCTR2000041108) and certify that the study was performed in accordance with the ethical standards as laid down in the Declaration of Helsinki. Written informed consent was obtained from all participants. The data from the current study were also used in our previous study.18
Laboratory Studies and the Assessment of Insulin Resistance
An endocrinologist inquired about each participant’s medical history and measured their height and weight, from which BMI [weight (kg) / height2 (m2)] was calculated. Blood samples were collected after overnight fasts to determine TC, TG, HDL-C, LDL-C, luteinizing hormone (LH), follicle- stimulating hormone (FSH), glucose at fasting status (G0), and insulin at fasting status (I0) levels. After procurement of the first blood sample, all participants were required to complete the oral glucose tolerance test (OGTT) and insulin release test with 75 g anhydrous glucose. At 60 and 120 min, two additional blood samples were collected to measure plasma glucose (G60 and G120, respectively) and insulin concentrations (I60 and I120, respectively). Glucose and insulin area under the curve (AUCGlucose: Glucose area under the curve; AUCInsulin: Insulin area under the curve) during the OGTT were calculated using the trapezoidal rule.
The levels of plasma glucose and serum TC, TG, HDL-C and LDL-C were measured based on autoanalyzer assay (Beckman Coulter AU5800, MN, USA). Serum insulin was estimated using a direct chemiluminescence (Siemens, New York, USA). The levels of serum LH, FSH were measured based on chemiluminescence (Beckman).
Calculated parameters related to IR and pancreatic β-cell function included the following: TyG index: ln[fasting triglycerides (mg/dL) × fasting glucose (mg/dL) / 2]; TyG-BMI: TyG index × BMI; TC/HDL-C: TC (mg/dL) / HDL-C (mg/dL); TG/HDL-C: TG (mg/dL) / HDL-C (mg/dL); HOMA-IR: [Fasting glucose (mmol/L)] × [Fasting insulin (mIU/L)] / 22.5; homeostasis model assessment for β-cell function (HOMA-β): [20 × fasting insulin (mIU/L)] / [fasting glucose (mmol/L)-3.5]; quantitative insulin sensitivity check index (QUICKI): 1 / [logarithmic fasting insulin (μU/mL) + logarithmic glucose (mg/dL)]; fasting glucose-to-insulin ratio (FG-IR): fasting glucose (mg/dL) / fasting insulin (μU/mL). IR was defined as a HOMA-IR value ≥2.5.19 A value of P<0.05 was considered statistically significant.
Statistical Analysis
Statistical analyses were performed using the IBM SPSS Statistics 25.0 and MedCalc 20.010. The normality of the distribution of the variables was determined using the Kolmogorov–Smirnov test. Normal continuous variables were expressed as mean ± standard deviation, while those with skewed distributions were logarithmically transformed to conform to normal distributions or expressed as median (four-quantile intervals). To compare differences between two groups, we used the two independent sample Student’s t-test or the Mann–Whitney U-test and used analysis of variance, Wilcoxon, or Kruskal–Wallis tests to compare differences between multiple groups. Pearson or Spearman correlation coefficients were calculated for correlation analysis. Receiver operating characteristic (ROC) curve analysis was used to assess the ability of different indicators to predict IR based on HOMA-IR.
Results
No significant differences in age (P=0.1) or BMI (P=0.08) were noted between the PCOS and non-PCOS groups, indicating that the two groups were comparable. The PCOS group had higher levels of TC, TG, LDL, TC/HDL, LDL/HDL, G0, G60, G120, AUCGlucose, I0, I60, I120, logAUCInsulin, AUCInsulin/AUCGlucose, LH, FSH, HOMA-IR, HOMA-β, TyG index, and TyG-BMI values compared with the non-PCOS control group (all P<0.05), but lower QUICKI (P<0.001) and FG-IR (P=0.001) values (Table 1).
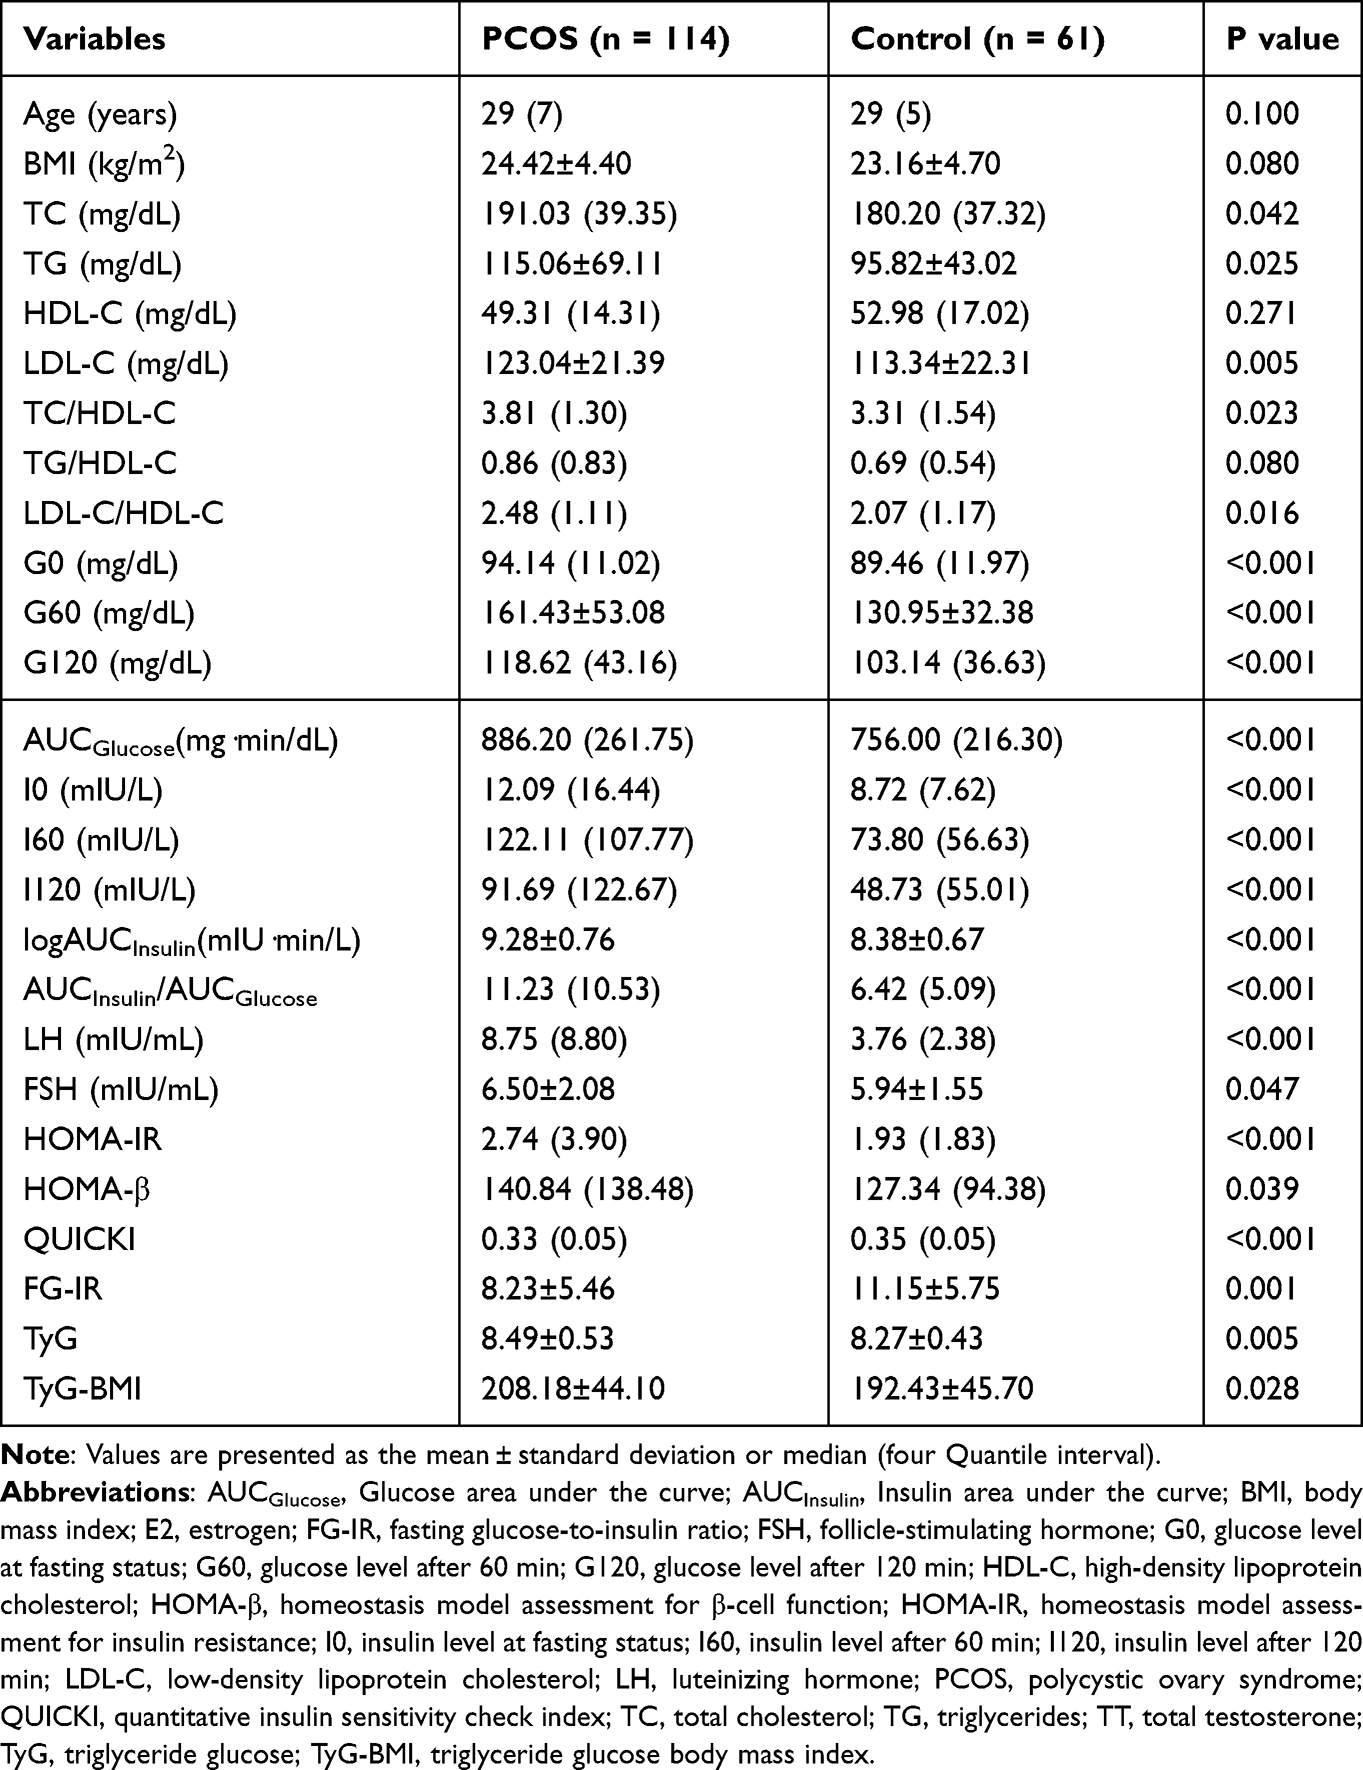 |
Table 1 Comparison of Basic Clinical Data Between PCOS Group and Non-PCOS Control Group |
Patients with PCOS were divided into three groups based on the TyG index tertile distributions, including first (T1, ≤8.21), second (T2, 8.22–8.70), and third (≥8.71) tertiles. The results showed that from T1 to T3, the median HOMA-IR (2.08(1.45) vs 2.63(7.05) vs 5.74(3.94), P<0.001) and HOMA-β (114.30(81.87) vs 140.82(309.96) vs 200.96(172.90), P=0.001) values increased, while QUICKI (0.34(0.03) vs 0.33(0.06) vs 0.30(0.03), P<0.001) and the mean FG-IR (11.23±5.93 vs 7.36±4.71 vs 5.85±4.39, P<0.001) values decreased (Table 2).
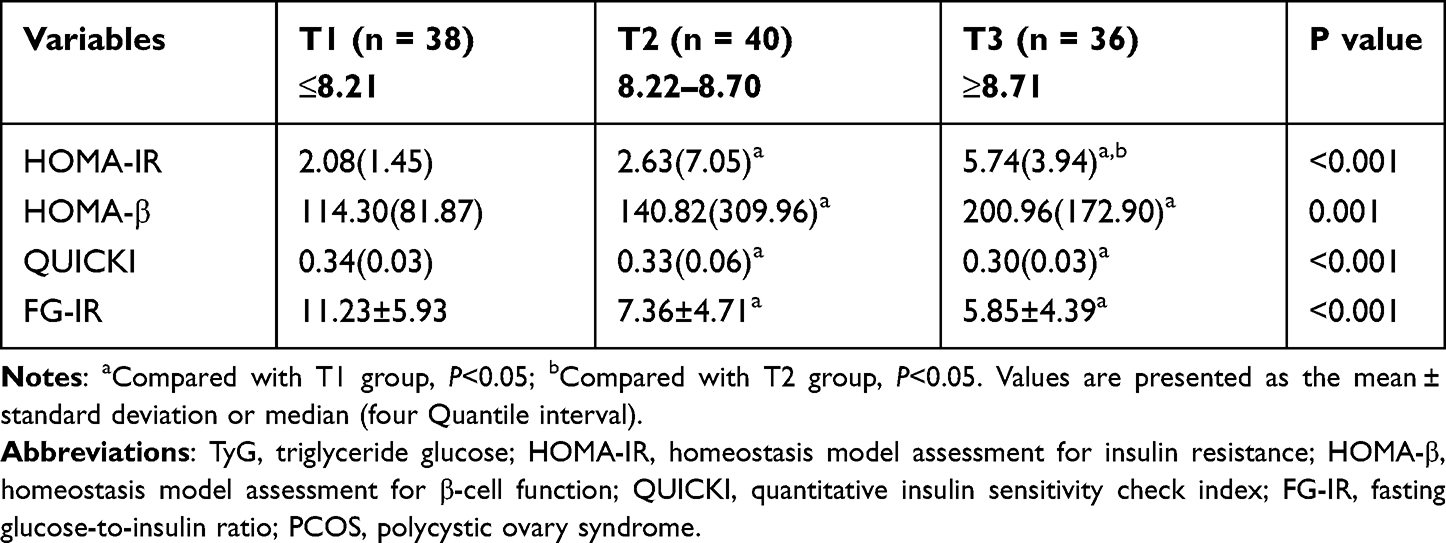 |
Table 2 Comparison of Insulin Resistance Indexes of Patients with PCOS Grouped by TyG Index Tertiles |
TyG-BMI was also divided into tertiles, with cut-off values of 183.27 and 225.81, where the first tertile (T1) was defined as the lowest, the second tertile (T2) as the intermediary, and the third tertile (T3) as the highest TyG-BMI. With increasing TyG-BMI tertiles, median HOMA-IR (1.76(1.06) vs 3.15(4.01) vs 5.45(6.08), P<0.001) and HOMA-β (94.00(75.12) vs 160.13(179.11) vs 203.68(217.33), P<0.001) values increased, while QUICKI (0.35(0.03) vs 0.32(0.04) vs 0.29(0.04), P<0.001) and mean FG-IR (12.49±5.92 vs 6.51±3.48 vs 5.52±3.99, P<0.001) values decreased (Table 3).
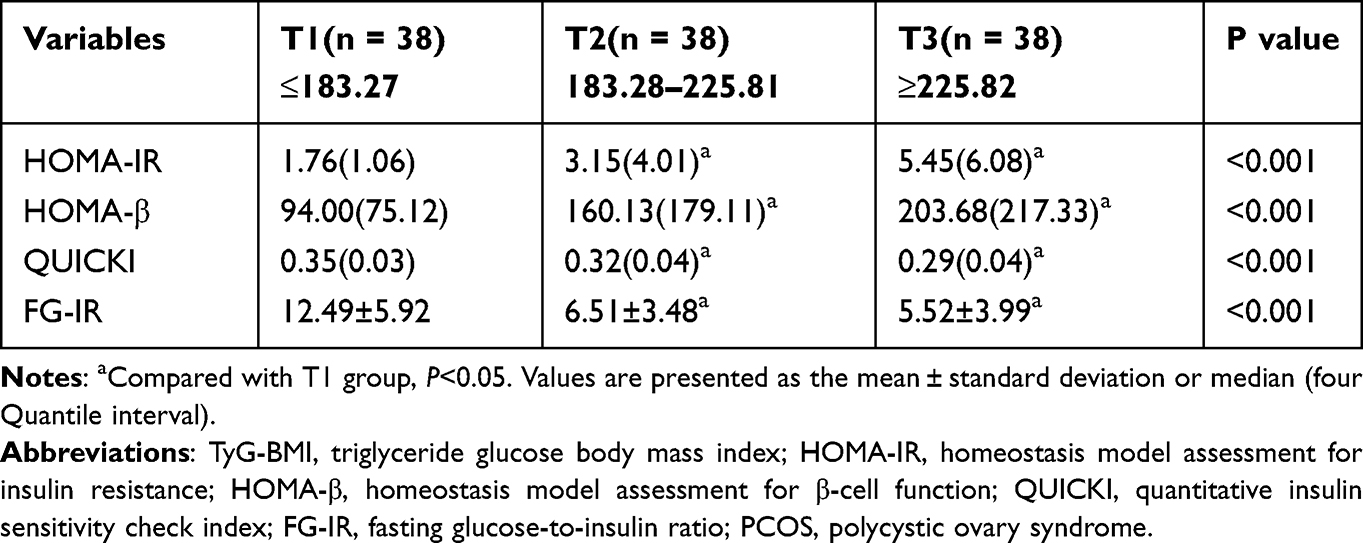 |
Table 3 Comparison of Insulin Resistance Indexes of Patients with PCOS Grouped by TyG-BMI Tertiles |
The results of the correlation analysis showed that the TyG index of the PCOS group correlated with the HOMA-IR (r=0.515, P<0.01), HOMA-β (r=0.348, P<0.01), QUICKI (r=−0.532, P<0.01), and FG-IR (r=−0.394, P<0.01). Additionally, the TyG-BMI correlated with the HOMA-IR (r=0.560, P<0.01), HOMA-β (r=0.461, P<0.01), QUICKI (r=−0.574, P<0.01), and FG-IR (r=−0.526, P<0.01; Figures 1 and 2).
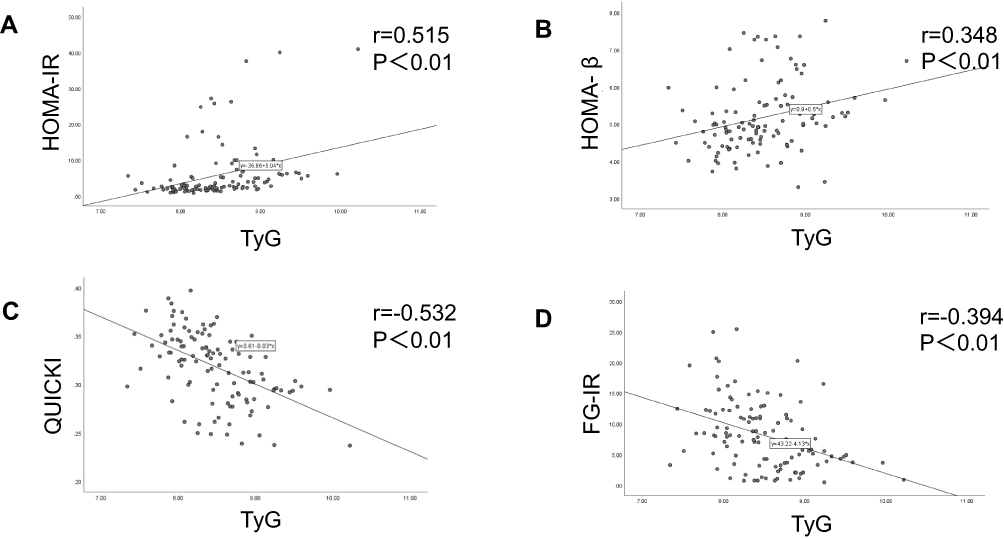 |
Figure 1 The correlation between TyG index and HOMA-IR (A), HOMA-β (B), QUICKI (C) and FG-IR (D) in patients with PCOS. Abbreviations: TyG, triglyceride glucose; HOMA-IR, homeostasis model assessment for insulin resistance; HOMA-β, homeostasis model assessment for β-cell function; QUICKI, quantitative insulin sensitivity check index; FG-IR, fasting glucose-to-insulin ratio. |
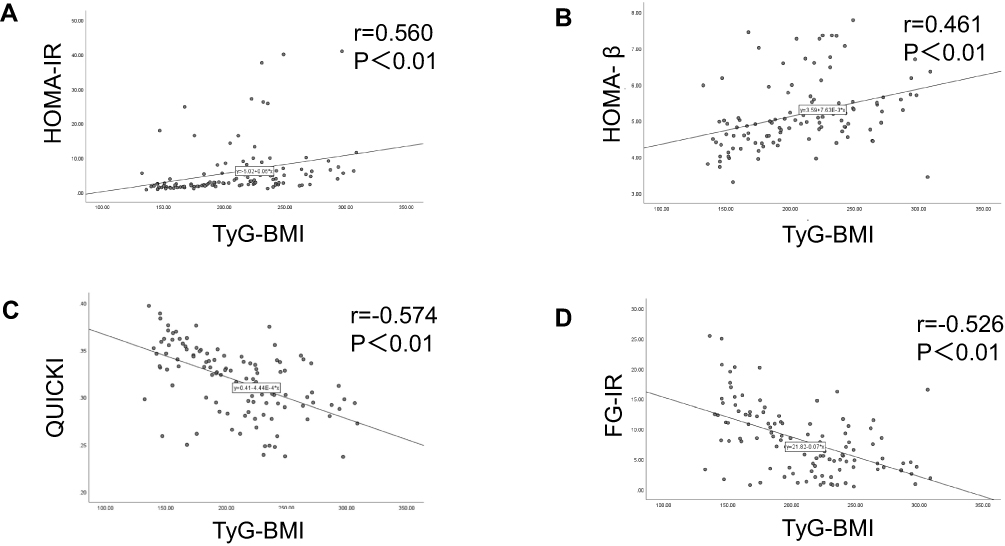 |
Figure 2 The correlation between TyG-BMI and HOMA-IR (A), HOMA-β (B), QUICKI (C) and FG-IR (D) in patients with PCOS. Abbreviations: TyG-BMI, triglyceride glucose body mass index; HOMA-IR, homeostasis model assessment for insulin resistance; HOMA-β, homeostasis model assessment for β-cell function; QUICKI, quantitative insulin sensitivity check index; FG-IR, fasting glucose-to-insulin ratio. |
HOMA-IR ≥2.5 was used as the cut-off point that defined IR, and an ROC curve was drawn. TyG-BMI predicted the highest area under the ROC curve (AUC) value of IR in patients with PCOS based on HOMA-IR, at 0.796 (95% CI: 0.710–0.866, P<0.001). When the cutoff point was 191.53, the sensitivity was 85.3% and the specificity was 73.9%. This index was followed by the TyG index, whose AUC was 0.781 (95% CI: 0.693–0.853, P<0.001). When the cut-off point was 8.51, the sensitivity and specificity were 63.2% and 87.0%, respectively (Figure 3, Table 4).
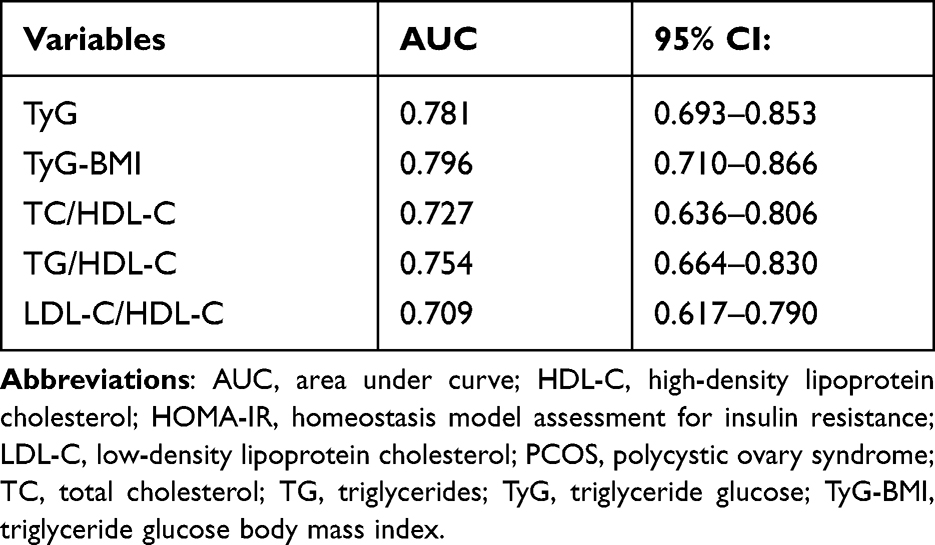 |
Table 4 TyG Index and Other Indicators Predict the AUC Value of Insulin Resistance in Patients with PCOS Based on HOMA-IR |
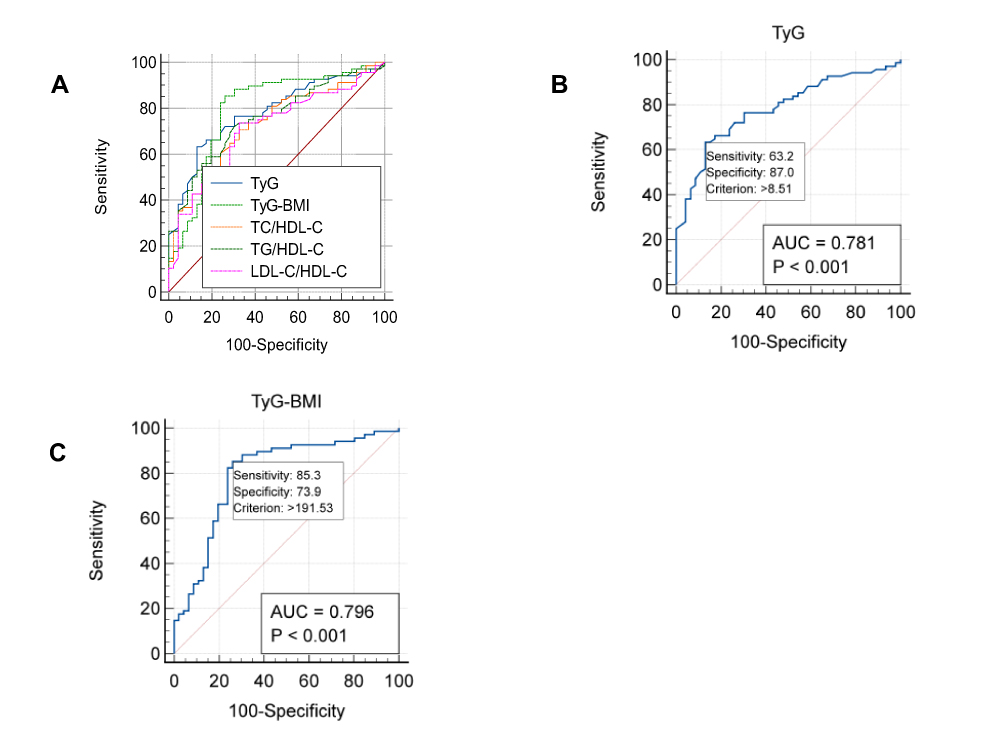 |
Figure 3 The ROC curve of TyG index (B), TyG-BMI (C) and other indicators predicting insulin resistance in patients with PCOS based on HOMA-IR ≥2.5 (A). Abbreviations: TyG, triglyceride glucose; TyG-BMI, triglyceride glucose body mass index; HOMA-IR, homeostasis model assessment for insulin resistance; TC, total cholesterol; HDL-C, high-density lipoprotein cholesterol; TG, triglycerides; LDL-C, low-density lipoprotein cholesterol. |
Discussion
The pathophysiology of PCOS currently remains unclear. Women with PCOS may have higher IR, as the patients with PCOS in our study had higher levels of G0, G60, G120, I0, I60, I120, AUCInsulin/AUCGlucose, and HOMA-IR when compared with the non-PCOS control group, while the QUICKI and FG-IR values were lower. Previous studies have indicated that IR is involved in the pathophysiological process of PCOS,20 and significant IR was found in non-obese patients with PCOS.21 HA is a risk factor for PCOS, and the cycle of IR-hyperinsulinemia (HI)-HA eventually leads to the development of PCOS.22 In addition, excessive androgen production may concurrently accelerate the accumulation of ectopic fat, which may act as a regulator of androgen, creating a vicious circle.23 Therefore, early identification of IR in patients with PCOS is essential.
The HOMA-IR may be used in clinical practice to evaluate IR. However, due to the complexity of measuring insulin levels, HOMA-IR is still not widely used. In one study, the HIEC definition of IR indicated that the TyG index was slightly better than the HOMA-IR in identifying patients with IR in a sample of Brazilian patients.24 Additionally, TG/HDL-C was shown to be significantly associated with IR in patients with PCOS and could be used as a marker of IR in a sample of Iranian patients with PCOS.8 Our findings indicated that elevated levels of the TyG index was associated with IR (as measured by HOMA-IR, QUICKI, and FG-IR) among the Chinese women with PCOS. With the HOMA-IR as a reference, the TyG index had superior AUC values compared with lipid ratios, such as TG/HDL-C, which was consistent with the results of a previous study.25 Moreover, this study found that TyG-BMI that combined the TyG index and BMI performed better in the evaluation of IR. We determined that the TyG index and TyG-BMI may be simple and useful indicators for IR assessment in Chinese women with PCOS.
This study had some limitations. Due to the limitation of the raw data, the correlation between HIEC and the TyG index was not tested. Additionally, all patients in the study were from the Department of Endocrinology and Metabolism or Nutrition at the First Affiliated Hospital of Shantou University Medical College, which limits generalizability to the broader population of all patients with PCOS in China. Due to the relative lack of studies regarding the TyG index and IR in patients with PCOS, further research may be needed.
Conclusion
Our study showed that the TyG index and TyG-BMI were associated with IR (measured by the HOMA-IR, QUICKI, and FG-IR). The ROC curve showed that the TyG index and the TyG-BMI performed better than traditional lipid ratios, such as TG/HDL-C, in predicting IR, indicating that these simple and economic indicators may be useful in determining IR in women with PCOS.
Abbreviations
AUC, area under curve; AUCGlucose: Glucose area under the curve; AUCInsulin: Insulin area under the curve; BMI, body mass index; E2, estrogen; FBG, fasting blood glucose; FG-IR, fasting glucose-to-insulin ratio; FSH, follicle-stimulating hormone; G0, glucose level at fasting status; G60, glucose level after 60 min; G120, glucose level after 120 min; HA, hyperandrogenemia; HI, hyperinsulinemia; HDL-C, high-density lipoprotein cholesterol; HIEC, Hyperinsulinemic–Euglycemic Clamp; HOMA, homeostasis model; HOMA-β, homeostasis model assessment for β-cell function; HOMA-IR, homeostasis model assessment for insulin resistance; I0, insulin level at fasting status; I60, insulin level after 60 min; I120, insulin level after 120 min; LDL-C, low-density lipoprotein cholesterol; LH, luteinizing hormone; IR, insulin resistance; OGTT, oral glucose tolerance test; PCOS, polycystic ovary syndrome; QUICKI, quantitative insulin sensitivity check index; ROC, receiver operating characteristic; TC, total cholesterol; TG, triglycerides; TT, total testosterone; TyG, triglyceride glucose; TyG-BMI, triglyceride glucose body mass index.
Acknowledgments
This study was supported by grants from the Guangdong Basic and Applied Basic Research Foundation (No. 2021A1515010137), the Medical Scientific Research Foundation of Guangdong Province (No. A2020390), the Special Funds for science and technology of Guangdong Province (No. 2021-88), and the Special Funds for Innovation Strategy of Science and Education in Guangdong Province (2018-157).
Disclosure
The authors report no conflicts of interest in this work.
References
1. Macut D, Bjekić-Macut J, Rahelić D, Doknić M. Insulin and the polycystic ovary syndrome. Diabetes Res Clin Pr. 2017;130:163–170. doi:10.1016/j.diabres.2017.06.011
2. Wang J, Wu D, Guo H, Li M. Hyperandrogenemia and insulin resistance: the chief culprit of polycystic ovary syndrome. Life Sci. 2019;236:116940. doi:10.1016/j.lfs.2019.116940
3. Al-Jefout M, Alnawaiseh N, Al-Qtaitat A. Insulin resistance and obesity among infertile women with different polycystic ovary syndrome phenotypes. Sci Rep. 2017;7(1):5339. doi:10.1038/s41598-017-05717-y
4. Apridonidze T, Essah PA, Iuorno MJ, Nestler JE. Prevalence and characteristics of the metabolic syndrome in women with polycystic ovary syndrome. J Clin Endocrinol Metab. 2005;90(4):1929–1935. doi:10.1210/jc.2004-1045
5. Baptiste CG, Battista MC, Trottier A, Baillargeon JP. Insulin and hyperandrogenism in women with polycystic ovary syndrome. J Steroid Biochem Mol Biol. 2010;122(1–3):42–52. doi:10.1016/j.jsbmb.2009.12.010
6. Sánchez-García A, Rodríguez-Gutiérrez R, Mancillas-Adame L, et al. Diagnostic accuracy of the triglyceride and glucose index for insulin resistance: a systematic review. Int J Endocrinol. 2020;2020:4678526. doi:10.1155/2020/4678526
7. Bonora E, Targher G, Alberiche M, et al. Homeostasis model assessment closely mirrors the glucose clamp technique in the assessment of insulin sensitivity: studies in subjects with various degrees of glucose tolerance and insulin sensitivity. Diabetes Care. 2000;23(1):57–63. doi:10.2337/diacare.23.1.57
8. Ghaffarzad A, Amani R, Mehrzad Sadaghiani M, Darabi M, Cheraghian B. Correlation of serum lipoprotein ratios with insulin resistance in infertile women with polycystic ovarian syndrome: a case control study. Int J Fertil Steril. 2016;10(1):29–35. doi:10.22074/ijfs.2016.4765
9. Simental-Mendía LE, Rodríguez-Morán M, Guerrero-Romero F. The product of fasting glucose and triglycerides as surrogate for identifying insulin resistance in apparently healthy subjects. Metab Syndr Relat Disord. 2008;6(4):299–304. doi:10.1089/met.2008.0034
10. Du T, Yuan G, Zhang M, Zhou X, Sun X, Yu X. Clinical usefulness of lipid ratios, visceral adiposity indicators, and the triglycerides and glucose index as risk markers of insulin resistance. Cardiovasc Diabetol. 2014;13:146. doi:10.1186/s12933-014-0146-3
11. Chamroonkiadtikun P, Ananchaisarp T, Wanichanon W. The triglyceride-glucose index, a predictor of type 2 diabetes development: a retrospective cohort study. Prim Care Diabetes. 2020;14:161–167. doi:10.1016/j.pcd.2019.08.004
12. Hong S, Han K, Park CY. The triglyceride glucose index is a simple and low-cost marker associated with atherosclerotic cardiovascular disease: a population-based study. BMC Med. 2020;18(1):361. doi:10.1186/s12916-020-01824-2
13. Ding X, Wang X, Wu J, Zhang M, Cui M. Triglyceride-glucose index and the incidence of atherosclerotic cardiovascular diseases: a meta-analysis of cohort studies. Cardiovasc Diabetol. 2021;20(1):76. doi:10.1186/s12933-021-01268-9
14. Wang A, Wang G, Liu Q, et al. Triglyceride-glucose index and the risk of stroke and its subtypes in the general population: an 11-year follow-up. Cardiovasc Diabetol. 2021;20(1):46. doi:10.1186/s12933-021-01238-1
15. Er LK, Wu S, Chou HH, et al. Triglyceride glucose-body mass index is a simple and clinically useful surrogate marker for insulin resistance in nondiabetic individuals. PLoS One. 2016;11(3):e0149731. doi:10.1371/journal.pone.0149731
16. Kim-Dorner SJ, Deuster PA, Zeno SA, Remaley AT, Poth M. Should triglycerides and the triglycerides to high-density lipoprotein cholesterol ratio be used as surrogates for insulin resistance? Metabolism. 2010;59(2):299–304. doi:10.1016/j.metabol.2009.07.027
17. Björndahl L, Giwercman A, Tournaye H. Revised 2003 consensus on diagnostic criteria and long-term health risks related to polycystic ovary syndrome (PCOS). Hum Reprod. 2004;19:41–47.
18. Chen F, Liao Y, Chen M, et al. Evaluation of the efficacy of sex hormone-binding globulin in insulin resistance assessment based on HOMA-IR in patients with PCOS. Reprod Sci. 2021;28(9):2504–2513. doi:10.1007/s43032-021-00535-0
19. Gutch M, Kumar S, Razi SM, et al. Assessment of insulin sensitivity / resistance. Indian J Endocrinol Metab. 2015;19(1):160–164. doi:10.4103/2230-8210.146874
20. Burghen GA, Givens JR, Kitabchi AE. Correlation of Hyperandrogenism with Hyperinsulinism in Polycystic Ovarian Disease. J Clin Endocrinol Metab. 1980;50(1):113–116. doi:10.1210/jcem-50-1-113
21. Jialal I, Naiker P, Reddi K, Moodley J, Joubert SM. Evidence for insulin resistance in nonobese patients with polycystic ovarian disease. J Clin Endocrinol Metab. 1987;64(5):1066–1069. doi:10.1210/jcem-64-5-1066
22. Hernández-Jiménez JL, Barrera D, Espinoza-Simón E, et al. Polycystic ovarian syndrome: signs and feedback effects of hyperandrogenism and insulin resistance. Gynecol Endocrinol. 2022;38(1):2–9. doi:10.1080/09513590.2021.2003326
23. Sanchez-Garrido MA, Tena-Sempere M. Metabolic dysfunction in polycystic ovary syndrome: pathogenic role of androgen excess and potential therapeutic strategies. Mol Metab. 2020;35:100937. doi:10.1016/j.molmet.2020.01.001
24. Vasques ACJ, Novaes FS, de Oliveira MS, et al. TyG index performs better than HOMA in a Brazilian population: a hyperglycemic clamp validated study. Diabetes Res Clin Pract. 2011;93(3):e98–e100. doi:10.1016/j.diabres.2011.05.030
25. Kheirollahi A, Teimouri M, Karimi M, et al. Evaluation of lipid ratios and triglyceride-glucose index as risk markers of insulin resistance in Iranian polycystic ovary syndrome women. Lipids Health Dis. 2020;19(1):235. doi:10.1186/s12944-020-01410-8
 © 2022 The Author(s). This work is published and licensed by Dove Medical Press Limited. The full terms of this license are available at https://www.dovepress.com/terms.php and incorporate the Creative Commons Attribution - Non Commercial (unported, v3.0) License.
By accessing the work you hereby accept the Terms. Non-commercial uses of the work are permitted without any further permission from Dove Medical Press Limited, provided the work is properly attributed. For permission for commercial use of this work, please see paragraphs 4.2 and 5 of our Terms.
© 2022 The Author(s). This work is published and licensed by Dove Medical Press Limited. The full terms of this license are available at https://www.dovepress.com/terms.php and incorporate the Creative Commons Attribution - Non Commercial (unported, v3.0) License.
By accessing the work you hereby accept the Terms. Non-commercial uses of the work are permitted without any further permission from Dove Medical Press Limited, provided the work is properly attributed. For permission for commercial use of this work, please see paragraphs 4.2 and 5 of our Terms.