")
Back to Journals » Diabetes, Metabolic Syndrome and Obesity » Volume 8
Evaluation of the relationship between the pelvic floor muscles and insulin resistance
Authors Micussi MT, Freitas R , Angelo P, Soares E, Lemos T, Maranhão T
Received 1 April 2015
Accepted for publication 28 May 2015
Published 28 August 2015 Volume 2015:8 Pages 409—413
DOI https://doi.org/10.2147/DMSO.S85816
Checked for plagiarism Yes
Review by Single anonymous peer review
Peer reviewer comments 2
Editor who approved publication: Professor Ming-Hui Zou
Maria Thereza Micussi,1 Rodrigo Pegado Freitas,1 Priscylla Helouyse Angelo,2 Elvira Maria Soares,3 Telma Maria Lemos,4 Técia Maria Maranhão5
1Physical Therapy Department, 2Postgraduate Program in Physical Therapy, 3Januário Cicco Maternity School, 4Clinical Analysis Department, 5Tocogynecology Department, Federal University of Rio Grande do Norte (UFRN), Natal, Rio Grande do Norte, Brazil
Purpose: The aim of this study was to evaluate the pelvic floor muscles (PFMs) in women with insulin resistance (IR) using surface electromyography and to associate the results with insulin levels.
Patients and methods: Through an analytical, cross-sectional study, 86 women were evaluated and divided into two groups: a control group (n=35) and an IR group (n=51). Data were collected through detailed history-taking, physical examination, and biochemical analysis. Fasting insulin levels were used for diagnosing IR. Electromyography of the PFMs was used for analyzing the tone and maximal voluntary contraction (MVC). The measures of central tendency and linear regression models were used.
Results: The average age was 25.3±4.5 years in the IR group and 27.2±4.4 years in the control group. The mean weight was 75.6±17.6 kg and 51.8±4.9 kg in the IR and control groups, respectively. Fasting insulin levels were 19.7±6.6 µIU/mL in the IR group and 5.4±1.8 µIU/mL in the control group (P<0.010). There were significant differences between the groups with regard to PFM tone (IR: 13.4±3.4 µV; control: 25.1±3.3 µV; P<0.001) and MVC (IR: 47.6±4.5 µV; control: 64.3±5.0 µV; P<0.001). Multiple linear regression analysis using the insulin levels as dependent variable showed a significant association for MVC (P=0.047), weight (P=0.017), and waist circumference (P=0.000).
Conclusion: Compared with the control group, the IR group showed lower electromyographic activity of the PFMs, and there was an association between insulin levels and electromyographic activity.
Keywords: tone, maximal voluntary contraction, woman, electromyography, menstrual cycle
Introduction
The pelvic floor muscles (PFMs) are composed of a set of skeletal muscles. The levator ani muscle forms the main structure and is composed of three muscles: pubococcygeus, iliococcygeus, and puborectalis. These muscles are responsible for providing support to the static and dynamic internal pelvic organs and for the closure of the urethral sphincter, allowing urinary and fecal continence.1
Particularly, in the region of the female urethra beyond the striated and smooth muscle, there are connective tissue cells disposed between the urethral sphincter muscle tissue. It is observed that, in the case of muscular weakness that culminates in urinary incontinence, there is a change in the composition, distribution, and organization of the extracellular matrix components of these different regions of the urethral tissue.2,3 Changes in the extracellular matrix can also be observed in diabetic individuals and are associated with myopathic and neuropathic causes of dysfunctions of the lower urinary tract.4
Precondition metabolic abnormality that is characteristic of individuals with type 2 diabetes, uncontrolled type 1 diabetes, diabetic ketoacidosis, and obesity is defined in the literature as insulin resistance (IR).5–7
The mechanisms involved in IR are complex and include genetic and environmental factors. The insulin metabolism abnormalities include decreased insulin secretion, hepatic insulin excretion, and insulin receptor signaling.8 IR can be defined as a metabolic state in which the mechanism of glucose homeostasis is impaired.8 IR, an attenuated ability of insulin to generate its physiological responses, is associated with various age-related problems, including atherothrombotic vascular diseases, certain types of cancers, frailty, cognitive decline, and muscle weakness. It is estimated that IR occurs in approximately 20%–25% of healthy individuals.5,7
The relationship of PFM function and IR has not been investigated, although increasing evidence supports an association between muscle weakness and diabetes.9 Furthermore, we found no clinical studies on the PFMs in the presence of IR. Therefore, the aim of this study was to evaluate electromyographic activity in women with IR and to associate the results with insulin levels.
Materials and methods
This analytical, cross-sectional study evaluated 86 women divided into two groups, a control group (n=35) and an IR group (n=51), who were recruited at the outpatient department of Onofre Lopes University Hospital at the Federal University of Rio Grande do Norte (Natal, Brazil).
The participants included nulligravid women aged 20–30 years with ovulatory menstrual cycles (26–32 days long), confirmed through blood concentration of progesterone equal to or above 5 ng/mL on the 21st day of the cycle. The following exclusion criteria were applied: diabetes mellitus, any disease that causes chronic anovulation or hyperandrogenism, suspicion of or confirmed pregnancy, previous gynecological surgery, perineal rupture, body mass index (BMI) above 40 kg/m2, and use of any medication that may interfere with the hypothalamic–pituitary–ovarian axis in the previous 90 days. No participant complained of urinary or anal incontinence and no one had undergone physiotherapy previously or performed personal Kegel exercises. Patients were invited to participate in the study during their appointment at the outpatient service.
All patients underwent detailed history-taking, physical examination, and biochemical analysis, including hormonal dosage. The medical history contained data on menarche, classification of the menstrual cycle as regular or irregular, and personal and family histories of diabetes mellitus, cardiovascular disease, dyslipidemia, and obesity.
During physical examination, a gynecological assessment was performed to evaluate pelvic statics, perineal tears, and local inflammation. Height, weight, and waist and hip circumference were measured to determine BMI and the waist–hip ratio. BMI was calculated as weight (kg)/height2 (m2), and the patients were classified according to the criteria established by the World Health Organization (WHO) as follows: underweight (BMI <18.5 kg/m2), normal weight (BMI between 18.5 and 24.9 kg/m2), overweight (BMI between 25.0 and 29.9 kg/m2), and obese (BMI ≥30 kg/m2).10 Furthermore, patients diagnosed with IR were investigated for acanthosis nigricans in the folds of the neck, armpit, elbow, and thigh root.
For biochemical analysis and hormonal dosage, blood samples were collected after 12 hours of fasting. Plasma glucose levels were measured by a colorimetric enzymatic assay of glucose oxidase using Vitrus® equipment, model 950. Insulin, progesterone, and thyroid-stimulating hormones were measured by chemiluminescence using Immulite® 2000 equipment and commercial kits (Diagnostic Products Corporation, Los Angeles, CA, USA). Fasting insulin levels above 12 μIU/mL indicated IR.8
For the collection of electromyography (EMG) data, the patients adopted the lithotomy position; an intracavitary electrode (Chattanooga Group®, Chattanooga, USA) was inserted into the middle third of the vaginal canal, and metal plates were placed in contact with the lateral walls of the vagina. The reference electrode was placed on the anterior superior iliac spine. The data were processed using EMG software (EMG System do Brazil Ltd® São José dos Campos, Brazil.) with a band-pass filter of 20–500 Hz. Before examination, all patients received guidance on the correct way of contracting the PFMs and emptying the bladder.
After insertion of the vaginal probe, the patients were instructed to relax the pelvic floor in order to allow recording of the base tone for a minute. The second analysis referred to the maximal voluntary contraction (MVC) that involved performing three MVCs with a 30-second rest between each contraction. Only the value of the largest contraction was considered.11 Using these data, the root mean square was calculated, and the data were expressed in microvolts. Blood collection for hormonal dosage and electromyographic evaluation was performed independently of the cycle phase in oligomenorrhea or amenorrhea.
Hormone levels were measured, and EMG was performed on the seventh day (follicular phase). Progesterone was measured only on the 21st day of the menstrual cycle to confirm ovulation.
The data were tabulated using the SPSS 19.0 software for Windows. The normality of distribution was assessed using the Shapiro–Wilk test. Central tendency measures were used to describe gynecological and obstetric data and laboratory tests. Student’s t-test was used to compare EMG results between the groups. Pearson’s correlation and linear regression adjusted for weight, BMI, waist circumference and tone was used to associate electromyographic activity and anthropometric variables with insulin levels in the IR group. A significance level of P<0.05 was used.
This study was approved by the Research Ethics Committee of the Federal University of Rio Grande do Norte under protocol number 150/07; all participants were informed about the study objectives and they provided informed consent for participation.
Results
The clinical and hormonal profiles of the patients are shown in Table 1. The average age was 25.3±4.5 years in the IR group and 27.2±4.4 years in the control group. The mean weight was 75.6±17.6 kg and 51.8±4.9 kg in the IR and control groups, respectively. Fasting insulin levels were 19.7±6.6 μIU/mL in the IR group and 5.4±1.8 μIU/mL in the control group (P<0.010).
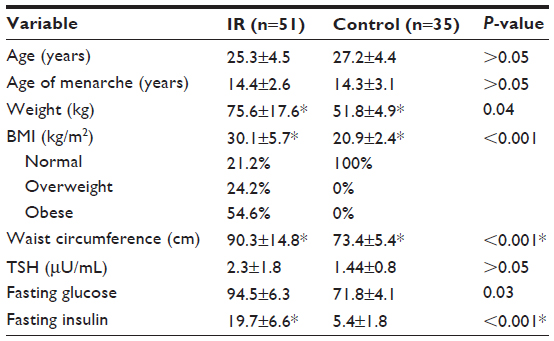 | Table 1 Clinical and hormonal characteristics of the patients |
The average PFM tone was 13.4±3.4 μV in the IR group and 25.1±3.3 μV in the control group (P<0.001). There was a significant difference (P<0.001) in MVC between the IR group (47.6±4.5 μV) and control group (64.3±5.0 μV) (Table 2).
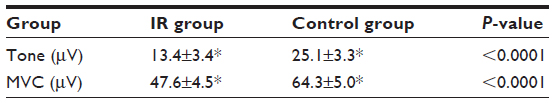 | Table 2 Data regarding electromyographic activity in women with and without IR |
Adjusted multiple linear regression analysis was performed in the IR group. This identified an association between insulin levels and MVC (P=0.047), weight (P=0.017), and waist circumference (P=0.000) (Table 3).
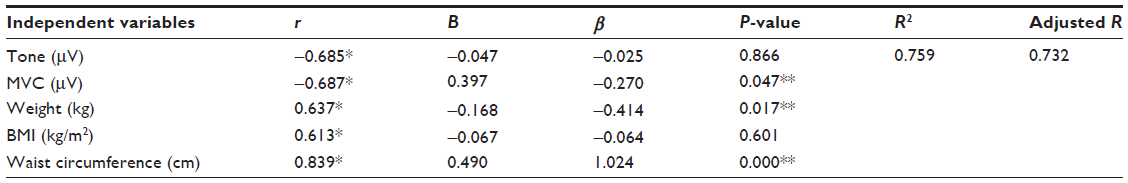 | Table 3 Results of association analysis using the insulin levels as dependent variable |
Discussion
This study is the first to research the electromyographic activity of the PFMs and IR. Our results showed that the EMG values related to tone and MVC in the IR group were lower than those in the control group.
Two cross-sectional analyses using the US National Health and Nutrition Examination Survey III data reported that higher muscle mass is associated with lower IR and lower risk of diabetes, independent of obesity.9,12
In our study, the participants in the IR group were overweight; in contrast, in the control group, all the participants had normal BMI. It is known that there are genetic links among waist–hip ratio, BMI, and IR.13 This fact supports the high weight in the IR group in our study.
Moreover, the results indicated an association between insulin levels and MVC, ie, the higher the insulin change, the lower the electromyographic parameters of MVC. It is believed that skeletal muscles can adapt to metabolic demands to maintain a normal energy balance and nutrient use. This type of muscle structure is important for glucose uptake; a reduction in muscle mass and changes in the fiber type composition can directly affect acute glucose use.14 Also, there were associations of insulin levels with waist circumference and weight.
Experimental studies on the evaluation of muscle fiber in conditions of IR were not found. In previous studies15,18 about diabetes and muscle action, morphological changes were observed in striated muscle fibers type I (slow) and II (fast) of the urethra.15 The microscopic changes in the urethral sphincter of rats include thinning, atrophy, disorganization, and disruption associated with the loss of normal anatomical location of fast and slow muscle fibers, in addition to a lower percentage of fast fibers.15–18 These data suggest that untreated cases of IR may lead to increased impairment of the PFMs.
Therefore, IR should be identified and treated early to prevent its progression to diabetes and onset of other clinical disorders including urinary incontinence. Several studies have indicated that the risk of UI is 50%–200% higher among women with type 2 diabetes mellitus compared with that among women with normal glucose levels. Atrophy of the external urethral sphincter was observed in female rats after 20 weeks of diabetes induction.18–20 It is possible that the larger number of UIs in diabetes mellitus could be explained by PFM disorder.
To date, no study has correlated the strength or electromyographic activity of the PFMs with IR. EMG is now widely used for the evaluation of the PFMs and investigation of neuromuscular disorders. Furthermore, this method has higher interobserver reproducibility in the evaluation of the MVCs and PFM tone in healthy women.21,22 EMG can detect the electrical activity triggered by the recruitment of motor units but does not measure muscle strength. However, Vodusek has reported a good correlation between the number of activated motor units and muscle strength.23
This study has some limitations. The small number of patients in each group is due to the inclusion criteria, established to homogenize the group and avoid bias in electromyographic data. However, no negative interference occurred as a result of the small confidence intervals, and data distribution was normal. Another limitation is the kind of study. The results should be interpreted as indicating an association, and no temporal link can be established.
Conclusion
The results showed that women with IR present worse electromyographic activity than women without IR. In addition, there was an association between high insulin levels and electromyographic signals of the PFMs. It is suggested that IR can affect the PFMs.
Disclosure
The authors report no conflicts of interest in this work.
Silva WA, Karram MM. Anatomy and physiology of the pelvic floor. Minerva Ginecol. 2004;56:283–302. | |
Chen B, Yeh J. Alterations in connective tissue metabolism in stress incontinence and prolapse. J Urol. 2011;186(5):1768–1772. | |
Li GY, Cui WS, Zhou F, et al. Pathology of urethral fibromuscular system related to parturition-induced stress urinary incontinence and TGF-β1/Smad pathway. Mol Cell Biochem. 2012;364(1–2):329–335. | |
Kim JH, Huang X, Liu G, et al. Diabetes slows the recovery from urinary incontinence due to simulated childbirth in female rats. Am J Physiol Regul Integr Comp Physiol. 2007;293(2):R950–R955. | |
DeFronzo RA. Pathogenesis of type 2 (non-insulin dependent) diabetes mellitus: a balanced overview. Diabetologia. 1992;35:389–397. | |
Luzi L, Barrett EJ, Groop LC, Ferrannini E, DeFronzo RA. Metabolic effects of low-dose insulin therapy on glucose metabolism in diabetic ketacidosis. Diabetes. 1988;37:1470–1477. | |
Bonadonna R, Groop L, Kraemer N, Ferrannini E, Del Prato S, DeFronzo RA. Obesity and insulin resistance in humans: a dose-response study. Metabolism. 1990;39:452–459. | |
Carmina E, Lobo RA. Use of fasting blood to assess the prevalence of insulin resistance in women with polycystic ovary syndrome. Fertil Steril. 2004;82(3):661–665. | |
Srikanthan P, Hevener AL, Karlamangla AS. Sarcopenia exacerbates obesity-associated insulin resistance and dysglycemia: findings from the National Health and Nutrition Examination Survey III. PLoS One. 2010;5(5):e10805. | |
World Health Organization (WHO). Obesity Preventing and Managing the Global Epidemic. Report of a WHO Consultation on Obesity. Geneva: WHO; 1997. Available from: http://www.who.int/nutrition/publications/obesity/WHO_TRS_894/en/. Accessed: 2014 Nov 15. | |
Grape HH, Dedering A, Jonasson AF. Retest reliability of surface electromyography on the pelvic floor muscles. Neurourol Urodyn. 2009;28(5):395–399. | |
Srikanthan P, Karlamangla AS. Relative muscle mass is inversely associated with insulin resistance and prediabetes. Findings from the third National Health and Nutrition Examination Survey. J Clin Endocrinol Metab. 2011;96:2898–2903. | |
Shungin D, Winkler TW, Croteau-Chonka DC, et al. New genetic loci link adipose and insulin biology to body fat distribution. Nature. 2015; 518(7538):187–196. | |
DeUgarte CM, Bartolucci AA, Azziz R. Prevalence of insulin resistance in the polycystic ovary syndrome using the homeostasis model assessment. Fertil Steril. 2005;83(5):1454–1460. | |
Marini G, Rinaldi Jde C, Damasceno DC, Felisbino SL, Rudge MV. [Changes in the extracellular matrix due to diabetes and their impact on urinary continence]. Rev Bras Ginecol Obstet. 2014;36(7):328–333. Portuguese. | |
Morgan DM, Umek W, Guire K, Morgan HK, Garabrant A, DeLancey JO. Urethral sphincter morphology and function with and without stress incontinence. J Urol. 2009;182:203–209. | |
Heesakkers JP, Gerretsen RR. Urinary incontinence: sphincter functioning from a urological perspective. Digestion. 2004;69:93–101. | |
Marini G, Rudge MV, Barbosa AMP, Matheus SMM. Alterações morfológicas das fibras tipos I e II do músculo estriado uretral de ratas prenhes diabéticas [Morphological changes in fibers types I and II in urethral striated muscle of diabetic pregnant rats]. Rev Bras Ginecol Obstet. 2010;32(3). Portuguese. | |
Brown JS, Vittinghoff E, Lin F, Nyberg LM, Kusek JW, Kanaya AM. Prevalence and risk factors for urinary incontinence in women with type 2 diabetes and impaired fasting glucose: findings from the National Health and Nutrition Examination Survey (NHANES) 2001–2002. Diabetes Care. 2006;29(6):1307–1312. | |
Liu G, Lin YH, Yamada Y, Daneshgari F. External urethral sphincter activity in diabetic rats. Neurourol Urodyn. 2008;27(5):429–434. | |
Deffieux X, Hubeaux K, Porcher R, Ismael SS, Raibaut P, Amarenco G. Pelvic floor muscle activity during coughing: altered pattern in women with stress urinary incontinence. Urology. 2007;70(3):443–437. | |
Auchincloss CC, McLean L. The reliability of surface EMG recorded from the pelvic floor muscles. J Neurosci Methods. 2009;182(1):85–96. | |
Vodusek DB. The role of electrophysiology in the evaluation of incontinence and prolapse. Curr Opin Obstet Gynecol. 2002;14(5):509–514. |
 © 2015 The Author(s). This work is published and licensed by Dove Medical Press Limited. The full terms of this license are available at https://www.dovepress.com/terms.php and incorporate the Creative Commons Attribution - Non Commercial (unported, v3.0) License.
By accessing the work you hereby accept the Terms. Non-commercial uses of the work are permitted without any further permission from Dove Medical Press Limited, provided the work is properly attributed. For permission for commercial use of this work, please see paragraphs 4.2 and 5 of our Terms.
© 2015 The Author(s). This work is published and licensed by Dove Medical Press Limited. The full terms of this license are available at https://www.dovepress.com/terms.php and incorporate the Creative Commons Attribution - Non Commercial (unported, v3.0) License.
By accessing the work you hereby accept the Terms. Non-commercial uses of the work are permitted without any further permission from Dove Medical Press Limited, provided the work is properly attributed. For permission for commercial use of this work, please see paragraphs 4.2 and 5 of our Terms.