")
Back to Journals » Clinical Ophthalmology » Volume 15
Evaluation of the Foveal Avascular Zone in Familial Exudative Vitreoretinopathy Using Optical Coherence Tomography Angiography
Authors Hasegawa T, Hirato M, Kobashi C, Yamaguchi A, Takagi R , Tanaka Y , Kaburaki T, Kakehashi A
Received 12 February 2021
Accepted for publication 6 April 2021
Published 7 May 2021 Volume 2021:15 Pages 1913—1920
DOI https://doi.org/10.2147/OPTH.S305520
Checked for plagiarism Yes
Review by Single anonymous peer review
Peer reviewer comments 2
Editor who approved publication: Dr Scott Fraser
Tetsuya Hasegawa, Misaki Hirato, Chieko Kobashi, Aya Yamaguchi, Rina Takagi, Yoshiaki Tanaka, Toshikatsu Kaburaki, Akihiro Kakehashi
Department of Ophthalmology, Saitama Medical Center Jichi Medical University, Saitama-shi, Saitama-ken, Japan
Correspondence: Akihiro Kakehashi
Department of Ophthalmology, Saitama Medical Center Jichi Medical University, Saitama-shi, Saitama-ken, Japan
Tel +81 48 647 2111
Fax +81 48 648 5166
Email [email protected]
Purpose: To evaluate the foveal avascular zone (FAZ) and retinal structure in familial exudative vitreoretinopathy (FEVR).
Patients and Methods: Eighteen eyes with stage 1 or 2 FEVR and 20 control eyes were evaluated. The central retinal thickness (CRT), foveal inner retinal thickness (IRT), surface retinal vessel density (SRVD), and deep retinal vessel density (DRVD) were measured using optical coherence tomography. The FAZ area was calculated using ImageJ software. The equivalent spherical value (SE) and axial length (AL) were measured.
Results: The CRT (232.5± 3.086 vs 211± 12.6325 μm; p=0.003) and foveal IRT (15.83± 13.95 vs 0.9± 4.02 μm; p=0.002) were thicker in the FEVR group than in the control group. The surface FAZ area (0.265± 0.08 vs 0.364± 0.09 mm2; p=0.004) and the deep FAZ area (0.364± 0.1 vs 0.484± 0.11 mm2; p=0.03) were smaller in the FEVR group than in the control group. The SRVD values did not differ among the sectors, but the DRVD was higher in the FEVR group except for the inferior sector (superior, p=0.027; inferior, p=0.88; temporal, p=0.035; nasal, p=0.027). The SE and AL did not differ between the two groups. There were no correlations between the surface and deep layer FAZ area and age, CRT, SE, and AL. The surface, deep FAZ area, and foveal IRT were correlated negatively (surface, r = − 0.47, p=0.033; deep layer FAZ area, r = − 0.46, p=0.037).
Conclusion: Eyes with FEVR have a smaller FAZ because the vascular structure in the inner retina remained in the fovea.
Keywords: familial exudative vitreoretinopathy, optical coherence tomography angiography, foveal avascular zone
Introduction
Familial exudative vitreoretinopathy (FEVR) is a hereditary disorder first reported by Criswick and Schepens in 1969.1 In severe cases, FEVR causes tractional retinal detachment and/or serous retinal detachment due to exudative fibrovascular proliferation, but in mild cases, an avascular area is present in the temporal retina without fibrovascular proliferation. Such mild cases may cause breaks in the temporal retina during childhood to adulthood and then may cause rhegmatogenous retinal detachments. In the past, retinal neovascularization, exudation, dragging of vasculature, and vitreous hemorrhage have been reported and may cause various visual impairments.2,3 In addition, a simple stage classification was reported in 20114: stage 1, peripheral avascular retina without retinal neovascularization; stage 2, peripheral avascular retina with retinal neovascularization; stage 3, extramacular retinal detachment; stage 4, macular-involving retinal detachment or subtotal retinal detachment; and stage 5, total retinal detachment.
With recent improvements in imaging technology, optical coherence tomography angiography (OCTA) has been developed that can construct a retinal blood vessel structure without use of a contrast agent.
The foveal avascular zone (FAZ), formed by development of a ring-shaped anastomosis at the macula at the end of the artery/vein from the retinal surface, can be seen clearly with OCTA. It has been reported that FAZ is enlarged in diabetic retinopathy5,6 and that the size of the FAZ and visual acuity (VA) are inversely correlated.7,8 Another study investigated the area of the FAZ, which is about 0.3 mm2 in normal eyes, and reported that it increased with age.9 The advantage of OCTA is that the resulting vessel density (VD) can be analyzed. A great deal of research done in diabetic retinopathy has reported that the VD decreases.8,10,11
Recent reports have examined OCTA in retinopathy of prematurity (ROP), the ocular findings of which were similar to those of FEVR. According to those reports, the macular retina was thicker and the FAZ area was smaller in ROP than in normal eyes.12–14 However, regarding FEVR, a few studies on the distribution of retinal blood vessels using OCTA have been reported recently.15–17
The purpose of the current study was to investigate the foveal and parafoveal vascular abnormalities in FEVR using OCTA.
Patients and Methods
We included all consecutive cases diagnosed with FEVR and measured using OCTA at our hospital from October 1, 2017, to October 31, 2020. The data were analyzed retrospectively. This study enrolled 18 eyes of 18 patients diagnosed with stage 1 (Figure 1) or stage 2 FEVR and 20 eyes of 20 control patients. The controls were normal volunteers who were recruited after undergoing a general ophthalmologic examination. All data were obtained only from the affected eye or right eye in bilateral cases.
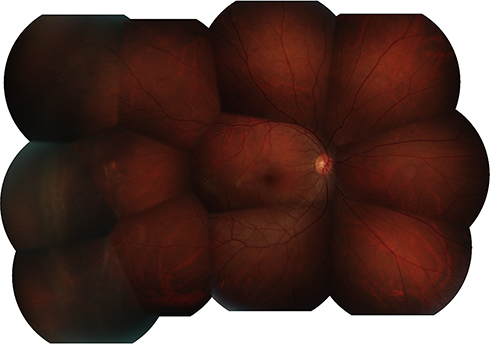 |
Figure 1 Fundus photograph of a right eye with stage 1 FEVR. There is an avascular area temporally. |
FEVR was diagnosed by fluorescence fundus angiography in both eyes, and the presence or absence of avascular area and neovascularization in the peripheral retina was examined. The birthweight and gestational age confirmed that the baby was not premature. We also confirmed the patient’s family history.
The research was conducted according to the Declaration of Helsinki; the Institutional Review Board of the Saitama Medical Center Jichi Medical University approved the study (S19-039). All participants provided informed consent after receiving an explanation of the nature of the study and the possible consequences. The parents and/or legal guardians of the participants under age 18 years provided informed consent. The exclusion criteria were a history of preterm birth, undergoing ophthalmologic surgery, and low-quality OCTA images. Low image quality was assumed to be less than 70% of signal strength and included projection and motion artifacts.
A retrospective review of the ophthalmologic examinations included the best-corrected VA (BCVA), spherical equivalent (SE), axial length (AL), OCT, and OCTA for each patient enrolled. OCT and OCTA were performed using a DRI OCT Triton Plus (Topcon, Tokyo, Japan) machine. The foveal structure was measured with a 5-line, 9-mm cross scan. After that, the central retinal thickness (CRT) and foveal inner retinal thickness (IRT) were measured manually on the B-scan image. The CRT was defined as the distance from the internal limiting membrane (ILM) to the retinal pigment epithelium. The foveal IRT was defined as the distance from the ILM to the outer plexiform layer (OPL). We defined the inner retinal layer as 0 mm in cases in which only the ILM was present in the fovea. The OCTA scan size was 3×3 mm. FAZ data, surface retinal vascular density (SRVD), and deep retinal vascular density (DRVD) were analyzed. The SRVD and DRVD were calculated automatically by the OCT internal software. The FAZ area was calculated using ImageJ software (National Institutes of Health, Bethesda, MD, USA). When using the software, the pixel is calculated and the scale requires adjustment. Since OCTA is measured in a 3x3-mm scan, it calculates a 3-mm pixel count. As a result of calculation using the ImageJ software, 3 mm corresponds to 320.025 pixels. The data were entered into the data in the ImageJ set scale to calculate the area. After that, we used polygonal sections to enclose and measure the FAZ. The same method was used to calculate the surface and deep FAZ areas.
The AL was measured using the IOLMaster 500 (Carl Zeiss Meditec, Jena, Germany).
All statistical analyses were performed using EZR (Saitama Medical Centre, Jichi Medical University).18 All data were expressed as the mean ± standard deviation.
The data from the patients with FEVR and control subjects were compared using the Mann–Whitney U-test. The correlations between continuous variables were analyzed using Pearson’s correlation analyses. P<0.05 was considered statistically significant.
Results
This study enrolled 18 eyes of 18 patients diagnosed with FEVR and 20 eyes of 20 controls.
The mean ages of the FEVR and control groups, respectively, were 31.66±13.38 years and 34.05±6.19 years (p=0.47). The mean refractive error of the FEVR and control groups, respectively, were −5.29±3.8 diopters (D) and −4.525±1.84 D (p=0.43). The mean ALs of the patients with FEVR and the control groups, respectively, were 26.08±1.83 mm and 25.34±1.12 mm (p=0.17). More than a quarter of patients (27.7%) had a family history (Table 1).
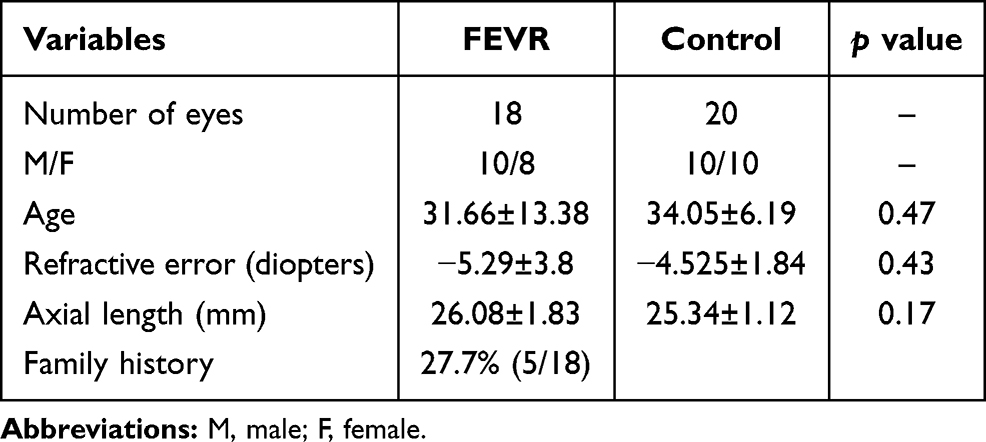 |
Table 1 FEVR and Control Details |
The respective mean BCVAs of the FEVR and control groups were 0.1 logarithm of the minimum angle of resolution (logMAR) and 0.0 logMAR (p=0.13).
The mean CRT (FEVR, 232.5±3.086 μm vs control, 211±12.6325 μm; p=0.003) and foveal IRT (FEVR, 15.83±13.95 μm vs control, 0.9±4.02 μm, p=0.002) were thicker than in the control group. In the FEVR group, 27.8% had a residual inner retinal layer (Figure 2A and B).
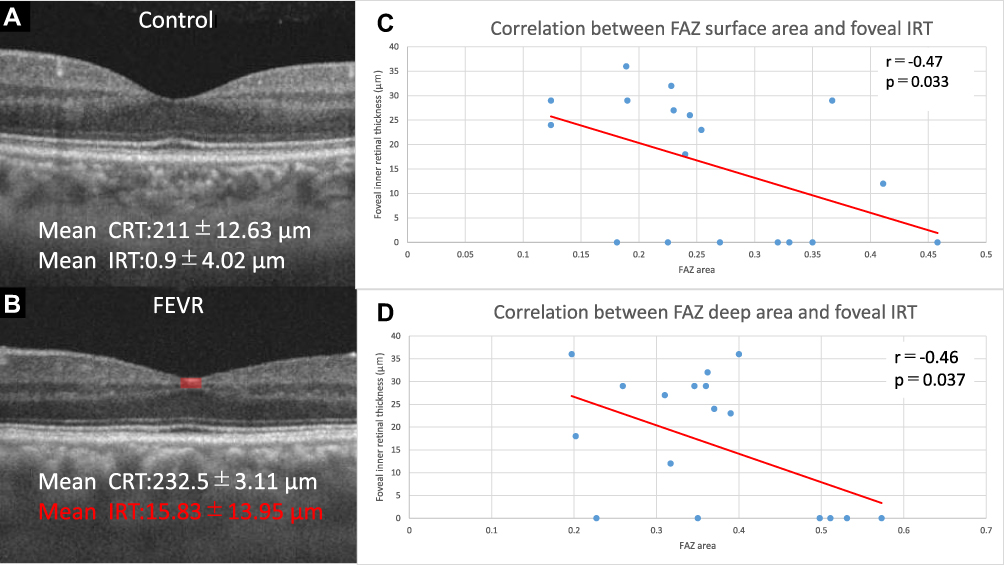 |
Figure 2 (A) An OCT B-scan image of the control group. The mean CRT is 211.5±12.6325 μm. The mean foveal IRT is 0.9±4.02 μm. (B) An OCT B-scan image of the FEVR group. The mean CRT is 232.5±3.086 μm. The mean foveal IRT is 15.83±13.95 μm. The CRT is thicker because the inner retina remains (red area) in the fovea. (C) A negative correlation is found between the surface FAZ area and foveal IRT. (D) A negative correlation is found between the deep FAZ area and foveal IRT. |
The mean surface FAZ area (FEVR, 0.265±0.08 mm2 vs control, 0.364±0.09 mm2, p=0.004) (Figure 3A, B and E) and deep FAZ area (FEVR, 0.364±0.1 mm2 vs control, 0.484 ± 0.11 mm2; p=0.03) (Figure 3C, D and F) were significantly smaller in the FEVR group.
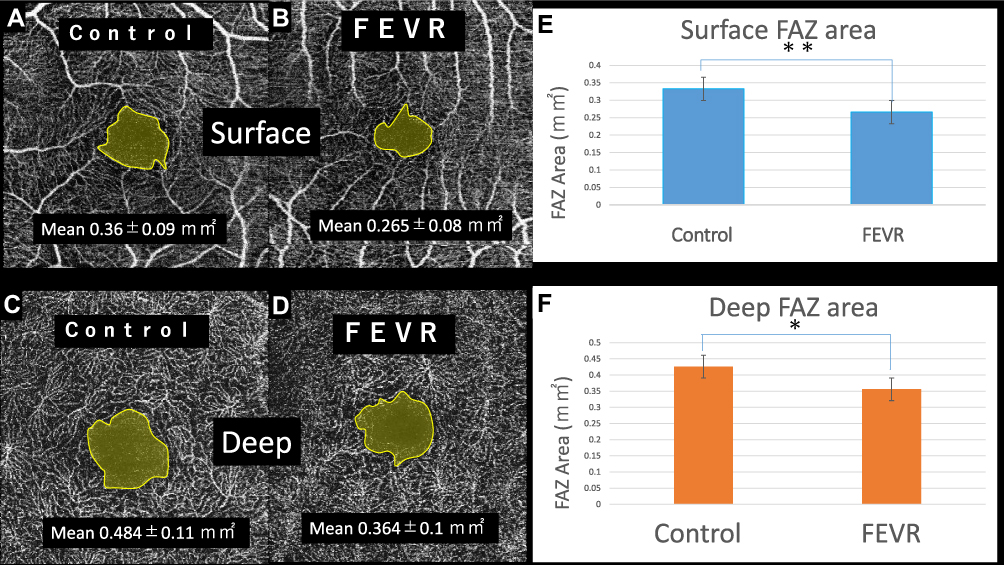 |
Figure 3 (A) A surface FAZ image of the control group. The mean surface FAZ area is 0.364±0.09 mm2. (B) The surface FAZ image of the FEVR group. The mean surface FAZ area is 0.265±0.08 mm2. (C) An image of the deep FAZ in the control group. The mean surface FAZ area is 0.484±0.11 mm2. (D) An image of the deep FAZ in the FEVR group. The mean surface FAZ area is 0.364±0.1 mm2. (E) The surface layer FAZ of the FEVR eye is significantly smaller than in the control group (**p<0.01, Mann–Whitney U-test). (F) The deep layer FAZ of the FEVR eye is significantly smaller than the control group (*p<0.05, Mann–Whitney U-test). |
The difference in the mean foveal SRVD was not significant between the two groups (FEVR, 22.92±4.08% vs control, 21.63±3.63%; p=0.2) (Figure 4A and B). Further, the foveal DRVD did not differ between the FEVR and control groups (FEVR, 23.38±6.13% vs control, 21.86±4.2%; p=0.52) (Figure 5A and B).
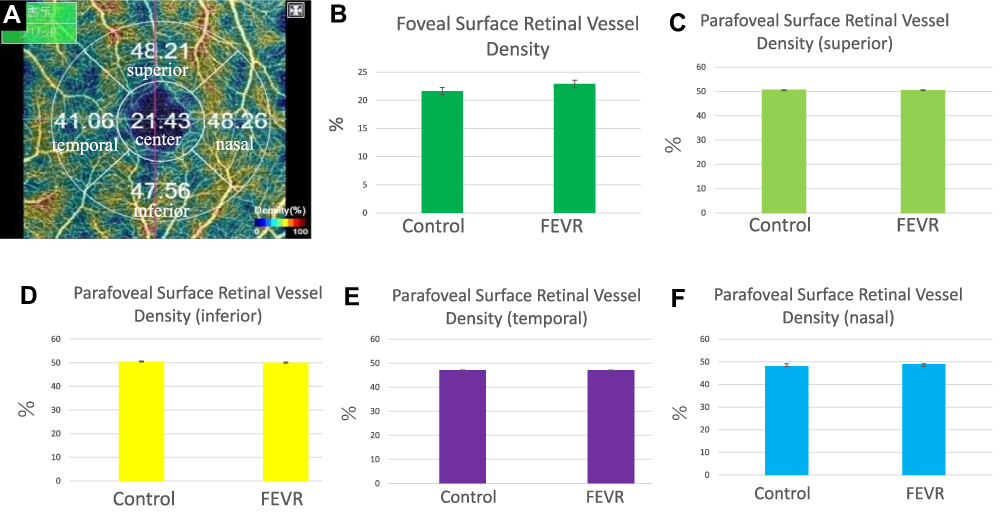 |
Figure 4 (A) The foveal and parafoveal SRVD maps. (B) The mean foveal SRVD does not differ significantly between the two groups. (C) No significant difference is seen between the two groups in the superior parafoveal SRVD. (D) No significant difference is seen between the two groups in the inferior parafoveal SRVD. (E) No significant difference is seen between the two groups in the temporal parafoveal SRVD. (F) No significant difference is seen between the two groups in the nasal parafoveal SRVD. |
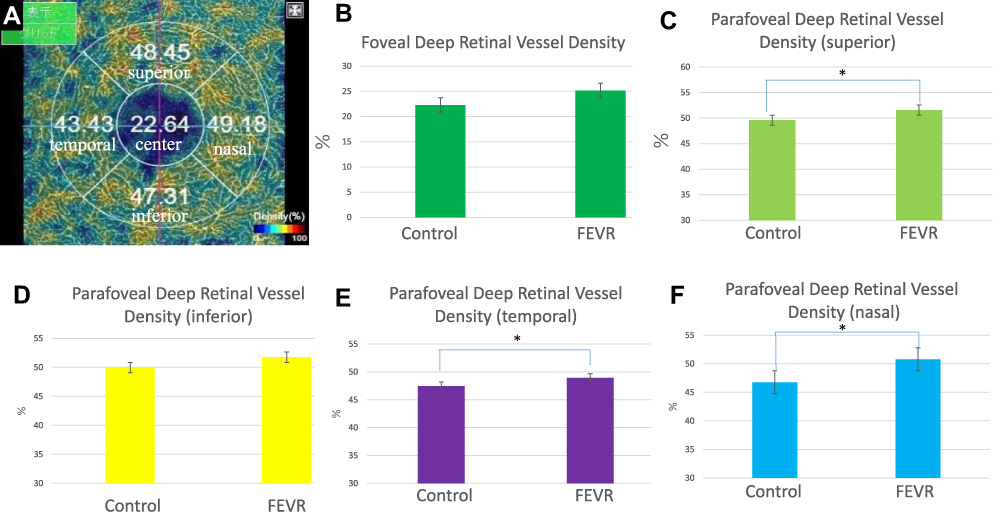 |
Figure 5 (A) The foveal and parafoveal DRVD maps. (B) No significant difference is seen between the two groups in the foveal DRVD. (C) The superior parafoveal DRVD is significantly greater in the FEVR group compared with the control group (*p<0.05). (D) No significant difference is seen between the two groups in the inferior foveal DRVD. (E) The temporal parafoveal DRVD is significantly greater in the FEVR group compared with the control group (*p<0.05). (F) The nasal parafoveal DRVD is significantly greater in the FEVR group compared with the control group (*p<0.05). |
However, the parafoveal SRVD in each sector did not differ between the FEVR and control groups (superior, FEVR, 49.58±3.5% vs control, 49.52±2.9%; p=0.65, inferior, FEVR, 49.81±2.5% vs control, 49.13±3.6%; p=0.59; nasal, FEVR; 48.56±3.23% vs control; 47.27±2.72%; p=0.4; temporal, FEVR; 46.19±1.8% vs control; 46.68±2.59%; p=0.06) (Figure 4A, 4C–4F). However, each sector of the DRVD except for the inferior sector was significantly greater in the FEVR group than the control groups (inferior, FEVR, 51.17±4.56% vs control, 51.57±4.56%; p=0.88) (superior, FEVR, 51.91±3.74% vs control, 50.623±3.8%; p=0.027; nasal, FEVR, 50.1±4.9% vs control, 48.61±3.3%; p=0.027; temporal, FEVR, 48.95±2.98% vs control, 47.86±2.9%; p=0.035) (Figure 5A, C–F). The mean SE (FEVR, −5.29±3.8 D vs control, −4.525±1.84 D; p=0.43) and AL did not differ between the FEVR and control groups (FEVR, 26.08±1.83 mm vs control, 25.34±1.12 mm; p=0.17).
In addition, no correlation were seen between the surface and deep FAZ areas and age (surface, r=0.25, p=0.287; deep, r=-0.09, p=0.67), CRT (surface, r=-0.04, p=0.806; deep, r=-0.214, p=0.216), or SE (surface, r=0.3, p=0.08; deep, r=0.28, p=0.11).
The surface, deep layer FAZ area, and foveal IRT were correlated negatively (surface, r = −0.47, p = 0.0033; deep, r = −0.46, p = 0.037) (Figure 2C and D). No correlation was seen between the surface FAZ area and AL (r=-0.18, p=0.31), but a negative correlation was seen between the deep FAZ area and AL (r=-0.41, p=0.019).
Discussion
In the current study, the BCVA, SE, AL, structural OCT, and OCTA images obtained from the FEVR group and normal controls were reviewed retrospectively. The FEVR eyes had a smaller FAZ compared to the controls. The DRVD was higher in the FEVR group except for the inferior sector. The surface and deep FAZ areas were correlated negatively with the foveal IRT. Further, the deep FAZ area and AL also were correlated negatively. Based on these results, vascular changes were found not only in the peripheral retina but also in the macula in FEVR.8 Thus, if findings on OCT and OCTA images confirm an increased CRT due to a residual retinal inner layer and a decreased FAZ area without a history of ROP, FEVR should be ruled out with a detailed peripheral fundus examination.
The FAZ area in eyes with FEVR was reported to be small,15 as were those in ROP12–14 and Stickler syndrome.19 The cause of the small FAZs in the latter two diseases was speculated that the inner retinal layer remained in the fovea. In the current study, the CRT was thick because the inner retinal layer remained and was correlated negatively with the IRT. Yonekawa et al reported that the inner retinal layer remained in 20% of cases with FEVR.20 Foveal development was considered a phenomenon referred to as cone packing. Cells inside the retina move distally to form the fovea, and cone photoreceptors move centripetally to increase the concentration in the fovea.21 If this is incomplete, the inner retinal layer may remain in the fovea or the foveal bulge may not be observed in the OCT images. We speculated that such macular hypoplasia also occurs in FEVR.
Genetic variations may affect the phenotypes in FEVR. Six genes involved in FEVR have been identified, ie, low-density lipoprotein receptor-related 5 (LRP5),22 frizzled-4 (FZD4),23 tetraspanin-12 (TSPAN12),24 Norrie disease gene (NDP),25 zinc finger protein 408 (ZNF408),26 and kinesin family member 11 (KIF11).27 These are involved in the Wnt/Norrin signaling pathway and are important for retinal vascular development.28 Previous studies have reported that the foveal structure is established in the case of LRP5 mutations, but the CRT is significantly thicker in the presence of FZD4 and TSPAN12 mutations.15 Compared to a previous report (20%), our results may be comparable or slightly higher at 27.8% for cases with a residual inner retinal layer in the macula.20 Although we did not examine genomic mutations, we speculated that many of our cases may have mutations in the FZD4 and TSPAN12 genes.
To the best of our knowledge, this report is the first to investigate parafoveal VD in each sector in FEVR. In this study, the foveal SRVD was significantly higher in FEVR compared with the controls, but there was no significant difference in the foveal DRVD. The parafoveal SRVD in each sector did not differ significantly between the FEVR and control groups, but the parafoveal DRVD was higher in the FEVR group, with the exception of the inferior sector. Previous studies have reported that eyes with FEVR had significantly lower densities of the fovea and parafoveal SRVD, and in contrast the DRVD did not differ significantly.15 Takagi et al12 and Nonobe et al14 examined the surface VD in ROP and reported it to be significantly lower in the parafovea. Koulisis et al reported that the VD was lower in the surface and deep layers in the FEVR eyes.16 In contrast, Chen et al13 reported that the foveal VD in ROP was high in both the surface and deep layers. Hsu et al reported that there are both cases of decreased (86%) and increased (14%) VD in the superficial vascular structure of the FEVR eyes.17 Since the methods of analysis differed depending on the OCT model, it is difficult to compare with other reports. We consider that the OCTA scan direction might be why significant differences were not obtained in the inferior DRVD. Usually, the OCTA scan time is 5 to 10 seconds and the scan direction is from superior to inferior. Patients with dry eye are more likely to blink during the scan, which may reduce the image quality in the lower scan in the second half of the imaging. We speculated that this may be why significant differences in the DRVD were not seen in the inferior sector.
Canny and Oliver first reported abnormalities in the peripheral blood vessels using fluorescein angiography,29 and Miyakubo et al30 also reported that the avascular area exhibited characteristic V-shaped blood vessels. Further, the abnormality suggested the possibility of spreading 360 degrees.30 Although it was predicted that the higher detection rate of the temporal VD would be affected, in fact, there was a significant difference in the area excluding the inferior sector. We speculated that increasing DRVD would compensate for peripheral vascular abnormalities.
The current study had limitations. At first, we calculated the data manually. Some OCT models automatically calculate data, but there was no such model used this time. It is also possible that the examiner subjectivity had an effect. Second, OCTA images are not averaged. In the past, Uji et al reported that averaging multiple front OCTA images improves image quality and has a major impact on the quantitative measurements.31 Averaging may change the analysis results. Third, the study included a small number of cases. Although FEVR is rare, the number of cases should be increased and the reproducibility of the results should be examined in the future. Fourth, there is no genetic test for FEVR. Previous reports have examined the characteristics between genes, but the number of samples was small and no significant difference15 was found. If it becomes possible to examine the characteristics among genes, we may be able to differentiate the genetic characteristics.
Conclusion
The current study provided new observations about the retinal structure of patients with FEVR, ie, the FAZ was small, the CRT was thick due to the effect of the residual inner retinal layer, and the parafoveal DRVD was higher in the FEVR group except for inferiorly. The FAZ in FEVR is small because the inner retinal layer with retinal vasculature remains in the macula. In the future, to confirm the vascular changes found in the current study, we should investigate many more cases of FEVR.
Ethics
The Institutional Review Board of the Saitama Medical Center Jichi Medical University approved the study. All participants and/or parents of guardians provided informed consent after receiving an explanation of the nature of the study and the possible consequences.
Funding
No funding or sponsorship was received for this study or publication of this article.
Disclosure
Dr Rina Takagi reports grants from Novartis Japan, outside the submitted work. The authors have no other competing interests related to this report.
References
1. Criswick VG, Schepens CL. Familial exudative vitreoretinopathy. Am J Ophthalmol. 1969;68(4):578–594. doi:10.1016/0002-9394(69)91237-9
2. Gole GA, Goodall K, James MJ. Familial exudative vitreoretinopathy. Br J Ophthalmol. 1985;69:76. doi:10.1136/bjo.69.1.76
3. Kashani AH, Learned D, Nudleman E, et al. High prevalence of peripheral retinal vascular anomalies in family members of patients with familial exudative vitreoretinopathy. Ophthalmology. 2014;121:262–268. doi:10.1016/j.ophtha.2013.08.010
4. Ranchod TM, Ho LY, Drenser KA, Capone A, Trese MT. Clinical presentation of familial exudative vitreoretinopathy. Ophthalmology. 2011;118(10):2070–2075. doi:10.1016/j.ophtha.2011.06.020
5. de Carlo TE, Chin AT, Bonini Filho MA, et al. Detection of microvascular changes in eyes of patients with diabetes but not clinical diabetic retinopathy using optical coherence tomography angiography. Retina. 2015;35(11):2364–2370. doi:10.1097/IAE.0000000000000882
6. Takase N, Nozaki M, Kato A, et al. Enlargement of foveal avascular zone in diabetic eyes evaluated by en face optical coherence tomography angiography. Retina. 2015;35(11):2377–2383. doi:10.1097/IAE.0000000000000849
7. Balaratnasingam C, Inoue M, Ahn S, et al. Visual acuity is correlated with the area of the foveal avascular zone in diabetic retinopathy and retinal vein occlusion. Ophthalmology. 2016;123(11):2352–2367. doi:10.1016/j.ophtha.2016.07.008
8. Samara WA, Shahlaee A, Adam MK, et al. Quantification of diabetic macular ischemia using optical coherence tomography angiography and its relationship with visual acuity. Ophthalmology. 2017;124(2):235–244. doi:10.1016/j.ophtha.2016.10.008
9. Iafe NA, Phasukkijwatana N, Chen X, et al. Retinal capillary density and foveal avascular zone area are age-dependent: quantitative analysis using optical coherence tomography. Invest Ophthalmol Vis Sci. 2016;57(13):5780–5787. doi:10.1167/iovs.16-20045
10. Bhanushali D, Anegondi N, Gadde SG, et al. Linking retinal microvasculature features with severity of diabetic retinopathy using optical coherence tomography angiography. Invest Ophthalmol Vis Sci. 2016;57(9):519–525. doi:10.1167/iovs.15-18901
11. Agemy SA, Scripsema NK, Shah CM, et al. Retinal vascular perfusion density mapping using optical coherence tomography in normals and diabetic retinopathy. Retina. 2015;35(11):2353–2363. doi:10.1097/IAE.0000000000000862
12. Takagi M, Maruko I, Yamaguchi A, et al. Foveal abnormalities determined by optical coherence tomography angiography in children with history of retinopathy of prematurity. Eye. 2019;33(12):1890–1896. doi:10.1038/s41433-019-0500-5
13. Chen YC, Chen YT, Cheg SN. Foveal micro vascular anomalies on optical coherence tomography angiography and the correlation with foveal thickness and visual acuity in retinopathy of prematurity. Graefes Arch Clin Exp Ophthalmol. 2019;257:23–30. doi:10.1007/s00417-018-4162-y
14. Nonobe N, Kaneko H, Ito Y, et al. Optical coherence tomography angiography of the foveal avascular zone in children with a history of treatment-requiring retinopathy of prematurity. Retina. 2019;39(1):111–117. doi:10.1097/IAE.0000000000001937
15. Chen C, Liu C, Wang Z, et al. Optical coherence tomography angiography in familial exudative vitreoretinopathy: clinical features and phenotype-genotype correlation. Invest Ophthalmol Vis Sci. 2018;59(15):5726–5734. doi:10.1167/iovs.18-25377
16. Koulisis N, Moysidis SN, Yonekawa Y, et al. Correlating changes in the macular microvasculature and capillary network to peripheral vascular pathologic features in familial exudative vitreoretinopathy. Ophthalmol Retina. 2019;3(7):597–606. doi:10.1016/j.oret.2019.02.013
17. Hsu ST, Finn AP, Chen X, et al. Macular microvascular findings in familial exudative vitreoretinopathy on optical coherence tomography angiography. Ophthalmic Surg Lasers Imaging Retina. 2019;50(5):322–329. doi:10.3928/23258160-20190503-11
18. Kanda Y. Investigation of the freely available easy-to-use software ‘EZR’ for medical statistics. Bone Marrow Transplant. 2013;48(3):452–458. doi:10.1038/bmt.2012.244
19. Matsushita I, Nagata T, Hayashi T, et al. Foveal hypoplasia in patients with Stickler syndrome. Ophthalmology. 2017;124(6):896–902. doi:10.1016/j.ophtha.2017.01.046
20. Yonekawa Y, Thomas BJ, Drenser KA, et al. Familial exudative vitreoretinopathy: spectral-domain optical coherence tomography of the vitreoretinal interface, retina, and choroid. Ophthalmology. 2015;122:2270–2277. doi:10.1016/j.ophtha.2015.07.024
21. Yuodelis C, Hendrickson A. A qualitative and quantitative analysis of the human fovea during development. Vision Res. 1986;26(6):847–855. doi:10.1016/0042-6989(86)90143-4
22. Gong Y, Slee RB, Fukai N, et al. LDL receptor-related protein 5 (LRP5) affects bone accrual and eye development. Cell. 2001;107(4):513–523. doi:10.1016/S0092-8674(01)00571-2
23. Robitaille J, MacDonald ML, Kaykas A, et al. Mutant frizzled-4 disrupts retinal angiogenesis in familial exudative vitreoretinopathy. Nat Genet. 2002;32:326–330. doi:10.1038/ng957
24. Poulter JA, Ali M, Gilmour DF, et al. Mutations in TSPAN12 cause autosomal-dominant familial exudative vitreoretinopathy. Am J Hum Genet. 2010;86:248–253. doi:10.1016/j.ajhg.2010.01.012
25. Chen ZY, Battinelli EM, Fielder A, et al. A mutation in the Norrie disease gene (NDP) associated with X-linked familial exudative vitreoretinopathy. Nat Genet. 1993;5:180–183. doi:10.1038/ng1093-180
26. Collin RWJ, Nikopoulous K, Dona M, et al. ZNF408 is mutated in familial exudative vitreoretinopathy and is crucial for the development of zebrafish retinal vasculature. Proc Natl Acad Sci USA. 2013;110:9856–9861. doi:10.1073/pnas.1220864110
27. Robitaille JM, Gillett RM, LeBlanc MA, et al. Phenotypic overlap between familial exudative vitreoretinopathy and microcephaly, lymphedema, and chorioretinal dysplasia caused by KIF11 mutations. JAMA Ophthalmol. 2014;132:1393–1399. doi:10.1001/jamaophthalmol.2014.2814
28. Tauqeer Z, Yonekawa Y. Familial exudative vitreoretinopathy: pathophysiology, diagnosis, and management. Asia Pac J Ophthalmol (Phila). 2018;7:176–182. doi:10.22608/APO.201855
29. Canny CLB, Oliver GL. Fluorescein angiographic findings in familial exudative vitreoretinopathy. Arch Ophthalmol. 1976;94(7):1114–1120. doi:10.1001/archopht.1976.03910040034006
30. Miyakubo H, Hashimoto K, Miyakubo S. Retinal vascular pattern in familial exudative vitreoretinopathy. Ophthalmology. 1984;91(12):1524–1530. doi:10.1016/S0161-6420(84)34119-7
31. Uji A, Balasubramanian S, Lei J, et al. Impact of multiple en face image averaging on quantitative assessment from optical coherence tomography angiography image. Ophthalmology. 2017;124:944–952. doi:10.1016/j.ophtha.2017.02.006
 © 2021 The Author(s). This work is published and licensed by Dove Medical Press Limited. The full terms of this license are available at https://www.dovepress.com/terms.php and incorporate the Creative Commons Attribution - Non Commercial (unported, v3.0) License.
By accessing the work you hereby accept the Terms. Non-commercial uses of the work are permitted without any further permission from Dove Medical Press Limited, provided the work is properly attributed. For permission for commercial use of this work, please see paragraphs 4.2 and 5 of our Terms.
© 2021 The Author(s). This work is published and licensed by Dove Medical Press Limited. The full terms of this license are available at https://www.dovepress.com/terms.php and incorporate the Creative Commons Attribution - Non Commercial (unported, v3.0) License.
By accessing the work you hereby accept the Terms. Non-commercial uses of the work are permitted without any further permission from Dove Medical Press Limited, provided the work is properly attributed. For permission for commercial use of this work, please see paragraphs 4.2 and 5 of our Terms.