")
Back to Journals » Drug Design, Development and Therapy » Volume 16
Evaluation of the Effect of Eslicarbazepine Acetate on the Pharmacokinetics of Perampanel in Rats by Isotope-Dilution-UHPLC-MS/MS
Received 10 October 2022
Accepted for publication 24 November 2022
Published 28 November 2022 Volume 2022:16 Pages 4091—4099
DOI https://doi.org/10.2147/DDDT.S392934
Checked for plagiarism Yes
Review by Single anonymous peer review
Peer reviewer comments 2
Editor who approved publication: Professor Anastasios Lymperopoulos
Ping Liu,1,2 Jing An,2 Huizhen Wu1,2
1Graduate School of Hebei Medical University, Shijiazhuang, People’s Republic of China; 2National Clinical Drug Monitoring Center, Department of Pharmacy, Hebei General Hospital, Shijiazhuang, People’s Republic of China
Correspondence: Huizhen Wu, National Clinical Drug Monitoring Center, Department of Pharmacy, Hebei General Hospital, No. 348, West Heping Road, Shijiazhuang, 050051, People’s Republic of China, Email [email protected]
Purpose: The present study aimed to establish and validate an isotope-dilution-UHPLC-MS/MS method for the determination of perampanel (PER) concentration and investigate the effect of eslicarbazepine acetate (ESL) on the pharmacokinetics of PER in rats.
Methods: The rats were randomly divided into the control (0.5% CMC-Na) and experimental groups (ESL, 72 mg/kg), with six rats in each group. A single dose of PER (1 mg/kg) was administered after a week of repetitive 0.5% CMC-Na or ESL dosing (72 mg/kg); then, plasma samples were collected. Perampanel-d5 (PER-d5) was used as the internal standard (IS), liquid-liquid extraction of plasma samples was carried out using ethyl acetate, and chromatographic separation was carried out on a Titank C18 column (2.1 mm × 50 mm, 3.0 μm) using a gradient mobile phase consisting of 0.1% formic acid and acetonitrile at a flow rate of 0.3 mL/min.
Results: PER had good linearity (0.3– 600 ng/mL, r > 0.999), and the accuracy, precision, recovery rate, and matrix effects (ME) met the Food and Drug Administration (FDA) guidelines. Compared to the control group, the area under the curve AUC0→t, AUC0→∞, and Cmax of PER in the experimental group decreased by 30.28%, 30.34%, and 46.94%, respectively, and CL increased by 32.08%.
Conclusion: ESL could induce the metabolism of PER in rats and decreases plasma exposure to PER. Thus, the concomitant treatment with ESL may require a high dose of PER to achieve the same efficacy.
Keywords: perampanel, eslicarbazepine acetate, pharmacokinetics, UHPLC-MS/MS, drug-drug interactions, Sprague–Dawley rats
Introduction
Epilepsy is a neurological disorder that affects more than 7000 people worldwide.1 About one-third of the individuals progressed to drug-resistant epilepsy, which was defined as a failure of adequate trials.2 Subsequently, antiepileptic drug schedules (whether as monotherapies or in combination) were selected appropriately to achieve sustained freedom from seizures.3 Drug resistance is a key challenge in treating epilepsy.4 A small number of patients with drug-resistant epilepsy can achieve seizure freedom through surgery.5 Most drug-resistant epilepsies require alternative treatments due to the inability of the traditional methods to accurately locate the epileptic foci.5 The third generation of new antiepileptic drugs (AEDs), such as perampanel (PER) and eslicarbazepine acetate (ESL), offer new hope for decreasing resistance in treatment-resistant epilepsy.6,7
PER is a highly selective, noncompetitive α-amino-3-hydroxy-5-methyl-4-isoxazolepropionic acid (AMPA) receptor antagonist and a novel antiepileptic agent approved in Europe and the United States for the treatment of partial-onset seizures (POS) and primary generalized tonic-clonic (PGTC) seizures.8–10 In addition, PER is metabolized in the liver mainly through cytochrome P450 (CYP) 3A4, and its clearance can be achieved by an enzyme (CYP3A4)-inducer antiepileptic agents.11 Population pharmacokinetic analysis showed that concomitant use of CYP3A4-inducing AEDs (carbamazepine, oxcarbazepine, or phenytoin) with perampanel resulted in a 2- to 3-fold increase in the oral clearance of PER and a 50–67% reduction in AUC.12,13
ESL, an antiepileptic agent that acts on the slow inactivated state of sodium channels, is approved for the treatment of POS in patients ≥4-years-old.14,15 It is also an inducer of CYP3A4 enzyme.15 In vivo studies showed that ESL reduces the plasma concentration of simvastatin metabolized by CYP3A4 and the Cmax and AUC of b-hydroxyacid simvastatin, the main active metabolite of simvastatin by 41% and 49%, respectively.16
The combinations of AEDs with different mechanisms of action might be more effective than monotherapy in the treatment of drug-resistant epilepsy.17,18 However, polytherapy AEDs have potentially adverse pharmacokinetic interactions.19 Currently, there is no relevant study to show the effect of ESL on the pharmacokinetics of PER. Therefore, based on previous studies, we established an isotope-dilution Ultra-High Performance liquid chromatography-tandem mass spectrometry (UHPLC–MS/MS) with perampanel-d5 (PER-d5) as an internal standard (IS) to detect the plasma concentration of PER in SD rats and successfully verified the pharmacokinetic interaction between ESL and PER.20–23
Materials and Methods
Chemicals and Reagents
PER (purity >98%) was purchased from Panphy Chemicals Corporation (Los Angeles, CA, USA), and PER-d5 (IS, purity >99%) was purchased from TLC Pharmaceutical Standards Ltd (Newmarket, Ontario, Canada). ESL (purity >98%) was purchased from TCI Chemicals Ltd (Shanghai, China). Acetonitrile, ethyl acetate and formic acid were chromatographic grade and obtained from Fisher Scientific (Pittsburgh, PA, USA). Ultrapure water was purchased from Wahaha Group Ltd (Hangzhou, Zhejiang, China).
Instrumentation and Analytical Conditions
UHPLC-MS/MS method was conducted using a Shimadzu LC-30 UHPLC system (Shimadzu Corporation; Kyoto, Japan) and an AB Sciex 5500 triple quadrupole tandem mass spectrometer equipped with electrospray ionization source (Framingham, MA, USA). The chromatographic separation was performed on a Titank C18 column (2.1 mm×50 mm, 3.0 μm), and the column temperature was 40 °C. The mobile phase was composed of acetonitrile (B) and 0.1% formic acid-water (A), and the gradient elution procedure was as follows: 0–0.5 min, 30% B; 0.5–2.0 min, 30–90% B; 2.0–3.0 min, 90% B; 3.0–3.5 min, 90–30% B; 3.5–5.0 min, 30% B. The injection volume was 5 µL, and the flow rate was 0.3 mL/min. The positive ion multi-response monitoring mode was used, and the target of the parent and daughter ions of PER and IS were m/z 350.2 → 219.2 and m/z 355.3 → 220.0, respectively (Figure 1). The declustering potential and collision energy for PER and IS were 195 V and 50 eV, respectively. The other optimized mass spectrum parameters were as follows: temperature (TEM), 600 °C; ion spray voltage, 5500 V; ion source gas 1, 60 psi; ion source gas 2, 60 psi; curtain gas, 30 psi.
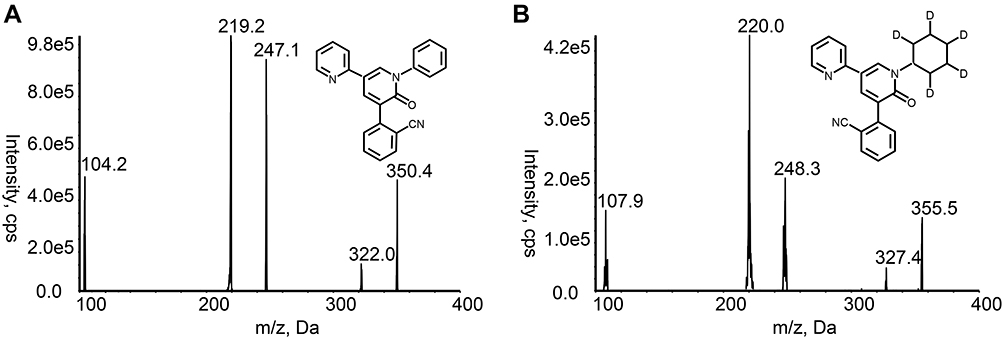 |
Figure 1 Fragment ions of (A) PER and (B) PER-d5 (IS). |
Preparation of Standard Solutions and Quality Control (QC) Samples
PER and IS were solubilized in acetonitrile to prepare the standard stock solution of 1 mg/mL. The stock solution of PER was diluted with acetonitrile to obtain two groups of working solutions. An appropriate volume of working solutions was added to the blank rat plasma to obtain a series of calibration standards (0.3, 3, 6, 30, 60, 300, and 600 ng/mL) and quality control (QC) samples (0.6, 45, and 450 ng/mL). The stock solution of IS was diluted to the working solution of 30 ng/mL acetonitrile.
Plasma Sample Preparation
Plasma samples were pretreated by liquid-liquid extraction. A volume of 4 µL of IS working solution was added to 40 µL of plasma samples and vortexed for 1 min. Then, 200 µL ethyl acetate was added to the mixture and vortexed for 2 min, followed by centrifugation (4 °C) at 13,000 rpm for 10 min. The upper organic layer was transferred to a centrifugation tube and evaporated to dryness using a stream of nitrogen at room temperature. The residue was dissolved in 150 µL of 50% acetonitrile. The supernatant, collected by centrifugation (4 °C) at 12,000 rpm for 2 min, was injected (5 µL) into the column for analysis.
Method Validation
The bioanalytical assay method was verified following the Guidelines for Industry Bioanalytical Method Validation (UFDA), and the parameters evaluated were selectivity, linearity, precision, accuracy, matrix effect, extraction recovery, and stability.24
The selectivity of the method reflected that the interfering substances to the target analyte was within the acceptable range in the biological matrix. The interference was evaluated by comparing the chromatograms of blank plasma samples from six different rats; the rat plasma samples and the blank plasma spiked with 0.3 ng/mL of PER and IS, respectively.
The standard curve of the method was the correlation between the analyte concentration and the instrument response value within a specified concentration range. A weighted (1/X2) least-squares linear regression method was used via Analyst Software. The independent variable was the concentration of the analyte, and the dependent variable was the peak area ratio of the analyte to IS. LLOQ, the lowest point of the standard curve, can be quantified with precision and accuracy.
Six replicates of QC samples at four concentration levels, LLOQ, low, mid, and high (repeated for three consecutive days), were selected to inspect the inter- and intraday precision and accuracy. The acceptance criteria for precision and accuracy were within 15% RSD and 15% RE, respectively, except at LLOQ, wherein these were within 20% of the minimum calibration concentration.
The extraction recovery was accessed by comparing the intended peak area of the samples spiked with analyte pre-extraction to the samples spiked with analyte post-extraction. The matrix effect was evaluated by comparing the intended peak area of samples of the blank plasma post-extraction spiked with the analyte to the samples of the corresponding standard solution spiked with the analyte. The extraction recovery and matrix effect were determined by analysis of three QC concentration samples (0.6, 45, and 450 ng/mL) from six individual sources.
The stability of PER in rat plasma was investigated by analyzing the three concentrations of QC. The following four kinds of stability were examined: autosampler stability (in an autosampler for 8 h), freeze-thaw stability (three freeze-thaw cycles), long-term stability (at −20 °C for one month), and room-temperature stability (at room temperature for 4 h).
Pharmacokinetic Studies in Rat
Specific pathogen-free (SPF) grade male Sprague–Dawley (SD) rats (weight: 230±10 g) were provided by the Laboratory Animal Resources Institute of the National Institutes for Food and Drug Control (Beijing, China). The license number is SCXK (Beijing) 2017–0005. The animal experiment protocols were approved by the Experimental Animal Welfare Ethics Committee of Hebei Medical University (Shijiazhuang, China) and were conducted in accordance with the Guide for the Care and Use of Laboratory Animals. Rats were fed twice a day in an appropriate environment at 18–24 °C and 40–60% humidity. Before the experiment, the rats were fasted overnight without lack of water. A total of 12 rats were randomly and equally divided into two groups: experimental and control. The two groups were administered 72 mg/kg ESL and the corresponding volume of solvent (0.5% sodium carboxymethyl cellulose) intragastrically for 7 consecutive days, respectively. On day 7, rats in both groups were given 1 mg/kg PER by intragastric administration 30 min after administration of ESL or solvent. At 0.083, 0.25, 0.5, 0.75, 1, 1.5, 2, 4, 6, 8, 10, 12, and 24 h after the last administration, a volume of 150 µL blood sample was collected from venous plexus of the inner canthus into heparinized tubes. The supernatant obtained by centrifugation at 3000 rpm for 10 min was stored at −20 °C until analysis.
Statistical Analysis
The pharmacokinetic parameters of PER were calculated in the non-compartmental model using DAS 2.1.1 software (Mathematical Pharmacology Professional Committee of China, Shanghai, China). SPSS 25.0 software package (SPSS Inc., Chicago, IL, USA) was used to compare the pharmacokinetic parameters of each group. t-test or nonparametric test was used according to whether the data were normally distributed; P<0.05 indicated a statistically significant difference. The mean concentration-time curves of PER were drawn using GraphPad Prism 8.0 (GraphPad Software Inc., San Diego, CA, USA).
Results
Method Validation
The chromatograms of blank plasma, rat plasma samples after gavaging PER administration, and the blank plasma spiked with 0.3 ng/mL of PER and IS revealed non-interfering peaks from endogenous substances (Figure 2). The retention time of both PER and IS was 2.46 min.
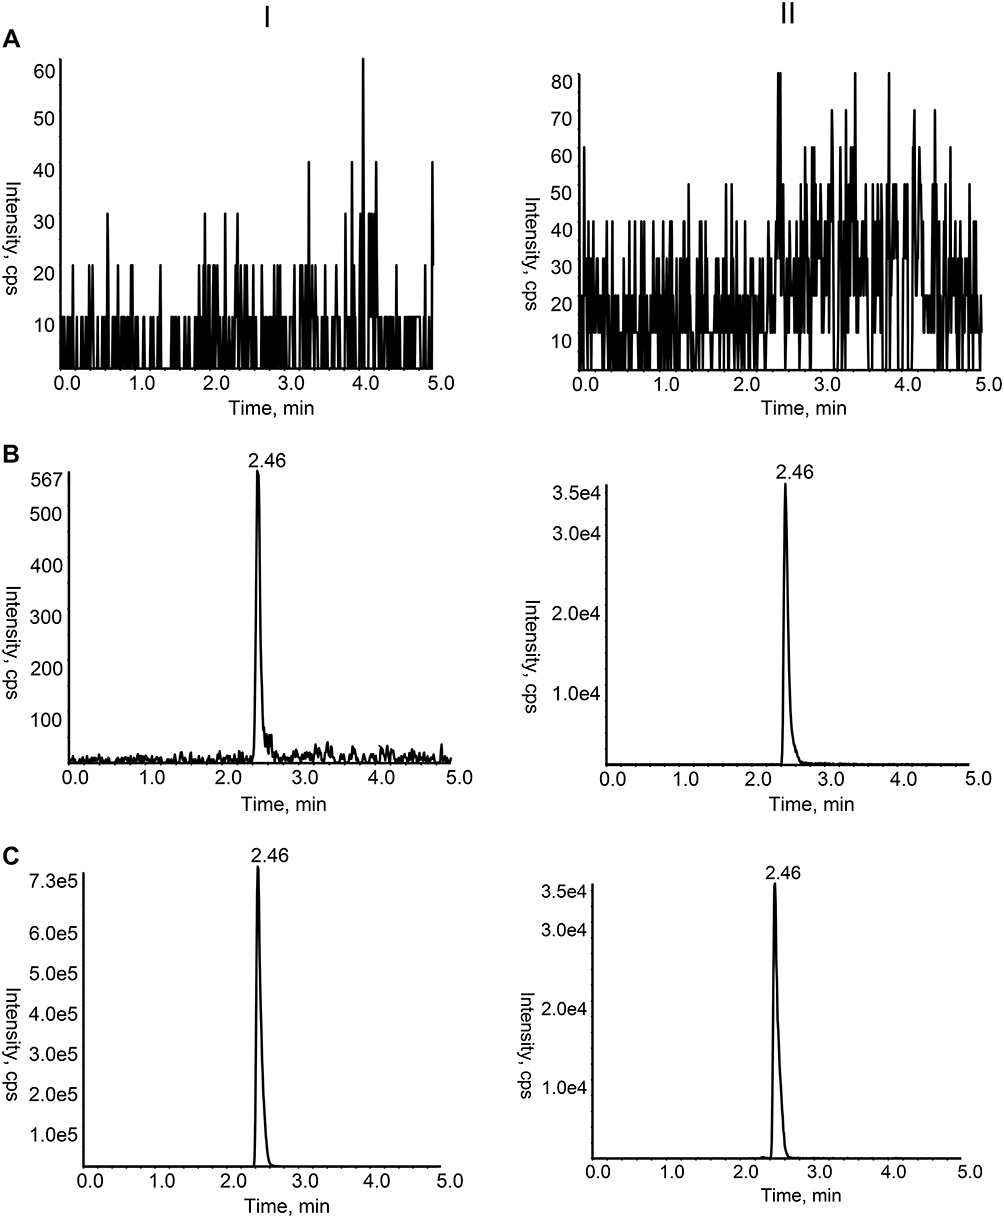 |
Figure 2 Chromatograms of PER (I) and IS (II) in rat plasma samples. (A) Blank rat plasma sample; (B) Rat plasma sample spiked with PER at the LLOQ level and IS; (C) Rat plasma sample after oral administration. |
A satisfactory linear range of PER was 0.3–600 ng/mL in rat plasma. A typical regression equation of PER was y=0.0436x+0.00128 (r>0.999). Based on a signal-to-noise ratio of at least 5:1, the lower limit of quantification (LLOQ) of PER was established to be 0.3 ng/mL.
Inter- and intraday precision and accuracy data are shown in Table 1. The %RSD and %RE values were in full compliance with acceptable FDA standards <15% for the QCs and <20% for LLOQs.
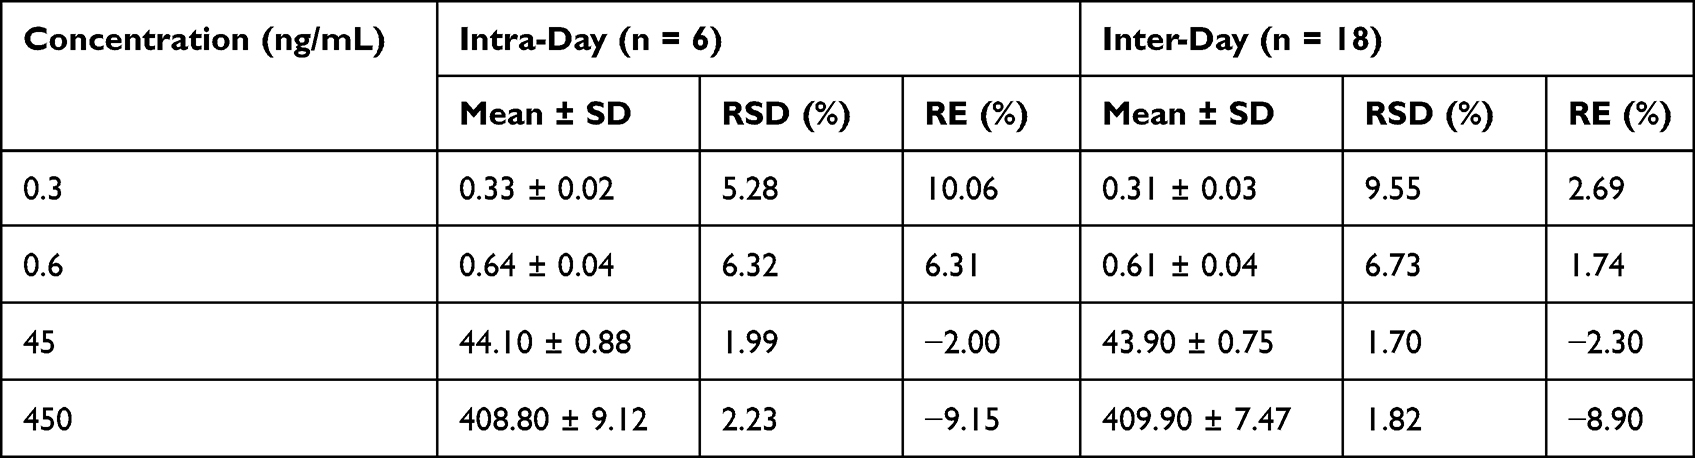 |
Table 1 Precision and Accuracy of per in Rat Plasma |
The extraction recovery and matrix effect for QC samples of PER are summarized in Table 2. The extraction recovery for PER at LQC, MQC, and HQC was 75.99 ± 8.34%, 80.28 ± 4.81%, and 75.93 ± 3.69%, respectively. The range of matrix effect was 96.03–100.64%, indicating that the co-elution of matrix components did not enhance or suppress the ion concentrations.
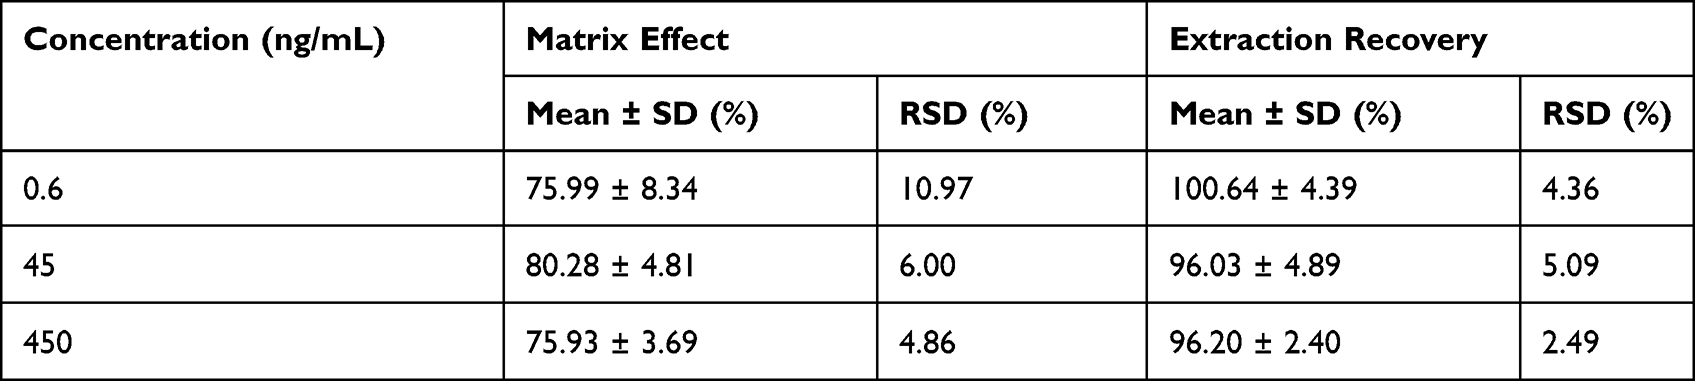 |
Table 2 Matrix Effect and Extraction Recovery of per in Rat Plasma (n = 6) |
Strikingly, LQC, MQC, and HQC were within the acceptable standard of ±15% after being placed in an autosampler for 8 h, three freeze-thaw cycles, being placed at −20 °C for one month, or being placed at room temperature for 4 h (Table 3). PER was stable under all conditions, as assessed by the bioassay method.
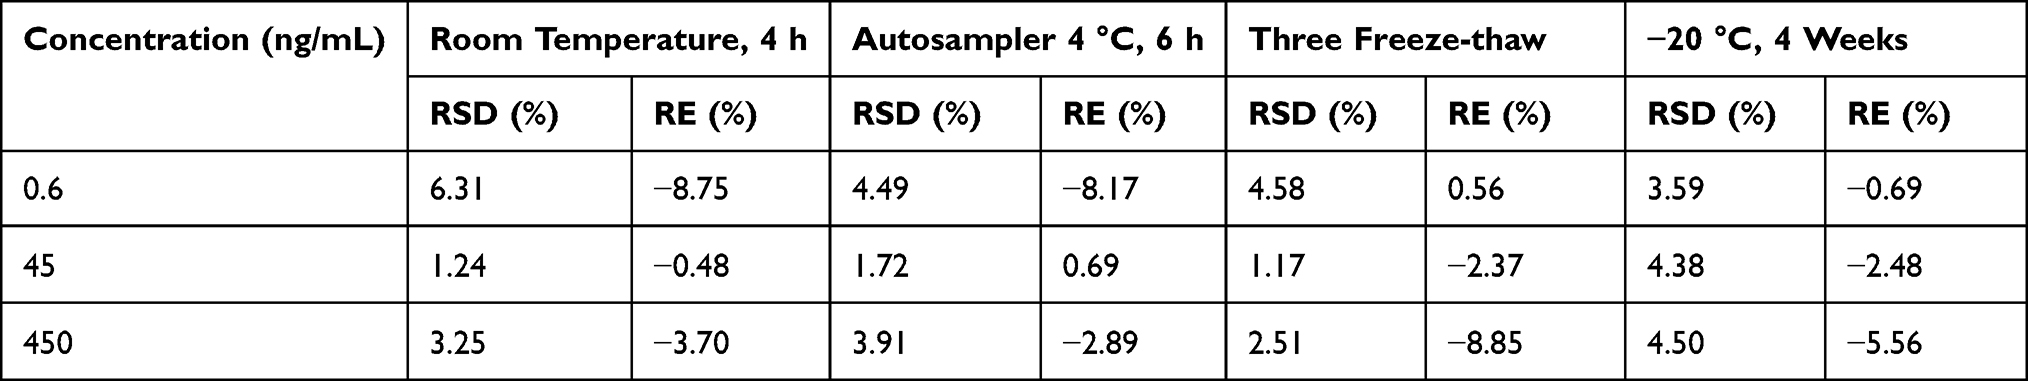 |
Table 3 Stability of per in Rat Plasma Under Various Storage Conditions (n = 6) |
Effect of ESL on the Pharmacokinetics of per
The mean concentration-time curves of the experimental and control groups are shown in Figure 3. The pharmacokinetic parameters of PER in the two groups are shown in Table 4. The results showed that AUC0→t, AUC0→∞, and Cmax of PER decreased by 30.28%, 30.34%, and 46.94%, respectively, while CL increased by 42.74% when PER was used in combination with ESL compared to PER alone. The significant changes in the pharmacokinetic parameters indicated that ESL obviously induced the metabolism of PER in rats.
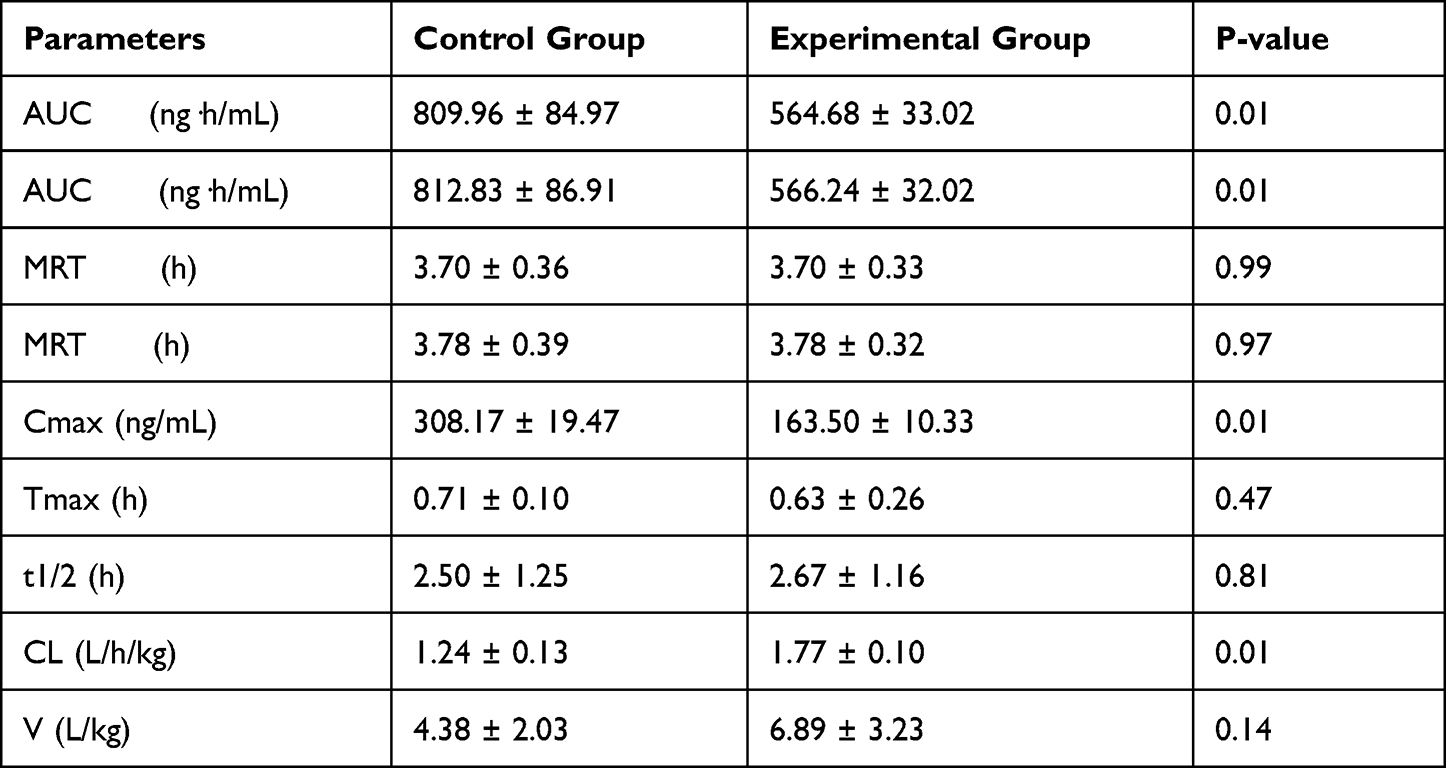 |
Table 4 Pharmacokinetic Parameters of per with or Without ESL |
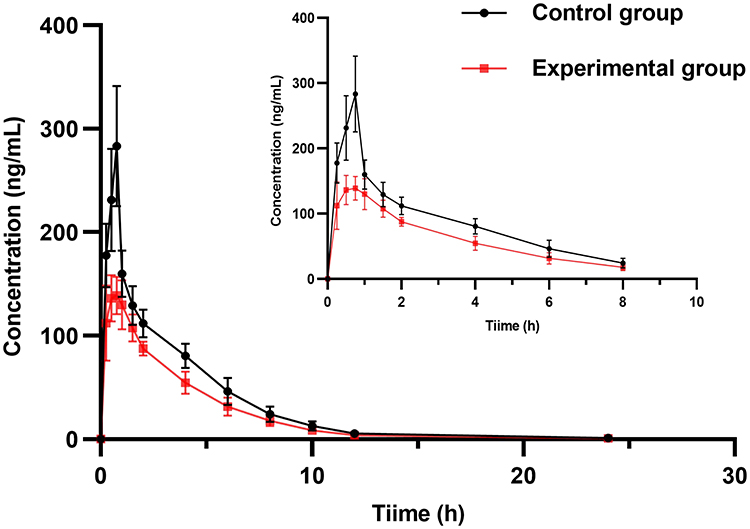 |
Figure 3 Plasma concentration-time curves of PER after oral PER alone and combined with ESL, respectively. |
Discussion
Based on previous studies, a new assay was developed.20–23 We selected m/z transitions of 350.2 → 219.2 and 355.3 → 220.0 for PER and PER-d5, respectively, to obtain the best peak intensity. The other parameters of mass spectrometry were optimized to improve the reproducibility of analytes. Since PER-d5 and PER have similar physicochemical properties and chromatographic behavior, the use of stable isotopes as IS can improve the sensitivity and stability of the method by reducing the matrix effect. After trying different volumes and types of extractants, 150 µL ethyl acetate effectuated a high extraction yield, which could purify and enrich the analytes in 40 µL of rat plasma, suitable for small sample aliquots. The optimized mobile phase and gradient elution procedures can reduce the interference of endogenous substances in the plasma to improve the peak shape and obtain the best peak resolution.
ESL is derived from traditional dibenzodiazepine AEDs (carbamazepine and oxcarbazepine) by altering the substituents at 10.11-position on the dibenzazepine nucleus bearing the 5-carboxamide substitute.16,25,26 This change in the chemical structure leads to metabolic differences and enzyme-induced changes in vivo.16,25,27 Compared to carbamazepine, ESL reduces the incidence of dizziness and sleepiness because it does not produce the toxic metabolite carbamazepine-10,11-epoxide.16,25 Moreover, ESL reduced the dose of administration compared to oxcarbazepine because ESL is stereoselectively metabolized to the active metabolite (S)-licazepine (94%).16,25 Also, it has a lower risk of enzyme-induced drug interactions than carbamazepine and oxcarbazepine.16,25 However, the weak induction of CYP3A4 by ESL can significantly reduce the statins exposure by approximately 50%, thus influencing the effect of lowered blood lipids.28
Accumulating evidence indicated that the combination of PER with other AEDs in the treatment of epilepsy significantly reduces seizures.29 In a post-hoc analysis of three phase-III clinical trials, Gidal et al demonstrated that treatment responses were higher at PER doses of 8 and 12 mg/day in patients who did not receive an antiepileptic agent with CYP3A4 inducers.12 In patients receiving enzyme-inducer antiepileptic drugs (EIAEDs), PER plasma concentrations are decreased; hence, a high PER dose may be required to achieve the same efficacy.12 Since carbamazepine, oxcarbazepine, or phenytoin can significantly reduce exposure to PER, FDA recommends increasing the initial dose of PER and shortening the titration period when PER is used in combination with EIAEDs.9,30 The starting dose of PER was increased from 2–4 mg, and the titration frequency was shortened from 2 mg every two weeks to 2 mg every week.9,30 The maintenance dose of PER was determined according to the patient’s clinical response and tolerability.9,30 EMA recommends that patients receive a 2 mg increase or a 2 mg decrease in the dose of PER when the concomitant inducer and non-inducer AEDs are switched among each other.10 When EIAED is removed from the prescription, the dose of PER should be adjusted accordingly to prevent adverse events caused by its high concentrations in the plasma.10
ESL and PER are two AEDs with different mechanisms of action that can produce synergistic pharmacodynamic effects in combination. The current results showed that ESL significantly enhances the oral clearance rate of PER and reduces the plasma exposure of PER in rats. Thus, increasing the dose of PER when combined with ESL is recommended. When ESL is withdrawn from the treatment regimen, the dose of PER should be appropriately reduced to prevent adverse events caused by the sudden increase in the plasma concentration of PER. This preclinical study provides a reference for the rational use of PER in clinical practice. The effect of ESL on the pharmacokinetics of PER needs further clinical study.
Conclusion
In this study, we developed and validated an isotope dilutions UHPLC-MS/MS method to determine the plasma concentrations of PER in SD rats. The applicability of this method was confirmed in drug interaction studies between PER and the inducer ESL. Consequently, ESL significantly reduces the plasma exposure to PER, rendering it necessary to adjust the dose of PER when combined with ESL.
Acknowledgments
This study did not receive specific grants from funding agencies in the public, commercial, or not-for-profit sectors.
Disclosure
The authors report no conflicts of interest in this study.
References
1. Thijs RD, Surges R, O’Brien TJ, Sander JW. Epilepsy in adults. Lancet. 2019;393(10172):689–701. doi:10.1016/S0140-6736(18)32596-0
2. Löscher W, Potschka H, Sisodiya SM, Vezzani A. Drug resistance in epilepsy: clinical impact, potential mechanisms, and new innovative treatment options. Pharmacol Rev. 2020;72(3):606–638. doi:10.1124/pr.120.019539
3. Kwan P, Arzimanoglou A, Berg AT, et al. Definition of drug resistant epilepsy: consensus proposal by the ad hoc task force of the ILAE commission on therapeutic strategies. Epilepsia. 2010;51(6):1069–1077. doi:10.1111/j.1528-1167.2009.02397.x
4. Lerche H. Drug-resistant epilepsy - time to target mechanisms. Nat Rev Neurol. 2020;16(11):595–596. doi:10.1038/s41582-020-00419-y
5. Solli E, Colwell NA, Say I, et al. Deciphering the surgical treatment gap for drug‐resistant epilepsy (DRE): a literature review. Epilepsia. 2020;61(7):1352–1364. doi:10.1111/epi.16572
6. Chen Z, Brodie MJ, Kwan P. What has been the impact of new drug treatments on epilepsy? Curr Opin Neurol. 2020;33(2):185–190. doi:10.1097/WCO.0000000000000803
7. Kanner AM, Ashman E, Gloss D, et al. Practice guideline update summary: efficacy and tolerability of the new antiepileptic drugs II: treatment-resistant epilepsy. Neurology. 2018;91(2):82–90. doi:10.1212/WNL.0000000000005756
8. Yuan CL, Shi EY, Srinivasan J, Ptak CP, Oswald RE, Nowak LM. Modulation of AMPA receptor gating by the anticonvulsant drug, perampanel. Acs Med Chem Lett. 2019;10(3):237–242. doi:10.1021/acsmedchemlett.8b00322
9. US Food and Drug Administration. FYCOMPA®(perampanel): highlights of prescribing information; 2022. Available from: https://www.accessdata.fda.gov/drugsatfda_docs/label/2019/202834s016,208277s004lblpdf.
10. European Medicines Agency. FYCOMPA®(perampanel): summary of product characteristics; 2022. Available from: https://www.ema.europa.eu/en/documents/product-information/fycompa-epar-product-information_en.pdf.
11. Patsalos PN. The clinical pharmacology profile of the new antiepileptic drug perampanel: a novel noncompetitive AMPA receptor antagonist. Epilepsia. 2015;56(1):12–27. doi:10.1111/epi.12865
12. Gidal BE, Laurenza A, Hussein Z, et al. Perampanel efficacy and tolerability with enzyme-inducing AEDs in patients with epilepsy. Neurology. 2015;84(19):1972–1980. doi:10.1212/WNL.0000000000001558
13. Patsalos PN. Drug interactions with the newer antiepileptic drugs (AEDs)—Part 1: pharmacokinetic and pharmacodynamic interactions between AEDs. Clin Pharmacokinet. 2013;52(11):927–966. doi:10.1007/s40262-013-0087-0
14. Hebeisen S, Pires N, Loureiro AI, et al. Eslicarbazepine and the enhancement of slow inactivation of voltage-gated sodium channels: a comparison with carbamazepine, oxcarbazepine and lacosamide. Neuropharmacology. 2015;89:122–135. doi:10.1016/j.neuropharm.2014.09.008
15. US Food and Drug Administration. APTIOM®(eslicarbazepine acetate): highlights of prescribing information; 2022. Available from: https://www.accessdata.fda.gov/drugsatfda_docs/label/2019/022416s011lbl.pdf.
16. Bialer M, Soares-da-Silva P. Pharmacokinetics and drug interactions of eslicarbazepine acetate. Epilepsia. 2012;53(6):935–946. doi:10.1111/j.1528-1167.2012.03519.x
17. Abou-Khalil B. Selecting rational drug combinations in epilepsy. Cns Drugs. 2017;31(10):835–844. doi:10.1007/s40263-017-0471-7
18. Verrotti A, Lattanzi S, Brigo F, Zaccara G. Pharmacodynamic interactions of antiepileptic drugs: from bench to clinical practice. Epilepsy Behav. 2020;104:106939. doi:10.1016/j.yebeh.2020.106939
19. Johannessen SI, Landmark CJ. Antiepileptic drug interactions - principles and clinical implications. Curr Neuropharmacol. 2010;8(3):254–267. doi:10.2174/157015910792246254
20. Mano Y, Takenaka O, Kusano K. High-performance liquid chromatography–tandem mass spectrometry method for the determination of perampanel, a novel α-amino-3-hydroxy-5-methyl-4-isoxazolepropionic acid receptor antagonist in human plasma. J Pharmaceut Biomed. 2015;107:56–62. doi:10.1016/j.jpba.2014.12.018
21. de Grazia U, D’Urso A, Ranzato F, et al. A liquid chromatography-mass spectrometry assay for determination of perampanel and concomitant antiepileptic drugs in the plasma of patients with epilepsy compared with a fluorescent HPLC assay. Ther Drug Monit. 2018;40(4):477–485. doi:10.1097/FTD.0000000000000531
22. Paul D, Allakonda L, Sahu A, Surendran S, Satheeshkumar N. Pharmacokinetics and brain uptake study of novel AMPA receptor antagonist perampanel in SD rats using a validated UHPLC-QTOF-MS method. J Pharmaceut Biomed. 2018;149:234–241. doi:10.1016/j.jpba.2017.11.008
23. Kim DY, Moon J, Shin YW, et al. Usefulness of saliva for perampanel therapeutic drug monitoring. Epilepsia. 2020;61(6):1120–1128. doi:10.1111/epi.16513
24. US Food and Drug Administration. Guidance for industry: bioanalytical method validation; 2018. Available from: https://www.fda.gov/media/70858/download.
25. Lawthom C, Peltola J, McMurray R, Dodd E, Villanueva V Dibenzazepine agents in epilepsy: how does eslicarbazepine acetate differ? Neurology and Therapy. 2018;7(2):195–206. doi:10.1007/s40120-018-0111-2.
26. Gierbolini J, Giarratano M, Benbadis SR. Carbamazepine-related antiepileptic drugs for the treatment of epilepsy - a comparative review. Expert Opin Pharmaco. 2016;17(7):885–888. doi:10.1517/14656566.2016.1168399
27. Zhang C, Zuo Z, Kwan P, Baum L. In vitro transport profile of carbamazepine, oxcarbazepine, eslicarbazepine acetate, and their active metabolites by human P-glycoprotein. Epilepsia. 2011;52(10):1894–1904. doi:10.1111/j.1528-1167.2011.03140.x
28. Patsalos PN. Drug Interactions with the Newer Antiepileptic Drugs (AEDs)—Part 2: pharmacokinetic and pharmacodynamic interactions between AEDs and drugs used to treat non-epilepsy disorders. Clin Pharmacokinet. 2013;52(12):1045–1061. doi:10.1007/s40262-013-0088-z
29. Hsu WWQ, Sing CW, He Y, Worsley AJ, Wong ICK, Chan EW. Systematic review and meta-analysis of the efficacy and safety of perampanel in the treatment of partial-onset epilepsy. Cns Drugs. 2013;27(10):817–827. doi:10.1007/s40263-013-0091-9
30. de Biase S, Gigli GL, Nilo A, Romano G, Valente M. Pharmacokinetic and pharmacodynamic considerations for the clinical efficacy of perampanel in focal onset seizures. Expert Opin Drug Metab Toxicol. 2019;15(2):93–102. doi:10.1080/17425255.2019.1560420
 © 2022 The Author(s). This work is published and licensed by Dove Medical Press Limited. The full terms of this license are available at https://www.dovepress.com/terms.php and incorporate the Creative Commons Attribution - Non Commercial (unported, v3.0) License.
By accessing the work you hereby accept the Terms. Non-commercial uses of the work are permitted without any further permission from Dove Medical Press Limited, provided the work is properly attributed. For permission for commercial use of this work, please see paragraphs 4.2 and 5 of our Terms.
© 2022 The Author(s). This work is published and licensed by Dove Medical Press Limited. The full terms of this license are available at https://www.dovepress.com/terms.php and incorporate the Creative Commons Attribution - Non Commercial (unported, v3.0) License.
By accessing the work you hereby accept the Terms. Non-commercial uses of the work are permitted without any further permission from Dove Medical Press Limited, provided the work is properly attributed. For permission for commercial use of this work, please see paragraphs 4.2 and 5 of our Terms.