")
Back to Journals » Medical Devices: Evidence and Research » Volume 14
Evaluation of the Accuracy of a Video and AI Solution to Measure Lower Leg and Foot Volume
Authors Chausiaux O , Williams G, Nieznański M, Bagdu A, Downer P , Keyser M, Husheer S
Received 22 December 2020
Accepted for publication 16 February 2021
Published 13 April 2021 Volume 2021:14 Pages 105—118
DOI https://doi.org/10.2147/MDER.S297713
Checked for plagiarism Yes
Review by Single anonymous peer review
Peer reviewer comments 3
Editor who approved publication: Dr Scott Fraser
Oriane Chausiaux,1 Gareth Williams,1 Michał Nieznański,1 Adem Bagdu,2 Philip Downer,1 Melanie Keyser,1 Shamus Husheer1
1Heartfelt Technologies Ltd, Cambridge, UK; 2Warwick Medical School, University of Warwick, Coventry, UK
Correspondence: Oriane Chausiaux Email [email protected]
Background and Objectives: Peripheral edema, change in foot volume, is a marker of congestion which is regularly assessed in routine clinical care. A novel video and Artificial Intelligence (AI)-based solution used to measure anatomical parameters, including volume and foot length, Heartfelt HF-1, is compared to the laboratory gold standard (water displacement) and a medical disposable measuring tape.
Design, Setting, Participants, and Measurements: 58 healthy volunteers were measured with the Heartfelt device; 22 were also measured with the water displacement method and 19 with the medical tape. Bland–Altman analysis was performed for both volumes and foot lengths. Left/right foot differences provided covariance-corrected standard error of measurement (ccSEM) and minimum detectable difference (MDD) for each measurement method.
Results: Heartfelt device measured volumes displayed excellent correlation to the gold standard (water displacement), with Bland–Altman bias of +32mL ± 81mL (1 std.dev). Clinically important change in foot volume is approximately 13%. Water displacement yielded ccSEM of ± 32.1mL and MDD of 90mL (6.7% of average foot volume), while the Heartfelt device measurements yielded ccSEM of ± 12.6mL and MDD of 35.3mL (2.6% of average foot volume). The majority of differences were attributable to manual positioning of the patient foot in the waterbath.
Conclusion: This study finds that in clinical and non-clinical settings, the Heartfelt device measures foot volume and length more precisely than either the water displacement technique or manual foot length measurements using a medical disposable tape, while having an excellent agreement with these methods.
Keywords: AI, peripheral edema, congestion, -medical device, heart failure, lymphedema, renal disease
Introduction
Importance of Foot Volume Evaluation
Peripheral edema is a common presentation in clinical practice and can be a useful marker of congestion, which could eventually result in significant cardiac overload. As such, its evaluation is often part of the clinical examination for several medical conditions1 such as chronic venous insufficiency,2 lymphedema,3 pre-eclampsia,4 cardiac5 and renal6 diseases as well as acute trauma.7 The monitoring of peripheral edema can be used to inform clinical decisions and should be accurate, reliable and convenient for users to reduce barriers to adoption.
Current Methods for Foot Volume Evaluation
Clinical Practice
Healthcare professionals do not currently have a method which is both quick and reliable for measuring peripheral edema. Some use a medical tape to measure ankle circumference8,9 while others use pitting.10 Both of these techniques suffer from significant intra- and inter-operator variations11 and require a healthcare professional to take the measurements, which significantly limits their utility as a means of monitoring the development of edema over longer periods, for example, in the patient’s home.
Additionally, clinicians often report that the fluid accumulation may move from one part of the lower limb to another area, which could partially explain the inaccuracies of methods looking at a single point on the limb such as pitting or measuring ankle circumference.
All of these issues with pitting and other clinical methods explain why body weight is usually recommended as a proxy measurement, even if this measure can be biased by confounding factors12,13 such as changes in diet,12 activity13 and medication use.13
Research Settings
In contrast, the measurement of limb volume using water displacement,14 based on the Archimedes principle, offers the ability to measure the total foot volume and thus edema. Water displacement techniques are mostly used in academic settings where time constraints are not a significant barrier, unlike in a healthcare setting.
Water displacement volumetry is considered to be the gold standard for volume measurement15 as it has been shown to be both accurate and sensitive.8,11,16 However, it is a slow process (25 minutes per foot), as well as relatively impractical because the cleaning of the equipment between patients makes the process cumbersome in clinical settings.8,17 Moreover, it is unsuitable for patients with open wounds on their leg/foot. Most chronic conditions for which peripheral edema measurements could be used to monitor congestion would require these measurements to be taken on a regular basis (several times a week, ideally daily).18
The accurate measurement of volume changes between measurements is also strongly reliant on the same amount of foot and ankle being placed in the waterbath each time. Rabe et al19 provide a comprehensive summary of the contributing error sources in water displacement leg volumetry, demonstrating the significant training and operational complexity required to obtain high-quality volume measurements by water displacement.
Due to the cumbersome nature of the water displacement method,20,21 there have been several alternative methods devised to measure foot volume. For example, Mayrovitz et al21 demonstrate a good correlation between water displacement measurement of foot volume and the output of a mathematical formula based on a series of 6 lines and 14 distances marked on the foot, which although complex for nursing staff to measure and calculate does imply that anatomical modeling of the foot may be a useful approach if it could be sufficiently automated.
Hayn et al22 apply 3D imaging as a method to partially automate such an estimate from a series of distance measures; however, it does not appear that this work has led to a commercially available product, providing a proof of concept but no change in clinical availability of measuring techniques. A more direct optical approach is taken by the Perometer (Perometer, Pero-System Messgeraete GmbH, Wuppertal, Germany $30,000), a device that automatically measures the circumference (or, more correctly, the circumference of the convex hull) of an object repeatedly as it is passed through a square frame containing light-emitting diodes and photodiodes. Unfortunately, this method is not able to measure the volume of the foot itself, and only yields measurements of the lower leg and ankle; this can miss edema as the degree of edema may differ at the calf, ankle and foot.23 Reza et al24 appear to show “excellent” intra- and inter-operator measurement statistics for the Perometer method, however reprocessing of the supplemental data for that work to focus on left/right foot differences demonstrates that errors of over 20% can apparently be made by operators of the device without being evident in the chosen statistical analysis used in the publication (2nd patient, right foot, 4th operator). Similar errors are observed on the same patient and foot for other operators (increased variability for operators 3 and 5), suggesting an instrumental rather than operator issue, and also occur for other patients (9th patient, right foot, operators 4 and 5). This suggests that ~10% of feet measured may contain significant errors even with highly experienced operators under clinical research conditions.
Mestre et al25 report the use of an off-the-shelf laser scanning system to measure peripheral edema by 3D reconstruction, demonstrating good intra- and inter-operator agreement. The main barriers to use are the cost of the scanners used (Creaform Inc, Lévis, Quebec, Canada, $50,000) and the need for a large plexiglass structure to hold the patient and calibration artifacts in place during measurement. The use of Poisson reconstruction in that work also means that the entire surface area of the leg must be measured without any significant gaps by the laser scanner, which can require difficult-to-obtain viewpoints, in contrast to the present study where a deformable anatomical model can fill in any gaps in the observed 3D images (eg, between toes) using anatomically reasonable interpolation. It is therefore clear that, despite an array of alternative technologies to water displacement being available, an improved and low-cost method of foot volume measurement would be a welcome addition to the existing options.
New Method to Measure Foot Volume
The new method investigated (Heartfelt Device HF-1, Heartfelt Technologies Ltd, Cambridge, UK) in this study is based on a patented 3D camera set up to measure the lower leg/foot, which is fast, non-contact and more suited to a clinical setting. However, it is currently unclear how it compares with the gold standard of water displacement. The device is a class I medical device with measuring function.26 Because this approach is based on computer vision methods, it will be possible to automatically recognize the presence of the patient in their own home, collect the relevant edema data, and submit this to a centralized monitoring service, all without direct patient or clinician interaction.
If the present technique is shown to be sensitive and accurate, then it represents a promising solution for home use for those patients who only occasionally report symptoms and weight changes.
Study Objectives
The objective of this study is to compare the water displacement method and the Heartfelt device to measure the volumes of participants’ feet, as well as to compare a CE-marked disposable measuring tape and the Heartfelt device to measure foot length. The aim is to demonstrate that both foot volume and length are accurately measured by the Heartfelt device. The present study is not aimed at quantifying edema in patients. Data collection was only performed using healthy volunteers and did not collect data on change in foot size over time, so although a range of foot sizes were measured, it is impossible to conclude from the present study design anything about the applicability of this device to edema collection. Indeed, the potential for foot length to be used as a correction for baseline patient foot-size in a future edema monitoring method is the motivating reason for the evaluation of foot length in the present work.
The device used in this study was developed and evaluated under clinical conditions in order to demonstrate the possibility of non-contact optical measurement of foot volume and length. The present (Heartfelt HF-1) device is therefore not cost-optimized but is still an order of magnitude cheaper than the devices presented by Reza24 or Mestre25 at $2500/unit plus an external PC for data processing. Similar to those methods, the present device requires non-trivial operator training and involvement (positioning of the patient at each orientation, selecting images to process, and guiding the AI that performs segmentation and anatomical modeling). Subsequent to the present study, later generations of the system have been developed for in-home use that are lower-cost, do not require the patient to orient their feet in any particular way, and require no operator; these later devices are currently undergoing clinical trials (eg, HF-3 devices used in NCT04072744).
Materials and Methods
Participants
This study was conducted in accordance with the Declaration of Helsinki, and based on 58 participants, all of whom gave written informed consent. Of these, 30 were healthy volunteers who took part in a clinical trial which was then underway (NCT02993601, note that this protocol was part of the clinical trial approval, West Midlands-South Birmingham Research Ethics Committee, NHS, Health Research Authority, UK, REC ref 16/WM/0522), 22 were volunteers from an office setting and 6 from a professional cardiology conference;22 the last two groups were enrolled as part of post-market surveillance activities. There was variation in the age, gender and ethnicity of included participants, even though we did not intend to recruit a specific representation of each.
Given the heterogeneous settings, not all participants contributed to all of the measurements. All participants provided data with the Heartfelt device, 22 contributed to the dataset with the water displacement method and 19 to the tape measure foot length data set.
Where multiple measurements were made on any particular subject, measurements were carried out sequentially from the water displacement method (if measured), then foot length (if measured) and finally the Heartfelt device.
Water Displacement Volume Measurement
Using a CE-marked waterbath (Water Gauge, Heartfelt Technologies Ltd.) with a water spout at 179mm from the bottom and a set of calibrated weighing scales (Adam Equipment) to weigh the displaced water; participants’ feet were measured by a research scientist. A total of 44 measurements (left+right foot from 22 subjects) were taken using this method.
The waterbath was filled with water at 22–27°C until water emptied out of the spout, which was allowed to settle for around 3 minutes. An empty plastic container was weighed on the scale and tared. The empty plastic container was then placed beneath the spout. Any displacement of water in the bath by the participant was emptied out into the plastic container through the spout. This water was then weighed to give its mass which could be converted to volume using the density of water (1Kg per 1000mL, the temperature of water has a negligible effect at room temperature27).
The participant lowered their foot slowly into the bath until they reached the bottom. The participant was requested to rest their heel on the plate near the back of the bath and to form a right angle between the lower and upper parts of their leg (see Figure 1). This ensured that the position was consistent between participants. After the water settled, the plastic container was weighed to determine the mass of accumulated water.
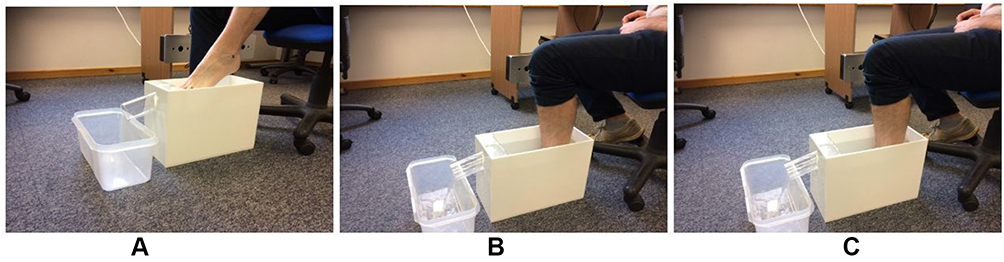 |
Figure 1 Use of the Water Gauge (Heartfelt Technologies Ltd.), including setup and equilibration (A), positioning of the foot and leg to get a right angle between the calf and the thigh (B) and equilibration (C). |
The water line was marked on the participants’ leg with a waterproof makeup pencil, this was so that the volume of foot was measured by the Heartfelt device up to the same height on the leg.
The method was then repeated for the other foot. The total measurement time was roughly 25 minutes per foot, but highly participant-dependent.
Length Measurements
The foot length was measured next. The foot length was measured using a disposable measuring tape. The total measurement time was roughly 30 seconds per foot.
Heartfelt Device Measurements
The Heartfelt device (Heartfelt device HF-1, Heartfelt Technologies Ltd.), as seen in Figure 2, was used to measure participants’ foot/lower leg volume and the length of the foot. The participants stood directly in front of the device and rotated clockwise in increments of 45° from 0° to 315°.
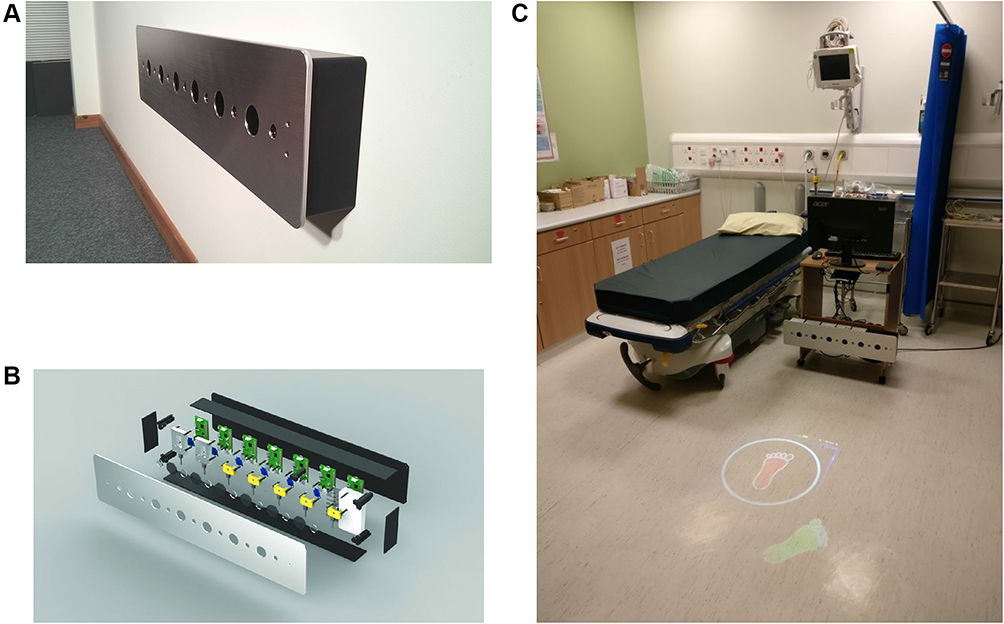 |
Figure 2 Heartfelt device (Heartfelt device HF-1, Heartfelt Technologies Ltd.), installed on the wall (A), design illustration to show internal structure (B), and setup examples for use in hospitals with a projected pattern on the floor to indicate where the patient should stand (C). |
At each rotation, a row of 7 digital cameras (A,B,C,D,E,F,G, each a Raspberry Pi Camera V2, Raspberry Pi Foundation,28 containing a Sony IMX219 8-megapixel sensor) was simultaneously triggered, once under ambient lighting, and immediately thereafter with a pseudorandom RGB pattern projected using a digital light projector (Gigabyte BRIX GB-BXPi3-4010 ProjectorPC). The camera images were saved to the disk and later processed as three sets of trinocular views, using cameras ABC, CDE, EFG. Each trinocular view was processed using the OpenCV29 implementation of SGBM,30 each camera having previously been calibrated using the OpenCV stereo calibration methods. This yielded three sets of 3D point-clouds at slightly different views around the foot, for each 45° rotation of the foot. Standardization of the position of the foot was enforced for this study, but this will not be a requirement in the future.
The 3D point-clouds were manually segmented using an in-house developed human-guided AI image segmentation tool, to yield three sets of foot-pixel point clouds, as well as floor-plane and initial estimates of keypoints at the knee, ankle, big-toe and little-toe locations for pose estimation.
The eight sets of three point-clouds of foot-pixels, floor-planes and keypoint annotations were then imported into Blender.31 A programmatically adjustable anatomical model of a human was also imported, using ManuelbastioniLAB.32 A second in-house developed AI tool was then used to match the observed 3D data to the model, by iteratively adjusting the location and rotation of the camera with respect to the foot, as well as the ankle bone rotation, and various parameters of the anatomical model (foot length, width, body mass, etc.), using silhouette, interactive-closest-point and raycasting methods to determine the quality of match.33
The numerical fitting procedure allowed the pose (location, orientation, bone angle rotations) to vary for each of the 45° rotations of the subject but was fixed between trinocular views of a single foot position (as these were simultaneously captured). The anatomical model parameters were kept the same for all trinocular views of a single foot; however, these were unconstrained between left/right feet of the same subject.
Following this fitting procedure, the residual distances from the model to the observed data for each foot were accumulated for each vertex in the model, and Independent Components Analysis was used across all feet of all participants to extract the top 8 features by which the participants’ feet systematically did not match the anatomical model. Left and right feet were combined by taking the mirror image, halving the number of model vertices to be determined. The anatomical model was then updated with these 8 features, and a further round of fitting of all participant data was performed. This process enables the anatomical model to become more expressive and thus provide a better fit to observed data, without knowing ground-truth features of the foot such as volume, length, etc. Therefore, this process does not require a training and validation split of participant data.
Once the numerical fitting converged, the anatomical model was placed into the default pose (standing upright on the floor plane) and intersected with a cube of known dimensions, to yield an amputated model of the foot of interest (left or right) from the floor up to a predetermined height. The volume of this amputated model was then calculated and reported in mL as the output of the fitting process, along with various statistics such as root-mean-squared distance of 3D pixels from the anatomical model surface. Typical RMS error was 2.5mm, resulting both from 3D imaging noise, and the imperfect match between a simplified anatomical model and the reality of participants’ feet. The length of the foot was also reported in mm, being the distance between two vertices of the model at the extreme locations of the heel and tip of the big toe, projected along the heel-to-toe midline sagittal axis of the foot as seen in Figure 3.
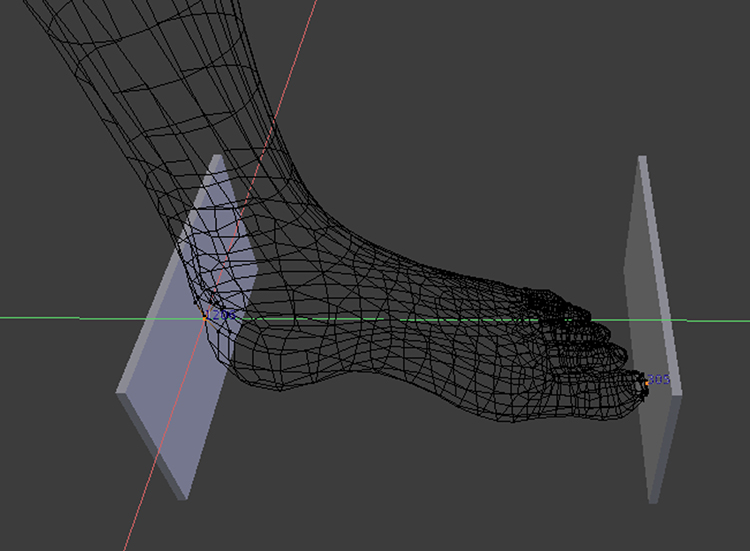 |
Figure 3 Location of the two vertices of the model at the extreme locations of the heel and tip of the big toe, projected along the heel-to-toe midline sagittal axis of the foot (green line), used to measure foot length. This is equivalent to measurement between two planar surfaces, as used in a conventional foot sizer. |
This entire fitting process was repeated 10 times for each set of data, randomly sub-sampling the observed 3D points each time, to provide a distribution of estimates for each fitted parameter and resulting output measurements. This random sub-sampling also mitigates the possibility of individual erroneous 3D points unduly impacting measurements. It was noticed that the fitted parameter distribution generally correlated with RMS error of replicates, so linear least squares was used across replicates to calculate a noise-reduced value of each parameter estimate, as well as the uncertainty of that parameter estimate, at the minimum observed RMS across the replicates. This was observed to reduce the ccSEM of parameter estimates by around 30% compared to simple averaging across replicates.
The total measurement time was approximately 90 seconds per foot. Operator time in segmenting and annotating images was an additional 45 minutes per foot. Computation time for anatomical fitting (10 replicates per foot) was approximately 1200 single-core CPU minutes per foot (computations were run in parallel on commercially rented virtual cores of Intel Xeon E5-2670 CPUs, at a cost of $0.15 per foot). Future work is, therefore, best aimed at reducing or removing operator time, rather than reducing computational load.
Statistical Analysis
The numerical data from the manual methods (waterbath, disposable measuring tape) are quantities directly measured in milliliters or millimeters, respectively. The output from the Heartfelt device is a 3D anatomical model of a foot, from which volumetric and distance measurements may be produced. For the purposes of comparison between methods, the 3D anatomical model is used to produce the volume in milliliters of the foot up to a predefined height from the floor plane in a standard “upright” pose, while the length of the foot in millimeters is calculated as the distance along the heel-to-toe midline sagittal axis. This allows for direct comparison of the measurements produced by the Heartfelt device with the conventional manual measurement methods.
Correlation Between Methods: Pearson, Bland–Altman Analysis
When comparing two measurement methods, it is common to evaluate the Pearson correlation coefficient between the methods, as well any consistent difference (“bias”) between the methods and the range of differences between the measurements that would be expected due to statistical noise (“limits of agreement”),34 the latter being calculated in the Bland–Altman analysis.35 These measures cannot make any conclusions about which technique is more or less accurate or precise, but they do allow for assessment of the likely clinical relevance of any differences between the measurement methods, as opposed to the clinical state of the subject.
Table 1 provides the resulting Pearson correlation coefficient, bias and limits of agreement from a Bland–Altman analysis, both for foot volume and foot length of the participants for whom manual measurements of these values were obtained.
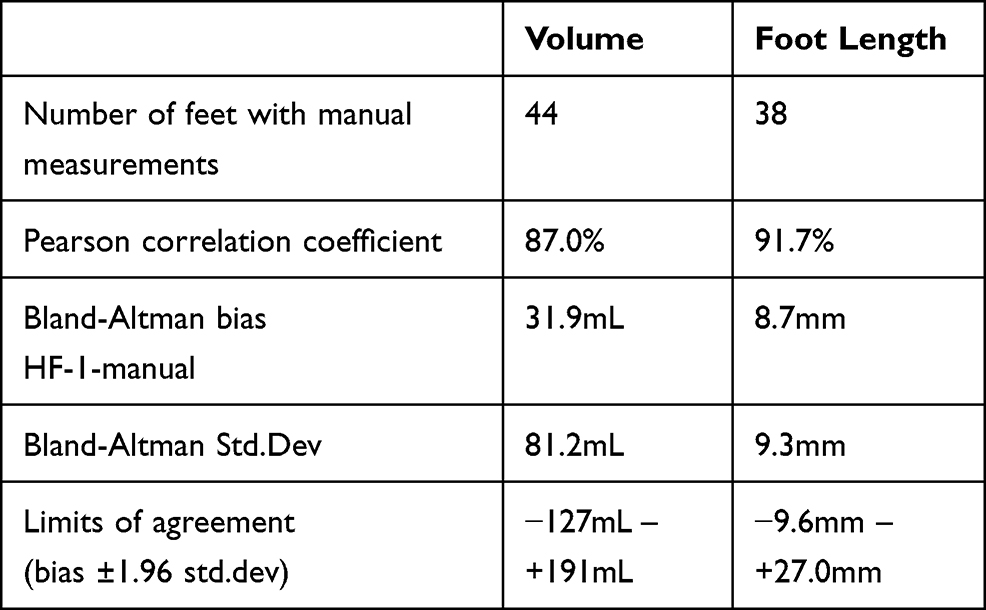 |
Table 1 Assessment of Bias and Limits of Agreement |
Intra-Operator Variability: ICC, SEM Covariance-Corrected SEM, MDD
Any measurement can be considered to have multiple sources of error. It is common to report intra-operator variability for clinical measurements in order to assess whether one measurement method provides better measurement precision in the clinic than another method. When measurements are taken manually, it is standard practice to have the same operator take the same measurement multiple times on the same occasion, from which an Intra-Class Correlation Coefficient (ICC) can be calculated, as well as the Standard Error of Measurement (SEM), from which the Minimum Detectable Difference (MDD) is derived.36
Repeating measurements can, however, be prone to operator expectation bias as the operator knows that the two measurements should be identical and so they may repeat measurements that appear unequal. This effectively censors the collected data and results in an artificially low estimate of intra-operator variability. An alternative is to take a pair of measurements that should be similar, but not necessarily equal, such as left and right foot measurements, and use statistical techniques to disentangle true variability (the covariance between feet) from intra-operator variability (the residual variance). Automatic measurements often have no such psychological bias when performing repeat measurements; however, as our method contains some human steps (positioning the subject, choosing and segmenting images for analysis), it is appropriate to apply exactly the same statistical methods to the Heartfelt device measurements as to the manual measurements.
Although conventional ICC and SEM calculations can be performed on this left/right foot difference data, and are presented in Table 2, the not-insignificant true difference between feet37 leads to substantially worse estimates of precision than if the true left/right differences are taken into account.
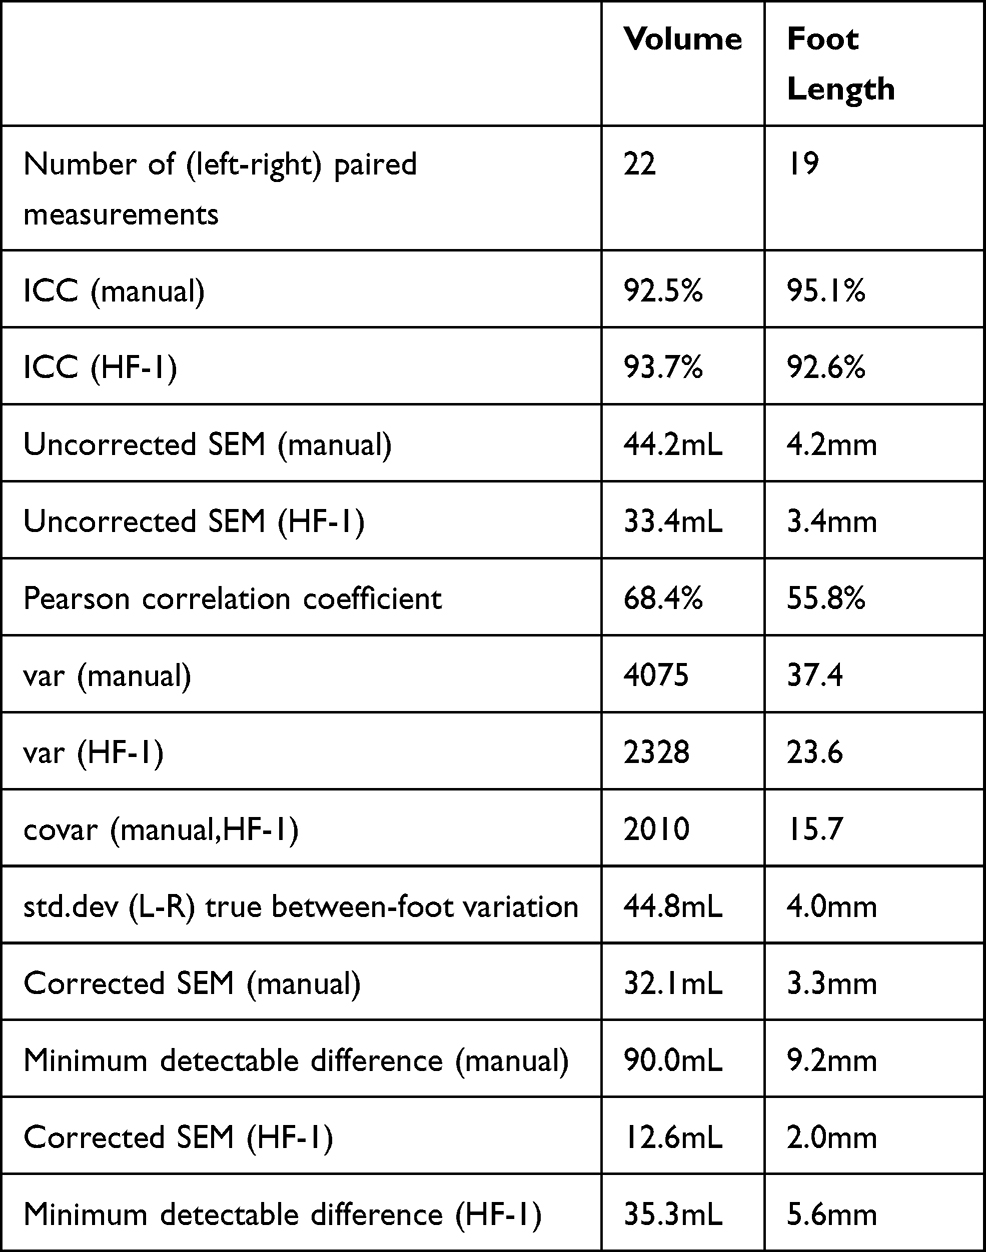 |
Table 2 Variances of the Left-Right Differences, and Calculation of the Underlying Intra-Operator Variability for Each Measure |
The true left/right difference for each subject is assumed to be drawn from an arbitrary random distribution. We assume that the manual measurement adds an independent, mean-zero, normally distributed error to the true distribution of left/right difference, and likewise for the Heartfelt device measurement. We then estimated the magnitude of the true left/right foot variance as the covariance between manual and Heartfelt left/right differences. By application of the rules for sums and differences of random variables, we calculate the independent variance of the manual and Heartfelt device error distributions as being their respective left/right variances less the covariance, which is then divided by two as both the left and right foot measurement variances contribute. The resulting measurement is the covariance-corrected SEM (ccSEM), from which the Minimum Detectable Difference (MDD) is calculated in exactly the same way as for conventional SEM (ie, multiplication by 2.8 assuming a 95% C.I.36). This covariance correction crucially allows the calculation of the standard error of measurement for each technique separately, in the presence of true left/right foot differences, and thus an accurate assessment of which technique has the greater precision without requiring an operator to make replicate measurements.
Figure 4C (Paired Volume Agreement) illustrates that the magnitude of left/right foot volume covariance is a substantial fraction of the observed variance in both manual and Heartfelt device measurements. Failing to take this covariance into account significantly over-estimates the true noise of both techniques. The same approach is taken with foot length measurements; however, due to the coarse granularity of manual foot measurements, left/right covariance between the methods is not as obvious.
 |
Figure 4 (A) Volume agreement as measured using the Waterbath and the Heartfelt device. (B) Bland–Altman plot of volume measurements between Heartfelt and Waterbath. (C) Pair-wise analysis on left-right foot volume difference as measured using the Waterbath and the Heartfelt device. (D) Bland–Altman plot of volume measurements between the paired (Left/Right) volume difference using Heartfelt and Waterbath. In (B and D), the solid line defines bias (average difference), dotted lines define limits of agreement (95% confidence interval). |
Results and Discussions
Volume Measurement Comparison
As seen in Figure 4A, there is broad agreement between the Heartfelt device and the water displacement volume readings, with a Pearson correlation coefficient of 87%. Table 1 summarizes the volumes determined by each method. There is an offset (bias) of +32mL ± 81mL (1 std dev), between the device measurement and the water displacement measurements. When a Bland–Altman analysis is performed,35 the limits of agreement between the volume measurements as determined by the water displacement method and the Heartfelt device are −127mL to +191mL as seen in Figure 4B. However, it is clear that the vast majority of the disagreement between measurement methods is “patient specific,” in that differences in left/right foot measurements (“within patients”) are much less widely spread than differences between patients, which merits further investigation.
A “within patients” analysis can be performed, under the (incorrect) assumption that left and right foot measurements represent repeat measurements of the same true value. The Intraclass Correlation Coefficient (ICC) and Standard Error of Measurement (SEM)37 can be calculated for each measurement method, yielding “Excellent”38 ICC of 92.5% and 93.7%, and SEM of 44mL and 33mL for Waterbath and Heartfelt methods, respectively.
However, as seen in Figure 4C, there was a significant correlation (68%) between the left-right foot volume difference as measured manually, compared to the Heartfelt device. This strongly suggests that a significant portion of the left-right variability observed is true patient-specific differences (ie, covariance, likely due to the dominance of one foot over the other). It also appears that some points may sit outside reasonable limits of agreement between the methods, indicating an erroneous measurement; however, this could also be due to true left/right differences. Therefore, a Bland–Altman type analysis was performed on the left/right differences between methods in Figure 4D, which removes the patient-specific variation and indicates good agreement between the methods with no obviously outlying points.
This variation in pairwise (Left-Right) differences between methods can be more fully analyzed as the covariance-corrected standard error of measurement, where the covariance between the manual and Heartfelt device paired measurements is removed, yielding an underlying corrected-SEM of ± 32.1mL (1 std dev) and MDD of 90.0mL for the water displacement measurements and ± 12.6mL (1 std dev) and MDD of 35.3mL for the Heartfelt device measurement (Table 2).
Figure 4D shows good homogeneity of variance (homoscedasticity), as the variance does not appear to vary as a function of foot-size. Therefore, uncertainty should be expressed in absolute measure (ie, mL) rather than as a relative measure (%), although clinically it is useful to know that the average foot volume in the study was 1350mL, making the minimum detectable difference 6.7% and 2.6% for water displacement and the Heartfelt device measurement, respectively.
The “within patients’’ analysis demonstrates that both methods have significantly better precision than the Bland–Altman standard deviation of Figure 4B, the cause for which should be established. One important factor is that, in the manual waterbath method, volume measurement uncertainty is introduced by the choice of how far along the leg to submerge. Therefore, differences in these choices between feet on one patient, and more importantly between patients who may be positioned very differently, will be a contributing factor to volume uncertainty. The Heartfelt device measurements have no need to include this source of error, as it is possible to measure the volume to exactly the same height in both left and right 3D models. During manual measurement of volume, the operator marked the waterline around the leg, which was then annotated in the image data collected, so it was possible to measure both the height of the waterline (in standard pose) and the angle-to-horizontal of the plane formed by the waterline (which indicates the angle-to-vertical of the leg when submerged). This is plotted in Figure 5, indicating a significant source of manual variation in the measurement. On average, 1mm of change in waterline height corresponds to ~5.5mL of volume change in the anatomical model at nominal 179mm waterbath spout height, so it is also possible to indicate the approximate volume error compared to the measurement at a standard height. The waterline height so measured had a standard deviation of 8.6mm, implying ~47.3mL of additional volume standard deviation, before even quantifying the volume uncertainty caused by angle variation. Moreover, the height of each foot of the same patient showed a 68% Pearson correlation coefficient between them, while the overall Pearson correlation between waterline height and water displacement measured volume was −24%, indicating that the waterline height is highly patient-specific. The expected standard deviation of the difference in measurements between the manual waterbath and Heartfelt device, given the corrected-SEM values, is (32.12 + 12.62)0.5 = 34.5mL. We are therefore confident that manual positioning of the patient foot in the waterbath explains the majority of the difference between the uncertainty observed in Figure 4B and D.
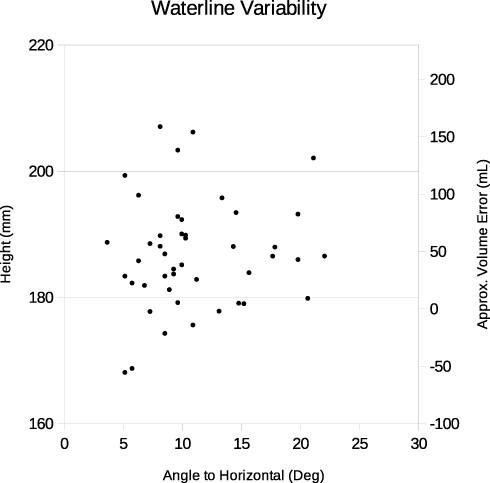 |
Figure 5 Waterline variability in measurements using the Waterbath, including the height of the water line (in standard pose) on the left axis, the implied error in volume measurement compared to a standard height of 179mm on the right axis, and the angle-to-horizontal of the waterline plane (which indicates the angle-to-vertical of the leg when submerged) on the horizontal axis. |
Therefore, when volumes were calculated using the Heartfelt device, multiple volume results were generated: the volume up to the water line marked on the foot (used in Figure 4A and 4B), the volume up to the average water line height across left and right feet (used in Figures 4C and 3D), and volume up to a fixed height of 179mm (the internal height of the waterbath spout).
Length Measurement Comparison
The Heartfelt device was also used to measure foot length and the results were compared to the foot length as measured by the research scientist using a CE-marked measuring tape. This study shows that the Heartfelt device is comparable to the use of a medical tape to take such measurement, with Pearson correlation coefficient of 92%, whilst an offset of 8.7mm ± 9.3mm (1 std dev) was observed, as shown in Figure 6A and Table 1. It is evident from Figure 6A that the vast majority of manual measurements coincide with whole numbers of centimeters, a clear indication of insufficient manual measurement granularity. The Bland–Altman analysis (Figure 6B) of the two methods shows a slight bias to the measurements, which would be expected if manual measurements had been rounded in one direction only, with limits of agreement of −9.6mm to +27.0mm.
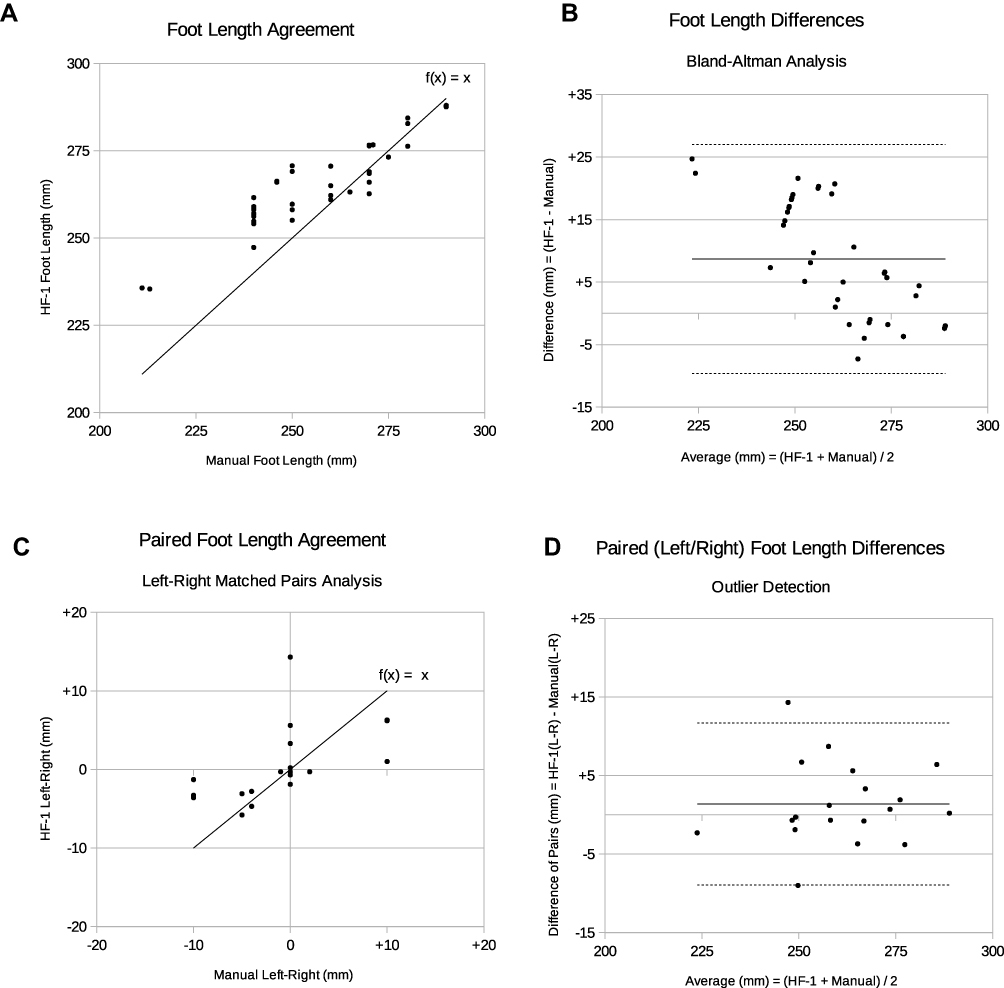 |
Figure 6 (A) Foot length agreement as measured using the measuring tape and the Heartfelt device. (B) Bland–Altman plot of foot length differences between measuring tape and Heartfelt. The solid line defines bias (average difference), dotted lines define limits of agreement (95% confidence interval). (C) Paired foot length agreement (left-right matched paired analysis) using the measuring tape (manual) and the Heartfelt device. (D) Bland–Altman plot of foot length measurements between the paired (left/right) length difference using Heartfelt and the measuring tape. |
The left-right paired analysis of foot length (Figure 6C and D) was performed as for foot volume; however, the covariance between the two methods somewhat reduced. This is likely a result of the rounding of manual measurements to a granularity larger than the true left-right variability. Consequently, the ICC was 95% and 93% (“Excellent”38), with uncorrected SEM of 4.2mm and 3.4mm, for the measuring tape and Heartfelt device, respectively. Covariance correction of SEM was also performed in the same manner as foot volume measurements, resulting in corrected SEM of 3.3mm (1 std dev) and MDD of 9.2mm for the disposable measuring tape, and corrected SEM of 2.0mm (1 std dev) and MDD of 5.6mm using the Heartfelt device (Table 2).
As in the case for foot volume, Figure 6D demonstrates homoscedasticity and so uncertainties should be expressed in mm rather than percentage. However, it provides a sense of magnitude; the average foot length in the study was 265mm, making the minimum detectable difference 3.5% and 2.1% for water displacement and the Heartfelt device measurement, respectively.
Measurement of foot length with a disposable measuring tape was difficult, in particular for those with a protruding back of the foot beyond the heel on the floor, leading to significant scope for parallax error in measurement, with this error likely containing a large patient-specific component. Trying to determine by eye where the foot started and ended gave fair estimations but an MDD of roughly 9.2mm, likely reflecting that many measurements were biased to 10mm increments. An improvement for further studies would be to use a foot sizer as this ensures the foot is always measured from the same point.
Conclusion
Having a robust and straightforward method for assessing foot volume in the field is important for the evaluation of congestion or certain forms of trauma, both in clinical and research settings. While the gold standard procedure is the use of “pitting” in clinical settings and the use of a waterbath or measuring tape (either for ankle circumference or figure of eight) in research settings, these methods are prone to introducing human error in measurements. New methods have been developed for research (Perometer and Creaform); however, neither are particularly practical in a clinical setting. We have developed an AI-based solution that measures foot volume and distances on the foot without contact with the patient.
This study demonstrates that the newly developed Heartfelt device is more precise at measuring foot volume and length than both water displacement measurement and foot length manual measurements using a disposable tape, whilst having “excellent” agreement38 with these standard methods of measurement. This has been demonstrated in this study using the Bland–Altman plot to assess the agreement between methods to demonstrate trends and systematic errors, and intra-class correlation coefficient and (covariance corrected) standard error of measurement to establish measurement precision. The majority of the disagreement between methods was found to be attributable to the manual positioning of the patient foot in the waterbath, an error source that is eliminated with the Heartfelt device.
The clinically relevant magnitude of volume change observed for edema detection in the context of heart failure decompensation, for example, is 13.1%.20 Therefore, the prospect of using this technology in clinical practice is encouraging, in particular as several of the conditions associated with changes in foot volume are chronic conditions which may benefit from long-term monitoring. Application of this technology may also be considered in clinical trials where a non-invasive and objective measurement of foot volume is required. This may be of particular interest if it could be demonstrated that the device was reliable both in clinical settings and in patients’ homes. The capital and running costs of any new technology need to be considered alongside improvements in usability and measurement accuracy; the present technology appears to present a route to a substantial reduction in cost compared to other instrumental methods of foot volume measurement.
Further work is needed before this measurement method can be recommended for use in a clinical context, namely the validation of the device on participants undergoing diuretic therapy for peripheral edema, to ensure that the model would work as well in the presence of edema as it does in healthy volunteers.
Importantly, the device tested here reflects volume changes in all soft tissues (muscle and fat) and not just to edema filtration or reabsorption. It, therefore remains to be shown how this device compares with existing solutions in patients with and without edema, and during change of edema status.
Abbreviations
AI, Artificial Intelligence; ccSEM, covariance-corrected Standard Error of Measurement; CPU, Central Processing Unit; HF-1, Heartfelt device version 1; ICC, Intraclass Correlation Coefficient; MDD, Minimum Detectable Difference; NHS, National Health Service (UK); REC, Research Ethics Committees (UK); RMS, Root Mean Square; SEM, Standard Error of Measurement; Std Dev, Standard Deviation; UK, United Kingdom; $, US dollar.
Acknowledgments
The authors wish to thank Dr Alex Lyon, Prof John Cleland, Sophie Welsh and Toijo Palovaara for supporting with clinical data collection and the organizers of the 9th BSH Heart Failure Day for Revalidation and Training in London (2017) for allowing us to use the device with attendees who volunteered. We would also like to thank the Santander Universities SME Internship programme for funding Adem Bagdu’s time for the project.
Disclosure
Dr Oriane Chausiaux and Dr Shamus Husheer are founder-directors of Heartfelt Technologies Ltd and hold stock in the company, Gareth Williams is a director of Heartfelt Technologies Ltd and holds stock options in the company, and all 3 are employed by the company and are inventors on granted patent GB2576770B. Dr Shamus Husheer is the inventor on granted patent GB2542114B. Michał Nieznański, Philip Downer and Dr Melanie Keyser are employees and option holders in the company. Adem Bagdu was an intern in the company during the project (funded by Santander, through the University of Bath, UK).
Mr Adem Bagdu reports personal fees from Heartfelt Technologies Ltd, during the conduct of the study.
Dr Shamus Husheer reports a patent GB2542114B issued.
The authors report no other potential conflicts of interest in this work.
References
1. InformedHealth.org. Cologne, Germany: Institute for Quality and Efficiency in Health Care (IQWiG); 2006-. Causes and signs of edema. 2008 Nov 5 [Updated 2016 Dec 30].
2. Bush R, Comerota A, Meissner M, et al. Recommendations for the medical management of chronic venous disease: the role of Micronized Purified Flavanoid Fraction (MPFF). Phlebology. 2017;32(1_suppl):3–19. doi:10.1177/0268355517692221
3. Keast DH, Moffatt C, Janmohammad A, et al. Lymphedema impact and prevalence International study: the Canadian data. Lymphat Res Biol. 2019;17(2):178–186. doi:10.1089/lrb.2019.0014
4. Wilkerson RG, Ogunbodede AC. Hypertensive disorders of pregnancy. Emerg Med Clin North Am. 2019;37(2):301–316. doi:10.1016/j.emc.2019.01.008
5. Shoaib A, Mamas MA, Ahmad QS, et al. Characteristics and outcome of acute heart failure patients according to the severity of peripheral oedema. Int J Cardiol. 2019;285:40–46. doi:10.1016/j.ijcard.2019.03.020
6. Soi V, Yee J. Sodium homeostasis in chronic kidney disease. Adv Chronic Kidney Dis. 2017;24(5):325–331. doi:10.1053/j.ackd.2017.08.001
7. Goergen S, Troupis J, et al. Acute ankle trauma in adults. Education modules for appropriate imaging referrals. Royal Austr N Zeal Coll Radiol. 2015.
8. Kaulesar Sukul DM, den Hoed PT, Johannes EJ, et al. Direct and indirect methods for the quantification of leg volume: comparison between water displacement volumetry, the disk model method and the frustum sign model method, using the correlation coefficient and the limits of agreement. J Biomed Eng. 1993;15(6):477–480. doi:10.1016/0141-5425(93)90062-4
9. Mayrovitz HN. Limb volume estimates based on limb elliptical vs. Circular Cross Section Models Lymphology. 2003;36(3):140–143.
10. Raju S, Owen S
11. Brodovicz KG, McNaughton K, et al. Reliability and feasibility of methods to quantitatively assess peripheral edema. Clin Med Res. 2009;1–2:21–31. doi:10.3121/cmr.2009.819
12. Lewin J, Ledwidge M, O’Loughlin C, et al. Clinical deterioration in established heart failure: what is the value of BNP and weight gain in aiding diagnosis? Eur J Heart Fail. 2005;7(6):953–957. doi:10.1016/j.ejheart.2005.06.003
13. Webel AR, Frazier SK, Moser DK, et al. Daily variability in dyspnea, edema and body weight in heart failure patients. Eur J Cardiovasc Nurs. 2007;6(1):60–65. doi:10.1016/j.ejcnurse.2006.04.003
14. Casley-Smith JR. Measuring and representing peripheral oedema and its alterations. Lymphology. 1994;27(2):56–70.
15. Petersen EJ, Irish SM, Lyons CL, et al. Reliability of water volumetry and the figure of eight method on subjects with ankle joint swelling. J Orthop Sports Phys Ther. 1999;29(10):609–615. doi:10.2519/jospt.1999.29.10.609
16. Nilsson S, Haugen GB. Volumetry in the evaluation of swelling in the ankle and foot. J Oslo City Hosp. 1981;31(1):11–15.
17. Stranden E. A comparison between surface measurements and water displacement volumetry for the quantification of leg edema. J Oslo City Hosp. 1981;31(12):153–155.
18. ACC/AHA 2005 Guideline update for the diagnosis and management of chronic heart failure in the adult. doi: 10.1161/CIRCULATIONAHA.105.167586.
19. Rabe E, Stücker M, Ottillinger B, et al. Water displacement leg volumetry in clinical studies–a discussion of error sources. BMC Med Res Methodol. 2010;10:5. doi:10.1186/1471-2288-10-5
20. Brijker F, Heijdra YF, Den Elshout V, et al. Volumetric measurements of peripheral oedema in clinical conditions. Clin Physiol. 2000;20(1):56–61. doi:10.1046/j.1365-2281.2000.00224.x
21. Mayrovitz HN, Sims N, Litwin B, et al. Foot volume estimates based on a geometric algorithm in comparison to water displacement. Lymphology. 2005;38(1):20–27.
22. Hayn D, Fruhwald F, Riedel A, et al. Leg edema quantification for heart failure patients via 3D imaging. Sensors (Basel). 2013;13(8):10584–10598. doi:10.3390/s130810584
23. Hirai M, Iwata, Iwata H, et al. Improvement of a three‐dimensional measurement system for the evaluation of foot edema. Skin Res Technol. 2012;18:120–124. doi:10.1111/j.1600-0846.2011.00527
24. Reza C, Nørregaard S, Moffatt C, et al. Inter-observer and Intra-observer Variability in Volume Measurements of the Lower Extremity Using Perometer. Lymphat Res Biol. 2020;18(5):416–421. doi:10.1089/lrb.2019.0063
25. Mestre S, Veye F, Perez-Martin A, et al. Validation of lower limb segmental volumetry with hand-held, self-positioning three-dimensional laser scanner against water displacement. J Vasc Surg Venous Lymphat Disord. 2014;2(1):39–45. doi:10.1016/j.jvsv.2013.08.002
26. Notified body, BSI Group The Netherlands B.V. NB2797
27. Suda S, Keisch B. Temperature effects and corrections in volume measurements based on liquid-level detection, article, August 1, 1993; UNT Digital Library. Available from: https://digital.library.unt.edu. Accessed February 26, 2021.
28. The Raspberry Pi Foundation. Available from: https://www.raspberrypi.org/.
29. Bradski G. The OpenCV Library. Dr Dobb’s J Software Tools. 2000;120:122–125.
30. Hirschmuller H. Stereo processing by semiglobal matching and mutual information. Pattern Anal Machine Intelligence IEEE Trans. 2008;30(2):328–341. doi:10.1109/TPAMI.2007.1166
31. Community, B. O. Blender - a 3D Modelling and Rendering Package. Amsterdam: Stichting Blender Foundation; 2018. Available from: http://www.blender.org-Version2.79b.
32. Manuel Bastioni. https://www.manuelbastioni.com-Version1.50. Accessed February 26, 2021.
33. Van Rossum G, Drake FL
34. Hanneman SK. Design, analysis, and interpretation of method-comparison studies. AACN Adv Crit Care. 2008;19(2):223–234. doi:10.1097/01.AACN.0000318125.41512.a3
35. Bland JM, Altman DG. Statistical methods for assessing agreement between two methods of clinical measurement. Lancet. 1986;1(8476):307–310. doi:10.1016/S0140-6736(86)90837-8
36. Popović ZB, Thomas JD, et al. Assessing observer variability: a user’s guide. Cardiovasc Diagnosis Ther. 2017;7(3):317–324. doi:10.21037/cdt.2017.03.12
37. Teo I, Thompson J, Neo YN, et al. Lower limb dominance and volume in healthy individuals. Lymphology. 2017;50(4):197–202.
38. Portney LG, Watkins MP. Foundations of Clinical Research: Applications to Practice. Prentice Hall NJ; 2000.
 © 2021 The Author(s). This work is published and licensed by Dove Medical Press Limited. The full terms of this license are available at https://www.dovepress.com/terms.php and incorporate the Creative Commons Attribution - Non Commercial (unported, v3.0) License.
By accessing the work you hereby accept the Terms. Non-commercial uses of the work are permitted without any further permission from Dove Medical Press Limited, provided the work is properly attributed. For permission for commercial use of this work, please see paragraphs 4.2 and 5 of our Terms.
© 2021 The Author(s). This work is published and licensed by Dove Medical Press Limited. The full terms of this license are available at https://www.dovepress.com/terms.php and incorporate the Creative Commons Attribution - Non Commercial (unported, v3.0) License.
By accessing the work you hereby accept the Terms. Non-commercial uses of the work are permitted without any further permission from Dove Medical Press Limited, provided the work is properly attributed. For permission for commercial use of this work, please see paragraphs 4.2 and 5 of our Terms.