")
Back to Journals » Diabetes, Metabolic Syndrome and Obesity » Volume 13
Evaluation of Several Anthropometric and Metabolic Indices as Correlates of Hyperglycemia in Overweight/Obese Adults
Authors Abolhasani M, Maghbouli N , Sazgara F, Karbalai Saleh S , Tahmasebi M, Ashraf H
Received 20 March 2020
Accepted for publication 15 June 2020
Published 2 July 2020 Volume 2020:13 Pages 2327—2336
DOI https://doi.org/10.2147/DMSO.S254741
Checked for plagiarism Yes
Review by Single anonymous peer review
Peer reviewer comments 2
Editor who approved publication: Dr Konstantinos Tziomalos
Maryam Abolhasani,1 Nastaran Maghbouli,2 Faeze Sazgara,3 Shahrokh Karbalai Saleh,4 Maryam Tahmasebi,5 Haleh Ashraf1,4
1Cardiac Primary Prevention Research Center (CPPRC), Tehran Heart Center, Tehran University of Medical Sciences, Tehran, Iran; 2Physical Medicine and Rehabilitation Department, Tehran University of Medical Sciences, Tehran, Iran; 3Department of Radiology, Guilan University of Medical Sciences, Rasht, Guilan, Iran; 4Department of Cardiology, Sina Hospital, Tehran University of Medical Sciences, Tehran, Iran; 5Amir Al Momenin Hospital, Department of Cardiology, Islamic Azad University of Medical Sciences, Tehran, Iran
Correspondence: Haleh Ashraf
Research Development Center,Sina Hospital, Emam Khomeini Street, Tehran 1136746911, Iran
Fax +66348553
Email [email protected]
Aim: Rapid and growing rise in obesity and diabetes mellitus, as serious human health-threatening issues, is alarming. The aim of the present study was assessing the accuracy of several obesity indices to predict hyperglycemia in overweight and obese Iranian populations and determining the value of such indices in comparison to the conventional parameters. We also evaluated new latent combined scores in this matter.
Patients and Methods: Overall, there were 2088 patients recruited from the weight loss clinic of Sina Hospital, an educational hospital of Tehran University of Medical Sciences for this cross-sectional study. Demographic information, anthropometric indices and biochemical measurements were collected and calculated. The multivariable regression modeling as well as area under the receiver-operating characteristic (ROC) analysis was used. To detect the existence of new combined scores, we used SEM (structural equation modeling) analysis through SmartPLS.
Results: Combined latent scores and WHtR (waist-to-height ratio) gave us a higher area under the curve in predicting hyperglycemia associated with WC (waist circumference) in women, whereas FFMI (fat-free mass index) gave low values. Additionally, BRI (body roundness index) and latent scores had slightly higher AUC values in predicting hyperglycemia in men. According to the age-adjusted odds ratio (OR) in the presence of hyperglycemia, OR was the highest for WHR (waist to hip ratio) in women (OR, 7.74; 95% confidence interval [CI], 1.71– 15.13). The association of WHR and hyperglycemia remained significant by adjusting for BMI (body mass index), WC and menopausal status.
Conclusion: WHR had the strongest association with hyperglycemia in women with only sufficient discrimination ability. However, neither BSI (body shape index) and BAI (body adiposity index) nor FMI (fat mass index) and FFMI were superior to BMI (body mass index), WC or WHtR in predicting hyperglycemia. It was revealed that BRI and combined scores had a more predictive power compared to the BSI, BAI, FMI and FFMI, simplifying hyperglycemia evaluation.
Keywords: diabetes mellitus, obesity, anthropometric indices
Introduction
Nowadays, rapid and growing rise in obesity and diabetes mellitus, as a serious human health-threatening issue, are alarming.1–3 A study in the Iranian adult population showed 35.1% increase in diabetes mellitus (DM) prevalence during the seven years of study from 2005 to 2011. Additionally, DM was 20 times more prevalent among morbidly obese individuals.4,5
Present studies showed that the pattern of body fat distribution has a major role in DM development and considerable increasing body of evidence support the role of visceral adiposity tissue in insulin resistance risk and hyperglycemia formation.6–8 Respecting DM is not a completely curable disease and has a heavy burden,9 preventing and prediction of this disease became more necessary.
Most of the previous studies managed to demonstrate a close association between diabetes and body mass index (BMI) and waist circumference (WC), which are commonly considered as the valid measures of obesity. Nevertheless, considering the inability of BMI in differentiating adipose tissue from lean body mass,2,10 its reliability as an indicator of obesity has recently been questioned. BMI together with some other obesity parameters such as body adiposity index and waist-to-height ratio has shown to present poor prognosis of fat mass among young healthy adults since it reflects skeletal muscle mass.7 WC can also predict the status of abdominal adipose tissue. However, whether the range of WC associates to body size remains obscure.2,11 Therefore, it is suggested that other appropriate parameters are applied to present improved indices of obesity. It seems that a combination of traditional anthropometric indices like height, weight, BMI, or WC together with novel parameters would be helpful for us to achieve our goal.
In addition to BMI, WHR (waisttohip ratio), WHtR (waist-to-height ratio) and WC, there are some other new parameters that are defined as adiposity indices. New indices including fat mass index (FMI) are calculated by taking the body fat mass component resulting from bioelectrical impedance analysis, divided by height squared.12 Visceral adiposity index (VAI) and lipid accumulation product (LAP) as lipid over accumulation estimates based on anthropometric and lipid profiles,13,14 body shape index (BSI) based on waist circumference, BMI, and height,15 body roundness index (BRI), composed of height and waist circumferences,16 and body adiposity index (BAI), as the hip circumference to height ratio17 are introduced recently.
The new indices have more complex formulas and it is not known to have more findings than traditional indices. Some studies like the recent study of 11,345 Chinese adults showed that BSI and BRI were not superior to BMI, WC, WHtR and WHR to foresee DM.10 Alvin et al suggested that BAI was more practical than BMI and WC in predicting type 2 DM in Brazilian adults, but the study in Singapore declared superiority of combination of both BMI and WHtR to BAI.11,18 The association between BF% (body fat percent) and FMI and traditional cardiovascular risk profiles have been revealed, but it was not a better predictor in relation to BMI.19 The study of 12,294 adults from the United States determined that FMI, BF% and FFMI were not good alternatives to BMI in measuring adiposity and predicting metabolic syndrome (MetS).20
Following controversy in previous studies, we aimed to evaluate the accuracy of various proposed new obesity indices to predict hyperglycemia in overweight and obese Iranian populations and to demonstrate the value of such indices compared to the conventional parameters. And also, we evaluated new latent combined scores in this matter.
Patients and Methods
Study Design and Study Subjects
This study was a cross-sectional correlational study conducted at the weight loss clinic of Sina hospital, an educational hospital of Tehran University of Medical Sciences. A total of 4770 adult participants consisting of 3752 females and 1018 males were evaluated in this study in a consecutive manner between January 2017 and December 2019. The number of overweigh participants was 1546, while there were 3184 obese patients. We found an incomplete set of data for 2682 participants. The study protocol was approved by the Ethics Committee of Tehran University of Medical Sciences. The classification of obesity status was established according to overweight (30 > BMI ≥25 kg/m2) and obesity (BMI ≥30 kg/m2). For calculating VAI and LAP, we excluded patients with hyperlipidemia who received treatment for hypertriglyceridemia due to its effect on serum TG (Triglyceride) level which influences VAI and LAP indices. We included patients using Statins since the studied patients were on low-dose Statins with a minimal effect on TG level. We evaluated the medication history of patients and excluded patients using medications effective on serum glucose level [eg, Corticosteroids, HRT (Hormone Replacement Therapy)]. The other exclusion criteria were diagnosis of heart failure, myocardial infarction, or stroke in the six months before the evaluation, other chronic diseases, and pregnancy.
A consent form was obtained from all participants after being informed of the study objectives and benefits. They also signed an agreement regarding personal information confidentiality. Information on demographic data was collected during a single clinic visit by trained nurses who used a standard questionnaire for data gathering from face-to-face interview. Primarily, all investigators were invited to attend a training session that covered topics including the purpose of study, manner of filling out the questionnaire, standard method of measurement, and study procedures.
Hyperglycemia Definition
Hyperglycemia defined as the presence of fasting blood glucose ≥100 mg/dl or diabetes as a self-reported history of diabetes and/or receiving anti-diabetic medication, or HbA1c ≥ 5.7 (38.8 mmol/mol) were checked twice.21
Measurements
Body weight was measured to the nearest 0.1 kg and height was measured to the nearest 0.1 cm using a standard stadiometer. Weight was measured with a light clothing and height was measured without shoes. BMI was then calculated as weight divided by height squared (kg/m2). Waist circumference was taken at the maximal narrowing of the waist from anterior view. Hip circumference was measured at the point of maximal gluteal protuberance from the lateral view.22
Anthropometric Indices
The anthropometric indices including total fat percentage, total fat mass and total fat-free mass were measured using body composition analyzer BC-418 MA (TANITA, Tokyo, Japan).12
VAI can be calculated using a sex specific equation as below: TG and HDL (high-density lipoprotein) are expressed in mmol/l: Males [VAI = (WC/39.68+(1.88×BMI))×(TG/1.03)×(1.31/HDL)], Females [VAI = (WC/36.58+(1.89×BMI))×(TG/0.81)×(1.52/HDL)].13 LAP is also a sex specific equation and is defined as [LAP = (WC-65) × TG] for men and [(WC-58) × TG] for women.14 BSI was calculated using this formula and WC and height are in meters in this index: [BSI = WC/(BMI2/3x height1/2)].15 BRI was calculated by this equation: [BRI = 364.2−365.5  ].16 BAI was calculated using this equation: [BAI = (hip circumference (cm)/height (m) 1.5) − 18)].17 Fat mass index (FMI) and fat-free mass index (FFMI) were measured by calculating total fat mass and fat-free mass by body composition analyzer, and then using the following formula: [FMI = fat mass/height squared (m)], [FFMI = fat-free mass/height squared (m)].12
Waist-to-height ratio (WHtR) is defined as waist circumference divided by height. Waisttohip ratio (WHR) is defined as their waist circumference divided by hip circumference, both measured in the same units.22
Laboratory Investigations
Blood samples were collected following a 12-hour fasting. In order to determine the levels of fasting blood sugar (FBS), triglyceride (TG), cholesterol (CHOL), low-density lipoprotein (LDL) and high-density lipoprotein (HDL) levels, the patients’ sera was extracted. The enzymatic colorimetric technique was used to assess fasting plasma glucose level. An Erba Mannheim auto analyzer XL-640 (Erba Diagnostics Mannheim, Germany) with Pars Azmoon reagent kit (Tehran, Iran) was used for assessing serum levels of lipid profiles. Thereafter, low-density lipoprotein-cholesterol (LDL-cholesterol) was calculated according to the Fried Ewald’s formula.23 LDL cholesterol was directly measured by enzymatic method and using commercial kits (Parsazmun, Karaj, Iran) in cases with serum triglyceride levels>400 mg/dl. HbA1c was also assessed using high-performance liquid chromatography (Tosoh G7, Tokyo, Japan).
Statistical Analysis
The independent t-test and chi-square test were used to compare quantitative and categorical parameters, respectively in patients with or without hyperglycemia. Pearson’s or Spearman correlation tests were used to examine the association of hyperglycemia and anthropometric parameters. We used dimension reduction analysis for grouping anthropometric indices. The SEM (structural equation modeling) method was used to extract latent synthetic obesity score from the manifest anthropologic indices.24 However, due to the stronger multi-co-linearity between the anthropologic indices, the ordinary linear SEM was not able to detect the association between obesity score and hyperglycemia. Therefore, for structuring the SEM model aiming at extracting our new scores, the adopted PLSPM method was employed.25
We used the area under the receiver-operating characteristic curve (AUC) with 95% confidence intervals (CIs) and Youden distance to assess the power of each anthropometric measure to assess the risk of hyperglycemia.
Since some indices were strongly correlated with sex,18 we analyzed the data in two men and women subgroups.
The odds ratios (ORs) and their 95% CIs for the presence of hyperglycemia were estimated by logistic regression analysis with adjustments made for age and sex in the first model, and for age, sex, BMI and WC for the second model. Furthermore, in women, we adjusted logistic regression analysis for menopausal status. All statistical analyses were performed using IBM SPSS Statistics 17.0 (SPSS Inc., Chicago, IL, USA) and SmartPLS Version 2.0 (Ringle, Wende, and Becker, 2015). P-values < 0.05 were considered statistically significant.
Results
The baseline characteristics of individuals are summarized in Table 1. Among women, 2848 (75%) patients were pre-menopausal while 904 (25%) individuals were post-menopausal. Of total 4770 participants, 1749 (36%) patients used Statins, 1584 (33%) persons were overweight while 3186 (67%) were obese.
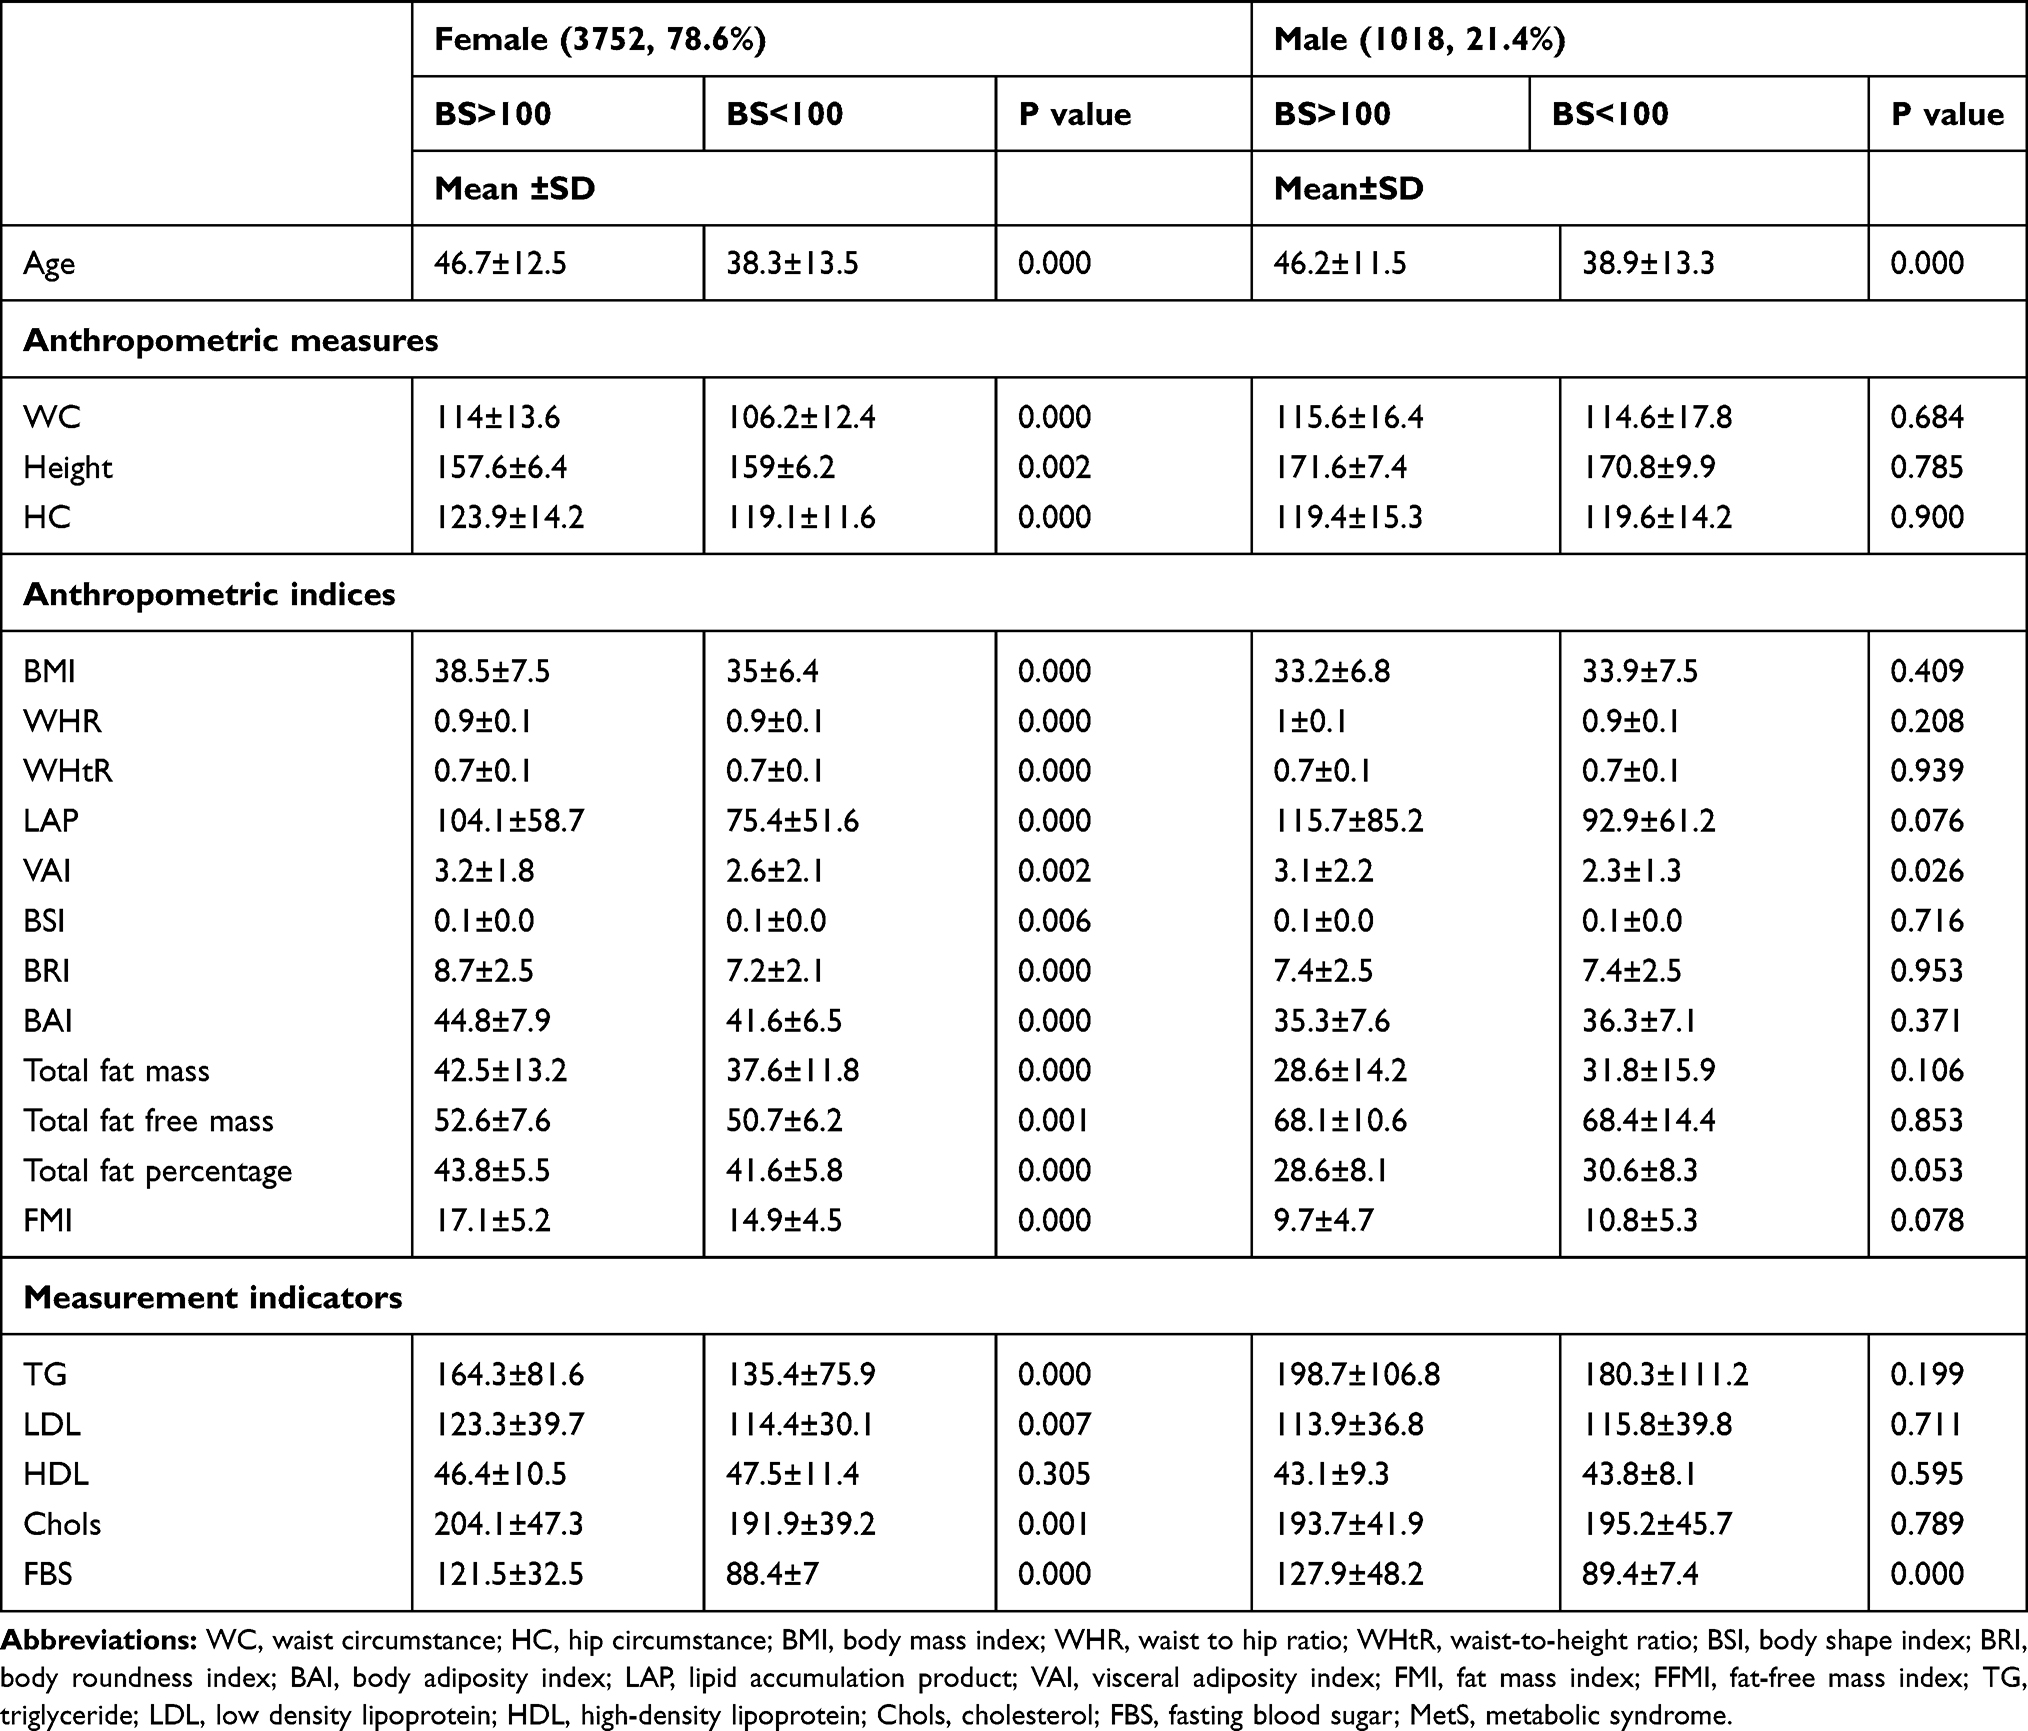 |
Table 1 Clinical Anthropometric Measures, Indices and Measure Indicators Adjusted for Gender and Hyperglycemia |
KMO (Kaiser-Meyer-Olkin) measures of adequacy of 0.740 and significance of the Bartlett test of sphericity (P < 0.0001) were used for running the exploratory factor analysis. After using the rotated component matrix for factor reduction of anthropometric indices, we categorized the indices into three groups: body mass-related consisting of BMI, WHtR, FMI, FFMI, BAI and BRI; Central obesity-related consisting of WHR and BSI and Bloodlipid-related consisting of LAP and VAI (see Table 2).
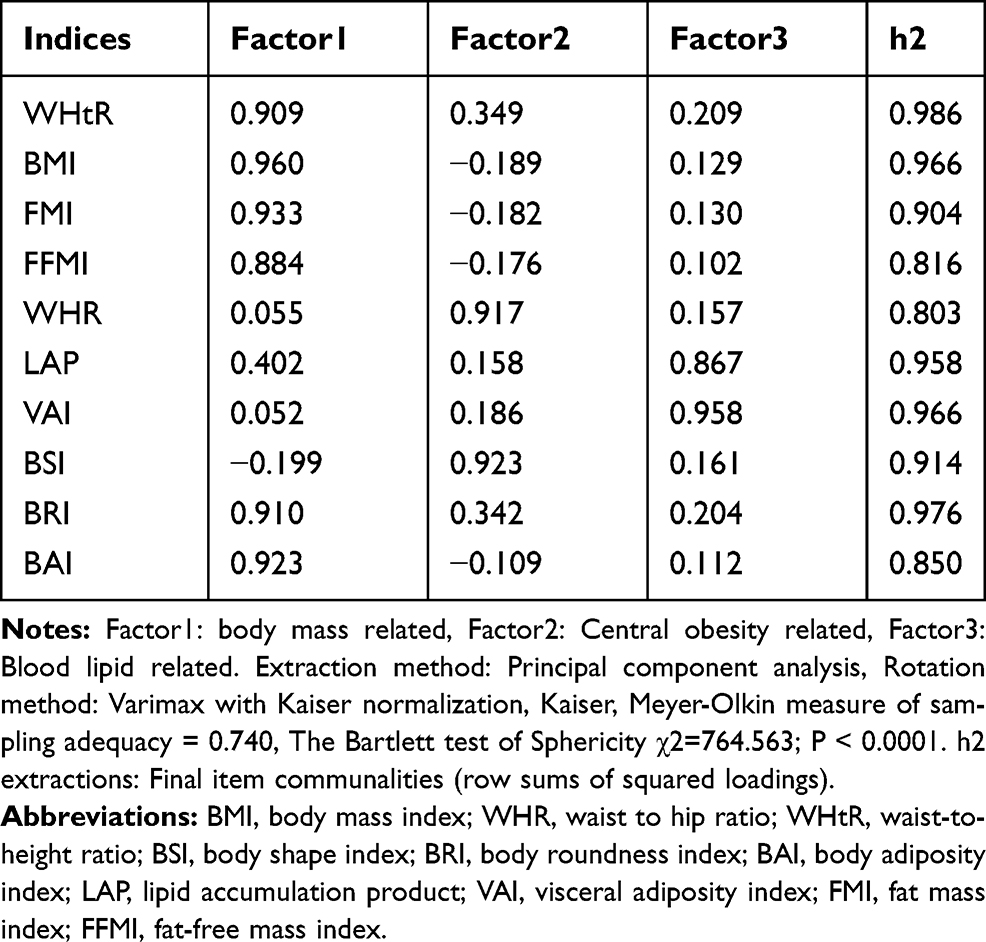 |
Table 2 Rotated Component Matrix for Factor Reduction of Anthropometric Indices |
The manifest indices are selected from the biggest AUC of each category. Therefore, WC, LAP and WHtR were used in this way. We explained four states consisting of these indices’ composition: Score1 (LAP, WHtR), Score2 (LAP, WC), Score3 (WHtR, WC) and Score4 (LAP, WHtR, and WC). Table 3, shows the path coefficient in 7 Partial Least Squares Path Modeling (PLS-PM) models for both genders. Based on the statistical simulation, the proposed model had enough power and stability to detect the relationship of body shape with hyperglycemia.
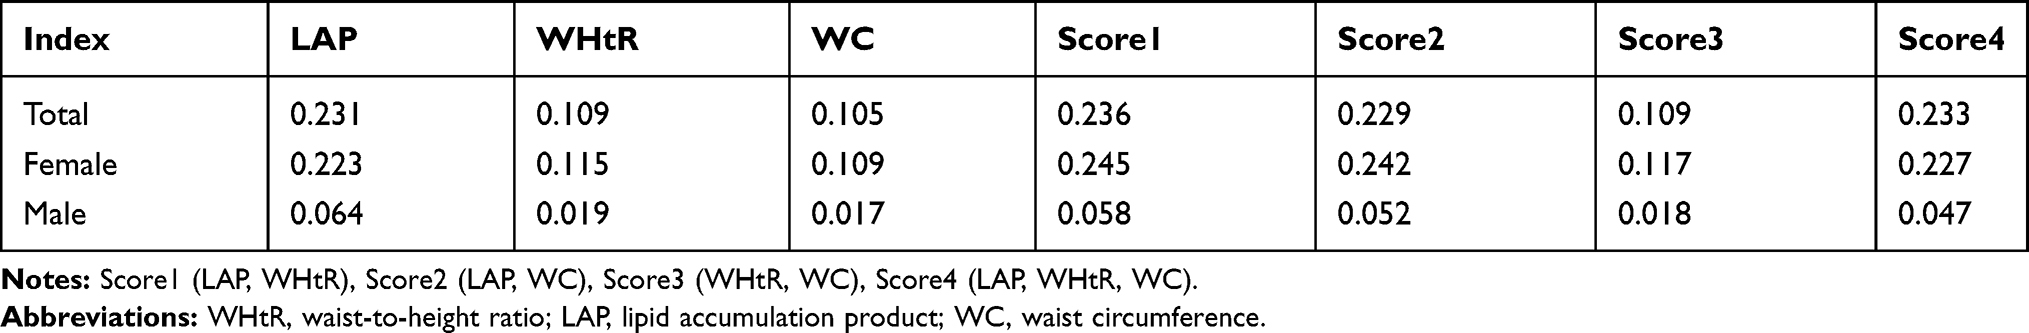 |
Table 3 The Path Coefficient in the 7 PLSPM Models for Both Gender |
Table 4 presents the AUCs (95% CIs), sensitivity, specificity and optimal cut points for anthropometric indices in relation to hyperglycemia in both genders. The biggest AUCs were seen in score 1, 2 and 4 and then in WHtR, LAP and WC in women, respectively. In men, score1, BRI and WC consisted of the highest AUCs. As the AUC between 0.6 and 0.7 shows sufficient and AUC between 0.5 and 0.6 suggests bad accuracy of diagnostic tests, most indices had sufficient accuracy, except for FMI and FFMI among women and WHR among men with bad accuracy.
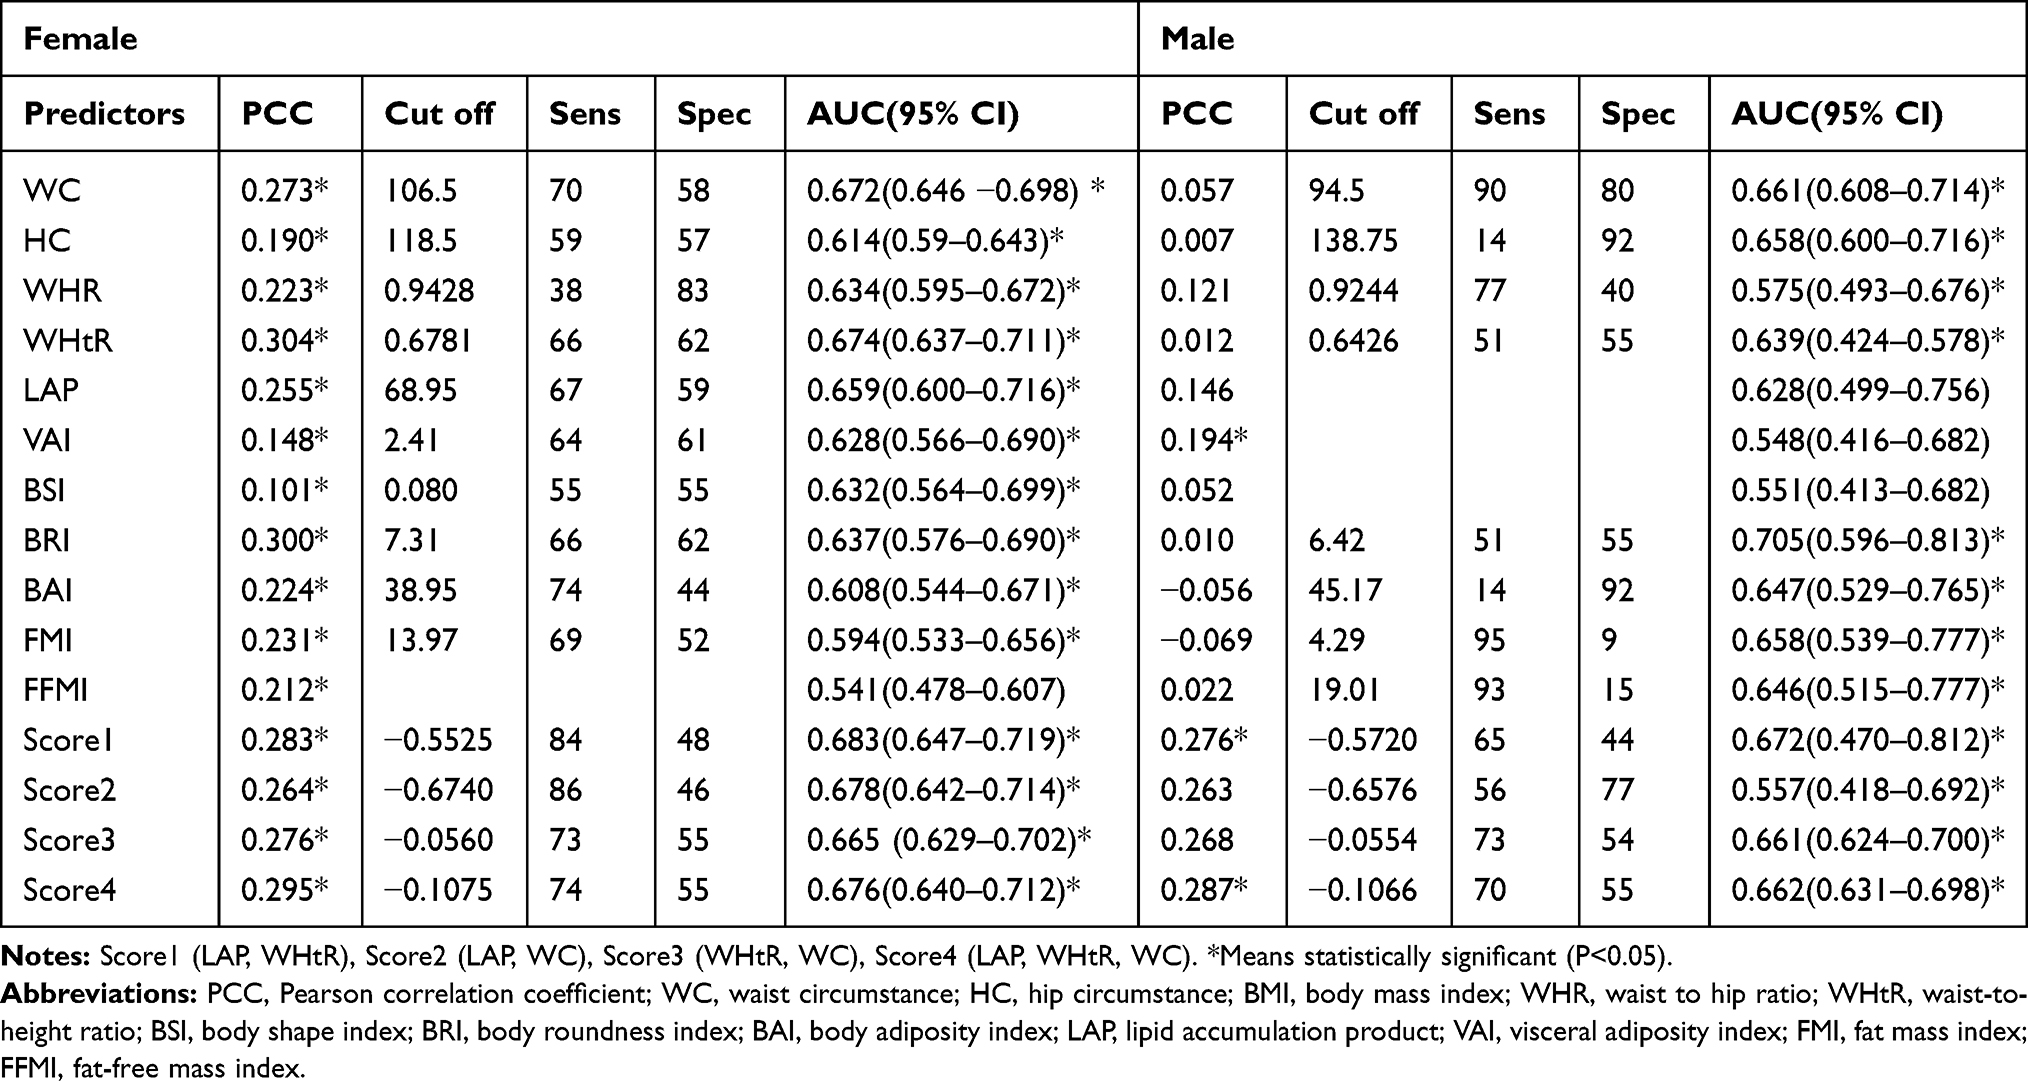 |
Table 4 The Area Under the Curve, Cut off, Sensitivity and Specificity of Each Anthropometric Measures for the Presence of Hyperglycemia in Both Genders |
Figure 1, shows the AUCs of anthropometric indices in each group.
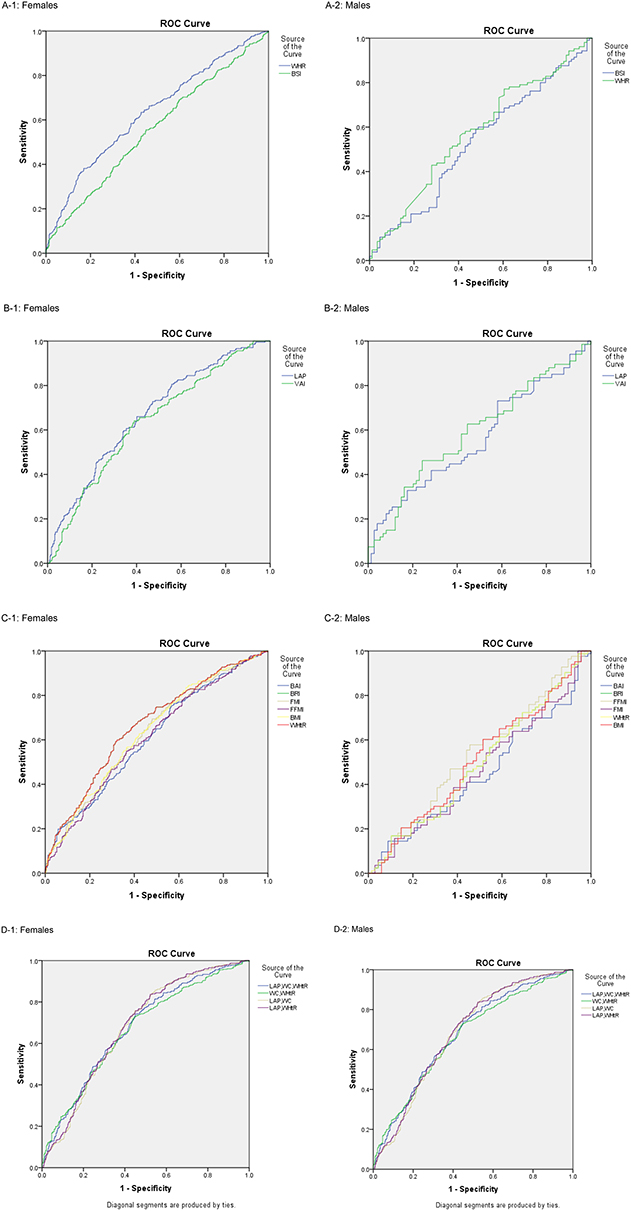 |
Figure 1 (A) ROC curve of Central obesity related indices in both genders. WHR AUC (CI95%): 0.634 (0.595–0.672) for women (A-1) and 0.575 (0.493–0.676) for men (A-2). BSI AUC (CI95%): 0.632 (0.564–0.699) for women (A-1) and 0.551 (0.413–0.682) for men (A-2). (B) ROC curve of blood lipid related indices in both gender. LAP AUC (CI95%): 0.659 (0.600–0.716) for women (B-1) and 0.628 (0.499–0.756) for men (B-2). VAI AUC (CI95%): 0.628 (0.566–0.690) for women (B-1) and 0.548 (0.416–0.682) for men (B-2). (C) ROC curve of body mass related indices in both gender. The most AUC in WHtR. AUC (CI95%): 0.696 (0.669–0.721) for women (C-1) and 0.639 (0.612–0.667) for men (C-2). (D) ROC curve of new scores for females. (a) Score1, (b) Score2, (c) Score3, (d) Score4. The most AUC in Score1. AUC (CI95%): 0.683 (0.647–0.719) for women (D-1). |
The highest seneitivity was reported at score4 (sen= 76%, spe=54%) and BAI (sen= 74%, spe=44%) in women and FMI (sen= 95%, spe=9%) and FFMI (sen=93%, spe=15%) in men, while the highest specificity was shown in WHR (spe= 83%, sen=38%) in women and BAI (spe= 92%, sen= 14%) in men.
The multivariable logistic regression modeling was employed to assess the Odds Ratio (OR) and 95% Confidence Interval (CI) for hyperglycemia with the presence of each anthropometric (Table 5). Hence, most of the analyses in men’s group are insignificant; we have focussed on women’s group in which WHR had OR=7.774 that increased to OR=7.981 after adjustment. The second one in prediction of hyperglycemia was the newly developed score 4 with OR=1.644 that was 1.648 after adjustment. After additional adjustment based on menopausal status among women, WHR and score 4 were approximately the same [OR=7.789 (1.256–13.674), 1.391 (0.947–2.129)]. BRI improved to OR=4.513 (2.187–8.388), and LAP, VAI and score 1 and 2 changed to be insignificant. Other indices’ status did not change.
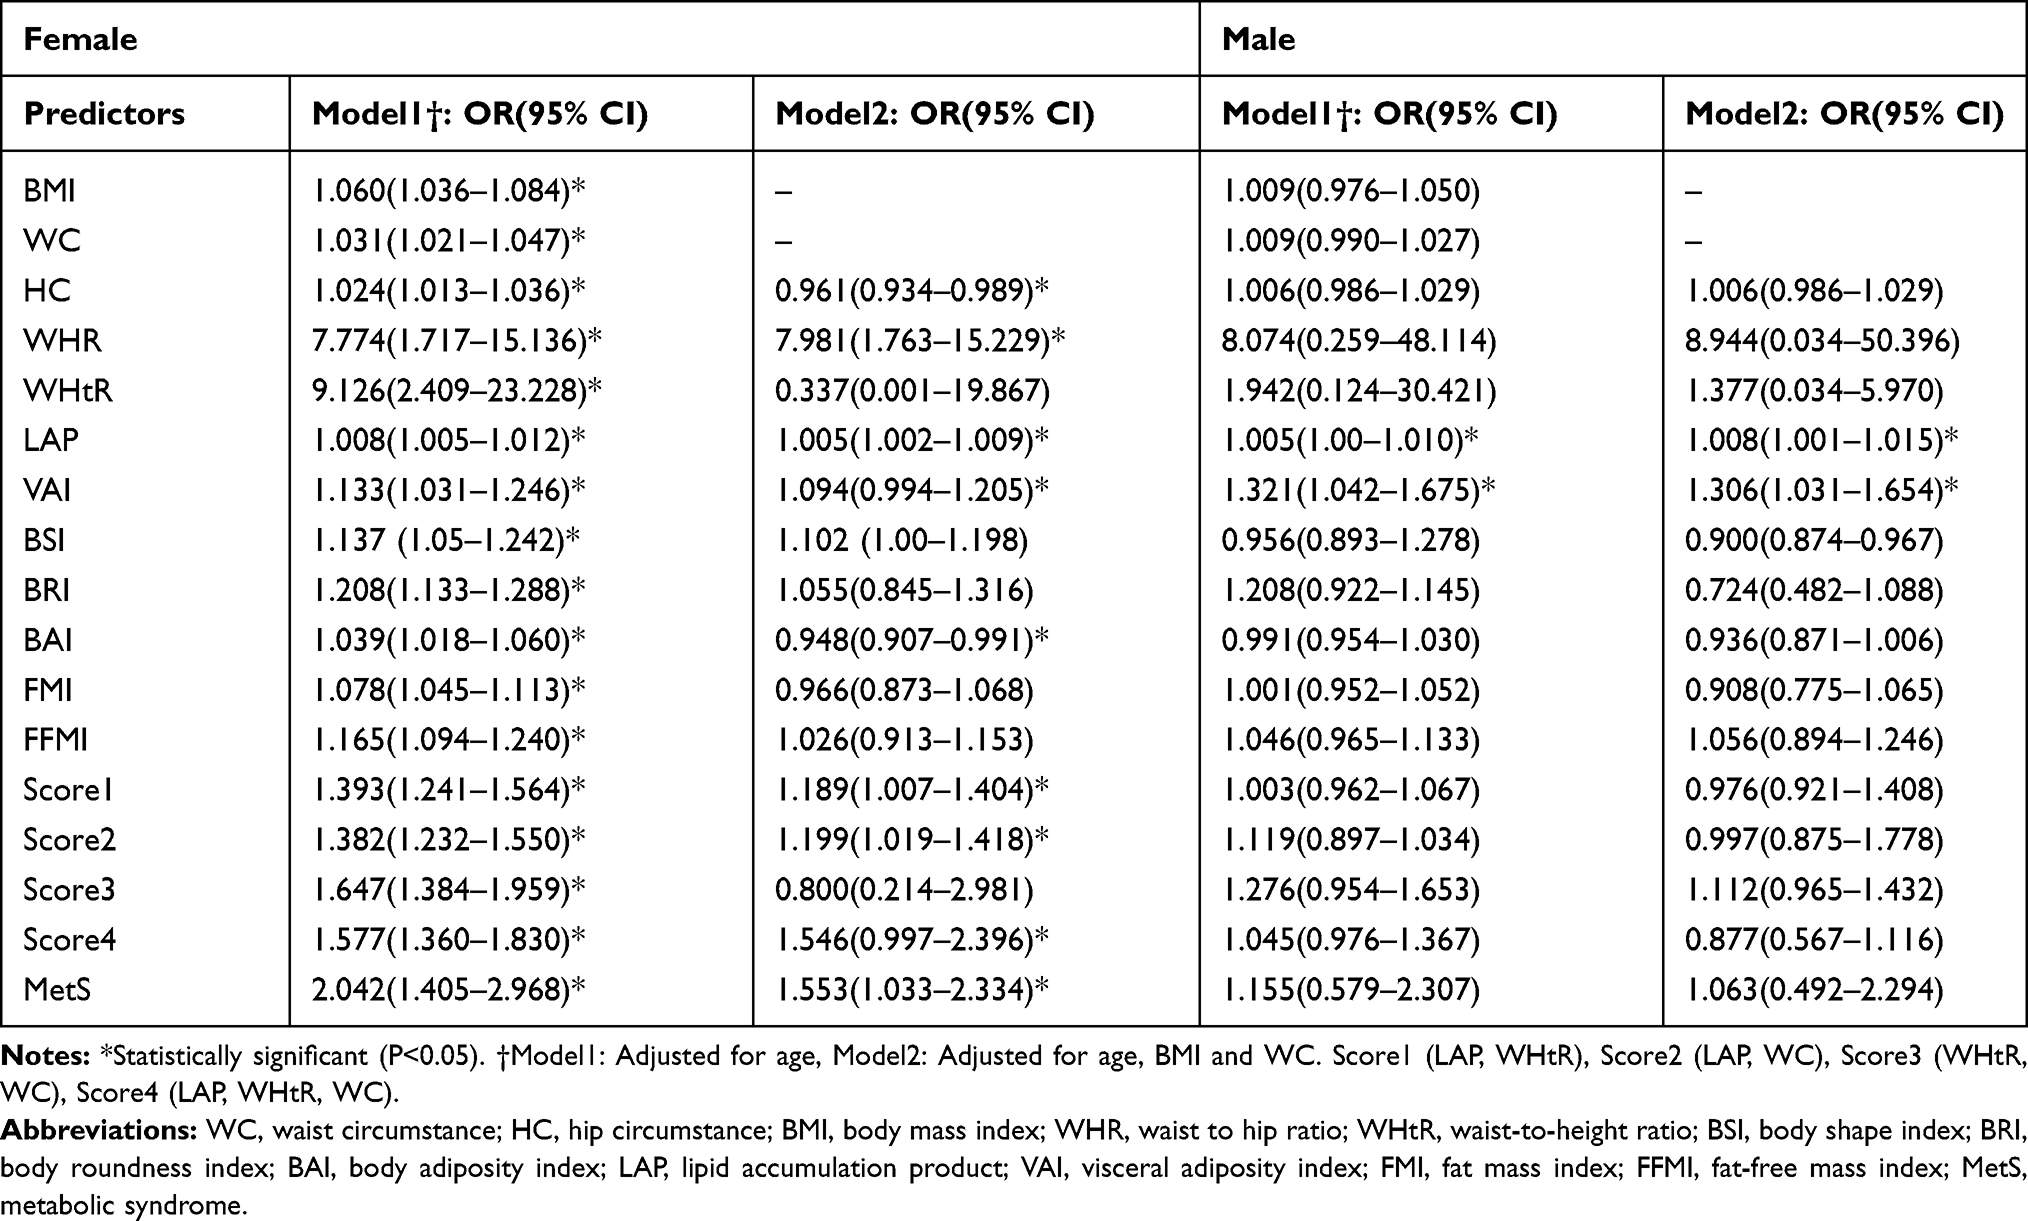 |
Table 5 Odds Ratio (95% CI) of the Presence of Hyperglycemia for Each Anthropometric Measure |
Discussion
We evaluated the correlation between anthropometric indices and hyperglycemia for possible use of these potential indices to predict hyperglycemia in clinical settings. To our knowledge, this is the first study evaluating an extensive number of indices, including old and new ones, with an acceptable sample size. Also, we introduced latent potential combined indices among the hyperglycemic population for future studies. When both genders were considered together, the strongest consistent correlation was found between WHtR followed by BRI and LAP and hyperglycemia. BAI parameter correlates more efficiently in women following gender stratification, but it was not the same for BSI.
Additionally, based on the adjusted AUCs, BAI and BSI had lower predicting powers compared to WC and WHtR in females, but BRI showed a higher value than WC and WHtR in males. After adjusting for BMI and WC, indices like BAI, BSI and BRI did not further increase the odds of hyperglycemia, suggesting that these indices have no additional value taking into account BMI and WC.
Compared to subcutaneous adipose tissue,26 visceral adiposity seems to be associated with the raised probability of metabolic and cardiovascular risks more. Triglyceride can have a satisfactory predictive factors of visceral adipose tissue in healthy people.27 The use of triglyceride levels in LAP and VAI indices have been revealed to identify individuals with highest visceral fat levels28 and it is related to the increased possibility of MetS.29 It is proved in Amini’s study, like our findings, that LAP is correlated with diabetes, and this phenotype seems to be beneficial in detecting DM30 while the studies of Saudi and Chinese individuals have concluded that VAI could predict the risk of glucose metabolism deficiency.31,32
Fat mass index is correlated with metabolic markers like triglyceride and very low-density lipoprotein; however, it is insignificantly correlated with blood glucose, cholesterol, HDL and LDL.32 Liu et al addressed FMI as an acceptable screening tool in predicting the presence of metabolic syndrome when comparing BMI and percentage of body fat in both genders,33 while studies on these indices in diabetic patients are not founded.
However, Maessen et al and Fujita M et al found that BSI was as a weak predictor for diabetes compared to BMI or WC;34,35 in He et al’s study, the predictive value of BSI, BMI, and WC for DM was similar.36 We believe that the differences in ethnics and the way for selection of cases can chiefly justify such discrepancies.
According to the Maessen’s study, BRI could be presented as a novel body index for identifying CVD risk profiles;34 however, our results showed that BRI was a potential parameter in detecting hyperglycemia, particularly in men.
We, then, evaluated the role of WHtR as a better predictor of hyperglycemia as one of CVD risk factors in an adult population in Iran, as suggested by recent systematic reviews and meta-analyses.37–39
The initial analyses assert that the two indices of WHtR and WC have a higher predictive power than BMI while WC generally has higher values compared to WHtR. In the same vein, some studies demonstrated that measuring central adiposity by WC is more likely to be associated with CVD risk factors when compared to BMI.42–45
Based on the literature, a single parameter may not be adequate for assessing obesity.40,45,46 As shown by Lin et al, the combination of WHR and BMI parameters could more appropriately predict CVD risk than BMI alone.46 In addition, Wang et al proved that combined scores had a higher value compared to using a single parameter to predict the relationship between obesity and some cardiovascular risk factors including hypertension;47 nevertheless, combined scores used in DM prediction in Zafari et al study indicated that combining central and general obesity parameters could enhance the specificity, though sensitivity and PPV is reduced.48 Our results showed that new combined latent scores did not predict hyperglycemia better than WHR according to adjusted ORs but these new scores consist of the higher AUC in comparison to single indices, so the existence of latent scores predicting hyperglycemia is valuable for future studies to formulize new variables to be used in clinical practice.
The strong points of the present study are: First, we chose a large sample size (number of patients). Second, trained researchers were recruited for interviewing and measuring anthropometric parameters based on a standard protocol leading to minimal bias. However, some potential parameters including socioeconomic status, history of smoking, dietary habits and physical activity were not included in the final analysis and this is the major limitation of study. Also, a higher number of women was included in the study and most men did not participate in the physical examination leading to a selection bias. Hence, further cohort studies should be performed to confirm the causality nature of findings to remove the limitations of the present cross-sectional study.
Conclusion
In conclusion, WHR had the strongest association with hyperglycemia in women with only sufficient discrimination ability.
However, neither the BSI and BAI nor FMI and FFMI were considered as privileged to BMI, WC or WHtR in predicting the presence of hyperglycemia. In comparison to BSI, BAI, FMI and FFMI, the BRI and combined scores had higher values in predicting hyperglycemia.
Acknowledgment
We would like to express our thanks to Research Development Centre of Sina Hospital for their cooperation as well as statistical and consulting supports.
Author Contributions
All authors contributed to data gathering, data analysis, drafting or revising the manuscript, gave final approval of the version to be published, and agree to be accountable for all aspects of the work.
Disclosure
The authors have no conflicts of interest to declare.
References
1. Herman WH. Diabetes epidemiology: guiding clinical and public health practice: the kelly west award lecture, 2006. Diabetes Care. 2007;30(7):1912–1919. doi:10.2337/dc07-9924
2. Low S, Chin MC, Deurenberg-Yap M. Review on epidemic of obesity. Ann Acad Med Singapore. 2009;38(1):57.
3. World Health Organization. Diabetes Mellitus Fact Sheet. Geneva; 2002.
4. Esteghamati A, Etemad K, Koohpayehzadeh J, et al. Trends in the prevalence of diabetes and impaired fasting glucose in association with obesity in Iran: 2005–2011. Diabetes Res Clin Pract. 2014;103(2):319–327. doi:10.1016/j.diabres.2013.12.034
5. Rahmani A, Sayehmiri K, Asadollahi K, Sarokhani D, Islami F, Sarokhani M. Investigation of the prevalence of obesity in Iran: a systematic review and meta-analysis study. Acta Med Iran. 2015;596–607.
6. Chen C, Xu Y, Guo Z-R, Yang J, Wu M, Hu X-S. The application of visceral adiposity index in identifying type 2 diabetes risks based on a prospective cohort in China. Lipids Health Dis. 2014;13(1):108. doi:10.1186/1476-511X-13-108
7. Fox CS, Massaro JM, Hoffmann U, et al. Clinical perspective. Circulation. 2007;116(1):39–48. doi:10.1161/CIRCULATIONAHA.106.675355
8. Matsuda M, Shimomura I. Increased oxidative stress in obesity: implications for metabolic syndrome, diabetes, hypertension, dyslipidemia, atherosclerosis, and cancer. Obes Res Clin Pract. 2013;7(5):e330–e341. doi:10.1016/j.orcp.2013.05.004
9. Pinidiyapathirage M, Kasturiratne A, Ranawaka U, et al. The burden of diabetes mellitus and impaired fasting glucose in an urban population of Sri Lanka. Diabet Med. 2013;30(3):326–332. doi:10.1111/dme.12013
10. Chang Y, Guo X, Chen Y, et al. A body shape index and body roundness index: two new body indices to identify diabetes mellitus among rural populations in northeast China. BMC Public Health. 2015;15(1):794. doi:10.1186/s12889-015-2150-2
11. Lam BCC, Koh GCH, Chen C, Wong MTK, Fallows SJ. Comparison of body mass index (BMI), body adiposity index (BAI), waist circumference (WC), waist-to-hip ratio (WHR) and waist-to-height ratio (WHtR) as predictors of cardiovascular disease risk factors in an adult population in Singapore. PLoS One. 2015;10(4):e0122985. doi:10.1371/journal.pone.0122985
12. Jebb SA, Cole TJ, Doman D, Murgatroyd PR, Prentice AM. Evaluation of the novel Tanita body-fat analyser to measure body composition by comparison with a four-compartment model. Br J Nutr. 2000;83(2):115–122. doi:10.1017/S0007114500000155
13. Amato MC, Giordano C, Galia M, et al. Visceral adiposity index: a reliable indicator of visceral fat function associated with cardiometabolic risk. Diabetes Care. 2010;33(4):920–922. doi:10.2337/dc09-1825
14. Kahn HS. The” lipid accumulation product” performs better than the body mass index for recognizing cardiovascular risk: a population-based comparison. BMC Cardiovasc Disord. 2005;5(1):26. doi:10.1186/1471-2261-5-26
15. Krakauer NY, Krakauer JC. A new body shape index predicts mortality hazard independently of body mass index. PLoS One. 2012;7(7):e39504. doi:10.1371/journal.pone.0039504
16. Thomas DM, Bredlau C, Bosy‐Westphal A, et al. Relationships between body roundness with body fat and visceral adipose tissue emerging from a new geometrical model. Obesity. 2013;21(11):2264–2271. doi:10.1002/oby.20408
17. Bergman RN, Stefanovski D, Buchanan TA, et al. A better index of body adiposity. Obesity. 2011;19(5):1083–1089. doi:10.1038/oby.2011.38
18. de Oliveira Alvim R, Mourao-Junior CA, de Oliveira CM, Krieger JE, Mill JG, Pereira AC. Body mass index, waist circumference, body adiposity index, and risk for type 2 diabetes in two populations in Brazil: general and Amerindian. PLoS One. 2014;9(6).
19. Valentino G, Bustamante MJ, Orellana L, et al. Body fat and its relationship with clustering of cardiovascular risk factors. Nutr Hosp. 2015;31(5):2253–2260. doi:10.3305/nh.2015.31.5.8625
20. Mooney SJ, Baecker A, Rundle AG. Comparison of anthropometric and body composition measures as predictors of components of the metabolic syndrome in a clinical setting. Obes Res Clin Pract. 2013;7(1):e55–e66. doi:10.1016/j.orcp.2012.10.004
21. Organization WH. Definition and Diagnosis of Diabetes Mellitus and Intermediate Hyperglycaemia: Report of a WHO/IDF Consultation. 2006.
22. Kang SH, Cho KH, Park JW, Do JY. Comparison of waist to height ratio and body indices for prediction of metabolic disturbances in the Korean population: the Korean national health and nutrition examination survey 2008–2011. BMC Endocr Disord. 2015;15(1):79. doi:10.1186/s12902-015-0075-5
23. Friedewald WT, Levy RI, Fredrickson DS. Estimation of the concentration of low-density lipoprotein cholesterol in plasma, without use of the preparative ultracentrifuge. Clin Chem. 1972;18(6):499–502. doi:10.1093/clinchem/18.6.499
24. Esposito Vinzi V, Chin WW, Henseler J, Wang H. Handbook of Partial Least Squares: Concepts, Methods and Applications. Heidelberg, Dordrecht, London, New York: Springer; 2010.
25. Henseler J, Ringle CM, Sinkovics RR. The use of partial least squares path modeling in international marketing. In: New Challenges to International Marketing. Emerald Group Publishing Limited; 2009.
26. Adeboye B, Bermano G, ROllAND C. Obesity and its health impact in Africa: a systematic review. Cardiovasc J Afr. 2012;23(9):512. doi:10.5830/CVJA-2012-040
27. Freedland ES. Role of a critical visceral adipose tissue threshold (CVATT) in metabolic syndrome: implications for controlling dietary carbohydrates: a review. Nutr Metab. 2004;1(1):12. doi:10.1186/1743-7075-1-12
28. Nguyen-Duy T-B, Nichaman MZ, Church TS, Blair SN, Ross R. Visceral fat and liver fat are independent predictors of metabolic risk factors in men. Am J Physiol Endocrinol Metab. 2003;284(6):E1065–E1071. doi:10.1152/ajpendo.00442.2002
29. Sam S, Haffner S, Davidson MH, et al. Hypertriglyceridemic waist phenotype predicts increased visceral fat in subjects with type 2 diabetes. Diabetes Care. 2009;32(10):1916–1920. doi:10.2337/dc09-0412
30. Amini M, Esmaillzadeh A, Sadeghi M, Mehvarifar N, Amini M, Zare M. The association of hypertriglyceridemic waist phenotype with type 2 diabetes mellitus among individuals with first relative history of diabetes. J Res Med Sci. 2011;16(2):156.
31. Al‐Daghri NM, Al‐Attas OS, Alokail MS, et al. Visceral adiposity index is highly associated with adiponectin values and glycaemic disturbances. Eur J Clin Invest. 2013;43(2):183–189. doi:10.1111/eci.12030
32. Wu J, Gong L, Li Q, et al. A novel visceral adiposity index for prediction of type 2 diabetes and pre-diabetes in chinese adults: a 5-year prospective study. Sci Rep. 2017;7(1):1–9. doi:10.1038/s41598-016-0028-x
33. Liu P, Ma F, Lou H, Liu Y. The utility of fat mass index vs. body mass index and percentage of body fat in the screening of metabolic syndrome. BMC Public Health. 2013;13(1):629. doi:10.1186/1471-2458-13-629
34. Maessen MF, Eijsvogels TM, Verheggen RJ, Hopman MT, Verbeek AL, de Vegt F. Entering a new era of body indices: the feasibility of a body shape index and body roundness index to identify cardiovascular health status. PLoS One. 2014;9(9):e107212. doi:10.1371/journal.pone.0107212
35. Fujita M, Sato Y, Nagashima K, Takahashi S, Hata A, Taheri S. Predictive power of a body shape index for development of diabetes, hypertension, and dyslipidemia in Japanese adults: a retrospective cohort study. PLoS One. 2015;10(6):e0128972. doi:10.1371/journal.pone.0128972
36. He S, Chen X, Miele C. Could the new body shape index predict the new onset of diabetes mellitus in the Chinese population? PLoS One. 2013;8(1):e50573. doi:10.1371/journal.pone.0050573
37. Browning LM, Hsieh SD, Ashwell M. A systematic review of waist-to-height ratio as a screening tool for the prediction of cardiovascular disease and diabetes: 0.5 could be a suitable global boundary value. Nutr Res Rev. 2010;23(2):247–269. doi:10.1017/S0954422410000144
38. Lee CM, Huxley RR, Wildman RP, Woodward M. Indices of abdominal obesity are better discriminators of cardiovascular risk factors than BMI: a meta-analysis. J Clin Epidemiol. 2008;61(7):646–653. doi:10.1016/j.jclinepi.2007.08.012
39. Savva SC, Lamnisos D, Kafatos AG. Predicting cardiometabolic risk: waist-to-height ratio or BMI. A meta-analysis. Diabetes Metab Syndr Obes. 2013;6:403–419. doi:10.2147/DMSO.S34220
40. Menke A, Muntner P, Wildman RP, Reynolds K, He J. Measures of adiposity and cardiovascular disease risk factors. Obesity (Silver Spring). 2007;15(3):785–795. doi:10.1038/oby.2007.593
41. Zhu S, Wang Z, Heshka S, Heo M, Faith MS, Heymsfield SB. Waist circumference and obesity-associated risk factors among whites in the third national health and nutrition examination survey: clinical action thresholds. Am J Clin Nutr. 2002;76(4):743–749. doi:10.1093/ajcn/76.4.743
42. Dong X, Liu Y, Yang J, Sun Y, Chen L. Efficiency of anthropometric indicators of obesity for identifying cardiovascular risk factors in a Chinese population. Postgrad Med J. 2011;87(1026):251–256. doi:10.1136/pgmj.2010.100453
43. Park SH, Choi SJ, Lee KS, Park HY. Waist circumference and waist-to-height ratio as predictors of cardiovascular disease risk in Korean adults. Circ J. 2009;73(9):1643–1650. doi:10.1253/circj.CJ-09-0161
44. Hou X, Lu J, Weng J, et al. Impact of waist circumference and body mass index on risk of cardiometabolic disorder and cardiovascular disease in Chinese adults: a national diabetes and metabolic disorders survey. PLoS One. 2013;8(3):e57319. doi:10.1371/journal.pone.0057319
45. Hadaegh F, Zabetian A, Harati H, Azizi F. Waist/height ratio as a better predictor of type 2 diabetes compared to body mass index in Tehranian adult men–a 3.6-year prospective study. Exp Clin Endocrinol Diabetes. 2006;114(6):310–315. doi:10.1055/s-2006-924123
46. Lin JD, Chiou WK, Weng HF, Tsai YH, Liu TH. Comparison of three-dimensional anthropometric body surface scanning to waist-hip ratio and body mass index in correlation with metabolic risk factors. J Clin Epidemiol. 2002;55(8):757–766. doi:10.1016/S0895-4356(02)00433-X
47. Wang S, Liu Y, Li F, Jia H, Liu L, Xue F. A novel quantitative body shape score for detecting association between obesity and hypertension in China. BMC Public Health. 2015;15(1):7. doi:10.1186/s12889-014-1334-5
48. Zafari N, Lotfaliany M, Mansournia MA, Khalili D, Azizi F, Hadaegh F. Optimal cut-points of different anthropometric indices and their joint effect in prediction of type 2 diabetes: results of a cohort study. BMC Public Health. 2018;18(1):691. doi:10.1186/s12889-018-5611-6
 © 2020 The Author(s). This work is published and licensed by Dove Medical Press Limited. The full terms of this license are available at https://www.dovepress.com/terms.php and incorporate the Creative Commons Attribution - Non Commercial (unported, v3.0) License.
By accessing the work you hereby accept the Terms. Non-commercial uses of the work are permitted without any further permission from Dove Medical Press Limited, provided the work is properly attributed. For permission for commercial use of this work, please see paragraphs 4.2 and 5 of our Terms.
© 2020 The Author(s). This work is published and licensed by Dove Medical Press Limited. The full terms of this license are available at https://www.dovepress.com/terms.php and incorporate the Creative Commons Attribution - Non Commercial (unported, v3.0) License.
By accessing the work you hereby accept the Terms. Non-commercial uses of the work are permitted without any further permission from Dove Medical Press Limited, provided the work is properly attributed. For permission for commercial use of this work, please see paragraphs 4.2 and 5 of our Terms.