")
Back to Journals » Integrated Pharmacy Research and Practice » Volume 10
Evaluation of Rational Use of Medicine Using WHO/INRUD Core Drug Use Indicators at Teda and Azezo Health Centers, Gondar Town, Northwest Ethiopia
Authors Sema FD , Asres ED, Wubeshet BD
Received 18 April 2021
Accepted for publication 3 June 2021
Published 21 June 2021 Volume 2021:10 Pages 51—63
DOI https://doi.org/10.2147/IPRP.S316399
Checked for plagiarism Yes
Review by Single anonymous peer review
Peer reviewer comments 3
Editor who approved publication: Professor Jonathan Ling
Faisel Dula Sema,1 Esubalew Delie Asres,2 Belaynesh Dubale Wubeshet2
1Department of Clinical Pharmacy, School of Pharmacy, College of Medicine and Health Sciences, University of Gondar, Gondar, Ethiopia; 2Schools of Pharmacy, College of Medicine and Health Sciences, University of Gondar, Gondar, Ethiopia
Correspondence: Faisel Dula Sema Email [email protected]
Background: Despite medicines are a major contributor to the health and well-being of the community, irrational use of medicines is being a serious public health crisis with significant harmful implications for patients, healthcare systems, and communities as a whole.
Objective: This study was aimed at evaluating the rational use of medicine using the World Health Organization/Network of Rational Use of Drugs (WHO/INRUD) core drug use indicators at Teda and Azezo health centers of Gondar town, northwest Ethiopia.
Methods: A cross-sectional study was conducted among 1200 prescription papers retrospectively, and 60 patients prospectively at two health centers of Gondar town, northwest Ethiopia from May 01/2019 to April 30/2020. The data were collected using a standard data collection checklist. Data were analyzed using SPSS® version 24. The data were analyzed descriptively by using mean, frequency, and proportion.
Results: Prescribing indicators: From a total of 2595 prescribed medicines, 94% of them were prescribed by generic name; percent encounters with injection was 9.5± 0.28%, percent encounters with antibiotics was 73.85± 0.35%, and 100% of medicines were prescribed from the essential medicine list of Ethiopia. Patient care indicators: Only 16.7% of the patients knew the correct dosage of their medications, and 17.5% of dispensed medicines were adequately labeled. From the prescribed medications, only 77.17% were actually dispensed. Average consultation and dispensing time were 5.35 minutes and 40.24 seconds, respectively. Facility-specific indicators: Only 83.5% of key medicines were available in the health centers.
Conclusion: According to the WHO/INRUD core drug use indicators, rational medicine use is not achieved in terms of most components of the prescribing, patient care, and facility-specific indicators. Therefore, both health centers should work towards promoting the rational use of medicines.
Keywords: rational use of medicine, WHO/INRUD core drug use indicators, northwest Ethiopia
Introduction
Medicines are a major contributor to the health and well-being of human beings;1,2 they are a pivotal point in the prevention and treatment of disease. Global spending on medicines reached $1.2 trillion in 2018 and is set to exceed $1.5 trillion by 2023.3 However, due to the scarce nature of a resource, the availability, the equitable access of essential medicines with affordable price, and their appropriate or rational use is very challenging throughout the world, particularly in low and middle-income countries (LMIC).1,4
Rational use of medicines (RUM) is defined as “patients receive medications appropriate to their clinical needs, in doses that meet their own individual requirements, for an adequate period of time, and at the lowest cost to them and their community.”5
On the contrary, irrational or non-rational use is the use of medicines in a way that is not compliant with rational use as defined above.5 It is commonly expressed in terms of polypharmacy, inappropriate use of antimicrobials, over-use of injection, failure to prescribe in accordance with clinical guidelines, and inappropriate self-medication often with prescription-only medicines.5
Worldwide, despite about one-third of the world’s population lacks access to essential medicines,5 around half of all medicines are inappropriately prescribed, dispensed, or sold, and that half of all patients fail to take their medicine properly,5–7 especially the worst scenario being in LMIC.7 Moreover, although ensuring that the correct medicine is given to the correct patient is a high priority for all health professionals,8 only less than half of all countries have basic policy frameworks needed to ensure RUM.7,9,10
The irrational use of medicine is not only widespread but also an extremely serious global problem with significant harmful implications for patients, healthcare systems, and communities as a whole. It may result in poor patient outcomes, rapidly increasing antimicrobial resistance, the spread of blood-borne infections, waste resources, and increased adverse medicine events; all of which cause serious morbidity and mortality, and cost billions of dollars per year. Irrational over-use of medicines can stimulate inappropriate patient demand, and lead to reduced access and attendance rates due to medicine stock-outs and loss of patient confidence in the health system.1,5–7,9–11
Even though several factors can promote irrational use of medicine at different stages of the medicine use cycle, the lack of proper knowledge and skills from both providers and patients, unrestricted availability of medicines or procurement and distribution of medicine not based on an essential medicine list (EML), economic incentives from pharmaceutical companies, weak control and regulation over prescriptions, inappropriate promotion of medicines, biased information of medicine, overwork of health personnel, profit motives from selling medicines, and health insurance coverage have been implied to be factors influencing irrational medicine use in the literature.5,11,12
The World Health Organization (WHO) has designed standardized core prescribing, patient care, and facility indicators with a set of recommended optimum values for each core indicator to ensure and promote RUM.13,14 However, as studies indicate, most developing countries have a significant gap from the World Health Organization/Network of Rational Use of Drugs (WHO/INRUD) recommendation.5,13,15–56
In developing countries, within and across LMIC, despite vulnerable population lacks essential medicine, multiple factors contribute to irrational use of medicine. It is estimated that about 60% of medicines in public health facilities and 70% of medicines in private facilities are prescribed and sold inappropriately.9 On top of geographic, economic, cultural, or other barriers which may greatly compromise access to essential medicine, a lack of regulatory enforcement, insufficient disease and treatment knowledge, and unintended effects of health and pharmaceutical system policies contribute a lot to their misuse.4,6,9
In Ethiopia, being one of the LMIC of the African region where prescribing indicators deviate significantly from the WHO/INRUD reference targets, there is still evidence of a gap in RUM.57–59 Furthermore, the key factors contributing to the irrational use of medicine are likely to change over time, and policymakers need to be up-to-date with current trends.11 A regular and timely evaluation of the rational use of medicine is very essential to take the necessary action by any concerned stakeholders. Timely evidence of RUM in health center (HC)s around Gondar is lacking. Although a study at the University of Gondar comprehensive specialized hospital showed a problem in the RUM, extrapolating the evidence to HCs around Gondar may not be possible due to the difference in the level of care.60 So, this study aimed at evaluating the rational use of medicine using WHO/INRUD core drug use indicators at Teda and Azezo HCs of Gondar town, northwest Ethiopia. This study may help to promote RUM by providing important timely information for all interested parties involving in the promotion of RUM, especially in the HCs.
Materials and Methods
Study Design and Setting
A cross-sectional study was conducted to evaluate the rational use of medicine using WHO/INRUD core drug use indicators at Teda and Azezo HCs from May 01/2019 to April 30/2020. The two HCs are located in the central Gondar administrative zone, Amhara national regional state, which is about 750 km far from the northwest of Addis Ababa (the capital city of Ethiopia). According to the 2015 official population projection of major cities in Ethiopia, Gondar town has around 323,900 populations.61 Currently, there are one public comprehensive specialized hospital and 8 public HCs in Gondar town. Among these public health institutions, Azezo and Teda HCs are found in Gondar town Keble 20 and 21, respectively. According to the HCs statistics and information office record, the HCs provide outpatient, inpatient, and emergency care services for about 85,000 population of the catchment area (69,000 in Azezo) and (16,000 in Teda). On average, Azezo HC serves around 1600 patients per month, whereas Teda HCs serves about 1200 patients per month. The Azezo HC gives services for larger populations in the catchment area above the current standards of Ethiopian’s three tire health care system hierarchies. The standard states that an HC can serve about 25,000 people in rural and 40,000 people in urban areas. Each HF has 3 health officers, 8 nurses, 4 pharmacy professionals, 4 laboratory professionals, and 1 environmental health professional.
Source and Study Population
All outpatient medicine prescription encounters at Teda and Azezo HCs were the source population, whereas those who attended the outpatient pharmacy with outpatient medicine prescription encounters in the study period were considered as a study population.
Inclusion and Exclusion Criteria
All outpatient medicine prescription encounters with at least one medicine were considered as inclusion criteria, whereas prescribing encounters that are illegible or those containing medical supplies only were excluded during the sampling process. Also, prescribing encounters for normal delivery services, referral cases, routine vaccines, and contraceptives were excluded from the study.
Sample Size Determination and Sampling Techniques
According to the WHO/INRUD guideline for assessing RUM in outpatient departments of healthcare settings, at least 600 prescribing encounters can be considered for assessment of prescribing practice for single healthcare setting.16 Therefore, to imitate the guideline, 600 prescribing encounters from each HC were taken from a total of 33,600 prescriptions, 19, 200 (in Azezo HC) and 14,400 (in Teda HC). Systematic random sampling was applied, every K= 32 at Azezo HC and K= 24 at Teda HC, to obtain 1200 (600 from each HC) prescription papers once sampling frame has been developed by arranging the study population in chronological order of prescription from May 01/2019 to April 30/2020.
For patient care indicators, as per the WHO/INRUD guideline, at least 30 patient encounters can be included in outpatient departments of a health care facility.16 Thus, 30 patients comprising different disease states and age groups were selected randomly at mid days of working hours from each health facility by using a convenient sampling method. A total of 60 patients were engaged in the actual study.
For facility-specific indicators, 24 key medicines were listed in each HC, and updated bin cards of those key medicines were observed and checked for the availability of key medicines in the health facility during data collection time.
Variables of the Study
The variables of this study were the rational use of medicine using WHO/INRUD core drug use indicators. Under prescribing indicators: number of medicines per encounter, medicines prescribed by generic name, percent encounters with an antibiotic and an injection prescribed, and percent of medicines prescribed from the EML or formulary of the facility; under patient care indicators: consultation and dispensing time, medicines actually dispensed, adequacy of labeling, and patient’s knowledge of correct dosage; for health facility indicators: Availability of standard guideline (STG) or formulary, facility EML and key medicines in the facility.5 In addition, the socio-demographic variables: age, sex, and level of education were included.
Data Collection Tool and Procedures
The data were collected by two pharmacists using a standard data collection checklist which was prepared considering the WHO/INRUD recommendations.13,16 The data for the prescribing indicators were extracted retrospectively from prescription papers. The data for patient care and facility-specific indicators were collected prospectively. For the facility-specific indicators, 24 key medicines that were selected based on the national list of essential medicines for Ethiopia, fourth edition, were checked for their availability in the institutions.62 These medicines were chosen to reflect the current disease burden of Ethiopia for both communicable and non-communicable diseases. The data collection checklist was pre-tested for consistency and completeness of data items on 5% (60 prescription paper and 5 patients) of the study subjects at Poly HC. The data collected for the purpose of the pretest were not included in the final analysis.
Data Quality Control
The data collection tool had been pretested, and the data collectors and supervisors had been trained on the objectives of the study, the contents of the questionnaire, and issues related to confidentiality before the start of data collection. The data collection was supervised frequently.
Data Processing, Analysis, and Interpretation
After completion of data collection, the data were checked for completeness and consistency. Also, it was cleaned for possible errors. When there was an error, data were corrected by cross-checking with the data on the data abstraction format using the original ID variable immediately. The data were entered into and analyzed using the SPSS® (IBM Corporation) version 24. The analysis was made by using descriptive statistics such as mean, frequency, and proportion; the 95% confidence interval and standard deviation were used where they are appropriate. The findings were interpreted according to national and international standards as described below.5,13,16,62–64
Prescribing Indicators
The average number of drugs prescribed per encounter: Its purpose was to measure the degree of polypharmacy. It was calculated by dividing the total number of different drug products prescribed by the number of encounters surveyed.
Percentage of drugs prescribed by generic name: Its purpose was to measure the tendency of prescribing by generic name. It was calculated by dividing the number of drugs prescribed by generic name by the total number of drugs prescribed, multiplied by 100 percentage of encounters with an antibiotic prescribed: its purpose was to determine the commonly costly and overused forms of treatment. It was calculated by dividing the number of encounters in which an antibiotic was prescribed by the total number of encounters surveyed, multiplied by 100.
The proportion of prescriptions with an injection ordered: Its purpose was to determine the commonly costly and overused forms of treatment. The percentage was computed by dividing the number of encounters during which an injection was ordered by the whole number of encounters evaluated and multiplied by one hundred percent.
Percentage of drugs prescribed from an essential drug list (EML): Its purpose was to measure the degree to which practices imitate a national drug policy as indicated in the national medicine list of Ethiopia. The percentage is calculated by dividing the number of products prescribed which are in the essential drug list by the total number of drugs prescribed, multiplied by 100.
Patient Care Indicators
Average consultation time: Its purpose was to determine the time that medical personnel spend with patients during the consultation and prescribing. It was computed by dividing the total time for consecutive consultations in minutes by the number of consultations.
Average dispensing time: Its purpose was to measure the time between arriving at the outpatient pharmacy encounter and leaving. It was computed by dividing the total time for dispensing medicines to a sequence of patients in seconds by the number of encounters.
Percentage of drugs actually dispensed: Its purpose was to measure the capacity to which the health centers are able to dispense the medications which were ordered. It was calculated by dividing the total number of medicines actually dispensed at the health centers by the whole number of medicines prescribed and multiplied by 100%.
Percentage of drugs adequately labeled: Its purpose was to determine the degree to which pharmacists write crucial drug information on the drug packages they dispense. The percentage was calculated by dividing the number of medicine packages consisting of at least the patient name, medicine name, and frequency of administration to the total number of medicine packages and multiplied by 100%.
Patients’ knowledge of the correct dosage: Its purpose was to determine the effectiveness of the information given to patients on the dosage schedule of the medicines they receive. The percentage was computed by dividing the number of patients who can correctly recall the dosage schedule for entire medicines by the whole number of patients interviewed and multiplied by 100%.
Facility Specific Indicators
Availability of copy of EML/Formulary and a copy of the STG: Its purpose was to indicate the degree to which a copy of EML/Formulary and a copy of the STG are available at the health centers.
The percentage availability of essential medicines: Its purpose was to measure the availability at the health centers of essential medicines for the treatment of common diseases. It was calculated by dividing the number of specified products actually in stock by the total number of drugs on the checklist, multiplied by 100.
Operational Definitions
Antibiotics: Drugs such as penicillins, antibacterials, antiinfective dermatological drugs, and anti-infective ophthalmologic agents, antidiarrheal drugs with streptomycin, neomycin, and metronidazole are considered antibiotics when used in the context of antibiotics.
Key medicines are selected items of medicine that should always be available in the institutions that were selected based on the national list of essential medicines for Ethiopia, fourth edition.62
Percent of patients with knowledge of correct dosage is patient’s knowledge of all the name, dose, frequency, duration, and reason or indication of the dispensed medicines correctly.
Ethical Considerations
Ethical approval was obtained from the research and ethics committee of the school of pharmacy, the University of Gondar with a reference number SOP/785/2020. A formal letter of cooperation was obtained from the head of each health facility to access essential data for the purpose of the study. This study was conducted in accordance with the Declaration of Helsinki, and following all methods in accordance with the relevant guidelines and regulations. For using prescription and observing the patient care indicators, consent was waived from the heads of each health facility. However, written consent had been received from all participants before data collection was started. During the consent process, we provided information for the study participants regarding the purpose of the study, why and how they were selected to involve in the study, and they had the right to not participate and could withdraw from the study at any time if they were not interested. They were all assured that their care would not be affected in any way due to refusing consent to participate in the study. Participants were also assured of the confidentiality of the information obtained in the course of this study by using unique codes to avoid personal identifiers. The collected data were kept in a locked cabinet and accessed by the investigators only for the purpose of the study. Participants with inadequate knowledge were advised on how to take their medication correctly.
Results
Prescribing Indicators
In this study, a total of 2595 medicines were prescribed in 1200 prescriptions at Azezo (600 prescriptions) and Teda (600 prescriptions) HCs. Prescribing practice according to WHO/INRUD core medicine prescribing indicators showed that the average number of medicines prescribed per prescription encounter was 2.16, ranging from 1 to 5, and around 50% of prescription contains two medicines. The percent of encounters with antibiotics and injection was 73.85% (95% CI = 71.4, 76.3) and 9.5% (95% CI = 7.8, 11.1), respectively. The practice of prescribing using the generic name of the medicine was 94% (95% CI = 93, 95). All (100%) prescriptions were made from the EML (Tables 1 and 2).
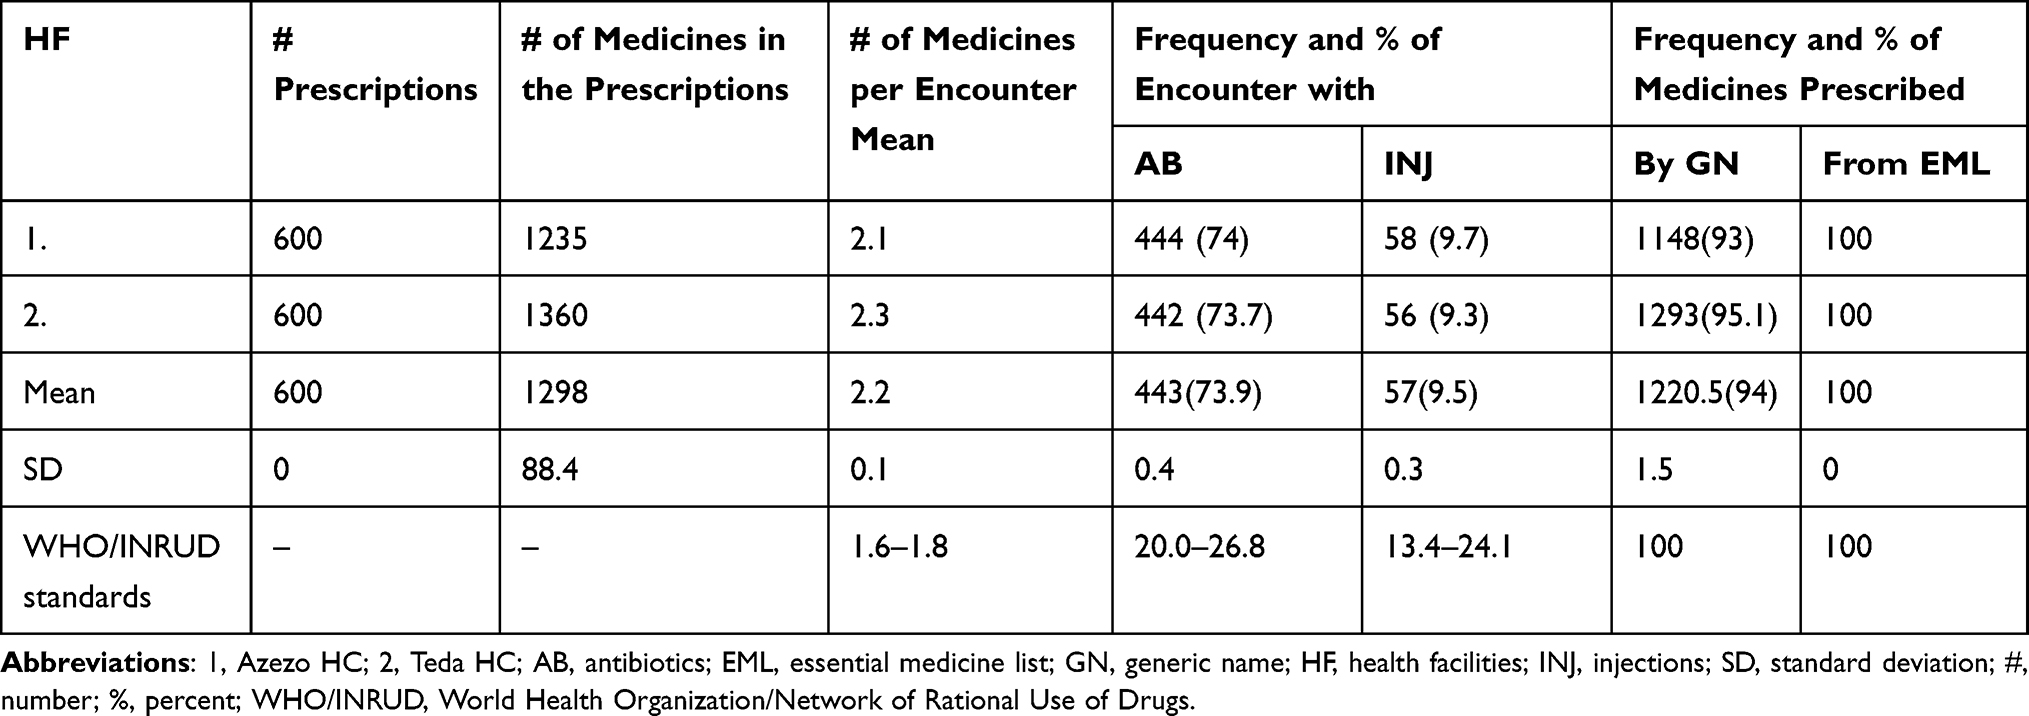 |
Table 1 WHO/INRUD Prescribing Indicators at Teda and Azezo Health Centers in Gondar Town, Northwest Ethiopia, from May 01/2019 to April 30/2020 |
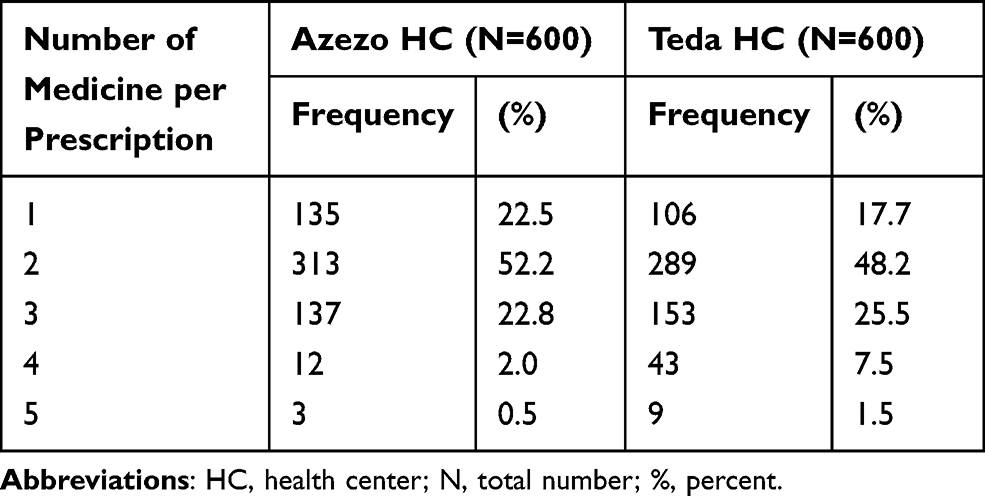 |
Table 2 The Number of Medicines per Prescription at Teda and Azezo Health Centers in Gondar Town, Northwest Ethiopia, from May 01/2019 to April 30/2020 |
Patient Care Indicators
To assess the patient care indicators, a total of 60 patients, 33 (55%) males and 27 (45%) females, were interviewed about the name, dose, frequency, duration of use, and quantity of the medicine received from the pharmacy upon leaving the dispensing unit of the HCs. About 93.4% of the patients were in the age group of 18–64, and 21.67% of patients had no formal education (Table 3).
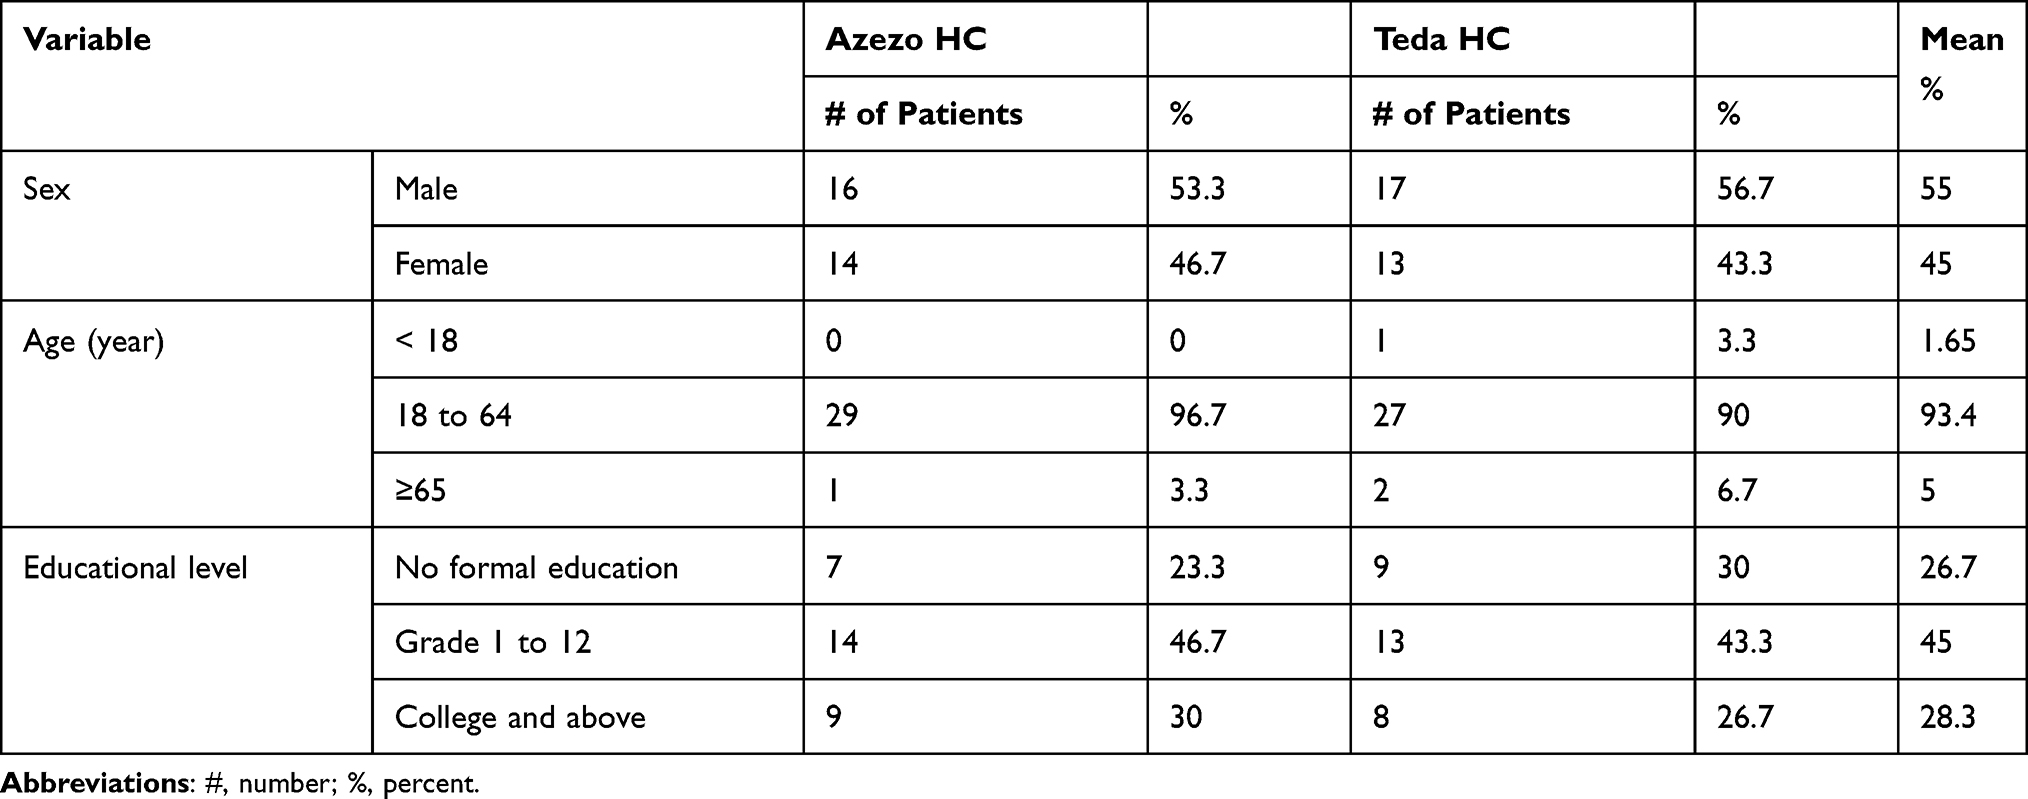 |
Table 3 Socio-Demographic Information of Patients at Teda and Azezo Health Centers in Gondar Town, Northwest Ethiopia, from April 14–28/2020 |
Out of 149 prescribed medicines, 115 (77.18%; 95% CI = 69.60, 83.65) of them were actually dispensed (Table 4). However, the mean percentage of patients with knowledge of correct dosage of dispensed medicines was only 16.7% (95% CI = 7.0, 20.9), 11.9% at Azezo, and 21.4% at Teda HCs (Table 4 and Figure 1). The average consultation time, dispensing time, and % of medicines adequately labeled were 5.35 minutes, 40.24 seconds, and 17.5% (95% CI = 10.96, 25.57), respectively (Table 4). The adequacy of labeling of complete information was 17.5%, 15.3% at Azezo HC, and 19.6% at Teda HC (Tables 4 and 5).
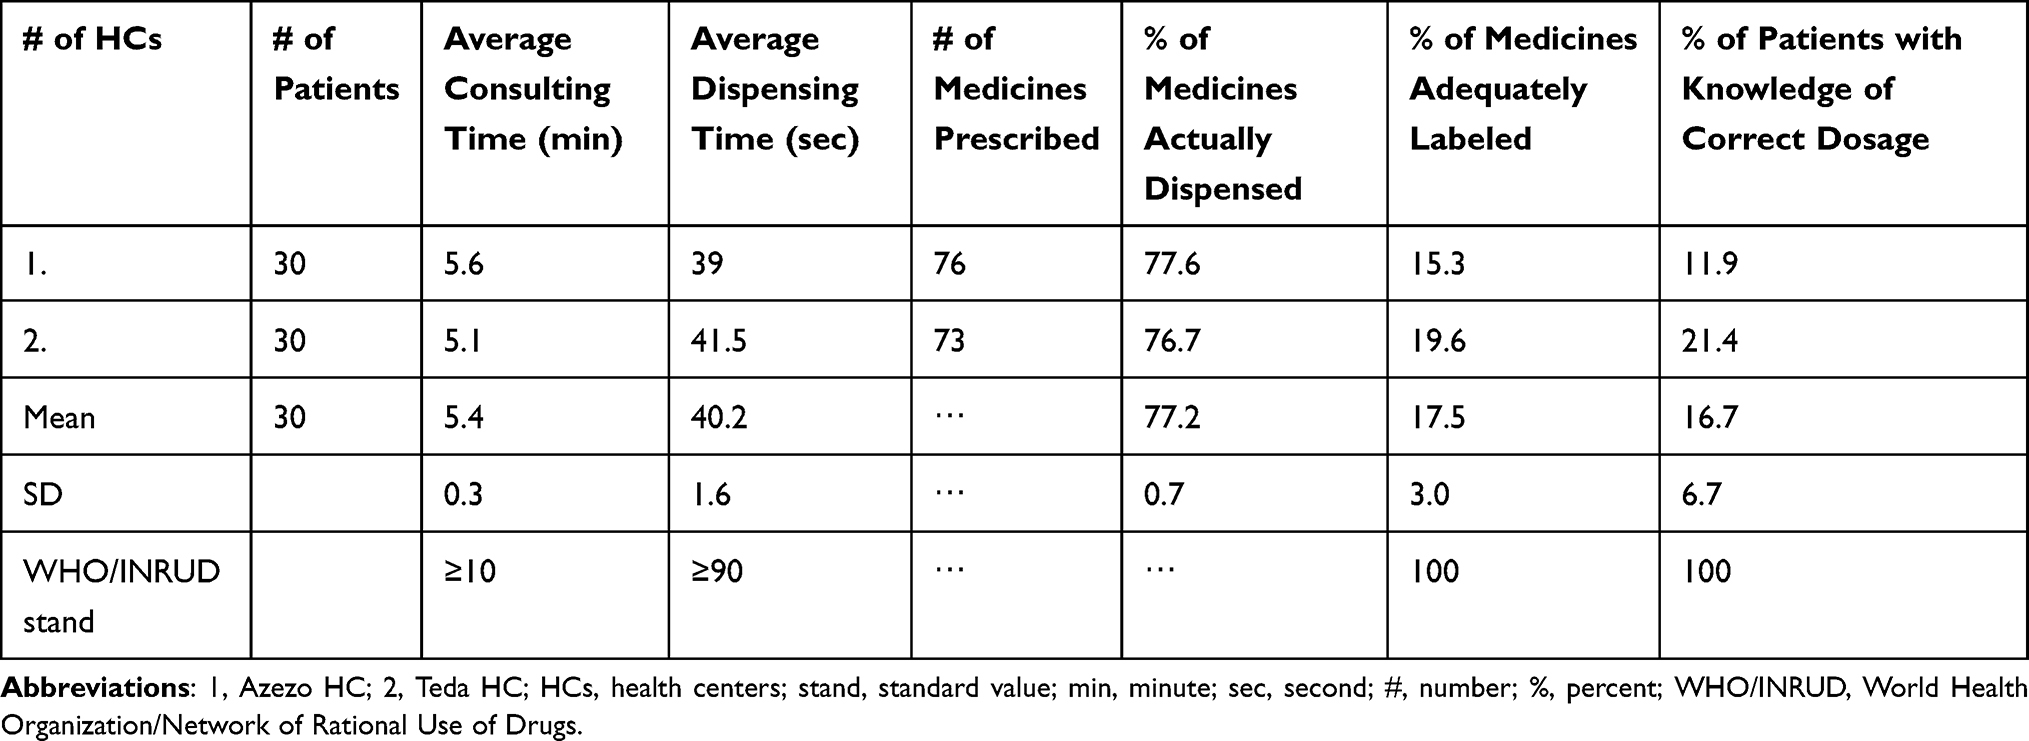 |
Table 4 WHO/INRUD Patient Care Indicators at Teda and Azezo Health Centers in Gondar Town, Northwest Ethiopia, from April 14–28/2020 |
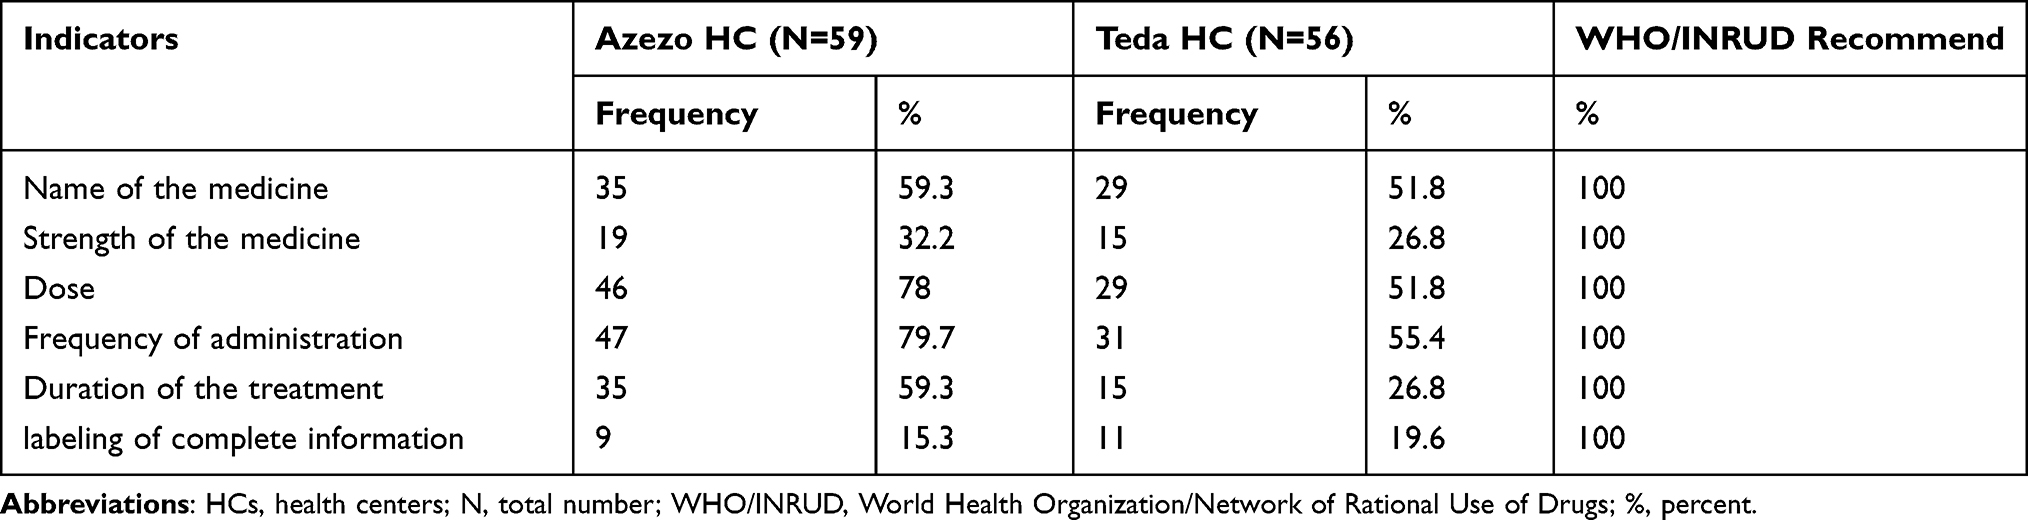 |
Table 5 Labeling Pattern of Dispensed Medicines at Teda and Azezo Health Centers in Gondar Town, Northwest Ethiopia, from April 14–28/2020 |
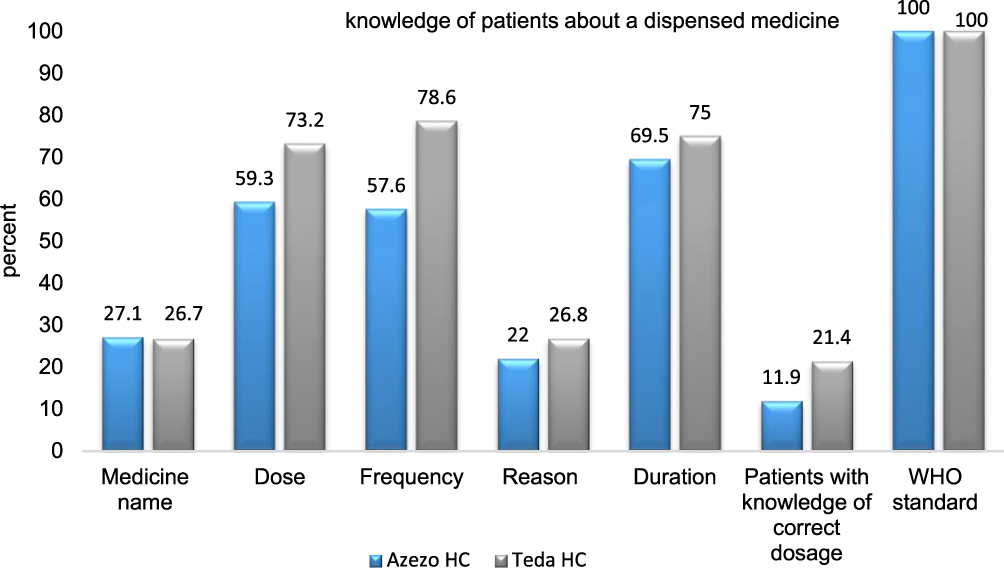 |
Figure 1 Patient knowledge on dispensed drugs at Teda and Azezo HCs in Gondar Town, Northwest Ethiopia, from April 14–28/2020 (N=30 of each HC). |
Facility-Specific Indicators
Both HCs had their own facility-specific essential medicine list, copy of national EML, and STG for HCs at the time of the study. A shortlist of twenty-four key medicines used to treat common health problems was made, and the availability of these medicines in the pharmacy was assessed. Availability of these key medicines was 87.5% (95% CI = 67.94, 97.34) and 79.5% (95% CI = 57.85, 92.87) in Azezo and Teda HCs, respectively. Magnesium sulfate injection and tetanus antitoxin were not available in both health facilities. In addition, a zinc dispersible tablet was not available in Azezo HC, whereas adrenaline injection, dextrose 5% in normal saline, and gentamicin sulfate injection were not available in Teda HC (Table 6).
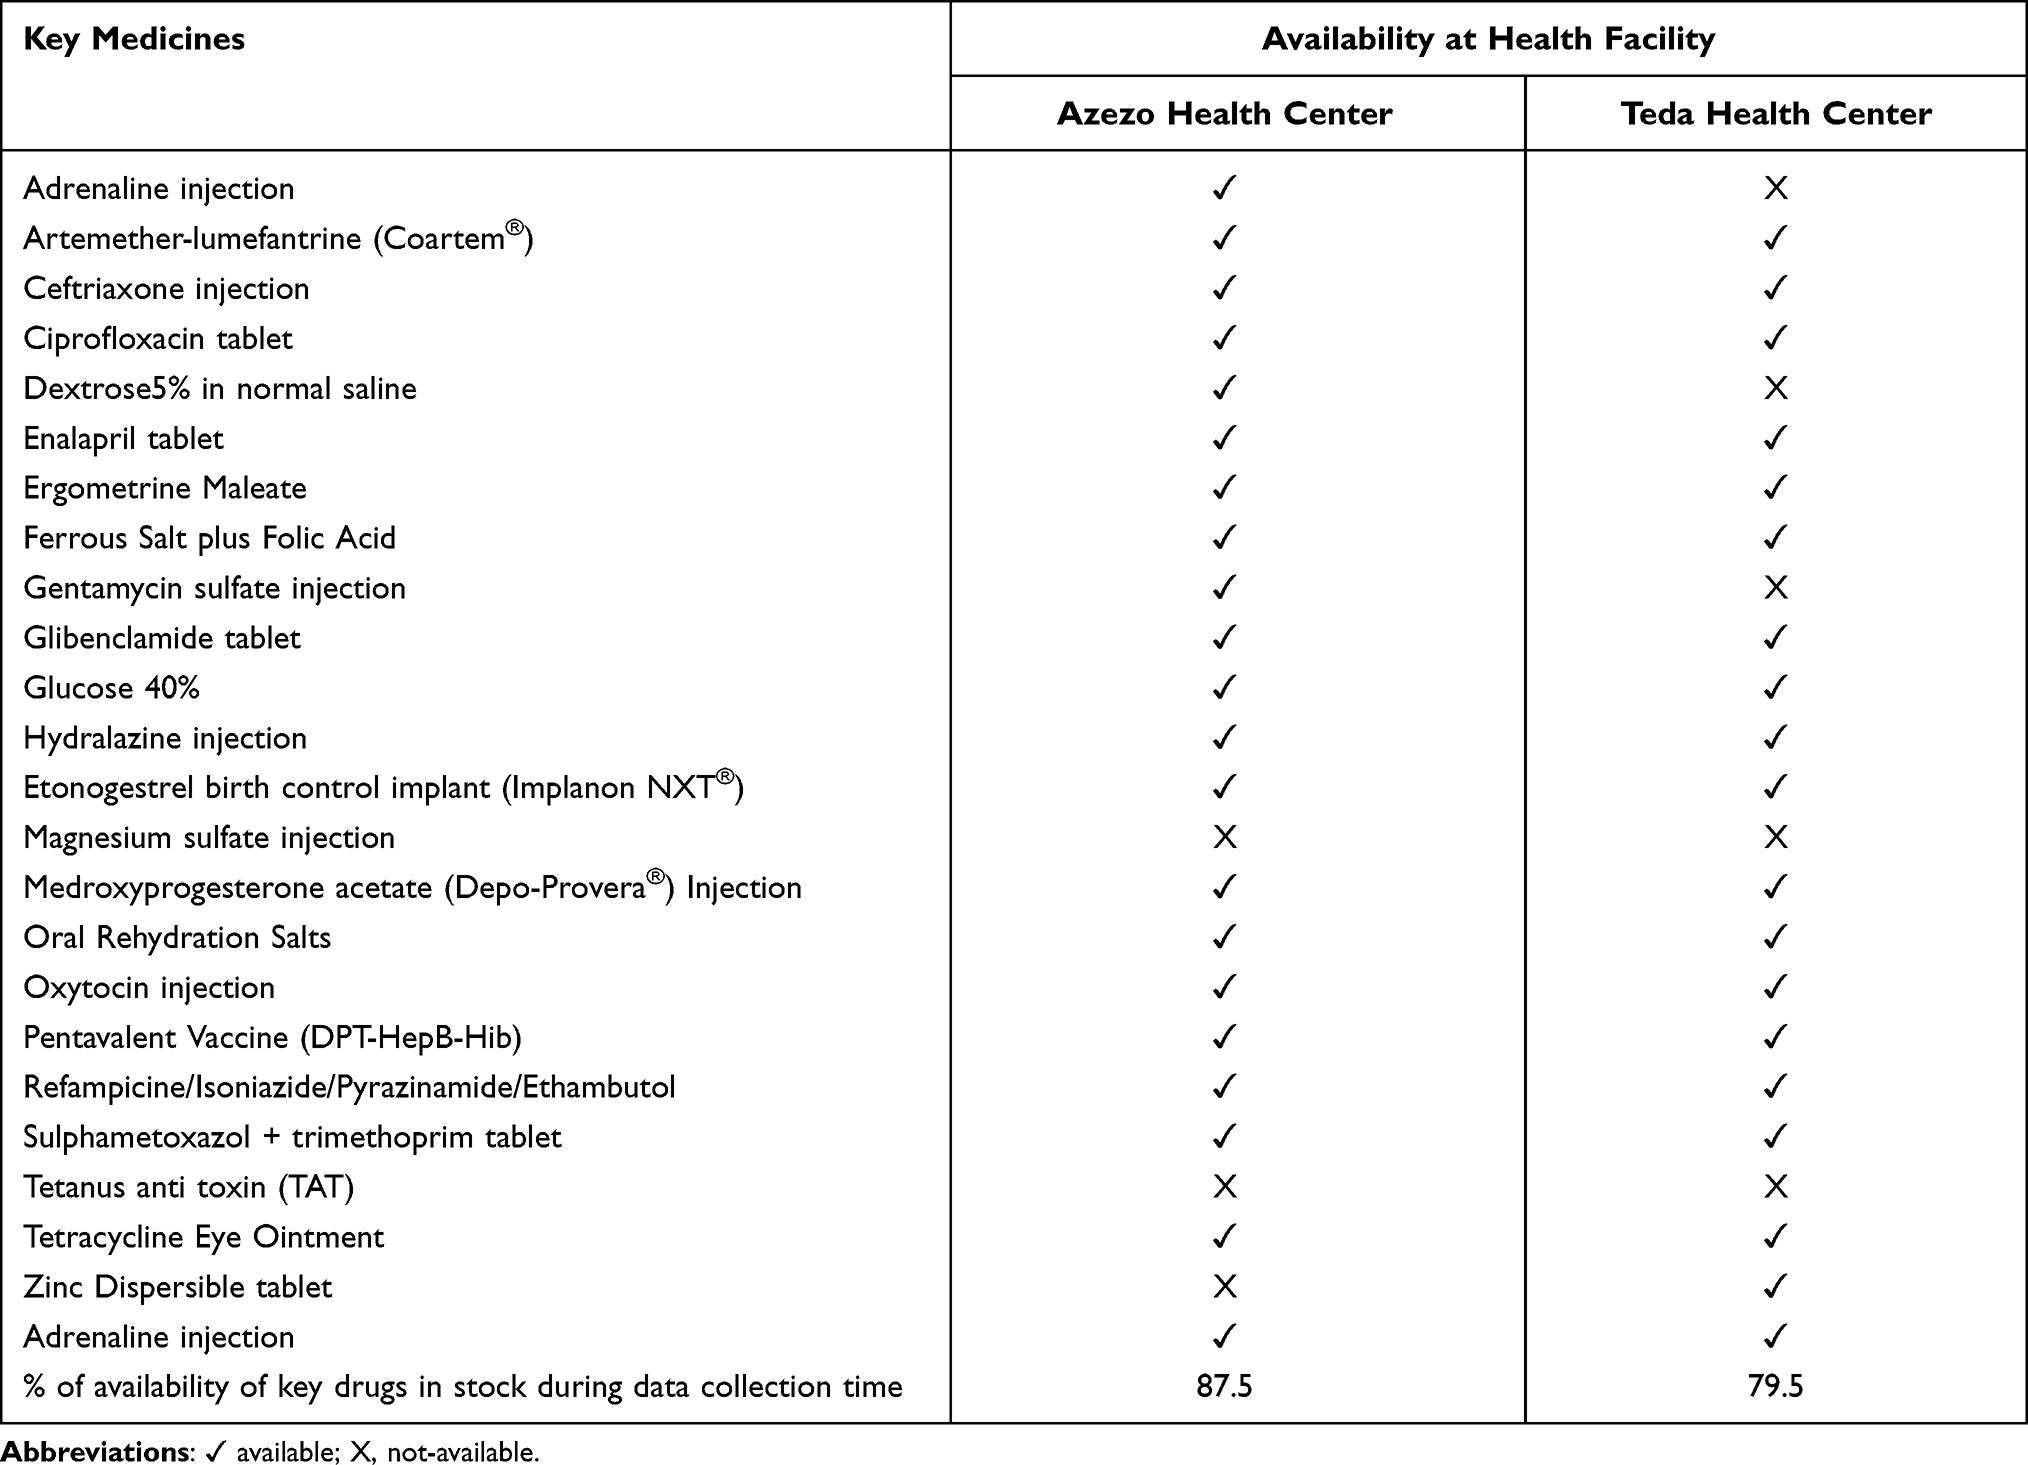 |
Table 6 Availability of Key Medicines in the Two Health Centers of Gondar Town Ethiopia, April 14–28/2020 |
Discussion
This study was aimed at evaluating the RUM using the WHO/INRUD core drug use indicators at Azezo and Teda HCs in Gondar town, northwest Ethiopia.
Prescribing Indicators
This study revealed that the average number of medicine per prescription was 2.16 (2.06 in Azezo HC and 2.27 in Teda HC). This value is slightly higher when compared with the ideal value (1.6–1.8) or less than 2.5,14,65 Similarly, higher results were recorded in studies from different parts of Ethiopia (ranging from 1.9 to 3),22,24–31 and other developing countries (ranging from 2.30 to 3.98).32,34,35,37,40,43,44,46,48,49,54 On the contrary, the average number of medicines per prescription within the acceptable range was reported by other studies from Ethiopia (ranging from 1.65 to 1.8).17,18,36 The prescription of many medicines for a patient may decrease adherence to treatment, increase the cost of medicine incurred by the patient, elevate the risk of drug interaction, and expose the patient to unnecessary potential side effects of the medication. For this, adhering to the WHO/INRUD recommendation should obtain attention in the institution.
The percentage of antibiotics prescribed per encounter was 73.85% (95% CI = 71.2, 74.3) which is more than 2 times the optimal value (20.0%-25.4%).5,14,65 This agrees with the study done at Debre Markos Referral Hospital, Northern Ethiopia (71.36%).66 Similarly, higher values were reported by several previous studies in Ethiopia (ranging from 27.62% to 82.5%)22–31,36 and other developing countries (ranging from 35.3% to 84.8%).32,35,37–41,47–49,51,54 Although the high use of antibiotics may be due to the prevalent nature of the infectious disease in developing countries, it should be given attention since it may increase the risk of antibiotic resistance.
The percentage of injection use was found to be 9.5 (95% CI = 7.8, 11.1) which is comparable to the ideal value (10.1%-17.0%).14,65 In the same way, within the WHO/INRUD optimum value or even lower results were reported by different studies done in Ethiopia (ranging from 3.6% to 23.6%),22–31,36 and many other developing countries (ranging from 0% to 19.25%).37–42,44,46,48–51,53 However, a higher value was reported by the study done at Gondar University Teaching Referral Hospital (28.5),18 Tikur Anbessa Specialized Hospital (53.1),29 Hawassa University Teaching and Referral Hospital (38.1%),20 Dilchora Referral Hospital (44.77%),21 Debre Markos Referral Hospital (48.36%),66 and Mekelle General Hospital (42.2%) in Ethiopia;27 Khartoum State, Sudan (57.6%),35 and Nashik, India (50.83%).54 The difference may be due to the difference in the level of care of the institution. Even though injections are important formulations in certain emergency situations due to their fast onset of action, when other alternatives are not feasible, they have their own drawbacks including the risk of transmission of blood-borne infection and increased extra out-of-pocket expenditure. The HCs in the case of this study should maintain the current good practice in prescribing injection within the WHO/INRUD recommended optimum values.
The percentage of medicines prescribed by generic name at both HCs was 94%; it is lower than the ideal expectation which requires 100% of medicine prescription to be generic.14,65 Similarly, prescription of medicine by generic name is below the optimal value in most of the previous studies in different parts of Ethiopia (ranging from 79.2%to 99.25%),22–31,36 and many other developing countries (ranging from 0% to 95.4%).32,34,37,43,44,46–49,52,53,55 However, results per the WHO/INRUD expectation were obtained in the study done at West Shewa Zone, Oromia, Ethiopia (100%)17 and at 4 different emirates, UAE (100%).50 In low-income countries like Ethiopia where resources are often scarce, generic prescribing substantially reduces the cost of medicine paid by patients as well as the cost of medicine incurred by facilities because generics are relatively affordable, accessible, and recallable compared to brand counterparts.
In this study, the percentage of prescribed medicines from EML was 100% which is in line with the accepted value (100%).14,65 Consistent results with this study were reported in the studies done at West Shewa Zone, Oromia, Ethiopia (100%);17 Ayder referral hospital, northern Ethiopia (100%),31 and at 4 different emirates in the United Arab Emirates (UAE) (100%).50 However, the WHO/INRUD recommendation was not achieved in the most of previous studies in different parts of Ethiopia (ranging from 79.8% to 99.5%),22–31,36 and many previous study reports outside of Ethiopia (ranging from 22.57% to 98.80%).32,34,37,43,44,46,47,49,52,54,55 The prescription of medicine from the essential drug list in the facilities should be preserved since it is one of the major tools for implementing RUM. The adoption of such a list for any health facility can significantly improve the effectiveness of therapy; it decreases the amount of unwanted medicine prescription and promotes RUMs because medicines from the list are well known, already tested in practice, with established clinical use, and of lower cost than newer.67
Patient Care Indicators
This study revealed that the average consultation time was 5.35±0.31 minutes whereas previous studies mentioned that the optimal value is ≥10 minutes.35,68 Similarly, a consultation time lower than the optimal value was recorded in many previous studies done in developing countries including Ethiopia (ranging from 1.2 to 7.3 minutes).19,25,32,37,42,43,45,47,54,56 However, optimum consultation time was recorded by studies done at Debre Markos Referral Hospital, Northern Ethiopia (10.46 minutes);66 in Rural Rwanda (10.1 minutes), and western Nepal (30.33 min).33 The workload of the prescribers, the number of patients visiting the institutions, and the number of staff may affect the consultation time, so that the institutions should work on improving the consultation time.
The average dispensing time in this study was found to be 40.24±1.79 seconds, whereas previous studies mentioned that the optimal value is ≥ 90 seconds.35,68 Similarly, the average dispensing time in the studies done at Debre Markos Referral Hospital, Northern Ethiopia, was 43.69 seconds.66 Studies done in Egypt, Saudi Arabia, and India also reported that the average dispensing time of 47 seconds, 38 seconds, and 58.28 seconds, respectively.47,54,69 It is more likely to occur dispensing error when the dispensing time is too short, so that the institution should also take all necessary measures for increasing the dispensing time as well.
In this study, the percentage of medicines actually dispensed was 77.17±0.65% (optimal value of 100%).68 Similarly, the WHO/INRUD recommended value was not achieved in many previous studies done in many developing countries including Ethiopia (ranging from 56% to 97.3%).17,19,32,35,37,39,42,46,51,56 Since the availability of essential medicines in the dispensary of the institution is one of the indicators for the quality of care, all medicines should also be made available as much as possible by the institutions.
The percentage of medicines adequately labeled was very low, only 17.5% of medicines had adequately labeled on their package which is far below the standard value (100%).68 Similarly, adequacy of labeling was too low in many previous studies done in developing countries including Ethiopia (ranging from 0% to 30.4%).18,19,25,32,35,45,47,66 Since adequate labeling increases patient awareness about the regimen that he/she takes and hence increases treatment adherence and a better outcome, it has to be promoted in the institutions as well.
Only 16.7% of patients recalled the correct dosage of the medicine dispensed to them, which is lower as compared to the optimal value mentioned in previous studies (100%).35,68 Similarly, % of patients with knowledge of correct dosage lower than the recommended value were reported in the study in Southwest Ethiopia 69%;56 India (87.78%);54 Eastern Province, Saudi Arabia (79.3%);69 Pakistan (62.1%),37 and Egypt (94%).47 The reason for this decrement of patient’s knowledge of medicines dispensed to them may result from inadequate counseling and labeling. This may affect patients’ adherence to their medications which could result in poor therapeutic outcomes.
Health Facility Indicators
In this study, the percent availability of key medicines in the stock was 83.5%, which is less than the optimal value mentioned in previous studies (100%).35,68 Many of the previous studies done in different settings also reported a lower value than the WHO/INRUD recommendation ranging from 66% to 96.7%.22–26,28–31,36 The possible reasons for this could be an inadequate supply of medicines from the supplier(s), budget constraint, absence of medicines procurement policy, scheduled procurement, and a long process of acquiring from a private source for those medicines which were not available from the government supplier. So, by identifying the possible gaps, the key medicines in the stock should be available 100%, as much as possible.
EML/Formulary and a copy of the STG were available in both health facilities during the study period. Similarly, many previous studies also had these documents in their facilities.18,37,47,54,55,70,71 The availabilities of these documents can facilitate and enhance the delivery of better health care for patients at the facilities. Therefore, the institution should keep the current good practice of having an EML/Formulary and a copy of the STG.
Limitations of the Study
Despite this study tried to encompass the prescribing indicators, the lower sample size of the patient care and facility-specific indicators may limit the generalizability of these specific components to the general population.
Conclusion
According to the WHO/INRUD core drug use indicators, rational medicine use is not achieved in terms of most components of the prescribing, patient care, and facility-specific indicators. The prescription of the average number of medicines, the percentage of encounters with antibiotics, and the prescription of medicines using the generic name of the medicine is less than the WHO/INRUD recommendations. Similarly, actually dispensing of the prescribed medicines, the knowledge of the patients on the dispensed medicines, average consultation time, dispensing time, percent of medicines adequately labeled, and availability of the key medicines are less than the WHO/INRUD expectation. The only variables that comply with WHO/INRUD core drug use indicators were percent encounter with injection, prescribing from EML, and availability of the copy of EML/Formulary and STG.
Recommendation
The HCs should work towards promoting RUM by devising effective intervention strategies. The health professionals working in the HCs should be updated and refreshed by giving regular training on the issues of rational use of medicine. The key medicine should be made available in the store throughout the year. Also, continuous monitoring and assessment should be done to identify gaps and act accordingly. Furthermore, a qualitative study may help to identify the background reasons for irrational prescriptions in the HCs.
Data Sharing Statement
The authors confirm that data used to support the finding of this study will be available from the corresponding author upon request.
Acknowledgment
Moreover, we would like to express our special thanks to the data collectors, the participants, and the health professionals working in both Azezo and Teda HCs for their sincere cooperation.
Author Contributions
All authors made a significant contribution to the work reported, whether that is in the conception, study design, execution, acquisition of data, analysis and interpretation, or in all these areas; took part in drafting, revising or critically reviewing the article; gave final approval of the version to be published; have agreed on the journal to which the article has been submitted; and agree to be accountable for all aspects of the work.
Funding
This research is self-sponsored. No external fund was received by any of the authors.
Disclosure
The authors declare that they have no competing interests.
References
1. Wagner AK, Quick JD, Ross-Degnan D. Quality use of medicines within universal health coverage: challenges and opportunities. BMC Health Serv Res. 2014;14(1):1–6. doi:10.1186/1472-6963-14-357
2. Ahmadiani S, Nikfar S. Challenges of access to medicine and the responsibility of pharmaceutical companies: a legal perspective. DARU J Pharmaceutical Sci. 2016;24(1):13.
3. Aitken M, Kleinrock M, Simorellis A, Nass D. The Global Use of Medicine in 2019 and Outlook to 2023: Forecasts and Areas to Watch. NC, USA: IQVIA Institute; 2019.
4. Bigdeli M, Peters DH, Wagner AK; Organization WH. Medicines in Health Systems: Advancing Access, Affordability and Appropriate Use. 2014.
5. World Health Organization. Promoting Rational Use of Medicines: Core Components. Geneva: World Health Organization; 2002.
6. World Health Organization. The World Medicines Situation. World Health Organization; 2004.
7. Holloway K, Van Dijk L. The World Medicines Situation 2011. Rational Use of Medicines. Geneva: WHO; 2011.
8. World Health Organization. Problems of Irrational Drug Use: Session Guide. Geneva: WHO; 2010.
9. Hogerzeil HV. Promoting rational prescribing: an international perspective. Br J Clin Pharmacol. 1995;39(1):1–6.
10. Holloway KA. Combating inappropriate use of medicines. Expert Rev Clin Pharmacol. 2011;4(3):335–348.
11. Ofori-Asenso R, Agyeman AA. Irrational use of medicines—a summary of key concepts. Pharmacy. 2016;4(4):35.
12. Mao W, Vu H, Xie Z, Chen W, Tang S. Systematic review on irrational use of medicines in China and Vietnam. PLoS One. 2015;10(3):e0117710.
13. World Health Organization. WHO: Introduction to Drug Utilization Research/WHO International Working Group for Drug Statistics Methodology, WHO Collaborating Centre for Drug Statistics Methodology, WHO Collaborating Centre for Drug Utilization Research and Clinical Pharmacological Services. Geneva: WHO; 2003.
14. Isah A, Laing R, Quick J, et al. The development of reference values for the WHO health facility core prescribing indicators. West Afr J Pharmacol Drug Res. 2001;18:6–11.
15. Holloway K. Promoting rational use of medicines. Contact Publication of World Council of Churches. 2006;183:2–3.
16. World Health Organization. How to Investigate Drug Use in Health Facilities: Selected Drug Use Indicators. Geneva: World Health Organization;1993.
17. Gebramariam E, Ahmed M. Evaluation of rational medicine use based on WHO core drug use indicators in public hospitals in West Shoa Zone, Oromia, Ethiopia. Adv Pharmacoepidemiol Drug Saf. 2019;8(1):2167–1052.2168.
18. Admassie E, Begashaw B, Hailu W. Assessment of drug use practices and completeness of prescriptions in Gondar University Teaching Referral Hospital. Int J Pharm Sci Res. 2013;4(1):265.
19. Mariam AH, Raghavendra Y, Bobasa EM. Evaluating rational drug use with the help of World Health Organization’s core indicators in Bule Hora Hospital, Southern Ethiopia. encounters. 2015;7(8):11.
20. Desalegn AA. Assessment of drug use pattern using WHO prescribing indicators at Hawassa University teaching and referral hospital, south Ethiopia: a cross-sectional study. BMC Health Serv Res. 2013;13(1):1–6.
21. Mishore KM, Bekele NA, Yirba TY, Abone TF. Evaluation of drug use pattern in emergency department of Dilchora Referral Hospital, Dire Dawa, Ethiopia. Emerg Med Int. 2020;2020.
22. Lenjisa JL, Fereja TH. A retrospective analysis of prescribing practices through WHO prescribing indicators at four selected hospitals of West Ethiopia. J Bioanal Biomed. 2014;6(2):29.
23. Sisay M, Mengistu G, Molla B, Amare F, Gabriel T. Evaluation of rational drug use based on World Health Organization core drug use indicators in selected public hospitals of eastern Ethiopia: a cross sectional study. BMC Health Serv Res. 2017;17(1):1–9.
24. Wubetu M, Derebe D, Mulaw T, Yimer T, Hailu G Assessment of drug prescription pattern in two district hospitals, Northwest Ethiopia. 2018.
25. Mensa M, Tadesse T, Ayele A. Assessment of drug use pattern by using WHO Core drug use indicators at public hospitals in Ethiopia. J Community Med Health Educ. 2017;7(559):2161–0711.1000559.
26. Mamo DB, Alemu BK. Rational drug-use evaluation based on World Health Organization core drug-use indicators in a tertiary referral hospital, Northeast Ethiopia: a cross-sectional Study. Drug Healthc Patient Saf. 2020;12:15.
27. Yilma Z, Liben M. Assessment of drug prescription pattern in Mekelle General Hospital, Mekelle, Ethiopia, Using World Health Organization Prescribing Indicators. Biomed Res Int. 2020;2020.
28. Summoro TS, Gidebo KD, Kanche ZZ, Woticha EW. Evaluation of trends of drug-prescribing patterns based on WHO prescribing indicators at outpatient departments of four hospitals in southern Ethiopia. Drug Des Devel Ther. 2015;9:4551.
29. Assefa T, Abera B, Bacha T, Beedemariam G. Prescription completeness and drug use pattern in the University Teaching Hospital, Addis Ababa, Ethiopia. J Basic Clin Pharm. 2018;9:4.
30. Dessie B, Atalaye G, Diress E, Getahun A. Practice towards rational drug use at Finotselam and Asirade Zewudie Hospitals based on WHO core drug use indicators, Northwest Ethiopia. Sci World J. 2020;2020.
31. Demeke B, Molla F, Assen A, et al. Evaluation of drugs utilization pattern using WHO prescribing indicators in Ayder referral hospital, Northern Ethiopia. IJPSR. 2015;6(2):343–347.
32. Nyabuti AO, Okalebo FA, Guantai E. Examination of WHO/INRUD core drug use indicators at public primary healthcare centers in Kisii County, Kenya. medRxiv. 2020.
33. Giri S, Dulal P, Khan GM. Assessment of patient-care, facility care, and complementary drug use indicators among elderly patients in a tertiary care hospital of WESTERN NEPAL. ASSESSMENT. 2020;13:8.
34. Thapa R, Singh S. A study on medicine utilization pattern in outpatient Departments of Tertiary Care Centre In Kathmandu. Nepal Med Coll J. 2019;21(4):319–326.
35. Rabie D, Kheder SI. Assessment of prescribing and dispensing practices based on WHO core prescribing indicators in hospital and community pharmacies in Khartoum State-Sudan. J Med Inf Decision Making. 2020;1(3):1.
36. Kasahun G, Demoz G, Asayehegn A, Gebrehiwot L, Tesfay G, Desta D. Evaluation of pattern of drug use in tertiary health care setting in central Tigray Using WHO prescribing indicators. Adv Pharmacoepidemiol Drug Saf. 2020;9(228):1052–2167.
37. Atif M, Sarwar MR, Azeem M, Naz M, Amir S, Nazir K. Assessment of core drug use indicators using WHO/INRUD methodology at primary healthcare centers in Bahawalpur, Pakistan. BMC Health Serv Res. 2016;16(1):684.
38. Yuniar Y, Susyanty AL, Sari ID. Assessment of prescribing indicators in public and private primary health care facilities in Java, Indonesia. Indonesian Pharm J. 2019;7(1):55–66.
39. Lukali V, Michelo C. Factors associated with irrational drug use at a district hospital in Zambia: patient record-based observations. Med J Zambia. 2015;42(1):25–30.
40. Durga P, Abhinav P, Varun Raj K, Kishore P. Evaluation of prescribing patterns using WHO indicators at out patient Department of a Private Hospital in Warangal. IOSR J Pharm Biol Sci. 2017;12(3):1–4.
41. Bassoum O, Sougou N, Lèye M, et al. Assessment of prescribing indicators in the public and private sectors: a cross-sectional study in twenty community pharmacies in an Urban Setting, Thiès, Senegal. J Clin Med Ther. 2018;3(4):16.
42. Prasad PS, Rudra JT, Vasanthi P, Sushitha U, Sadiq MJ, Narayana G. Assessment of drug use pattern using World Health Organization core drug use indicators at Secondary Care Referral Hospital of South India. CHRISMED J Health Res. 2015;2(3):223.
43. Singh T, Banerjee B, Garg S, Sharma S. A prescription audit using the World Health Organization-recommended core drug use indicators in a rural hospital of Delhi. J Educ Health Promot. 2019;8.
44. Hussain S, Yadav SS, Sawlani KK, Khattri S. Assessment of drug prescribing pattern using world health organization indicators in a tertiary care teaching hospital. Indian J Public Health. 2018;62(2):156.
45. Jahan S, Al-Saigul AM, Hamdelsseed SA. Primary health care physicians’ prescribing patterns for children under five in Qassim, Saudi Arabia. Prim Health Care Res Dev. 2019;20.
46. Naves J, Silver LD. Evaluation of pharmaceutical assistance in public primary care in Brasília, Brazil. Revista De Saúde Pública. 2005;39(2):223–230.
47. Akl OA, El Mahalli AA, Elkahky AA, Salem AM. WHO/INRUD drug use indicators at primary healthcare centers in Alexandria, Egypt. J Taibah Univ Med Sci. 2014;9(1):54–64.
48. Farooq MA, Khan I, Haleem khan D, et al. WHO Indicators and its Compliance by General Practitioners of Lahore, Pakistan. Iranian J Pharm Sci. 2019;15(1):67–74.
49. Alkhatib AR, Batieha AM, Abdo NM, Obeidat HM, Okour AHM. Assessment of drug prescribing in Jordan using world health organization indicators. Int J Hosp Pharm. 2018;4.
50. Mahmood A, Elnour AA, Ali AAA, Hassan NA, Shehab A, Bhagavathula AS. Evaluation of rational use of medicines (RUM) in four government hospitals in UAE. Saudi Pharmaceutical J. 2016;24(2):189–196.
51. Ndukwe HC, Ogaji IJ, Sariem CN Drug use pattern with standard indicators in Jos University Teaching Hospital Nigeria. 2013.
52. Utami M, Kristina S, Zulkarnain A. Profile of prescribing practice at a referral Hospital in Indonesia using WHO Drug Use Indicators. Iranian J Pharm Sci. 2019;15(3):41–46.
53. M NO, El-Hefnawy M. Rational Use of Drugs in Egypt According to the Standard WHO Prescribing Indicators: Pilot Baseline Situational Analysis. 2017.
54. Shivgunde PP, Kodilkar AD. Investigation of drug use at primary health centres in Nashik, Maharashtra, India. Int J Res Med Sci. 2020;8(1):290.
55. Mohammed BS, Tiah SA. Medicines prescribing pattern in northern Ghana: does it comply with WHO recommendations for prescribing indicators? Afr J Pharm Pharmacol. 2019;13(6):70–75.
56. Bilal AI, Osman ED, Mulugeta A. Assessment of medicines use pattern using World Health Organization’s prescribing, patient care and health facility indicators in selected health facilities in eastern Ethiopia. BMC Health Serv Res. 2016;16(1):144.
57. Ofori-Asenso R, Brhlikova P, Pollock AM. Prescribing indicators at primary health care centers within the WHO African region: a systematic analysis (1995–2015). BMC Public Health. 2016;16(1):724.
58. Teni FS, Wubishet BL, Yimenu DK. Assessment of medicine use among outpatients at healthcare facilities in Ethiopia using the WHO’s prescribing indicators with a focus on antibiotics: a systematic review and meta-analysis. J Antimicrob Chemother. 2020.
59. Ayenew W, Asmamaw G, Getaneh A. Prescribing pattern of medications prescribed to outpatients based on WHO prescribing indicators in Ethiopia: a systematic review and meta-analysis of observational studies. Afr J Pharm Pharmacol. 2020;14(7):240–249.
60. Getahun KA, Redia AS, Aragaw TJ. Evaluation of medicine-use pattern using World Health Organization’s core drug-use indicators and completeness of prescription at University of Gondar Comprehensive Specialized Hospital, Gondar, Ethiopia: cross-sectional study. Integrated Pharm Res Pract. 2020;9:219.
61. The population of all Ethiopian all cities and towns with more than 20,000 inhabitants according to census results and latest official projections.
62. FMHACA. Manual for Medicines Good Prescribing Practice Food; Medicine and Healthcare Administration and Control Authority (FMHACA) of Ethiopia.
63. FMHACA. List of Essential Medicines for Ethiopia.
64. FMoH. Assessment of the Pharmaceutical Sector in Ethiopa. Addis Ababa, Ethiopia; 2003.
65. Dumoulin J, Kaddar M, Velasquez G. Guide to Drug Financing Mechanisms. 1998:55.
66. Desse T, Eshetie T. Assessment of drug use pattern using World Health Organisation core drug use indicators at Debremarkos Referral Hospital, Northwest Ethopia. IJIPSR. 2014;2(7):1270–1288.
67. Jabo SA, Tebeka AG, Asebe DS, et al. Assessment of medication prescription pattern at bole health center, Ethiopia. Int J. 2018;4(1):15.
68. Nyabuti AO, Okalebo FA, Guantai EM. Examination of WHO/INRUD Core Drug Use Indicators at Public Primary Healthcare Centers in Kisii County, Kenya. Advan Pharmacol Pharmaceutical Sci. 2020;2020.
69. El Mahalli A, Akl O, Al Dawood S, et al. WHO/INRUD patient care and facility-specific drug use indicators at primary health care centres in Eastern province, Saudi Arabia. Eastern Mediterranean Health J. 2012;18(11);1086–1090.
70. Altebainawi AF, Aljofan M, Alrashidi MN, Alshammari TM. Completeness of medication prescriptions: prescription errors study in Hail region, Saudi Arabia (PeSHR). J Evi Based Psychother. 2019.
71. Berha AB, Seyoum N. Evaluation of drug prescription pattern using world health organization prescribing indicators in tikur anbessa specialized hospital: a cross–sectional study. J Drug Delivery Ther. 2018;8(1):74–80.
 © 2021 The Author(s). This work is published and licensed by Dove Medical Press Limited. The full terms of this license are available at https://www.dovepress.com/terms.php and incorporate the Creative Commons Attribution - Non Commercial (unported, v3.0) License.
By accessing the work you hereby accept the Terms. Non-commercial uses of the work are permitted without any further permission from Dove Medical Press Limited, provided the work is properly attributed. For permission for commercial use of this work, please see paragraphs 4.2 and 5 of our Terms.
© 2021 The Author(s). This work is published and licensed by Dove Medical Press Limited. The full terms of this license are available at https://www.dovepress.com/terms.php and incorporate the Creative Commons Attribution - Non Commercial (unported, v3.0) License.
By accessing the work you hereby accept the Terms. Non-commercial uses of the work are permitted without any further permission from Dove Medical Press Limited, provided the work is properly attributed. For permission for commercial use of this work, please see paragraphs 4.2 and 5 of our Terms.