")
Back to Journals » Clinical Ophthalmology » Volume 14
Evaluation of Potential Pain Biomarkers in Saliva and Pain Perception After Corneal Advanced Surface Ablation Surgery
Authors Sobas EM , Vázquez A, Videla S , Reinoso R, Fernández I, Garcia-Vazquez C, Maldonado MJ , Pastor JC
Received 1 August 2019
Accepted for publication 28 January 2020
Published 3 March 2020 Volume 2020:14 Pages 613—623
DOI https://doi.org/10.2147/OPTH.S225603
Checked for plagiarism Yes
Review by Single anonymous peer review
Peer reviewer comments 3
Editor who approved publication: Dr Scott Fraser
Eva M Sobas,1,2 Amanda Vázquez,1,2 Sebastián Videla,3 Roberto Reinoso,1,4,5 Itziar Fernández,1,5 Carmen Garcia-Vazquez,1 Miguel J Maldonado,1,6 J Carlos Pastor1,6,7
1IOBA Eye Institute, University of Valladolid, Valladolid, Spain; 2Nursery Faculty, University of Valladolid, Valladolid, Spain; 3Clinical Research Support Unit, Clinical Pharmacology Department, Bellvitge University Hospital/Bellvitge Biomedical Research Institute (IDIBELL)/University of Barcelona, L’Hospitalet de Llobregat, Barcelona; 4Visión I+D, University of Valladolid, Valladolid, Spain; 5Biomedical Research Networking Center in Bioengineering, Biomaterials and Nanomedicine (CIBER-BBN), Valladolid, Spain; 6Department of Surgery, Ophthalmology, Otorhinolaryngology and Physiotherapy, Faculty of Medicine, University of Valladolid, Valladolid, Spain; 7Department of Ophthalmology, Hospital Clínico Universitario, Valladolid, Spain
Correspondence: Eva M Sobas Email [email protected]
Purpose: To evaluate the evolution of a set of proposed pain biomarkers in the saliva of subjects following Advanced Surface Ablation (ASA), in order to determine their validity as objective pain measures.
Methods: A multicenter, prospective, and descriptive study was carried out to assess the variations between biomarkers and perceived pain. The Inclusion criteria were healthy subjects who underwent a bilateral, alcohol-assisted surface ablation with epithelial removal (ASA). Pain intensity before and after surgery was assessed by Visual Analog Scale (VAS) and the Numeric Pain Rating Scale (NPRS). Cortisol, sAA, sIgA, testosterone, and sTNFαRII were assayed at four-time points (V0, baseline; V1, pre-surgery; V2, 1 hr post-surgery, and V3, 72 hrs post-surgery). Comorbidities and Hospital Anxiety and Depression (HADS) questionnaires were administrated before and at 6 hrs after the surgery. All patients were treated with cold patches, topical steroids, topical cold antibiotics, and benzodiazepines after ASA surgery. A descriptive analysis of biomarkers and pain intensity evolution and the agreement between biomarkers and pain was performed.
Results: Concentration of sIgA and sTNFαRII post-surgery was significantly higher at each visit compared to baseline (p-value: 0.053, p-value: < 0.001, respectively). Relations between VAS scale score and putative biomarker variations were not statistically significant except for the sIgA but only at visit 0 (p-value: 0.024). The HADS questionnaire showed anxiety scores between 0 and 7 in all patients before and at 6 hrs after surgery.
Conclusion: In this study, sIgA and sTNFαRII are the two potential biomarkers that present correlation with the VAS and these salivary substances showed acceptable levels of reproducibility in healthy subjects.
Keywords: biomarkers, ocular pain, advanced surface ablation
Introduction
Research into human pain has undergone strong development over the last 25 years and new biomarkers have emerged from different sources.1 The identification of pain biomarkers is the third of the potential tools.2 Saliva is a good biomarker for clinical applications. It is safe, easy, and non-invasive to collect and economic.3 The use of saliva as a reliable substitute for blood could provide an avenue for biomarker measurement in pain studies.4,5 During recent decades, saliva as a diagnostic and prognostic fluid in pain research has received increasing attention.6 It is common to find studies analyzing optimal saliva collection techniques for studying pain biomarkers, the most sensitive method for detecting and analyzing these biomarkers and, increasingly, more substances found in saliva, also present in blood and related to pain, are analyzed.6,7
To date, the main potential pain biomarkers already described in saliva are soluble tumor necrosis factor-α receptor II (sTNFαRII),4 secretory immunoglobulin A (sIgA),8 cortisol, salivary alpha-amylase (sAA),9 and testosterone.10
Acute dental pain has been associated with an increase in salivary cortisol,7 acute abdominal disease in horses has produced an increase in sAA activity,11 da Silva et al found a negative correlation between oral pain intensity and sIgA levels in children,8 Choi et al reported the effects of testosterone on pain,10,12 and Goodin et al has produced several studies analyzing sTNFαRII response to experimental modalities of acute pain.4,13,14
A previous study conducted by our group analyzed these biomarkers, all together, in healthy subjects. The findings suggested that salivary sIgA and sTNFαRII show remarkable reproducibility.15 Owing to the controversy that exists regarding these substances as biomarkers of pain, and despite our previous findings, we decided to analyze all of them in patients with acute eye pain following Advanced Surface Ablation (ASA) surgery.
ASA is the term that grouped the techniques that have been continuously improved from the earlier photorefractive keratectomy (PRK). Today´s ASA covers numerous techniques, such as laser epithelial keratomileusis (LASEK), epi-LASIK, and epi-LASEK.16,17 ASA procedures are safe and effective corneal refractive surgery techniques used to correct refractive errors.18 But one of their most important drawbacks is the discomfort and the presence of pain in the acute postoperative period.17 Postoperative acute ocular pain following ASA has been well characterized, with abundant information on the duration, intensity, and peak of pain following ASA in clinical practice.19 Therefore, the aim of the current study was to evaluate variations in the five potential pain biomarkers mentioned, as detected in the saliva of patients before and after ASA, to help determine their validity in measuring pain variations.
Materials and Methods
Ethics Statement
The study was approved by the local Ethics Committee of the Clinic University Hospital (Valladolid Spain) (PI 14–185, January 2015) and followed the tenets of the Declaration of Helsinki. Also, it complies with the Regulation 2016/679 of the European Parliament and of the Council of 27 April 2016 on the protection of natural persons with regard to the processing of personal data and on the free movement of such data, as well as with the rest of the laws and regulations in force and applicable as Spanish biomedical research regulatory requirements. All patients received written informed consent before entering in the study. All subjects provided their written informed consent before participation in the study.
Design and Study Population
We conducted a multicenter, prospective, and descriptive cohort study.
The population for this study (32 consecutive patients from 2 different centers) is the same as that used in a previous study conducted by our group.19 Also, a detailed explanation of the exclusion and inclusion criteria has been provided in our previous publication.19 In brief, all participants were healthy subjects affected by myopia (0.75 to 9 diopters (D)) or hyperopia (0.25 to 5D) with or without astigmatism, who underwent bilateral ASA surgery. The exclusion criteria were: age under 18 years old, any pain-body in the preceding 7 days; previous ocular surgeries within the last 12 months; autoimmune diseases; previous treatment with painkillers (including anti–inflammatories), psychotropics, anticonvulsants, or antidepressants. Two experienced surgeons performed all the ASA surgeries.
Data on gender, ocular comorbidities, pain intensity, and rescue medication administered within 72 hrs after ASA surgery was recorded.
Hospital Anxiety and Depression (HADS) and quality of life (QoL) questionnaires were gathered before and 6 hrs afterward the surgery. Additionally, any post-operatively adverse events up to 7 days following the ASA surgery were registered.
ASA Technique
Detailed explanation of ASA procedure has been provided in our previous publication.19
In the preoperative period, all patients took 0.5 mg alprazolam 30 mins before surgery and one drop of 5% lidocaine was applied at least three times before ASA surgery (20 mins, 10 mins and just before the surgery).
In the intraoperative period, an ethyl alcohol solution (17%) was placed on the cornea within an 8.5-mm solution cone and left in place for 30 s. Then, a Merocel® sponge was used to absorb any excess fluid. Subsequently, topical cold balanced salt solution (BSS) was used to rinse the corneal surface, and the corneal epithelium was removed with a blunt spatula. This maneuver was followed by stromal ablation using the MEL 70 G excimer laser (Carl Zeiss Meditec, Jena, Germany), which incorporates an eye-tracking system. The diameter of the treated area was always at least 6 mm with a transition to 9 mm.
After ablation, the surface was rinsed again with cold BSS. Then, 0.3% ofloxacin and 0.18% sodium hyaluronate drops were applied. At the end of the procedure, a therapeutic contact lens kept at 4ºC was placed on the cornea.
In postoperative period, all patients stayed in the surgical facilities for 4 or 6 hrs following ASA. Promptly after surgery, patients received a cold patch over the lids for 15 mins. Afterward the surgery, subjects were given to apply cold topical antibiotics, cold topical steroids, topical 0.18% sodium hyaluronate, and artificial tears to both eyes during specific periods of time. Also, they were instructed to keep all eye drops at 4ºC. Additionally, they were treated with oral alprazolam 0.5 mg and oral vitamin C tablets.
No other painkillers were prescribed unless the pain was deemed unbearable. In such cases, an established “rescue medication” protocol was used. Our rescue medication protocol was described in our previous publication.16
Postoperative Pain Assessment
Pain intensity was evaluated by using the Visual Analogue Scale (VAS) and the Numeric Pain Rating Scale (NPRS).20 Pain intensity was evaluated prior to and 0.5, 1, 2, 3, 4, 5, 6, 9, 12, 24, 36, 48 (2nd day), 60, 72 (3rd day), 96 (4th day), 120 (5th day), and 144 (6th day) hrs after ASA surgery. Each patient was also instructed to record in an individual diary the medication usage, pain, or depression observations at home. This methodology was described in the previous study conducted by our group.19
Sample Collection and Analysis
The protocol on sample collection and analysis has been previously described in previous publications.15,21 In brief, 32 subjects were instructed on how to carry out the saliva collection using the passive secretion method21 over a 5-min period into a collection tube. The minimum amount of sample collected was at least 1 mL. If the 5-mL collection tube was filled before 5 mins, the amount of elapsed time was recorded. The samples with visible blood contamination were discarded and after a 10-min wait, new samples were collected.
The collection of samples was obtained from each subject, in a clinical setting and was always supervised by the investigators, in four visits: V0, baseline; V1, pre-surgery; V2, 1 hr post-surgery, and V3, 72 hrs post-surgery.
The following salivary biomarkers were assayed by enzyme-linked immunosorbent assay (ELISA) and analyzed using the commercially available kits: Cortisol (DRG® Salivary Cortisol ELISA, DRG® Instruments GmbH, Marburg, Germany), testosterone (DRG® Salivary Testosterone ELISA, DRG Instruments GmbH, Marburg, Germany), sAA (DRG Salivary Alpha Amylase ELISA, DRG Instruments GmbH, Marburg, Germany), sTNFαRII (Quantikine®, Human sTNF RII/TNFRSF1B Immunoassay, R&D Systems, Minneapolis, MN, USA) and sIgA (Salimetrics® Salivary Secretory IgA ELISA, Pennsylvania, USA).
Other Ocular Symptoms, Hospital Anxiety/Depression (HADS) Questionnaire, Quality of Life (QoL) Questionnaire, and Visual Function 25 (VF25) Questionnaire
The text reproduces information already reported in detail in a study by Sobas et al.19
Other Ocular Symptoms
Basing on our previous developed questionnaire,20 we have registered data on the presence and intensity of pain. Accompanying ocular symptoms such as burning sensation, photophobia, foreign body, tearing, itching, and headache were also recorded in the questionnaire. We rated the intensity of each item basing on the Likert scale of 4 points (range 0–3, where 0 corresponded to no symptom and 3 to the worst imaginable symptom).22
These ocular symptoms were evaluated prior to, and at 1, 6, 48, and 120 hrs after surgery. All this information was included in the patient’s diary.
Hospital Anxiety/Depression (HADS) Questionnaire
The HADS scale, validated, and translated into Spanish language,23 was used to assess pre- and post-surgical anxiety and depression. HADS was evaluated prior to, and at 6, 48, and 120 hrs following ASA.
Full details of HADS questionnaire are given in the following publication24 but, briefly, patients completed a self-administered questionnaire composed of 14 items, divided into two 7-item subscales, one for anxiety and one for depression. Both subscales had the same cut-offs: 0–7, normal; 8–10, doubtful; and ≥11, existence of a clinical problem.25
Quality of Life (QoL) Assessment
QoL questionnaires were filled out by patients themselves. QoL was evaluated using the QoL short form-12 (SF12) health survey prior to, and at 24 and 72 hrs after surgery. This self-administered questionnaire consisted of 12 questions to measure physical and mental health status; a physical component summary (SF12 PCS) and a mental component summary (SF12 MCS). The score was computed from the scores of the twelve questions and ranged from 0 to 100. A score of 0 indicated the lowest level of physical and mental health, and a score of 100 indicated the highest level.26
Visual Function 25 (VF25) Questionnaire
The VF25 questionnaire was administered prior to, and at 24 and 72 hrs after surgery. This questionnaire contains 25 questions within 11 vision subscales plus an additional single-item general health rating question. Scoring ranges from 0 (the lowest visual function) to 100 (best vision-related function).26
Statistical Analysis
Sample size was based on our previously published postoperative pain study.19 We assumed that 98% of the participants would have ocular pain. A sample size of 32 subjects was determined for estimating the proportion of pain reporters, based on a two-sided 95% confidence interval (95% CI). The margin of error was set at ±2.5%.
Statistical analysis was performed using R software (R Foundation for Statistical Computing, Vienna, Austria). The significance level was set at 0.05.
Continuous variables were described as mean ± standard deviation (SD) and categorical data were summarized as absolute frequency and percentages. Biomarker concentrations were analyzed as log2-transformed variables. sAA levels were below the detection limit in two visits to a subject. These values were imputed using the robust regression on order statistics (ROS) method implemented in the NADA R package.27
Linear mixed-effects models using the R package Ime4 were used to analyze the biomarkers’ evolution.28
Relationships between biomarker levels, gender, and age were evaluated at each visit. Student’s t-test for two independent samples and Spearman’s rank correlation were used, respectively. To evaluate the relationship with the VAS scale, two groups were considered: 0 and >0. Analysis of Variance (ANOVA) was performed to evaluate the differences between these groups in levels of each biomarker, adjusted by sex and age.
Results
Patient Characteristics
A total of 32 consecutive patients (19 men and 13 women) were included between June 2015 and June 2016. The mean age was 28.78± 6.93 and all patients received surgery on both eyes.
Pain Evolution After ASA Procedure
All patients reported postoperative ocular pain (VAS≥20 mm) from 0.5 to 60 hrs after surgery. The average pain intensity for all participants increased sharply during the first 9 hrs after surgery, and then peaked at 24 hrs (mean (SD) VAS scores of 61 (31) mm), with a 6-point difference between pre- and post-surgical VAS at that time (p-value: 0.012). It should be highlighted that the value at the mean (SD) time of 1 hr post-surgery was 4.91 (1.89) mm because it was at that moment when the biomarkers were analyzed. After that, the pain intensity was approximately stable until 36 hrs, then it slowly decreased up to 96 hrs after surgery. The mean (SD) VAS score at 72 hrs was 19 (20) mm.19
HADS Questionnaire
Before surgery, 29 (91%) of the patients scored between 0 and 7, [mean (SD) 4.62 (2.08)], 1 (3%) scored 10, and 1 (3%) scored ≥11 in the anxiety subscale. At 6 hrs after surgery, all patients had anxiety scores between 0 and 7 [mean (SD) 4.38 (2.5)]. For the depression subscale, all patients scored between 0 and 8 before surgery (1.16 ± 2.07). Six hours after ASA, the results were similar [mean (SD) 1.53 (2.09)].19
Values for All Biomarkers in the Saliva of Healthy Subjects
The basal salivary concentrations of cortisol, sAA, sIgA, testosterone, and sTNFαRII were previously assessed by our group in a prospective study involving 34 pain-free healthy subjects in two single samples at least 24 hrs apart.15 This research showed differences in potential biomarker concentrations between collections.
Relationship of Biomarkers with Visits
Figure 1 shows biomarker concentration at four visits: V0, baseline; V1, pre-surgery; V2, 1 hr post-surgery, and V3, 72 hrs post-surgery.
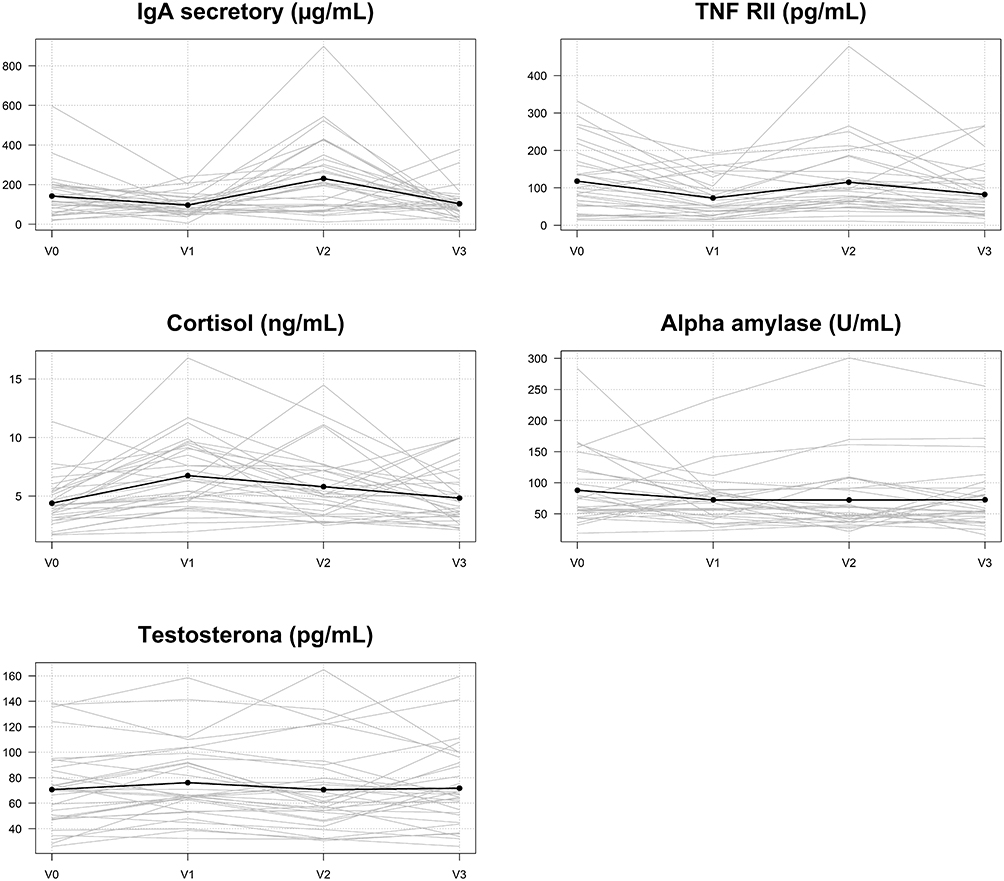 |
Figure 1 Biomarker concentration at four visits: V0, baseline; V1, pre-surgery; V2, 1 hr post-surgery, and V3, 72 hrs post-surgery. sIgA (μg/mL), sTNFαRII (pg/mL), cortisol (ng/mL), AAs (U/mL), testosterone (pg/mL). |
The levels of sIgA, sTNFαRII, and cortisol were different at least two visits; the effect of the visit was significant. But sAA and testosterone remained at the limit of significance (Table 1).
 |
Table 1 Effect of the Visit Extracted from the ANOVA Table for the Fitted Linear Mixed Models of Each Biomarker |
The evolution of each biomarker was assessed. Table 2 shows the sIgA levels at all visits. The highest levels are observed at V2. The level of sIgA at V2 was significantly higher than at V1 (p=0.001) and V3 (p=0.001). At V2, the sIgA level was approximately 2 times the level detected at V1 and 2 times that detected at V3 (Table 2A and B).
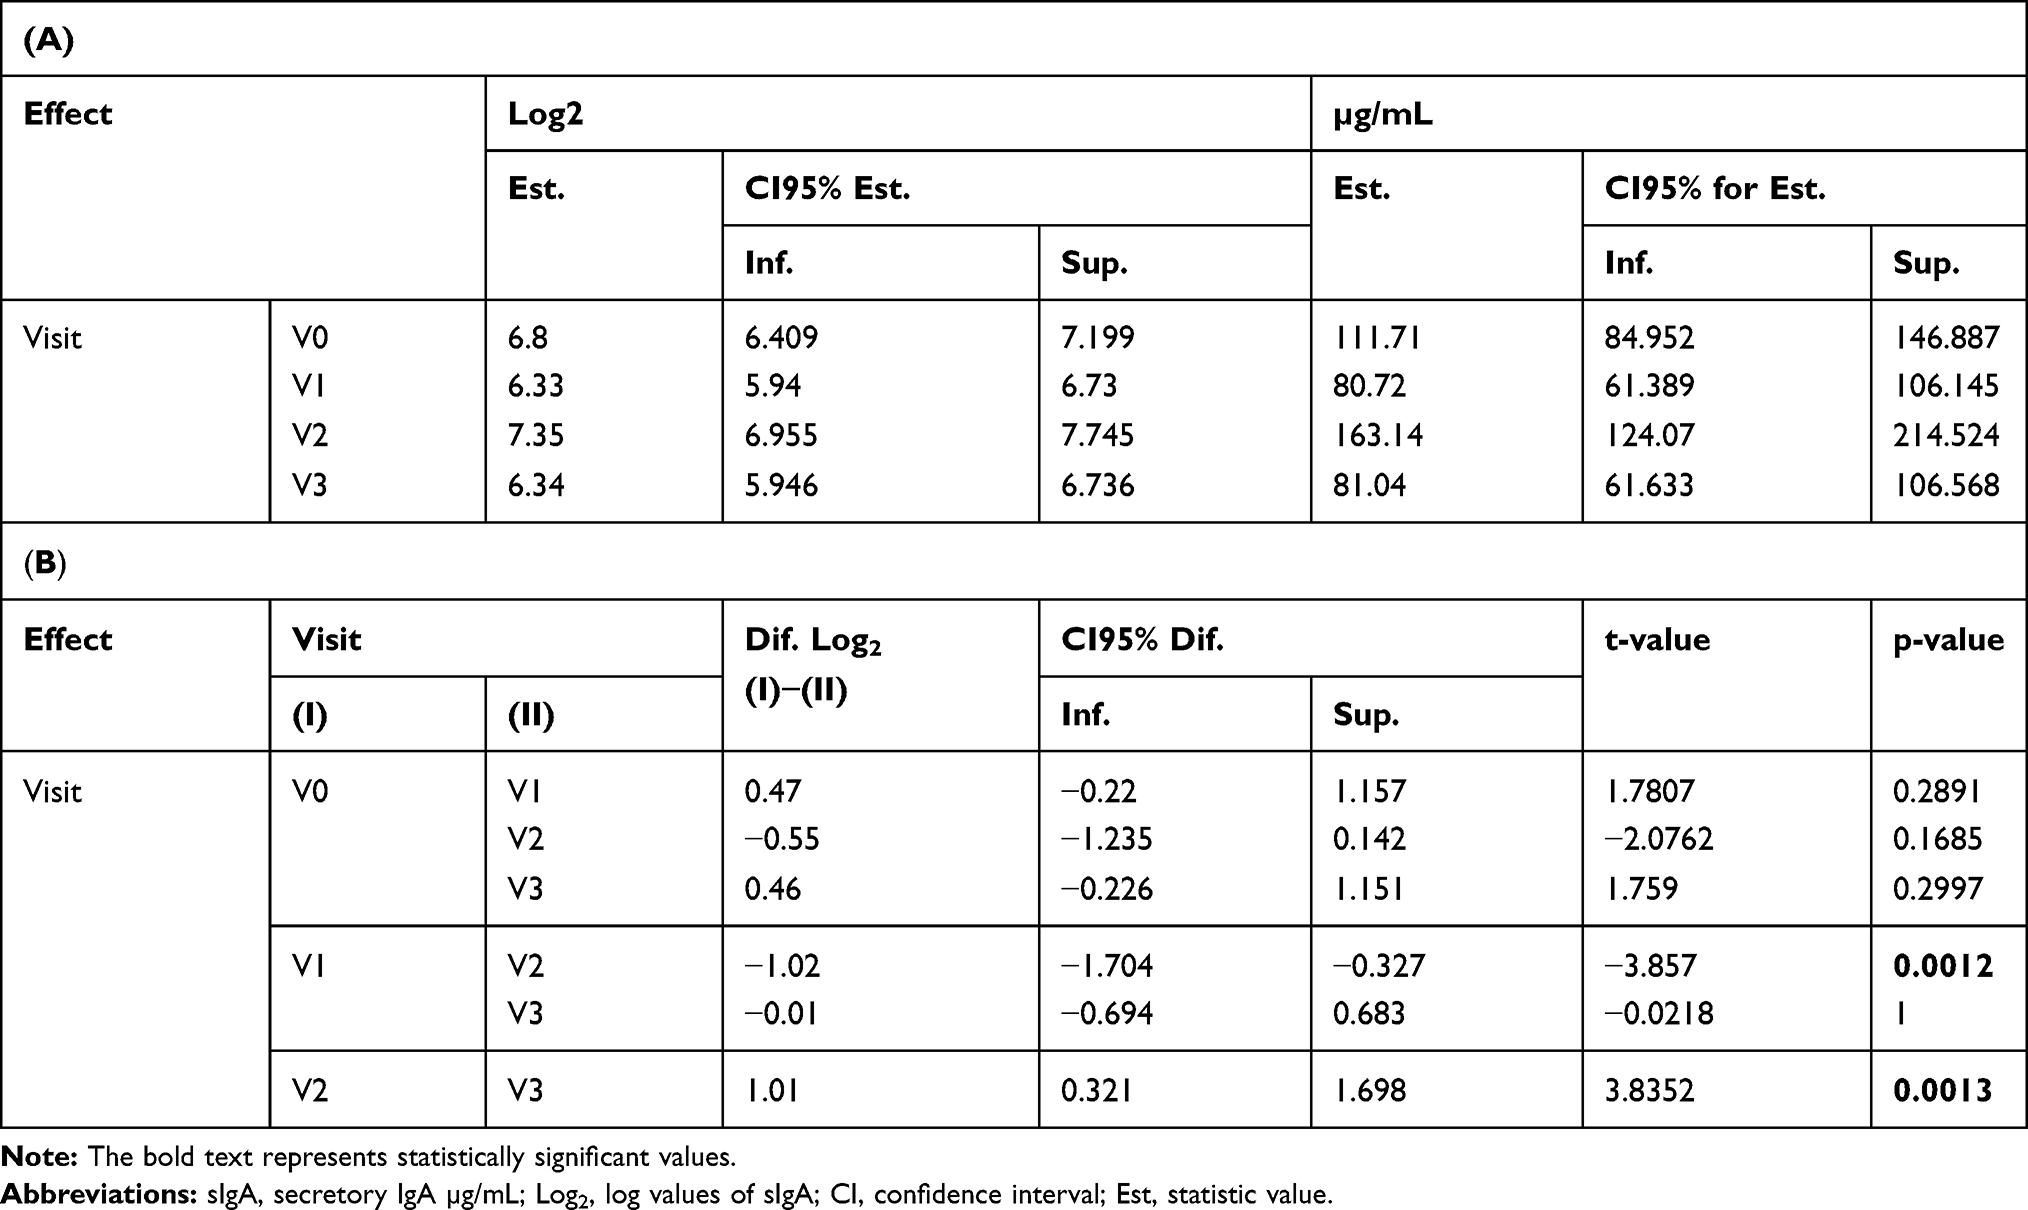 |
Table 2 (A) Average Levels of sIgA at All Visits; (B) Difference Between Averages of Significant Effects in sIgA Levels at All Visits |
The level of sTNFαRII at V2 was significantly higher than at V1 (p=<0.001) and V3 (p=0.005). The V2 level was approximately 1.62 times the V1 level and 1.45 times the level detected at V3 (Table 3A and B).
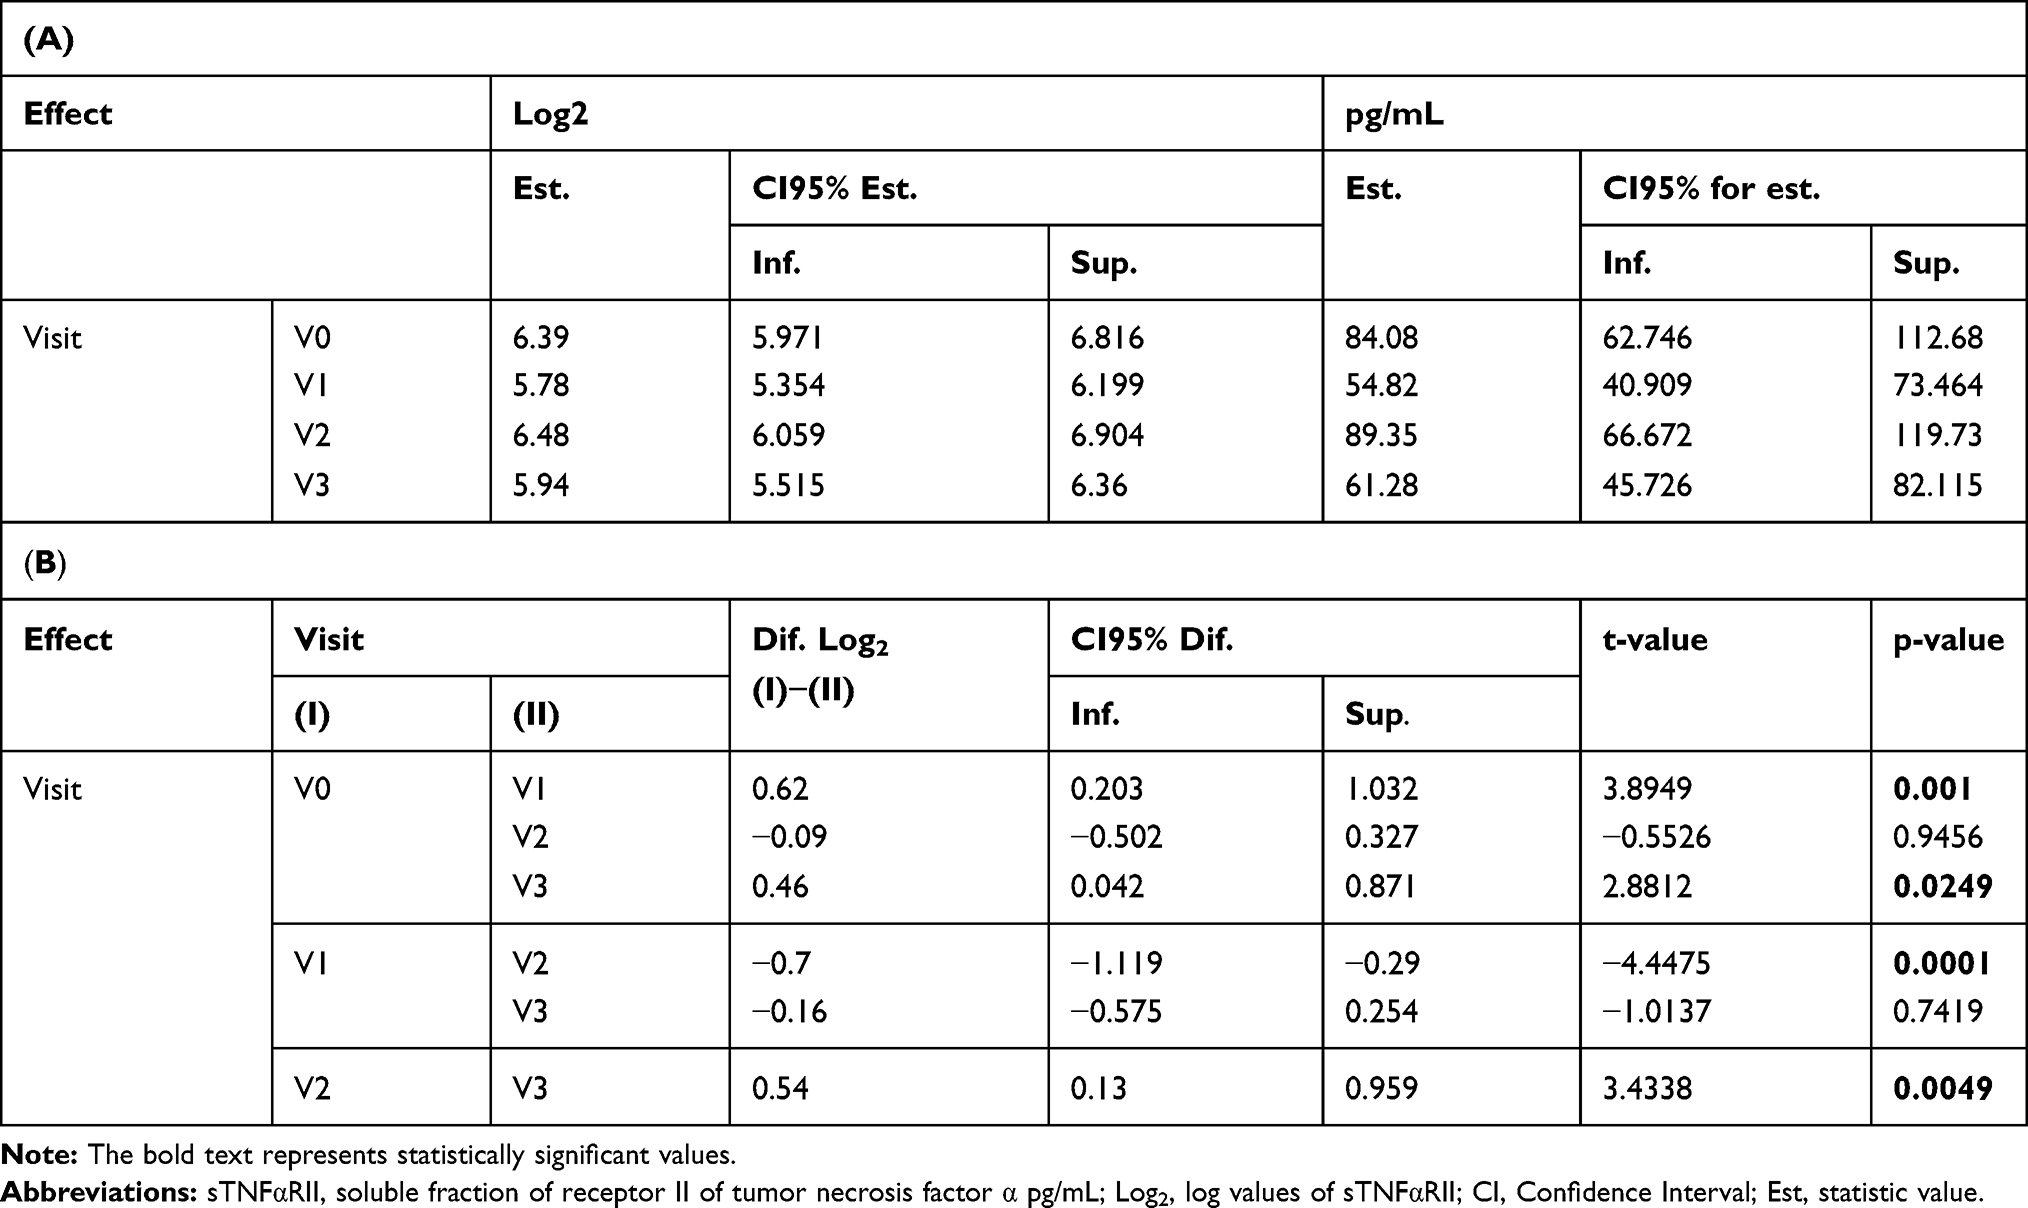 |
Table 3 (A) Average Levels of sTNFαRII at All Visits; (B) Difference Between Averages of Significant Effects in Levels of sTNFαRII at All Visits |
The highest levels of cortisol are observed at V1 and the levels decrease to levels close to the baseline until V3. The level of Cortisol at V0 was significantly lower than at V1 and V2. The V1 level was approximately 1.5 times the V0 level and the V2 level 1.3 times that detected at V0 (Table 4A and B).
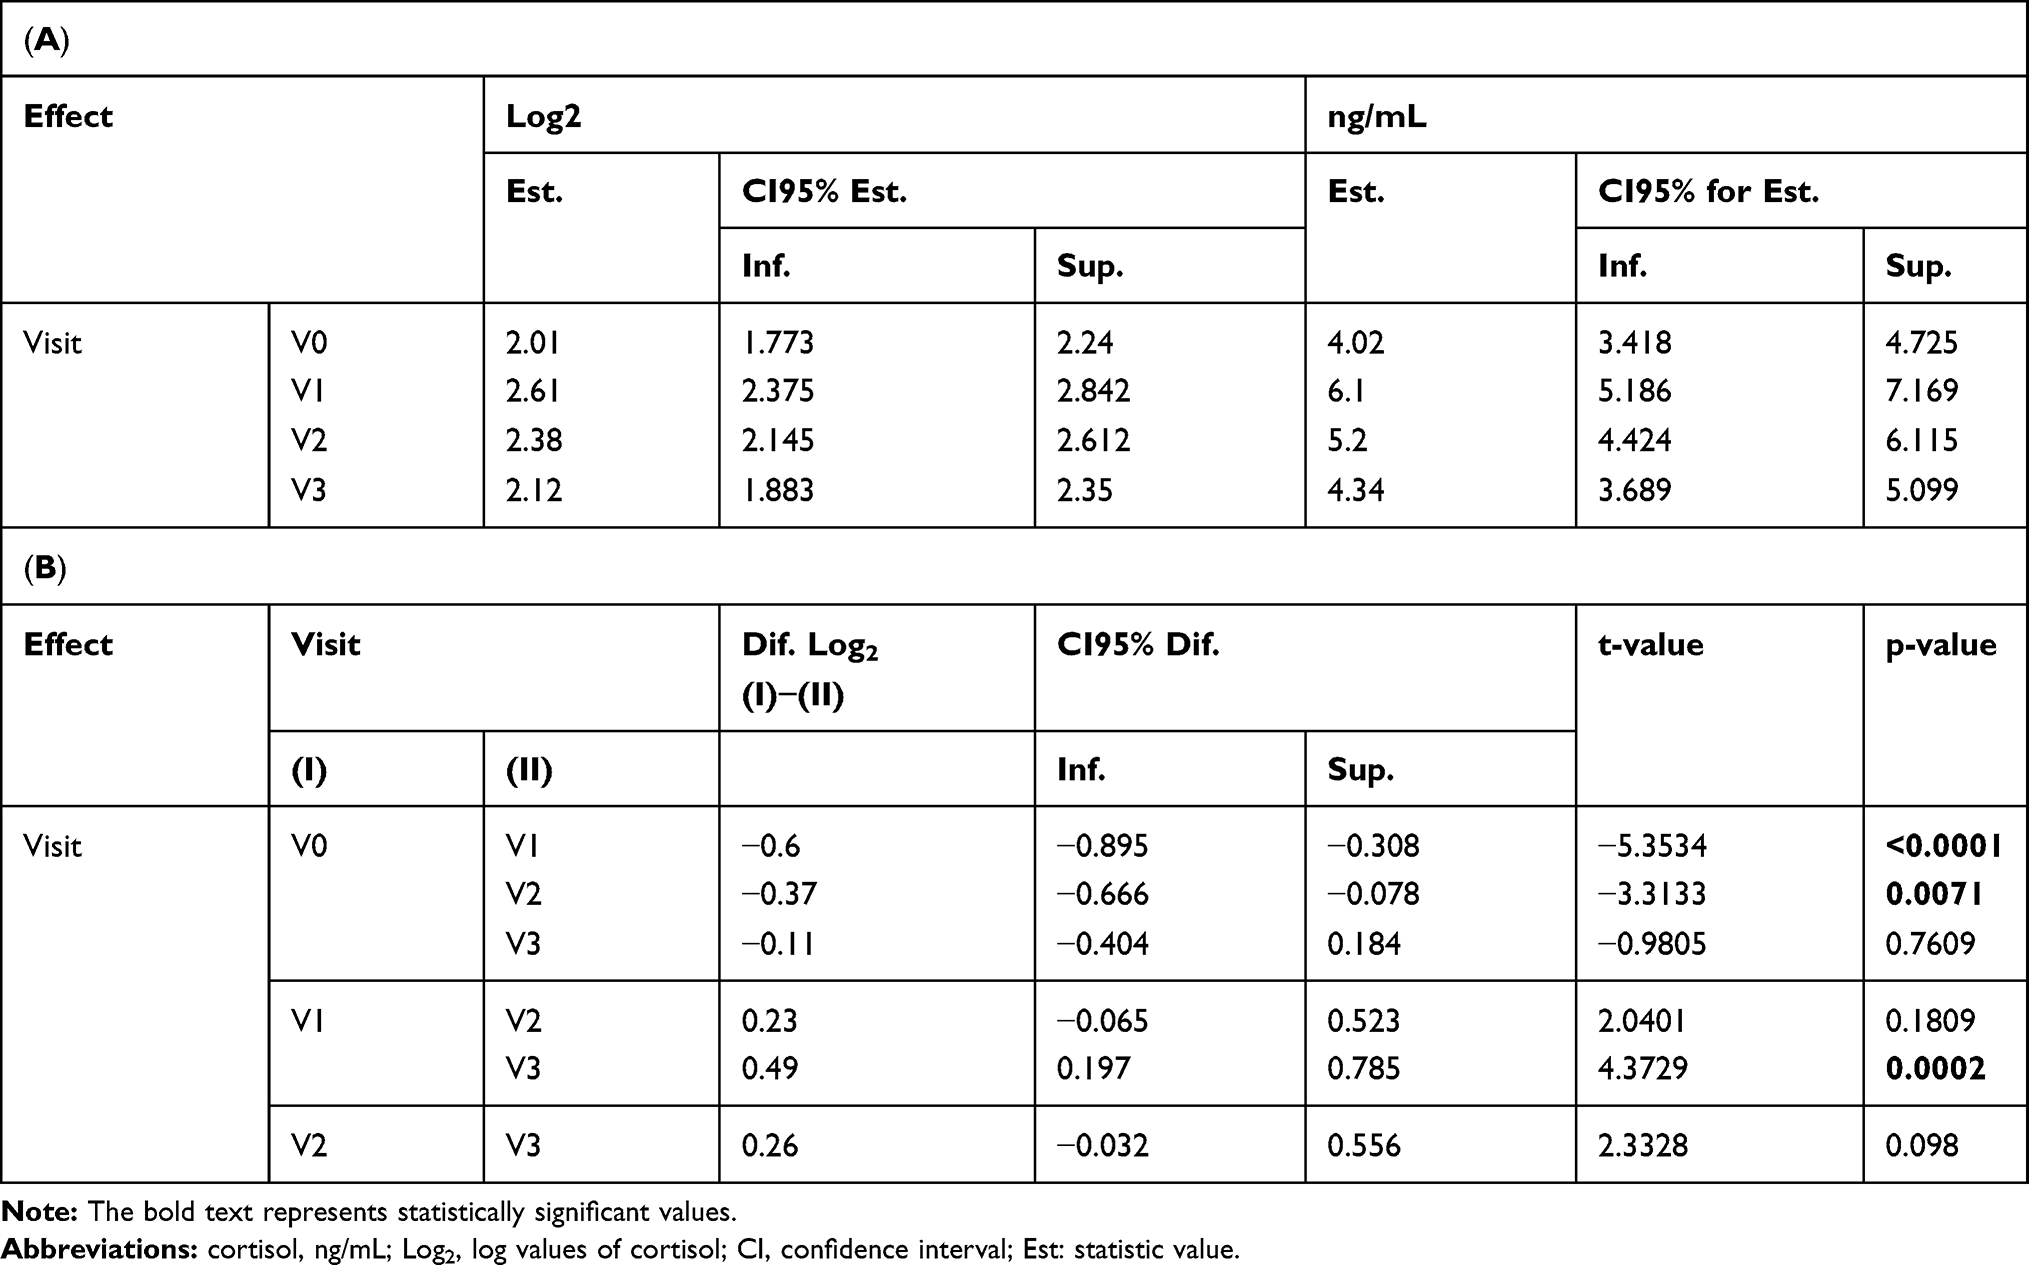 |
Table 4 (A) Average Levels of Cortisol at All Visits; (B) Difference Between Averages of Significant Effects in Levels of Cortisol at All Visits |
The differences of sAA levels were not statistically significant at any visit. But it should be mentioned that, with a significant level <0.1, the level of Alpha amylase at V0 was significantly higher than at V2 (1.3 times) (Table 5A and B).
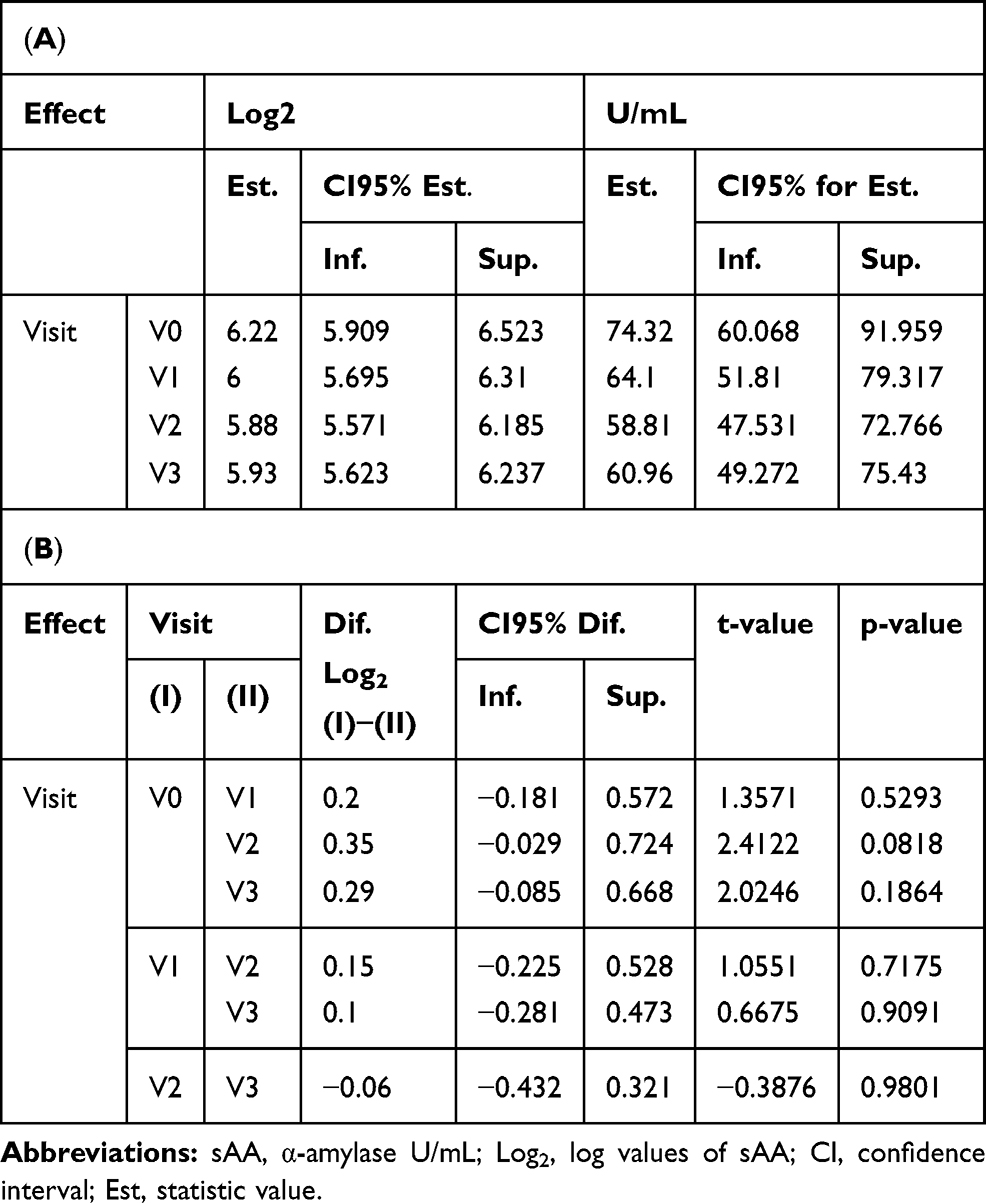 |
Table 5 (A) Average Levels of sAA at All Visits (Average); (B) Difference Between Averages of Significant Effects in Levels of sAA at All Visits |
Testosterone did not show statistically significant differences at any of the visits. Also, worthy of highlight, with a level of 0.01, the testosterone level at V1 is significantly (approximately 1.1 times) higher than at V2 (Table 6A and B).
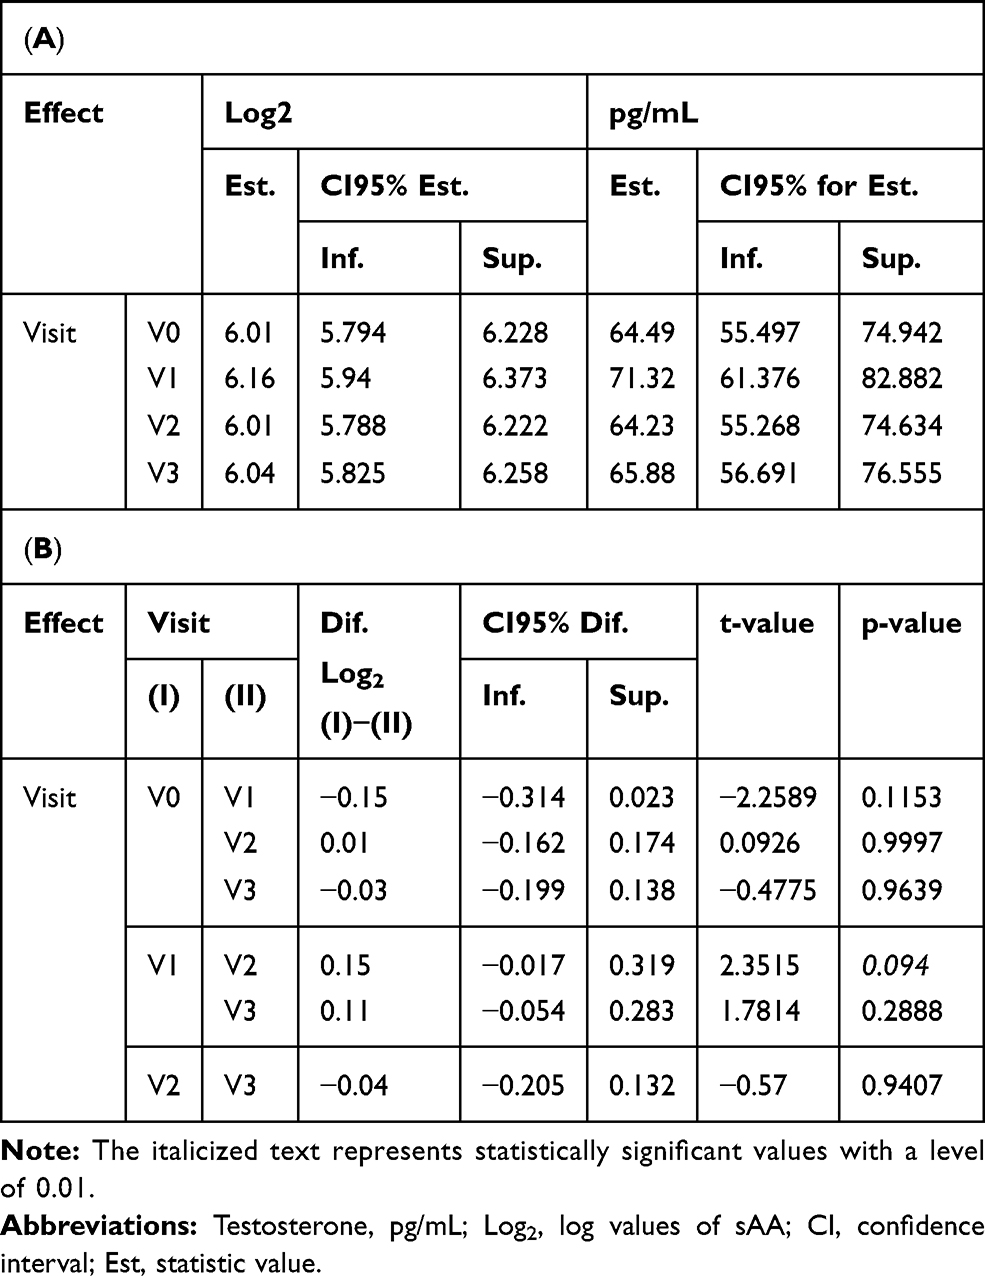 |
Table 6 (A) Average Levels of Testosterone at All Visits; (B) Difference Between Averages of Significant Effects in Levels of Testosterone at All Visits |
Relationship of Biomarkers with Demographic Variables
The relationship between cortisol level and age was statistically significant (p=0.043) at Visit 0. It was a negative relationship: as age increased, the level of cortisol was lower (Figure 2). With a significant level <0.1, the relationships of age with sAA and sIgA would also be significant (p=0.056 and p=0.053, respectively). In the first case, the relationship was positive, with higher levels among older individuals, and in the second case, the relationship was negative. It should be highlighted that the relationship between sAA and age was statistically significant at Visit 1 (p=0.041). At all visits, the level of testosterone was statistically higher in men than in women (Table 7).
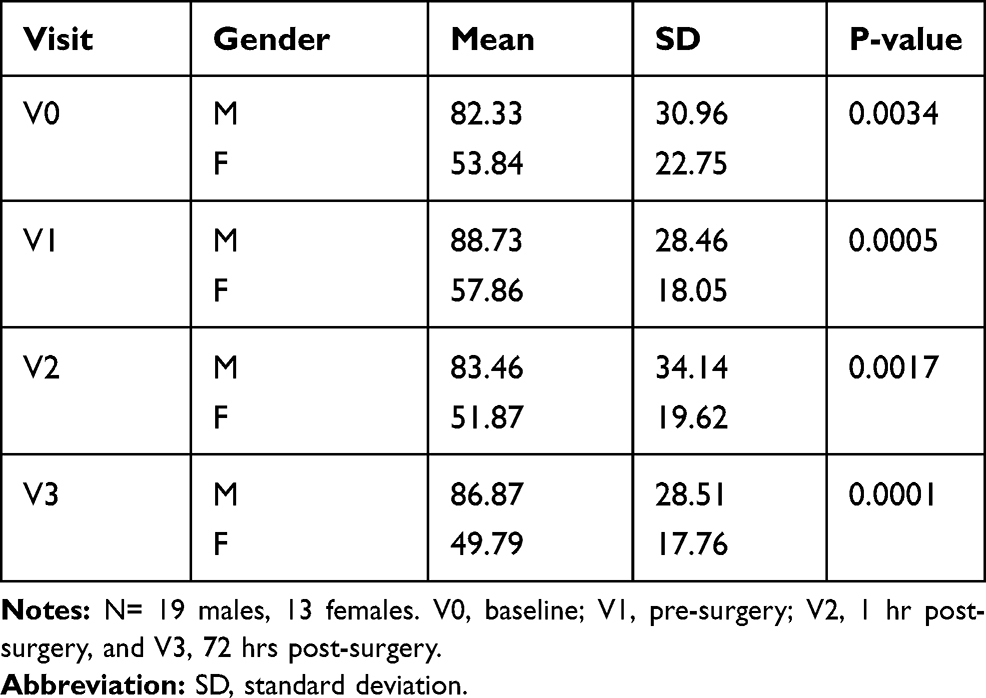 |
Table 7 Testosterone Levels in Males and in Females at All Visits |
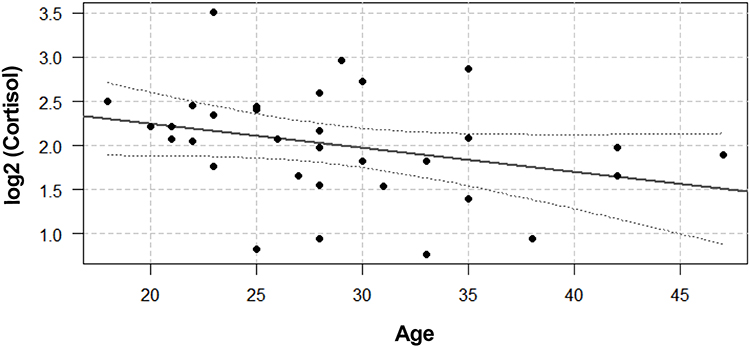 |
Figure 2 Spearman correlation plot and 95% CI showing a negative correlation between cortisol level and age. |
Relationship of Biomarkers with Subjective Scales
VAS variations were not statistically significant with any of the biomarkers except for the sIgA, but only at V0 (p=0.024). sIgA levels were higher in subjects with higher scores on the VAS scale (Figure 3). At V2, sIgA remained at the limit of significance. Two individuals were considered as outliers and eliminated. Then, the model fulfilled all the necessary hypotheses and the relationship with the VAS scale was significant.
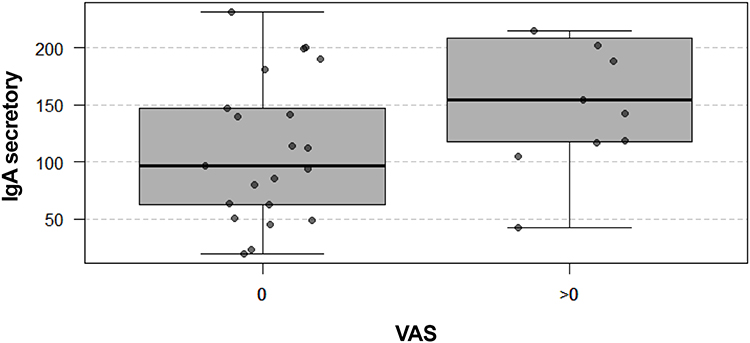 |
Figure 3 The graph presents the relationship between VAS and sIgA at V0. VAS is considered as a discrete variable with two levels: 0 and >0 (up to a maximum of 2). IgA levels are significantly higher in the group of individuals that score higher than 0 on the VAS scale. The VAS is statistically significant at IgA levels. |
Discussion
Our results confirm previous studies showing that ASA produces severe pain in postoperative period, reaching a moderate-high intensity (VAS value of 6) with a peak of pain located between 24 and 36 hrs.18,29,30 Although the VAS has been universally validated for the measurement of pain, it has obvious limitations.31 Thus, there is a general consensus that new objective measures of pain are required, including salivary biomarkers.5,32
Our group had analyzed the inter-individual differences and intersession variability in the saliva of healthy subjects for the current selected biomarkers.15 We found significant variance in male and female testosterone, indicating that this hormone seems to be a poor salivary biomarker for pain. However, due to recent findings by Choi on the importance of considering the effects of testosterone on pain, we considered it necessary to include testosterone in this study. Choi reported that lower levels of testosterone allow greater tolerance to pain, an important aspect to consider when treating patients for pain.12
The results showed that sIgA is the biomarker that presents the highest correlation with pain. sIgA is one of the main antibodies in the oral mucosa33 and it plays an essential role in maintaining the integrity of the mucous membrane.34 Its levels on the surface of oral mucosa have been shown to be related with the regulation of the development of inflammatory responses.34
Our results are consistent with previous reports, where patients affected by oral lichen planus, a chronic disease, presented higher values for sIgA than control subjects.35 However, da Silva and colleagues found a negative correlation between oral pain intensity and sIgA levels in children.8
sTNFαRII is the other biomarker whose concentration is raised at V2. Goodin et al showed that sTNFαRII in oral fluids significantly decreased from baseline in relation to all three experimental pain modalities.4 Contrary to that study, our results reported a significant increase, which correlates with the highest values on the VAS.
Although there is a study that considered that sAA measurements could be a good biomarker of pain,11 our results did not find statistically significant differences between visits. These results are consistent with a previous study carried out by our group analyzing the reliability of this potential pain biomarker in the saliva of healthy subjects. That study did not find acceptable levels of reproducibility between two measurements.15
Cortisol response to pain does not appear to be purely a function of the pain experience, because cortisol at V0 was significantly lower than at V1 and V2. It may be that other stress-related features, such as sympathetic activation, may be involved in the cortisol elevation detected.4,36
Conclusion
In contrast to other studies, in this study, all the biomarkers were analyzed together, relating them to the VAS and in the postoperative period of a surgery in which the evolution of pain is well described. This is the first study using this “clinical model” of acute postoperative pain, which in our opinion has some advantages. Patients who are going to undergo ASA surgery are healthy patients, without pain prior to surgery.
Regarding the increase of cortisol concentration at the pre-surgery visit, we believe that it is related to the presence of anxiety and depression as detected by the HADS scale. It can be concluded that cortisol, under these circumstances, could be a biomarker more related to stress than to pain.
In this study, sIgA and sTNFαRII are the two potential biomarkers that present correlation with the VAS and these salivary substances showed acceptable levels of reproducibility in healthy subjects.15 Nevertheless, further studies are required, including studies with other types of post-surgical pain before proposing them as valid pain biomarkers in future clinical studies.
Acknowledgments
We would like to thank all the participants in this study.
Disclosure
The authors report no conflicts of interest in this work.
References
1. Arendt-Nielsen L, Nielsen TA, Gazerani P. Translational pain biomarkers in the early development of new neurotherapeutics for pain management. Expert Rev Neurother. 2014;14:241–254. doi:10.1586/14737175.2014.884925
2. Canton-Habas V, Carrera-Gonzalez MDP, Moreno-Casbas MT, Quesada-Gomez JM, Rich-Ruiz M. Correlation between biomarkers of pain in saliva and PAINAD scale in elderly people with cognitive impairment and inability to communicate: descriptive study protocol. BMJ Open. 2019;9:e032927. doi:10.1136/bmjopen-2019-032927
3. Strimbu K, Tavel JA. What are biomarkers? Curr Opin HIV AIDS. 2010;5:463–466. doi:10.1097/COH.0b013e32833ed177
4. Goodin BR, Quinn NB, King CD, et al. Salivary cortisol and soluble tumor necrosis factor-alpha receptor II responses to multiple experimental modalities of acute pain. Psychophysiology. 2012;49:118–127. doi:10.1111/j.1469-8986.2011.01280.x
5. Cruz-Almeida Y, Aguirre M, Sorenson H, Tighe P, Wallet SM, Riley JL
6. Jasim H, Carlsson A, Hedenberg-Magnusson B, Ghafouri B, Ernberg M. Saliva as a medium to detect and measure biomarkers related to pain. Sci Rep. 2018;8:3220. doi:10.1038/s41598-018-21131-4
7. Haug SR, Marthinussen MC. Acute dental pain and salivary biomarkers for stress and inflammation in patients with pulpal or periapical inflammation. J Oral Facial Pain Headache. 2018;33.
8. da Silva Campos MJ, Souza Alves CC, Barbosa Raposo NR, Ferreira AP, Farinazzo Vitral RW. Influence of salivary secretory immunoglobulin A level on the pain experienced by orthodontic patients. Med Sci Monit. 2010;16:CR405–409.
9. Muller MJ. Helplessness and perceived pain intensity: relations to cortisol concentrations after electrocutaneous stimulation in healthy young men. Biopsychosoc Med. 2011;5:8. doi:10.1186/1751-0759-5-8
10. Choi JC, Chung MI, Lee YD. Modulation of pain sensation by stress-related testosterone and cortisol. Anaesthesia. 2012;67:1146–1151. doi:10.1111/j.1365-2044.2012.07267.x
11. Contreras-Aguilar MD, Escribano D, Martin-Cuervo M, Tecles F, Ceron JJ. Salivary alpha-amylase activity and cortisol in horses with acute abdominal disease: a pilot study. BMC Vet Res. 2018;14:156. doi:10.1186/s12917-018-1482-4
12. Choi JC, Park YH, Park SK, et al. Testosterone effects on pain and brain activation patterns. Acta Anaesthesiol Scand. 2017;61:668–675. doi:10.1111/aas.12908
13. Goodin BR, Quinn NB, Kronfli T, et al. Experimental pain ratings and reactivity of cortisol and soluble tumor necrosis factor-alpha receptor II following a trial of hypnosis: results of a randomized controlled pilot study. Pain Med. 2012;13:29–44. doi:10.1111/j.1526-4637.2011.01293.x
14. Goodin BR, Quinn NB, King CD, et al. Enhanced cortisol increase upon awakening is associated with greater pain ratings but not salivary cortisol or soluble tumor necrosis factor-alpha receptor II responses to acute pain. Clin J Pain. 2012;28:291–299. doi:10.1097/AJP.0b013e31822cf542
15. Sobas EM, Reinoso R, Cuadrado-Asensio R, Fernandez I, Maldonado MJ, Pastor JC. Reliability of potential pain biomarkers in the saliva of healthy subjects: inter-individual differences and intersession variability. PLoS One. 2016;11:e0166976. doi:10.1371/journal.pone.0166976
16. Trattler WB, Barnes SD. Current trends in advanced surface ablation. Curr Opin Ophthalmol. 2008;19:330–334. doi:10.1097/ICU.0b013e3283034210
17. Moisseiev E, Sela T, Minkev L, Varssano D. Increased preference of surface ablation over laser in situ keratomileusis between 2008-2011 is correlated to risk of ecatasia. Clin Ophthalmol. 2013;7:93–98. doi:10.2147/OPTH.S38959
18. Blake CR, Cervantes-Castaneda RA, Macias-Rodriguez Y, Anzoulatous G, Anderson R, Chayet AS. Comparison of postoperative pain in patients following photorefractive keratectomy versus advanced surface ablation. J Cataract Refract Surg. 2005;31:1314–1319. doi:10.1016/j.jcrs.2004.11.046
19. Sobas EM, Videla S, Vazquez A, Fernandez I, Maldonado MJ, Pastor JC. Pain perception description after advanced surface ablation. Clin Ophthalmol. 2017;11:647–655. doi:10.2147/OPTH.S134542
20. Breivik H, Borchgrevink PC, Allen SM, et al. Assessment of pain. Br J Anaesth. 2008;101:17–24. doi:10.1093/bja/aen103
21. Golatowski C, Salazar MG, Dhople VM, et al. Comparative evaluation of saliva collection methods for proteome analysis. Clin Chim Acta. 2013;419:42–46. doi:10.1016/j.cca.2013.01.013
22. McMonnies CW. Measurement of symptoms pre- and post-treatment of dry eye syndromes. Optom Vis Sci. 2016;93:1431–1437. doi:10.1097/OPX.0000000000000965
23. Herrero MJ, Blanch J, Peri JM, De Pablo J, Pintor L, Bulbena A. A validation study of the hospital anxiety and depression scale (HADS) in a Spanish population. Gen Hosp Psychiatry. 2003;25:277–283. doi:10.1016/S0163-8343(03)00043-4
24. Snaith RP. The Hospital Anxiety And Depression Scale. Health Qual Life Outcomes. 2003;1:29. doi:10.1186/1477-7525-1-29
25. Verdam MGE, Oort FJ, Sprangers MAG. Item bias detection in the hospital anxiety and depression scale using structural equation modeling: comparison with other item bias detection methods. Qual Life Res. 2017;26:1439–1450. doi:10.1007/s11136-016-1469-1
26. Mangione CM, Lee PP, Gutierrez PR, et al. Development of the 25-item National Eye Institute Visual Function Questionnaire. Arch Ophthalmol. 2001;119:1050–1058. doi:10.1001/archopht.119.7.1050
27. Lee L. 2013. NADA: nondetects and data analysis for environmental data. R package version 1.5-6. Available from: http://CRAN.R-project.org/package=NADA.
28. Bates D, Mächler M, Bolker B, Walker S. Fitting linear mixed-effects models using lme4. J Stat Softw. 2015;67(1):1–48. doi:10.18637/jssv067i01
29. Hong JP, Nam SM, Im CY, et al. Comparison of analgesic effect of preoperative topical diclofenac and ketorolac on postoperative pain after photorefractive keratectomy. J Cataract Refract Surg. 2014;40:1689–1696. doi:10.1016/j.jcrs.2014.05.029
30. Autrata R, Rehurek J. Laser-assisted subepithelial keratectomy and photorefractive keratectomy for the correction of hyperopia. Results of a 2-year follow-up. J Cataract Refract Surg. 2003;29:2105–2114. doi:10.1016/S0886-3350(03)00415-2
31. Savoia G, Alampi D, Amantea B, et al. Postoperative pain treatment SIAARTI recommendations 2010. Short version. Minerva Anestesiol. 2010;76:657–667.
32. Ciregia F, Giacomelli C, Giusti L, et al. Putative salivary biomarkers useful to differentiate patients with fibromyalgia. J Proteomics. 2018;190:44–54.
33. Brandtzaeg P. Molecular and cellular aspects of the secretory immunoglobulin system. APMIS. 1995;103:1–19. doi:10.1111/apm.1995.103.issue-1-6
34. Martinez Kde O, Mendes LL, Alves JB. Secretory A immunoglobulin, total proteins and salivary flow in Recurrent Aphthous Ulceration. Braz J Otorhinolaryngol. 2007;73:323–328. doi:10.1016/S1808-8694(15)30075-6
35. Lopez-Jornet P, Cayuela CA, Tvarijonaviciute A, Parra-Perez F, Escribano D, Ceron J. Oral lichen planus: salival biomarkers cortisol, immunoglobulin A, adiponectin. J Oral Pathol Med. 2016;45:211–217. doi:10.1111/jop.2016.45.issue-3
36. Mizawa M, Yamaguchi M, Ueda C, Makino T, Shimizu T. Stress evaluation in adult patients with atopic dermatitis using salivary cortisol. Biomed Res Int. 2013;2013:138027. doi:10.1155/2013/138027
 © 2020 The Author(s). This work is published and licensed by Dove Medical Press Limited. The full terms of this license are available at https://www.dovepress.com/terms.php and incorporate the Creative Commons Attribution - Non Commercial (unported, v3.0) License.
By accessing the work you hereby accept the Terms. Non-commercial uses of the work are permitted without any further permission from Dove Medical Press Limited, provided the work is properly attributed. For permission for commercial use of this work, please see paragraphs 4.2 and 5 of our Terms.
© 2020 The Author(s). This work is published and licensed by Dove Medical Press Limited. The full terms of this license are available at https://www.dovepress.com/terms.php and incorporate the Creative Commons Attribution - Non Commercial (unported, v3.0) License.
By accessing the work you hereby accept the Terms. Non-commercial uses of the work are permitted without any further permission from Dove Medical Press Limited, provided the work is properly attributed. For permission for commercial use of this work, please see paragraphs 4.2 and 5 of our Terms.