")
Back to Journals » International Journal of Nanomedicine » Volume 11
Evaluation of optimum conditions for pachyman encapsulated in poly(D,L-lactic acid) nanospheres by response surface methodology and results of a related in vitro study
Authors Zheng S, Luo L, Bo R, Liu Z, Xing J, Niu Y, Hu Y, Liu J , Wang D
Received 24 June 2016
Accepted for publication 27 August 2016
Published 23 September 2016 Volume 2016:11 Pages 4891—4904
DOI https://doi.org/10.2147/IJN.S115742
Checked for plagiarism Yes
Review by Single anonymous peer review
Peer reviewer comments 2
Editor who approved publication: Professor Lei Yang
Sisi Zheng, Li Luo, Ruonan Bo, Zhenguang Liu, Jie Xing, Yale Niu, Yuanliang Hu, Jiaguo Liu, Deyun Wang
Institute of Traditional Chinese Veterinary Medicine, College of Veterinary Medicine, Nanjing Agricultural University, Nanjing, People’s Republic of China
Abstract: This study aimed to optimize the preparation conditions of pachyman (PHY)-loaded poly(D,L-lactic acid) (PLA) (PHYP) nanospheres by response surface methodology, explore their characteristics, and assess their effects on splenic lymphocytes. Double emulsion solvent evaporation was used to synthesize PHYP nanospheres, and the optimal preparation conditions were identified as a concentration of poloxamer 188 (F68) (w/v) of 0.33%, a concentration of PLA of 30 mg/mL, and a ratio of PLA to drug (w/w) of 10.25:1 required to reach the highest encapsulation efficiency, which was calculated to be 59.10%. PHYP had a spherical shape with a smooth surface and uniform size and an evident effect of sustained release and relative stability. Splenic lymphocytes are crucial and multifunctional cells in the immune system, and their immunological properties could be enhanced significantly by PHYP treatment. This study confirmed that PHY encapsulated in PLA nanospheres had comparatively steady properties and exerted obvious immune enhancement.
Keywords: PHYP, optimal preparation condition, RSM, in vitro study
Introduction
Polysaccharides are important biopolymers and have been used in the food and medicine industries for many years.1 Pachyman (PHY) is a fungus polysaccharide extracted from the sclerotium of the fungus Wolfiporia extensa (previously Poria cocos), which is one of the most important herbs in the People’s Republic of China and many other Asian countries.2 Similar in structure to starch and cellulose, PHY is a naturally occurring linear polysaccharide, composed of ribose, arabinose, xylose, mannose, glucose, and galactose in molar concentrations of 1.49, 1.17, 0.62, 10.34, 86.39, and 1.31 μmol/L, respectively.3,4 The carbohydrate chain generally consists of β-D-(1→3)-linked glucose units with a small number of β-(1→6)-linked branches and has a molecular weight ranging from 64.6 kDa to 4,360 kDa.5–8 Studies have shown PHY to have pharmaceutical value, as it has diuretic,9 mitogenic, complement-activating, anti-inflammatory,10 and immunoactive properties. PHY also has a number of beneficial physicochemical properties that make it suitable for widespread applications in drug delivery systems.11–13 Poly(D,L-lactic acid) (PLA) is a biodegradable polymer approved by the US Food and Drug Administration (FDA) for drug delivery,14,15 and studies have shown it to be a good carrier for drugs, proteins, and DNA.16–19 The favorable physicochemical characteristics of PLA, including safety, biodegradability, biocompatibility, stability, and lack of intrinsic immunogenicity, make it a suitable candidate for drug delivery application as a vaccine carrier.20,21 Drug delivery plays a vital role in medicine and health care. Studies have shown that nanospheres can improve the stability of active substances and be compatible with tissues and cells when synthesized from biocompatible and biodegradable materials.22 Encapsulation of drugs into PLA nanospheres has been successfully achieved by double emulsion techniques,23 with enhancement of response activity.
Optimization of analytical procedures, in which one or more responses are affected by several factors and their interactions, is commonly performed using response surface methodology (RSM).24 It has been reported that use of RSM can reduce the number of experimental trials needed and allow evaluation of the interactions between multiple parameters.25 In RSM, the objectives are to find the combination of factors that yield the optimum response and to provide a mathematical model for establishing statistical predictions.26 The Box–Behnken design (BBD) is one popular form of RSM, and as it appears to be more effective than many of the other forms, it is now acknowledged as one of the best statistical and analytical models for RSM.27,28 In the present study, PHY-loaded PLA (PHYP) nanospheres were prepared by double emulsion solvent evaporation, and the preparation was evaluated by RSM to identify the optimum conditions. The variables (concentration of poloxamer 199 [F68] [w/v], concentration of PLA [mg/mL], and ratio of PLA to drug [w/w]) in the PHYP nanospheres preparation process were investigated and optimized using BBD (three factors and three levels). In addition to evaluating the characteristics of PHYP nanospheres, splenocyte proliferation in vitro was measured in order to compare the immunological enhancement activity of PHYP nanospheres with PHY and other control preparations, using the 3-(4,5-dimethylthiazol-2-yl)-2,5-diphenyltetrazolium bromide (MTT) tetrazolium reduction assay.29 The aim of this study was to obtain immunological enhancement of PHY using the PLA delivery system.
Materials and methods
Materials
PHY (75%, catalog no CY150310) was procured from Shaanxi Ciyuan Biotechnology Co., Ltd. PLA with a carboxylic end group (MW 50 kDa) was acquired from Shandong Daigang Biotechnology Co., Ltd. Poloxamer 188 (F68; MW 8,350±1,000) was obtained from Shanghai Yuanye Biotechnology Co., Ltd. Sephadex G-50 (catalog no 9048-71-9) was purchased from Pharmacia Biotechnology Co., Ltd. Tween-80 was manufactured by Beijing Soledad Science and Technology Co., Ltd. RPMI-1640, supplemented with 10% fetal bovine serum (FBS; both Thermo Fisher Scientific, Waltham, MA, USA), penicillin 100 IU/mL, and streptomycin 100 IU/mL, was used for cell culture and as a diluent for drug and nanospheres. Dulbecco’s Modified Eagle’s Medium (DMEM; Sigma-Aldrich Co., St Louis, MO, USA) was used for the colloidal stability study. MTT, phytohemagglutinin (PHA), and lipopolysaccharide (LPS) were purchased from Sigma-Aldrich Co. Anti-CD3e-PE-Cyanine5, anti-CD4-FITC, and anti-CD8a-PE antibodies were supplied by eBioscience Inc. (San Diego, CA, USA). Acetone, dimethyl sulfoxide, phenol, sodium chloride, and other chemicals were of analytical grade and used without further purification.
Preparation and evaluation
Preparation
PHYP was synthesized by double emulsion solvent evaporation as described previously30 (Figure 1). In brief, the internal aqueous phase (IAP; containing weighed PHY) was emulsified into the organic phase (consisting of the desired concentration of PLA solution in acetone) by magnetic stirring. The resulting primary emulsion (W/O) was added dropwise into the external aqueous phase (EAP; consisting of the required concentration of F68 [used as an emulsifier and stabilizer] in deionized water) and then mixed completely by vortex for preparation of nanospheres. The resulting dispersion (W/O/W) was subjected to rotary evaporation under reduced pressure to remove the highly volatile organic solvent (acetone) and form a colloidal solution. The concentrated nanospheres were subjected to centrifugation (3,500 rpm for 8 minutes) to remove any nanospheres that were too large, and the supernatant (containing the smaller nanospheres) was collected for further assessment. For the in vitro release study, the supernatant was freeze-dried to obtain a free-flowing powder, which was stored at 4°C until use.
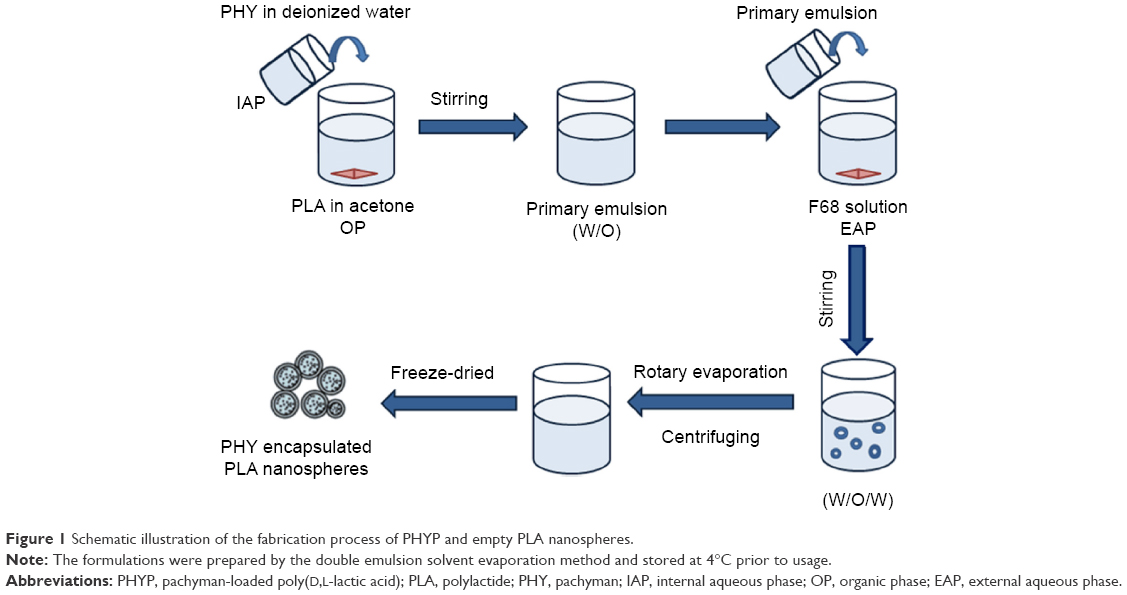 | Figure 1 Schematic illustration of the fabrication process of PHYP and empty PLA nanospheres. |
Sham particles were prepared using the same method without adding PHY to the IAP.
Encapsulation efficiency
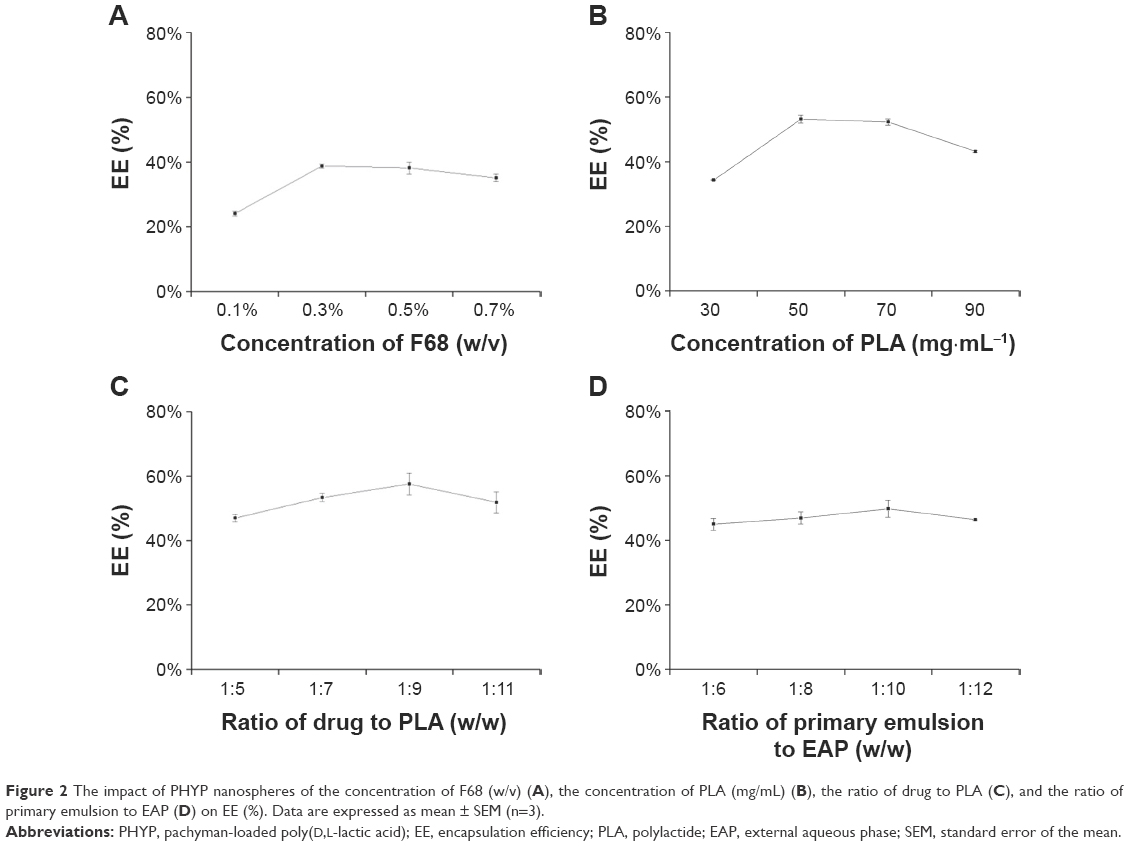
The amount of PHY encapsulated in PLA nanospheres was determined by a modified microcolumn centrifugation method.31 First, Sephadex G-50 powder was soaked in 0.9% NaCl overnight until completely swollen. Then, a filter pad was inserted into a 2 mL syringe that had been out of piston, and the swollen Sephadex G-50 was carefully added dropwise into it, taking care to ensure the removal of bubbles in the column. The loaded column was centrifuged at 1,500 rpm for 5 minutes to remove excess water. The 0.6 mL nanosphere suspension was added slowly and carefully into the prepared column, which was then centrifuged at 1,500 rpm for 5 minutes. The unencapsulated PHY was adsorbed to the gel inside the column, while the PHYP nanospheres passed through the column and were collected for analysis. The vitriol–phenol method was used to quantitatively assay the accurate content of encapsulated PHY by ultraviolet/visible light spectroscopy at 490 nm. Encapsulation efficiency (EE) was calculated using the following equation:
|
|
where Ce is the amount of encapsulated PHY and Ct is the total content of the drug. All analyses were carried out in triplicate.
Optimization experiments and methods
One-variable-at-a-time experiments
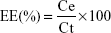
PHYP nanospheres were prepared as described earlier. In this experiment, the EE was considered as the evaluation indicator. The impact of other investigated factors (concentration of F68, concentration of PLA, ratio of drug to PLA, and ratio of primary emulsion to EAP) on EE in the one-variable-at-a-time experiments was assessed.
Optimization conditions by RSM
Based on the results of the preliminary single factor experiments for PHYP nanospheres preparation, a three-variable–three-coded level BBD that had a significant influence on EE was used for RSM to obtain the optimal processing parameters. The variables considered were concentration of F68 (w/v), concentration of PLA (mg/mL), and ratio of PLA to drug (w/w), which were termed X1 (A), X2 (B), and X3 (C), respectively. The levels of each variable were designated as the coded terms −1, 0, and +1, respectively. For developing the model, the response values were set so that X1 (A) ranged from 0.1 to 0.5, X2 (B) ranged from 30 to 70, and X3 (C) ranged from 7 to 11, which corresponded to the three coded terms. The whole design was composed of 17 experiments carried out in a random order, including five replicates (treatments 13–17) at the center point for estimation of a pure error sum of squares.
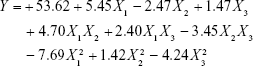
The optimized conditions were predicted, and the data were disposed by Design Expert Version 8.06 software and then fitted to an empirical second-order polynomial regression model, as shown in the following quadratic equation:
|
|

where Y is the predicted response for dependently measured variable, A0 is a constant, and Ai, Aii, and Aij are coefficients estimated by the model, while Xi and Xj correspond to the independent variables that represent the linear, quadratic, and cross product effects of the X1, X2, and X3 factors (i≠j). In response, the effects of each independent variable were assessed by the model. Analysis of variance (ANOVA) was used to investigate the statistical significance of the regression coefficients, based on the total error criteria with a confidence level of 95% (P<0.05).
Characterization
The size (hydrodynamic diameter), size distribution (polydispersity index [PDI]), and zeta potential (surface charge) of the nanospheres were measured by dynamic light scattering using a dispersion unit (Hydro2000Mu) and size analyzer (MAL10091170; both Malvern Instruments, Malvern, UK). Freshly prepared PHYP and PLA nanosphere suspensions were measured under exactly the same temperature and humidity conditions in order to reduce deviation as far as possible.
The surface morphology of PHYP nanospheres were visualized using a transmission electron microscope (Model H-7650, Philips Co., Ltd, Holland, the Netherlands). A drop of the loaded or empty nanosphere dispersion was placed in the form of a thin film on a carbon-coated copper grid and then negatively stained with 1% (w/v) phosphotungstic acid solution. The excess solution was removed using filter paper, and grids were air-dried prior to observation.
In vitro drug release
In vitro PHY release from PHYP nanospheres was evaluated by equilibrium dialysis as described previously.32 To meet the suitable sink condition, phosphate-buffered saline (PBS, pH=7.4) containing 0.1% (v/v) Tween-80 was chosen as the release medium. In brief, the freeze-dried powders of PHY and PHYP were separately weighed and resuspended in 1 mL release solution, and both were added into a separate dialysis bag (molecular weight cutoff of 3,500 Da). The tightly sealed bags were then immersed into 30 mL medium in a conical flask, and the whole system was incubated in a water bath at 37°C with a shaking speed of 100 rpm. At predetermined time intervals (2, 4, 6, 8, 10, 12, 24, 48, 72, and 96 hours), 0.5 mL aliquots of the incubation medium were withdrawn and replaced by an equal volume of fresh solution. The aliquots were quantitatively measured at 490 nm using a ultraviolet–visible light spectrometer. Data represent mean ± standard error of the mean (SEM) of triplicate measurements.
Colloidal stability
To assay the in vitro colloidal stability of nanospheres, they were divided into the following several groups using different media as the diluent prior to measurement, containing equivalent fresh nanosphere solution: Group 1: blank PBS (pH=7.4); Group 2: PBS (pH=7.4) containing 10% FBS; Group 3: blank DMEM (pH=7.4); Group 4: DMEM (pH=7.4) containing 10% FBS; and Group 5: deionized water (control). Samples were incubated in a rotating water bath at 37°C and 90 rpm, and nanosphere size was measured at 3 hours and 12 hours using the same procedure as described earlier. The results were reported as mean ± SEM (n=3).
In vitro lymphocyte study
Mouse lymphocyte preparation
Nonimmunized ICR mice (4–6 weeks of age) were killed, and the spleens were transferred aseptically to Petri dishes, then cut into small pieces, minced, and pressed through a stainless steel mesh (200 mesh) prewetted with PBS (pH =7.4). Homogeneous cell suspensions were collected, and then the red blood cells were removed by adding 0.83% NH4Cl in 0.01 M Tris/HCl (pH =7.2), and cells were washed twice with PBS. Finally, the density of cell suspension was set at 5.0×10⁶ cells/mL in complete RPMI-1640 medium, which was supplemented with 10% FBS and 100 IU/mL penicillin and 100 IU/mL streptomycin. The intended colloidal solutions (PHYP, PLA, and PHY) were sterilized by autoclaving prior to the experiments.
All animal-handling procedures were performed according to the Guide for the Care and Use of Laboratory Animals of the National Institutes of Health and followed the guidelines of the animal Welfare Act. All animal experiments were approved by the Nanjing Agricultural University Animal Care Committee.
Cytotoxicity assay
The cytotoxic effects of empty PLA nanospheres and free or encapsulated PHY were evaluated by MTT assay to determine the safe dose for cells. Cells cultured in serum-free RPMI-1640 medium were used as the control. Freshly prepared lymphocytes were seeded into 96-well transparent plates at 100 μL/well, and incubated with 100 μL of PHYP, PLA, or PHY solution at different concentrations (produced by the double dilution method). All sealed plates were cultivated at 37°C in a humidified atmosphere with 5% CO2 for 48 hours. The reaction was stopped by dissolving the formazan crystals by 100 μL/well of dimethyl sulfoxide, which generated owing to an addition of 30 μL MTT solution (5 mg/mL). The plates were vibrated for 10 minutes until complete dissolution was obtained. Quantification measurements (optical density) were obtained by spectrophotometric analysis at a wavelength of 570 nm. A reduction in optical density indicated a reduction in cell viability, compared to cells incubated in control medium (considered as 100% cell viability). For the three colloidal solutions, drug concentrations corresponding to cell viability of >75% were considered safe and used for the proliferation assay.
Lymphocyte proliferation assay
The effects on proliferation of lymphocytes stimulated by free PHY, PHYP, and blank PLA nanospheres were also assessed using the MTT method. For the assay, aliquots (80 μL) of freshly isolated cells were plated into 96-well microplates, and then 20 μL of PHA or LPS (both at 10 μg/mL final concentration) were added as T-cell or B-cell mitogens, respectively, and the cells were treated with 100 μL PHYP, PHY, or PLA at five different concentrations (3.906, 7.813, 15.625, 31.25, and 62.5 μg/mL) chosen from the safe concentration range obtained by the cytotoxicity assay. Each concentration in each group was repeated four times. Controls were prepared by substituting equivalent drug-free RPMI-1640 (drug control) and empty nanospheres (blank control). The plates were incubated under standard culture conditions in a humidified incubator at 37°C and 5% CO2 for 48 hours. The procedures that followed were similar to those described earlier for cytotoxicity evaluation. The A570 value was assigned as the index of proliferated consequence.
Analysis of T-lymphocyte surface markers
The lymphocyte suspension was diluted to 3.0×10⁶ cells/mL, and then treated with 1 mL/well of PHYP nanospheres (final concentration of 31.25, 15.625, or 7.81 3 μg/mL), PHY (final concentration of 31.25 μg/mL), empty PLA nanospheres, or free PHA (final concentration of 10 μg/mL) in 24-well culture plates. The treated cultures were prepared in triplicate and incubated at 37°C in 5% CO2, and then 48 hours later, aliquots of the cells were removed, washed, and incubated with a mixture of the anti-CD3e-PE-cyanine5, anti-CD4-FITC, and anti-CD8a-PE antibodies at 4°C in the dark. After incubation for 30 minutes, the stained cells were washed twice with PBS and analyzed by flow cytometry (FACS Calibur; BD Biosciences, San Jose, CA, USA). Cells incubated with PHA were used as the positive control, and cells incubated without any treatments were used as the negative control. The data were analyzed by FlowJo 7.6 software.
Statistical analysis
All experimental results were reported as mean values (n=3) with their corresponding SEM. The optimal preparation conditions for PHYP nanospheres were evaluated by Design Expert Version 8.06, and the data from the BBD analysis were subjected to regression analysis to obtain the mathematical parameters of the model, which plotted the three-dimensional response surfaces. The results were analyzed by one-way ANOVA. All analyses were performed using IBM SPSS Statistics 20.0 software. P<0.05 was considered statistically significant.
Results
Impact of four individual factors on EE of PHYP nanospheres
As shown in Figure 2A, F68 (w/v) was used at concentrations of 0.1%, 0.3%, 0.5%, and 0.7%, while the other controllable preparation conditions of PHYP nanospheres were held at a constant level. The results revealed that the most suitable concentration of F68 was 0.3%, which was used for later experiments.
 | Figure 2 The impact of PHYP nanospheres of the concentration of F68 (w/v) (A), the concentration of PLA (mg/mL) (B), the ratio of drug to PLA (C), and the ratio of primary emulsion to EAP (D) on EE (%). Data are expressed as mean ± SEM (n=3). |
Figure 2B shows that the concentrations of PLA used were 30, 50, 70, and 90 mg/mL, while the other controllable preparation conditions of PHYP nanospheres were held at a constant level. The most suitable concentration of PLA was found to be 50 mg/mL, and this was used in later experiments.
As shown in Figure 2C, four ratios of drug to PLA (1:5, 1:7, 1:9, and 1:11) were used, while the other controllable preparation conditions of PHYP nanospheres were held at a constant level. The results revealed that the most suitable ratio of drug to PLA was 1:9, which was used in later experiments.
As shown in Figure 2D, the four ratios of primary emulsion to EAP were 1:6, 1:8, 1:10, and 1:12, while the other controllable preparation conditions of PHYP nanospheres were held at a constant level. The most suitable ratio of primary emulsion to EAP was found to be 1:10, which was used in later experiments.
Statistical analysis and model fitting of PHYP response
RSM was conducted in order to determine the concentration of F68 (w/v), concentration of PLA (mg/mL), and ratio of PLA to drug (w/w). As presented in Table 1, the experimental design and the observed and predicted response values were obtained in a random order to minimize the effects of uncontrolled factors. The EE of PHYP nanospheres ranged from 34% to 58.3%, and reached a maximum with an F68 concentration (w/v) of 0.33%, a PLA concentration of 30 mg/mL, and a PLA-to-drug ratio (w/w) of 10.25:1.
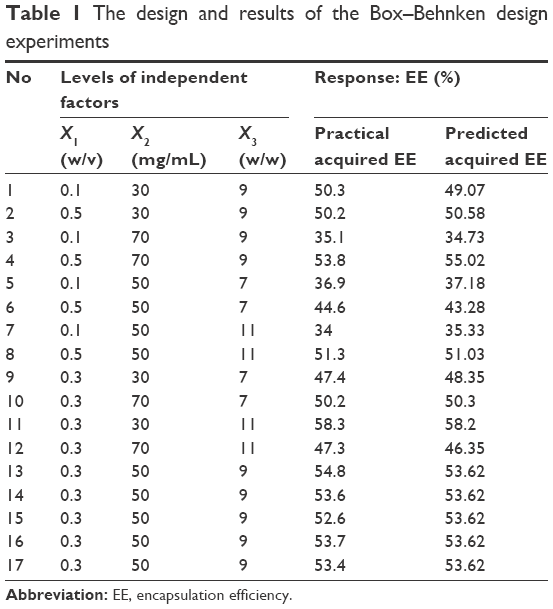 | Table 1 The design and results of the Box–Behnken design experiments |
Using multiple regression analysis on the experimental data, the predicted response Y can be obtained by the following second-order polynomial equation:
|
|
As shown in Table 2, ANOVA of the linear regression model demonstrated that the model was highly significant (P>F, P<0.0001). The P-values of F68 concentration (P<0.0001), PLA concentration (P=0.0009), and PLA-to-drug ratio (P=0.0133) were all significant, suggesting that these factors greatly influenced the Y-values. The smaller the P-value, the larger the significance of the corresponding coefficient. The F- and P-values for lack of fit were 4.7 and 0.0845, respectively, which indicated that lack of fit was insignificantly relative to the pure error. The high determination coefficient (R2=0.9862) confirmed the goodness of fit of the model, suggesting that the sample variation of 98.62% for PHYP was attributable to the variable factors. The predicted R2 of 0.8233 was in reasonable agreement with the adjusted R2 of 0.9685. Both the predicted and adjusted R2-values indicated that the accuracy and general availability of the model were adequate.
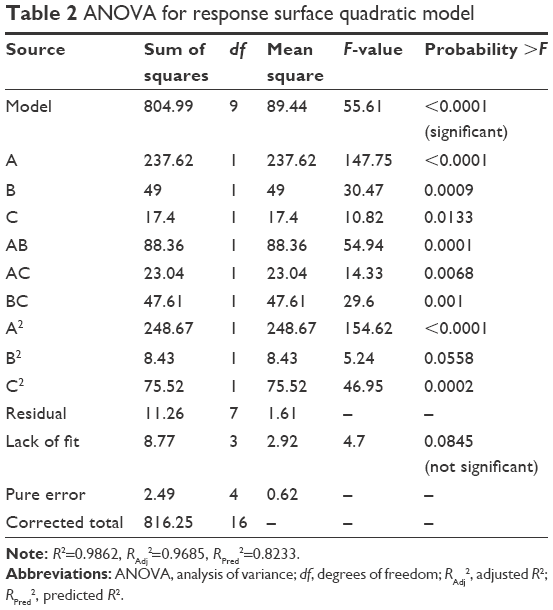 | Table 2 ANOVA for response surface quadratic model |
Optimization of conditions for PHYP nanospheres preparation
To illustrate the correlations between the dependent and independent variables, three-dimensional response surface plots and two-dimensional contour plots were built based on the model equations mentioned earlier. Figure 3A–E shows three independent response surface plots and their respective contour plots, showing the interaction effects of these factors on the responses. The three-dimensional response surface represents the interactions between the two variables, while the other variables were fixed constant at their respective zero level.
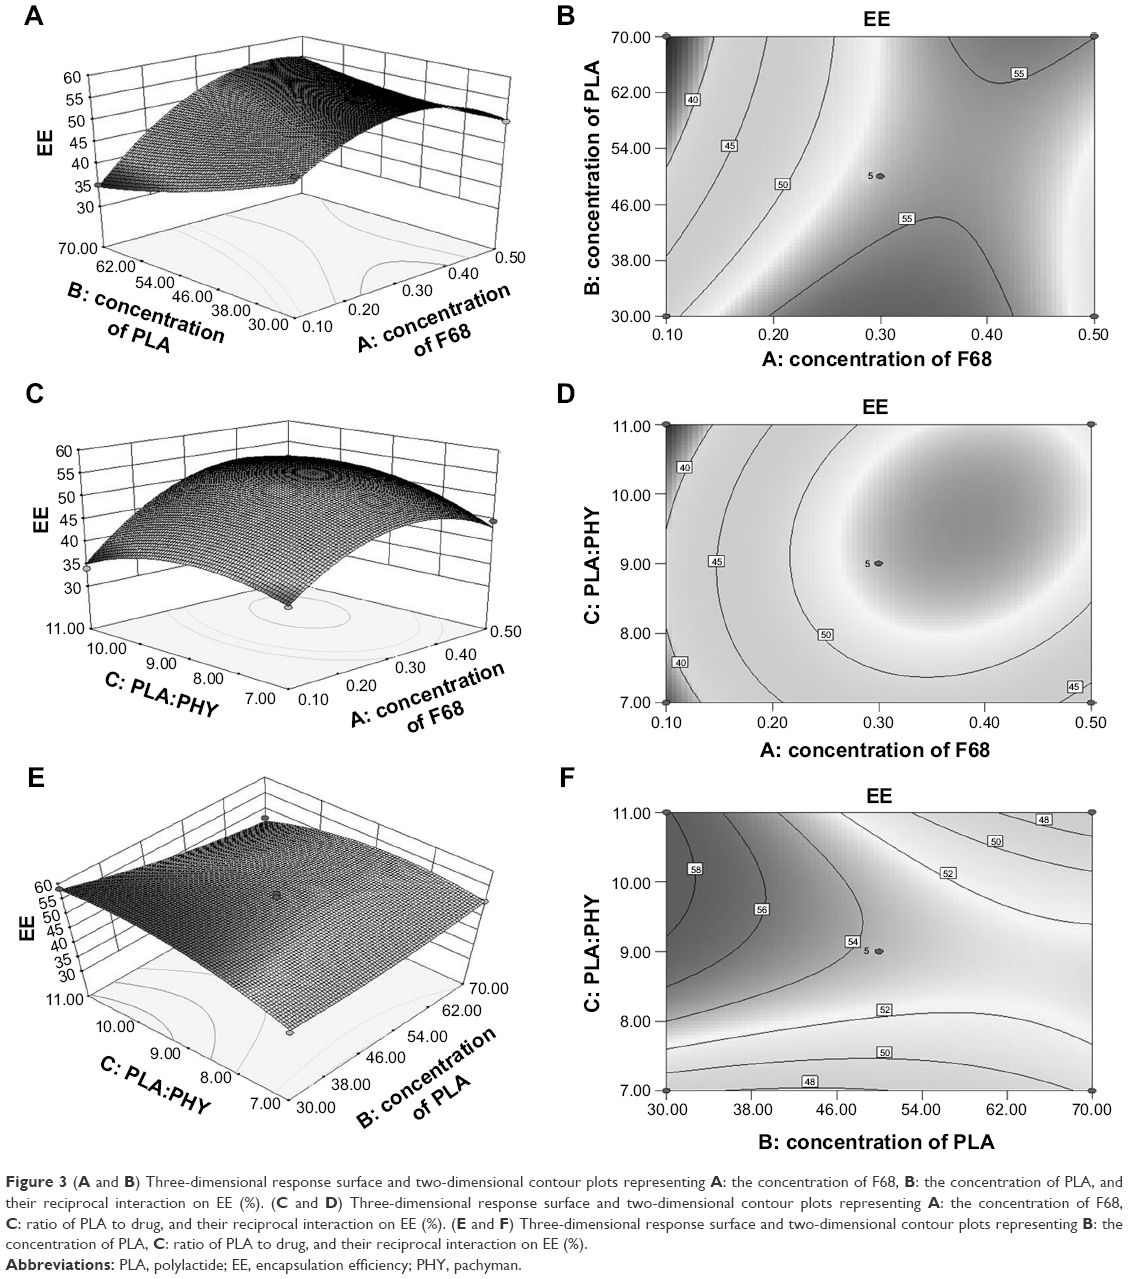 | Figure 3 (A and B) Three-dimensional response surface and two-dimensional contour plots representing A: the concentration of F68, B: the concentration of PLA, and their reciprocal interaction on EE (%). (C and D) Three-dimensional response surface and two-dimensional contour plots representing A: the concentration of F68, C: ratio of PLA to drug, and their reciprocal interaction on EE (%). (E and F) Three-dimensional response surface and two-dimensional contour plots representing B: the concentration of PLA, C: ratio of PLA to drug, and their reciprocal interaction on EE (%). |
With regard to the combined influence exhibited by both the F68 concentration (w/v) and the PLA concentration (mg/mL; Figure 3A and B), their reciprocal interaction on EE displayed a small but steady increase initially and then declined as the concentration of F68 increased, while a small amount of transformation was observed when the concentration of PLA was increased.
With regard to the combined influence exhibited by both the F68 concentration (w/v) and the PLA-to-drug ratio (w/w) (Figure 3C and D), their reciprocal interaction on EE showed a significant trend of first increase and then decrease, which implied strong interaction between these two variables.
With regard to the combined influence exhibited by both the PLA concentration (mg/mL) and the PLA-to-drug ratio (w/w; Figure 3E and F), their reciprocal interaction on EE indicated a weak interaction between these factors, which resulted in a nearly flat three-dimensional image.
The optimal conditions were identified as an F68 concentration (w/v) of 0.33%, a PLA concentration of 30 mg/mL, and a PLA-to-drug ratio (w/w) of 10.25:1, which resulted in the highest EE of 59.10%.
Characterization
As shown in Table 3, production of PLA nanospheres with or without PHY in their core resulted in almost the same particle size of 245 nm in diameter, and the PDI was low, indicating a homogeneous size distribution (Figure 4A and B). The zeta potential values were negative for both, with the value for PHYP nanospheres being slightly lower. These negative values may be the consequence of ionized groups from the emulsifier layer being present on the surface of the nanospheres.33,34 The surface morphology of PHYP and PLA nanospheres was assessed by transmission electron microscopy (Figure 4C and D). The nanospheres displayed a spherical shape with a smooth surface and uniform size, but the particle sizes were smaller than those predicted (Table 3). This may be due to the hydration shell encircling the nanospheres. In addition, both PHYP and PLA nanospheres had similar particle sizes (Table 3 and Figure 4A and B).
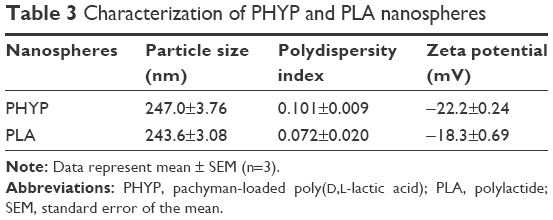 | Table 3 Characterization of PHYP and PLA nanospheres |
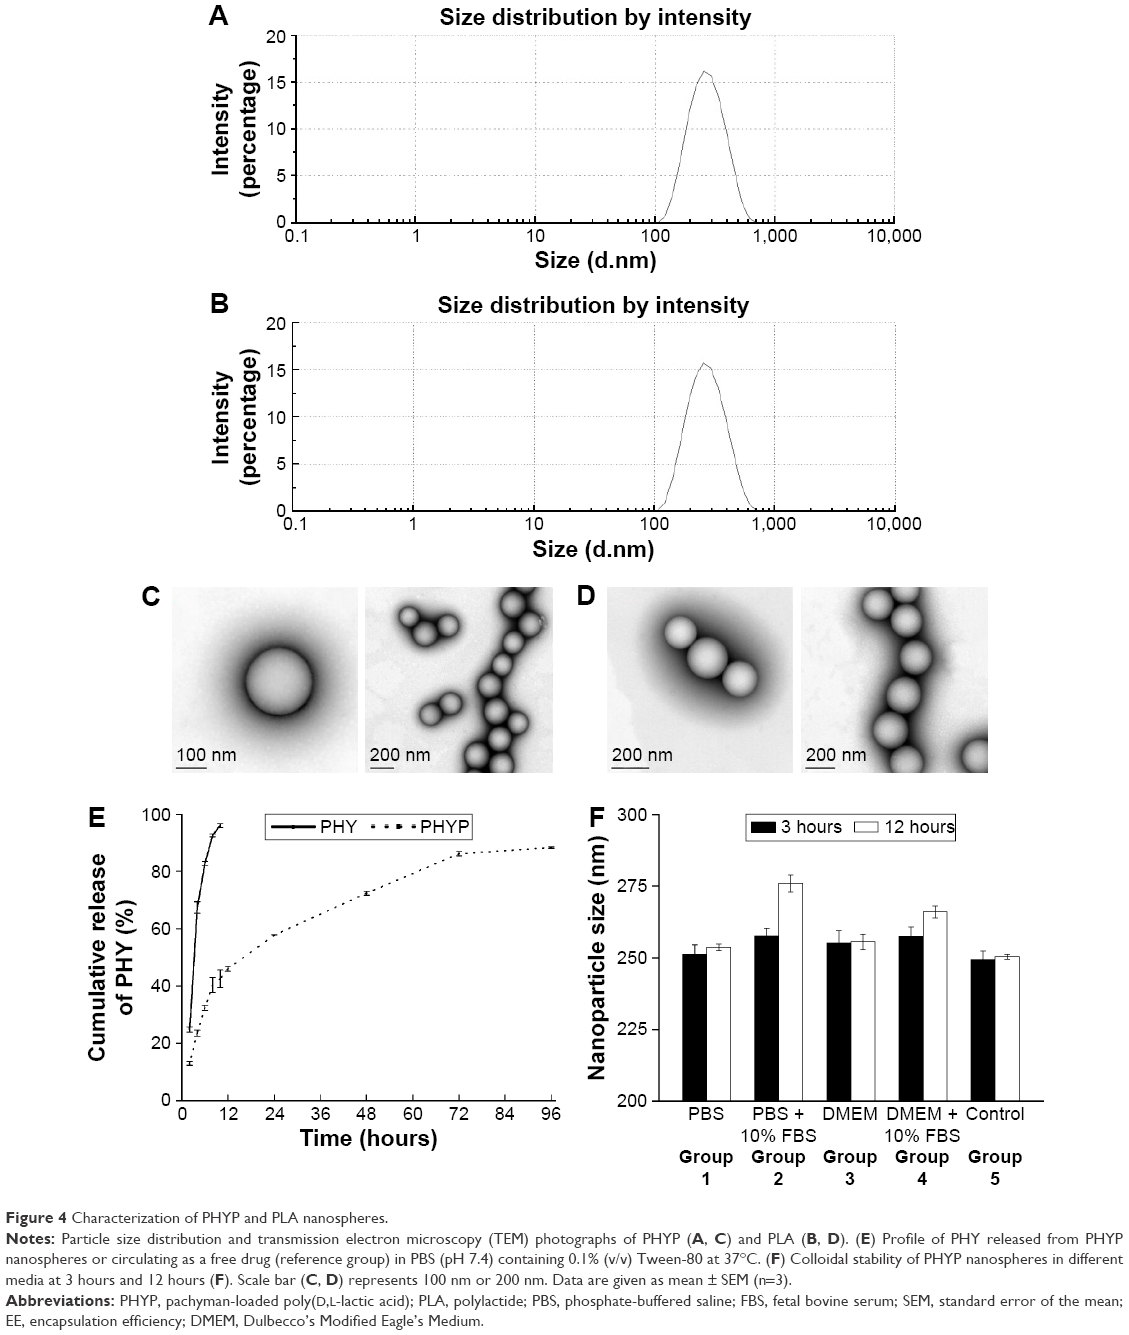 | Figure 4 Characterization of PHYP and PLA nanospheres. |
These characterizations indicated that both PHYP and PLA nanospheres appeared to have similar surface morphology, size, size distribution, and zeta potential, suggesting that encapsulating PHY into PLA did not affect the physical properties of the PLA nanospheres.
In vitro drug release
In vitro drug release profiles of free PHY only and of PHY released from PHYP nanospheres in medium are shown in Figure 4E. The whole experiment was evaluated over 96 hours. As shown in the case of the PHYP nanospheres, there was an initial burst release in the first 12 hours then over the following time, the curve became more slight and sustained. At the end of 96 hours, the growth trend reached a plateau. In contrast, without nanospheres, ~96.1% of the free PHY was released during the first 10 hours, showing that PHY incorporated in PLA displayed a considerably slower release rate than PHY only. This is called the retardant effect, which may be ascribed to stabilization of molecules in the EAP of nanospheres.
Colloidal stability
The colloidal stability of PHYP nanospheres in different media is shown in Figure 4F. There was no distinct variation in nanosphere size in Group 1 (PBS), Group 3 (DMEM), or Group 5 (control) at 3 hours and 12 hours, suggesting that these nanospheres are relatively stable, which may account for the comparatively low release of PHY during the first 12 hours. Both PBS (Group 2) and DMEM +10% FBS (Group 4) produced an apparent and significantly different increase in PHYP size at 3 hours and 12 hours. The presence of enzymes in the plasma was the major reason for this. It was speculated that the lipase in plasma could accelerate degradation of the polymer nanospheres. The PHYP nanospheres size appeared to be more stable in Group 4 compared with Group 2, implying that when used for cell culture, PHYP nanospheres can be maintained at a relatively stable state during the initial release stage in DMEM + 10% FBS.
Evaluation of lymphocyte study
Cytotoxicity assay
The cytotoxicity of PHYP, PHY, and PLA was assessed by MTT assay after incubating each of them with freshly prepared lymphocytes for 48 hours. The cell viability results are presented in Figure 5A, and indicated that the cytotoxicity of all three treatments increased gradually as the concentrations increased. Compared with the other two groups (PHY and PLA), the cell viability of the PHYP group signified a highest–lowest trend. It was found that the cytotoxicity of PHYP, PHY, and PLA all showed similar dose–response effects. The concentrations corresponding to cell viability of >75% were 62.5 μg/mL (31.25 μg/mL of final concentration) and lower, which were designated as safe concentrations with comparatively low cytotoxicity against lymphocytes. The obtained concentrations supplied the rationale for the proliferation assay that followed.
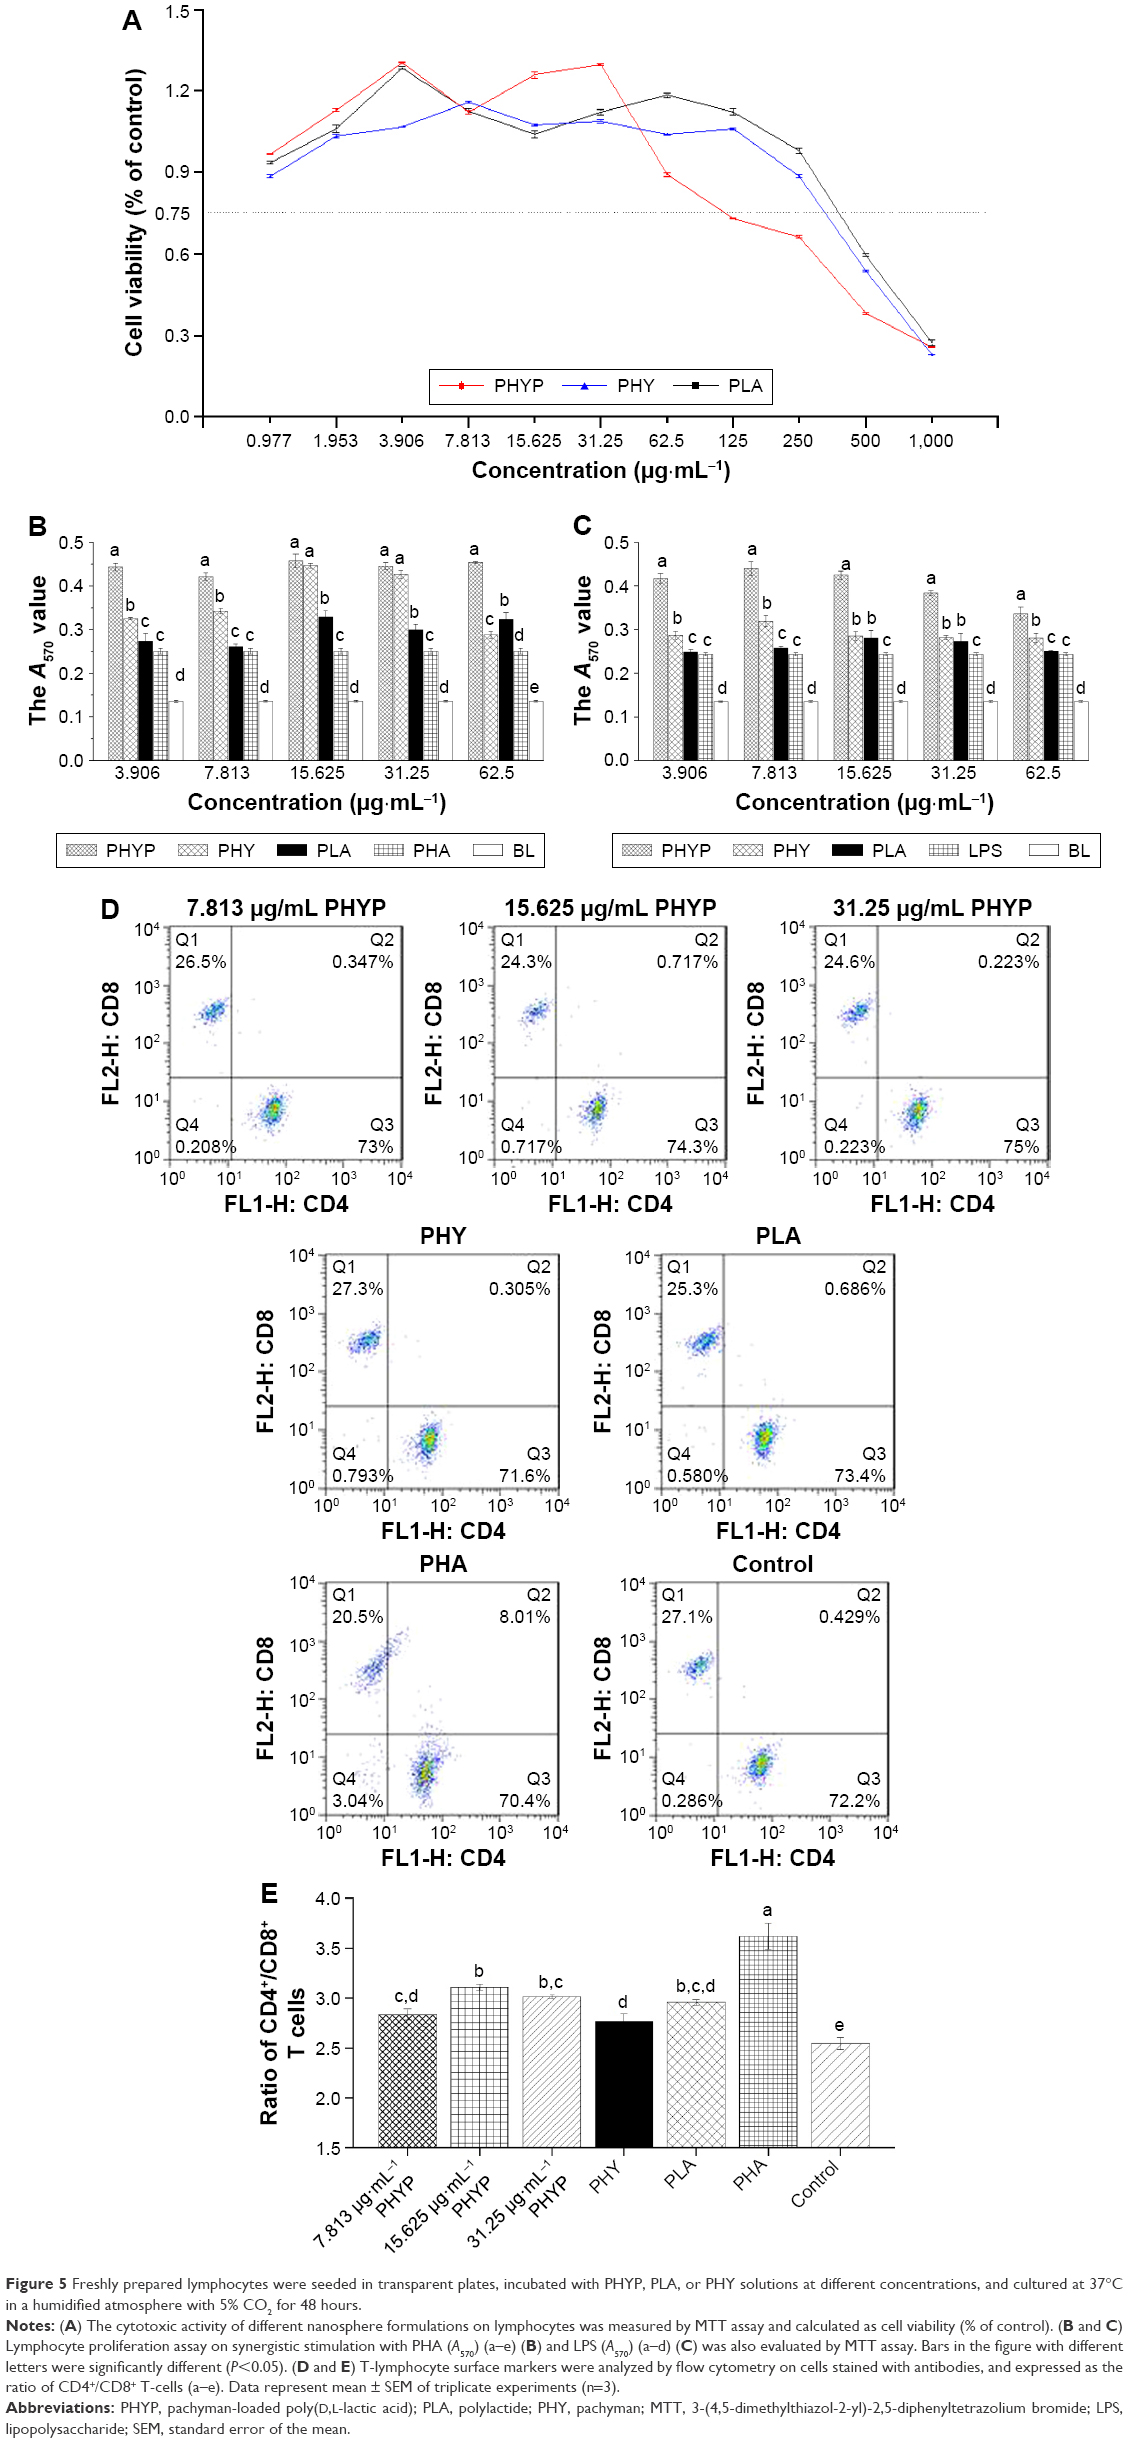 | Figure 5 Freshly prepared lymphocytes were seeded in transparent plates, incubated with PHYP, PLA, or PHY solutions at different concentrations, and cultured at 37°C in a humidified atmosphere with 5% CO2 for 48 hours. |
Lymphocyte proliferation assay
Proliferation of splenic lymphocytes is a crucial indicator of immune response, especially cellular immune function; therefore, proliferation of lymphocytes treated with blank PLA and free or nanosphere-loaded PHY at a series of concentrations based on the cytotoxicity assay was evaluated.
Figure 5B shows the impact of drug stimulation on lymphocyte proliferation in concert with PHA. In comparison with the other groups at all concentrations, PHYP nanospheres exhibited significantly greater A570 values (P<0.05), except at concentrations of 15.625 and 31.25 μg/mL. The A570 values of PHY were significantly higher than those of PLA, the PHA control, and blank control (P<0.05) and reached the highest values at 15.625 and 31.25 μg/mL. Differentiation of lymphocytes in the PLA group was observed only at higher concentrations (P<0.05).
Figure 5C shows the impact of drug stimulation on lymphocyte proliferation in concert with LPS. The results were consistent with the results of the previous two experiments, in that the A570 values of PHYP nanospheres were the highest compared with the other four groups (P<0.05). PLA demonstrated a significant difference (P<0.05) from the PHY and LPS groups at 3.906, 7.813, and 62.5 μg/mL (PHY) and at 15.625 and 31.25 μg/mL (LPS).
In synergistic stimulation with PHA or LPS, not only PHYP, PHY, and PLA but also the corresponding control groups of the five concentrations were significantly higher than blank control (P<0.05). It was speculated that both T- and B-lymphocytes were activated by PHYP and PHY, and the immunological competence of the lymphocytes was significantly enhanced by encapsulated PHY but not by free PHY.
Effect of CD4+/CD8+ ratio on T-lymphocytes
For the T-lymphocyte surface markers assay, cells were treated with PHY, empty PLA nanospheres, PHA, and serial concentrations of PHYP nanospheres for 48 hours prior to assessment by flow cytometry. Given that in vitro T-cell activation augments CD3 expression, the CD3 population was selected as the positive expression population, and subgated for CD4 or CD8 expression. The ratio of CD4+ to CD8+ T-cells was evaluated. The percentage of CD4+ T-cells and CD8+ T-cells during treatment with several concentrations of PHYP and in the other compared groups is presented in Figure 5. Figure 5D and E shows that the PHYP group had a significantly higher ratio of CD4+ to CD8+ T-cells than the control groups (except the positive control) for three concentrations (P<0.05). In addition, PHYP nanospheres at 15.625 μg/mL revealed the highest specific value, which was significantly greater than that for PHY (P<0.05).
Discussion
This study analyzed the optimal preparation conditions for PHYP nanospheres by RSM, evaluated several characteristics of the nanospheres, explored their release properties and stability, and discussed their effects on splenic lymphocytes.
Because the one-variable-at-a-time experiment has the disadvantages of neglecting interactive effects between variables and of consuming large amounts of reagents and materials, RSM was used for later preparation assays. As shown in Figure 1, the specific preparation process for PHYP was obtained by the one-variable-at-a-time method, and then optimized by RSM. The optimal preparation conditions were identified as an F68 concentration (w/v) of 0.33%, a PLA concentration of 30 mg/L, and a ratio of PLA to drug (w/w) of 10.25:1, which obtained the highest EE of 59.0985%. These conditions were then used to prepare PHYP nanospheres prior to other assessments.
Various investigations have shown that drug-loaded PLA nanospheres present defined features in terms of biocompatibility, dimensions, high loading, and ability for controlled release.35,36 The immune response might be influenced by particle size, surface charge, and drug release, which may be attributed to the interaction between the cell and particle during cellular uptake.37,38 Table 3 and Figure 4 show that the PHYP nanospheres had a spherical shape with smooth surface and narrow size distribution. Meanwhile, the properties of the PHYP colloid were generally stable (Figure 4F), and the drug release of PHYP nanospheres compared with PHY was also shown to be controllable (Figure 4E).
T- and B-cells comprise the splenic lymphocytes, and evaluation of their proliferation is the most direct indicator of cellular immune function. It has been shown that CD4+ helper/inducer and CD8+ cytotoxic/suppressor T-lymphocytes display different effector functions, while CD4 and CD8 molecules are coreceptors involved in immune activation and regulation.39,40 The CD4+:CD8+ ratio is regarded as an important factor in determining immunity states and levels and has been used for diagnosing sarcoidosis.
PLA nanospheres have been identified as a promising vaccine carrier because they can potentially deliver antigens or drugs to the desired locations at predetermined rates and durations to generate an expected immune response.41 In the present study, lymphocytes were incubated isolated from mouse spleen with concentrations of PHYP nanospheres previously determined to be in the safe range (Figure 5A). The obtained concentrations were selectively used to assess lymphocyte proliferation, while the T- and B-cells were separately measured synergistically with PHA and LPS (Figure 5B and C). PHYP nanospheres revealed a marked influence on the CD4+:CD8+ ratio compared with the PHY and control group (Figure 5D and E).
There are no reports of PHY encapsulated in PLA nanospheres in the literature on drug-loaded PLA nanospheres. The results of the present study concluded that PHYP is able to act as a novel delivery tool for improving the immune functions of organisms. These data may provide direct evidence and a rationale for the potential clinical application of PHYP nanospheres. Because the immune response is a multistep programmed process, mainly including dendritic cell recruitment, antigen presentation, and T-cell activation, the mechanism of how PHYP nanospheres function between the lymphocytes and antigen-presenting cells and whether PHYP nanospheres can act as a potent adjuvant for vaccines in vivo are subjects for further study.
Conclusion
This study successfully prepared uniformly sized PHYP nanospheres and assessed the preparation conditions by RSM, which identified the optimal preparation conditions as an F68 concentration (w/v) of 0.33%, a PLA concentration of 30 mg/mL, and a PLA-to-drug ratio (w/w) of 10.25:1, which obtained the highest EE of 59.10%. As PLA has previously reported to serve as a drug delivery system, this study developed PHYP nanospheres as an adjuvant to enhance cellular immune responses. It was concluded that PHYP nanospheres produced a sustained release rate of drug, which at concentrations within the previously identified safe range had an evident effect on splenic lymphocyte proliferation and the CD4+:CD8+ T-cell ratio. In brief, these findings suggest PHYP nanospheres as a novel formulation for a drug delivery system, and its wider application should be studied further.
Disclosure
The authors report no conflicts of interest in this work.
References
Ding Q, Jiang S, Zhang L, Wu C. Laser light-scattering studies of pachyman. Carbohydr Res. 1998;308:339–343. | ||
Hu Y, He XR, Lei L, Liang SC, Qiu GF, Hu XM. Preparation and characterization of self-assembled nanoparticles of the novel carboxymethyl pachyman-deoxycholic acid conjugates. Carbohydr Polym. 2008;74:220–227. | ||
Hu Y, Zhou XJ, Lu Y, Hu CY, Hu XM. Novel biodegradable hydrogels based on pachyman and its derivatives for drug delivery. Int J Pharm. 2009;371(1–2):89–98. | ||
Ke RD, Lin SF, Chen Y, Ji CR, Shu QG. Analysis of chemical composition of polysaccharides from Poria cocos wolf and its anti-tumor activity by NMR spectroscopy. Carbohydr Polym. 2010;80:31–34. | ||
Chihara G, Hamuro J, Maeda Y, Arai Y, Fukuoka F. Antitumour polysaccharide derived chemically from natural glucan (pachyman). Nature. 1970;225(5236):943–944. | ||
Wang YF, Zhang LN, Li YQ, Hou XH, Zeng FB. Correlation of structure to antitumor activities of five derivatives of a β-glucan from Poria cocos sclerotium. Carbohydr Res. 2004;339(15):2567–2574. | ||
Hamuro J, Maeda YY, Arai Y, Fukuoka F, Chihara G. The significance of the higher structure of the polysaccharides lentinan and pachymaran with regard to their antitumour activity. Chem Biol Interact. 1971;3(1):69–71. | ||
Huang QL, Jin Y, Zhang LN, Cheung PCK, Kennedy JF. Structure, molecular size and antitumor activities of polysaccharides from Poria cocos mycelia produced in fermenter. Carbohydr Polym. 2007;70:324–333. | ||
Narui T, Takahashi K, Kobayashi M, Shibata S. A polysaccharide produced by laboratory cultivation of Poria cocos wolf. Carbohydr Res. 1980;87(1):161–163. | ||
Schinella GR, Tournier HA, Prieto JM, Mordujovich de Buschiazzo P, Rios JL. Antioxidant activity of anti-inflammatory plant extracts. Life Sci. 2002;70(9):1023–1033. | ||
Elmowafy EM, Awad GAS, Mansour S. Ionotropically emulsion gelled polysaccharides beads: preparation, in vitro and in vivo evaluation. Carbohydr Polym. 2009;75:135–142. | ||
Fahmy HM, Fouda MMG. Crosslinking of alginic acid/chitosan matrices using polycarboxylic acids and their utilization for sodium diclofenac release. Carbohydr Polym. 2008;73(4):606–611. | ||
Vimala K, Sivudu KS, Mohan YM, Sreedhar B, Raju KM. Controlled silver nanoparticles synthesis in semi-hydrogel networks of poly (acrylamide) and carbohydrates: a rational methodology for antibacterial application. Carbohydr Polym. 2009;75:463–471. | ||
Mei L, Zhang Z, Zhao L, et al. Pharmaceutical nanotechnology for oral delivery of anticancer drugs. Adv Drug Deliv Rev. 2013;65(6): 880–890. | ||
Zhang XD, Zeng XW, Liang X, et al. The chemotherapeutic potential of PEG-b-PLGA copolymer micelles that combine chloroquine as autophagy inhibitor and docetaxel as an anti-cancer drug. Biomaterials. 2014;35(33):9144–9154. | ||
Cavallaroa G, Craparoa EF, Sardoa C, Lambertib G, Barbac AA, Dalmoroc A. PHEA–PLA biocompatible nanoparticles by technique of solvent evaporation from multiple emulsions. Int J Pharm. 2015;495(2):719–727. | ||
Lassale W, Ferreira ML. PLA nano- and microparticles for drug delivery: an overview of the methods of preparation. Macromol Biosci. 2007;7(6):767–783. | ||
Schubert S, Delaney JT Jr, Schubert US. Nanoprecipitation and nanoformulation of polymers: from history to powerful possibilities beyond poly (lactic acid). Soft Matter. 2011;7:1581–1588. | ||
Brzeziński M, Biela T. Micro- and nanostructures of polylactide stereocomplexes and their biomedical applications. Polym Int. 2015;64:1667–1675. | ||
Behera T, Nanda PK, Mohanty C, Mohapatra D, Das BK, Routray P. Parenteral immunization of fish, Labeo rohita with Poly D, L-lactide-co-glycolic acid (PLGA) encapsulated antigen microparticle promotes innate and adaptive immune responses. Fish Shellfish Immunol. 2010;28(2):320–325. | ||
Deng HJ, Lei ZL. Preparation and characterization of hollow Fe3O4/SiO2@PEG-PLA nanoparticles for drug delivery. Compos B. 2013;54:194–199. | ||
Giovino C, Ayensu I, Tetteh J, Boateng JS. An integrated buccal delivery system combining chitosan films impregnated with peptide loaded PEG-b-PLA nanoparticles. Colloids Surf B Biointerfaces. 2013;112:9–15. | ||
Kanchan V, Panda AK. Interactions of antigen-loaded polylactide particles with macrophages and their correlation with the immune response. Biomaterials. 2007;28(35):5344–5357. | ||
Bezerra MA, Santelli RE, Oliveira EP, Villar LS, Escaleira LA. Response surface methodology (RSM) as a tool for optimization in analytical chemistry. Talanta. 2008;76(5):965–977. | ||
Wang RF, Chen P, Jia F, Tang J, Ma F. Optimization of polysaccharides from Panax japonicus C.A. Meyer by RSM and its anti-oxidant activity. Int J Biol Macromol. 2012;50(2):331–336. | ||
Rodríguez-González VM, Femenia A, Minjares-Fuentes R, González- Laredo RF. Functional properties of pasteurized samples of Aloe barbadensis Miller: optimization using response surface methodology. Food Sci Technol. 2012;47:225–232. | ||
Ghasemi E, Sillanpää M, Najafi NM. Headspace hollow fiber protected liquid-phase microextraction combined with gas chromatography-mass spectroscopy for speciation and determination of volatile organic compounds of selenium in environmental and biological samples. J Chromatogr A. 2011;1218(3):380–386. | ||
Zhou Y, Song JZ, Choi FF, et al. An experimental design approach using response surface techniques to obtain optimal liquid chromatography and mass spectrometry conditions to determine the alkaloids in Meconopsi species. J Chromatogr A. 2009;1216(42):7013–7023. | ||
Verma A, Prasada KN, Singh AK, Nyati KK, Gupta RK, Paliwal VK. Evaluation of the MTT lymphocyte proliferation assay for the diagnosis of neurocysticercosis. J Microbiol Methods. 2010;81(2):175–178. | ||
Paini M, Daly SR, Aliakbarian B, et al. An efficient liposome based method for antioxidants encapsulation. Colloids Surf B Biointerfaces. 2015;136:1067–1072. | ||
Liu QY, Yang XL, Xu HB, Pan KJ, Yang YJ. Novel nanomicelles originating from hydroxyethyl starch-g-polylactide and their release behavior of docetaxel modulated by the PLA chain length. Eur Polym J. 2013;49:3522–3529. | ||
Diao JP, Wang HX, Chang NN, et al. PEG–PLA nanoparticles facilitate siRNA knockdown in adult zebrafish heart. Dev Biol. 2015;406(2):196–202. | ||
Zhang YQ, Tang LN, Sun LL, et al. A novel paclitaxel-loaded poly(ecaprolactone)/poloxamer 188 blend nanoparticle overcoming multidrug resistance for cancer treatment. Acta Biomater. 2010;6(6):2045–2052. | ||
Sahoo SK, Panyam J, Prabha S, Labhasetwar V. Residual polyvinyl alcohol associated with poly (D, L-lactide-coglycolide) nanoparticles affects their physical properties and cellular uptake. J Control Release. 2002;82(1):105–114. | ||
Liang Z, Yang N, Jiang Y, et al. Targeting docetaxel-PLA nanoparticles simultaneously inhibit tumor growth and liver metastases of small cell lung cancer. Int J Pharm. 2015;494(1):337–345. | ||
Zhu DW, Tao W, Zhang HL, et al. Docetaxel (DTX)-loaded polydopamine-modified TPGS-PLA nanoparticles as a targeted drug delivery system for the treatment of liver cancer. Acta Biotechnol. 2016;30:144–154. | ||
Kumari A, Yadav SK, Yadav SC. Biodegradable polymeric nanoparticles based drug delivery systems. Colloids Surf B Biointerfaces. 2010;75(1):1–18. | ||
Patil S, Sandberg A, Heckert E, Self W, Seal S. Protein adsorption and cellular uptake of cerium oxide nanoparticles as a function of zeta potential. Biomaterials. 2007;28(31):4600–4607. | ||
Gao GF, Rao Z, Bell JI. Molecular coordination of alphabeta T-cell receptors and coreceptors CD8 and CD4 in their recognition of peptide-MHC ligands. Trends Immunol. 2002;23(8):408–413. | ||
Julius M, Maroun CR, Haughn L. Distinct roles for CD4 and CD8 as co-receptors in antigen receptor signaling. Immunol Today. 1993;14(4):177–183. | ||
Rauta PR, Nayak B. Parenteral immunization of PLA/PLGA nanoparticle encapsulating outer membrane protein (Omp) from Aeromonas hydrophila: evaluation of immunostimulatory action in Labeo rohita (rohu). Fish Shellfish Immunol. 2015;44(1):287–294. |
 © 2016 The Author(s). This work is published and licensed by Dove Medical Press Limited. The full terms of this license are available at https://www.dovepress.com/terms.php and incorporate the Creative Commons Attribution - Non Commercial (unported, v3.0) License.
By accessing the work you hereby accept the Terms. Non-commercial uses of the work are permitted without any further permission from Dove Medical Press Limited, provided the work is properly attributed. For permission for commercial use of this work, please see paragraphs 4.2 and 5 of our Terms.
© 2016 The Author(s). This work is published and licensed by Dove Medical Press Limited. The full terms of this license are available at https://www.dovepress.com/terms.php and incorporate the Creative Commons Attribution - Non Commercial (unported, v3.0) License.
By accessing the work you hereby accept the Terms. Non-commercial uses of the work are permitted without any further permission from Dove Medical Press Limited, provided the work is properly attributed. For permission for commercial use of this work, please see paragraphs 4.2 and 5 of our Terms.