")
Back to Journals » Neuropsychiatric Disease and Treatment » Volume 12
Evaluation of novel candidate variations and their interactions related to bipolar disorders: Analysis of GWAS data
Authors Acikel C, Aydin Son Y , Celik C, Gul H
Received 11 May 2016
Accepted for publication 2 August 2016
Published 24 November 2016 Volume 2016:12 Pages 2997—3004
DOI https://doi.org/10.2147/NDT.S112558
Checked for plagiarism Yes
Review by Single anonymous peer review
Peer reviewer comments 2
Editor who approved publication: Dr Roger Pinder
Cengizhan Acikel,1 Yesim Aydin Son,2 Cemil Celik,3 Husamettin Gul4
1Department of Biostatistics, Gulhane Military Medical Academy, 2Department of Health Informatics, Graduate School of Informatics, Middle East Technical University, 3Department of Medical Psychiatry, 4Department of Medical Informatics, Gulhane Military Medical Academy, Ankara, Turkey
Background: Multifactor dimensionality reduction (MDR) is a nonparametric approach that can be used to detect relevant interactions between single-nucleotide polymorphisms (SNPs). The aim of this study was to build the best genomic model based on SNP associations and to identify candidate polymorphisms that are the underlying molecular basis of the bipolar disorders.
Methods: This study was performed on Whole-Genome Association Study of Bipolar Disorder (dbGaP [database of Genotypes and Phenotypes] study accession number: phs000017.v3.p1) data. After preprocessing of the genotyping data, three classification-based data mining methods (ie, random forest, naïve Bayes, and k-nearest neighbor) were performed. Additionally, as a nonparametric, model-free approach, the MDR method was used to evaluate the SNP profiles. The validity of these methods was evaluated using true classification rate, recall (sensitivity), precision (positive predictive value), and F-measure.
Results: Random forests, naïve Bayes, and k-nearest neighbors identified 16, 13, and ten candidate SNPs, respectively. Surprisingly, the top six SNPs were reported by all three methods. Random forests and k-nearest neighbors were more successful than naïve Bayes, with recall values >0.95. On the other hand, MDR generated a model with comparable predictive performance based on five SNPs. Although different SNP profiles were identified in MDR compared to the classification-based models, all models mapped SNPs to the DOCK10 gene.
Conclusion: Three classification-based data mining approaches, random forests, naïve Bayes, and k-nearest neighbors, have prioritized similar SNP profiles as predictors of bipolar disorders, in contrast to MDR, which has found different SNPs through analysis of two-way and three-way interactions. The reduced number of associated SNPs discovered by MDR, without loss in the classification performance, would facilitate validation studies and decision support models, and would reduce the cost to develop predictive and diagnostic tests. Nevertheless, we need to emphasize that translation of genomic models to the clinical setting requires models with higher classification performance.
Keywords: Bipolar disorders, GWAS, MDR, Data Mining, SNP, Decision Support
Background
In the first decade of genome-wide association studies (GWASs), researchers predominantly focused on identifying individual genetic variations associated with different phenotypes.1 This allowed the application of the candidate gene approach to investigate the molecular basis of a disease. However, this strategy has not been very effective for complex genetic diseases, for which the underlying etiology tends to be polymorphisms scattered throughout the genome.2 In addition, univariate analysis, while useful in identifying isolated single-nucleotide polymorphisms (SNPs), cannot accurately model interactions between genetic and environmental factors and has limited power in associating such interactions with complex genetic diseases.3,4 Therefore, multivariate methods are recommended.5
Bipolar disorder, also known as manic-depressive illness, is a psychiatric disorder that causes unusual shifts in mood, energy, and activity levels.6 This disorder is one of the most common psychiatric disorders worldwide, and results in increased disability-adjusted life years in last decades.7 Bipolar I disorder is characterized by the occurrence of one or more manic or mixed episodes.8 Conversely, bipolar II disorder manifests as one or more major depressive episodes accompanied by at least one hypomanic episode.9,10
The heritability of bipolar disorder is estimated to be as high as 0.70 in the literature.11 Bipolar I concordance rates are ~40% in monozygotic twins and between 0% and 10% in dizygotic twins.11 The combined concordance rates of unipolar depression and bipolar disorder are 67% and 19%, respectively.12 Previous genetic studies have described multiple candidate genes in as many as 70 chromosomal regions, according to the OMIM database (Online Mendelian Inheritance in Man. http://www.omim.org/) as of April 2015. However, none of the candidates were identified as causative agents. The most frequently detected associations are found on chromosomes 6q, 8q, and 21q. Recent GWASs also identified additional loci without directly implicating them.13,14
Till date, various data mining techniques have been applied, with varying success, to analyze high-dimensional data generated by GWASs of complex genetic disorders.15 Models generated by data mining can estimate the predictive power of genotype profiles and classify individuals accordingly.16 These techniques can be applied at various stages throughout a GWAS to, for example, clean and preprocess data, reduce dimension, execute similarity searches, detect associations, implement pattern-based cluster analysis, analyze pathways, and visualize results and data.17 Nevertheless, limitations remain. For example, building a precise model would require more computing power. In addition, different methods may identify different SNP profiles for the same disease. Finally, the same data mining approach may generate different models for the same disease depending on the assumptions and the technical parameters.18 The aim of this study was to build an effective genomic model based on SNP associations and to identify candidate polymorphisms that are the underlying molecular basis of the bipolar disorders.
Methods
Data
Genotyping data were obtained from the Whole-Genome Association Study of Bipolar Disorder (dbGaP [database of Genotypes and Phenotypes] study accession number: phs000017.v3.p1) through controlled access. Whole-genome genotyping data were obtained by Affymetrix AFFY 6.0 platform and the number of oligos was declared as 934,940. The National Institute of Mental Health (NIMH) was founded in 1989 and the Genetics Initiative is a branch of NIMH, which collects genetic data for the analysis of Alzheimer’s disease, schizophrenia, and bipolar disorders. The Bipolar Disorder Genetics Initiative aims to collect nationwide demographic, clinical, and diagnostic data about bipolar disorders. NIMH resources are shared worldwide with investigators who work on etiology of bipolar disorders.19,20
The data sets include genotypes and phenotypes of patients with bipolar disorder only, who comprise a subset of all bipolar cases, excluding patients categorized as having bipolar and related disorders. Patients which gave consent for general research use were used as controls, which included 1,767 control cases (1,081 of European ancestry and 686 of African-American ancestry) for the bipolar study, who were a subset of controls for the schizophrenia study. Control subjects have been and continue to be recruited by Financial Knowledge Network (San Jose, CA, USA), a survey and marketing research company.21 The controls assessed with Composite Instrument for Diagnostic Interviewing and patients with history of mental disorders were excluded.22
Analysis
Most widely used predictive classification algorithms in medical data mining are decision trees, artificial neural networks, rule-based classification methods, support vector machines, random forests, k-nearest neighbors (kNNs), and naïve Bayesian methods. These algorithms can also be applied to identify disease-associated SNPs.23 On the other hand, nonparametric approaches such as combinatorial partitioning, neural networks, and multifactor dimensionality reduction (MDR) detect relevant interactions between SNPs or genes by either reducing the dimensionality of the data or identifying informative hidden patterns. An advantage of these methods is that they do not make assumptions about the relationships between SNPs and phenotypes, and are therefore purely data driven. For example, MDR can use SNP–SNP interactions to predict disease susceptibility.24 To reduce the dimensionality of genome-wide association data, MDR attempts to identify combinations of SNPs instead of individual SNPs, and thereby avoids overparameterization, from which traditional regression-based methods suffer.25
The analytical approach is performed as depicted in Figure 1. Genotyping and phenotyping data were first integrated, cleaned, and transformed. Data were then preprocessed in two key steps, using Affymetrix Gene Console™ (Affymetrix Inc., Santa Clara, CA, USA) and PLINK (open-source whole-genome association analysis toolset version 1.8) to filter signals, perform background correction, normalization, and assess data quality. SNPs were filtered based on minor allele frequency (MAF) of <5% and failure of the Hardy–Weinberg equilibrium test, as indicated by P-value of <0.001. Univariate chi-square tests were also performed by PLINK. Subsequently, genome-based probabilistic models of bipolar disorder were generated using random forests, naïve Bayesian, kNNs, and MDR.
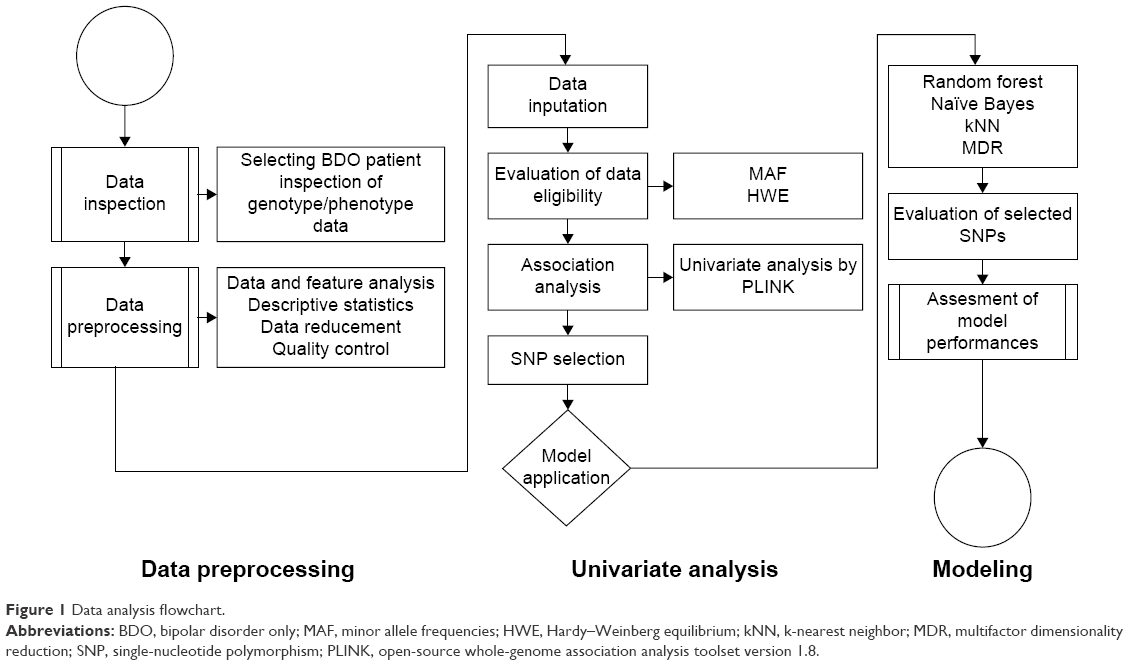 | Figure 1 Data analysis flowchart. |
Random forests
New methods have been emerging to address the limitations of classical statistics in dealing with highly dimensional data. One of the recent methods is random forests, an ensemble learning method broadly applicable in data mining and machine learning. The technique is nonparametric, tree-based, and combines the concept of nearest neighbors with bagging.26 In this approach, one-step-at-a-time node splitting enables trees (and hence forests) to impose regularization and thereby effectively analyze data sets with “large P (probability) values and small number (n) of case s”. In addition, grouping trees based on these properties allows the method to deal with correlated and interacting variables.27 We used the randomForest package for R from the CRAN repository. To validate results, we used 1,000 trees and at least 100 SNPs at every split in the random forests. The final model is a random forest of numerous decision trees.27–31 The most important advantage is that reduction in dimensionality is not required. The algorithm allows the classification and prediction of the effect of SNPs and is significantly more successful than simple decision trees in analyzing gene expression.
Naïve Bayes
Naïve Bayes is another excellent method to analyze genomic data. It is one of the earliest machine-learning methods and is being used for over 50 years in biomedical informatics. The technique is computationally efficient and performs better than expected in classification tasks.32 However, miscalibration can be an issue when numerous features are used, and it tends to make predictions with posterior probabilities too close to 0 or 1. Nevertheless, the technique is successfully applied to diagnose diseases, identify news articles of interest, classify web pages by topic, and assign proteins to functional families.33–35 In this study, we used the CRAN e1071 package for R to perform naïve Bayes modeling without double controlling Laplace smoothing. Thus, the epsilon range to apply Laplace smoothing, as well as the threshold for replacing cells with probabilities within the epsilon range, was not defined.
K-nearest neighbors
Unlike the other classification approaches, kNN does not build a classifier using the training data. Instead, it searches for k data points closest to the test object and uses the features of these neighbors to classify the new object. In instances where multiple classifications are possible, vote counting is applied.36 We used the kNN package for R from the CRAN repository, with number of neighbors set to k=5. The minimum number of votes required for a definite decision was not defined, and the “frequency of the majority class” was returned as the attribute probability.
Multifactor dimensionality reduction
One of the biggest challenges in GWASs is to evaluate SNP–SNP or gene–gene interactions. While logistic regression can be used to analyze such interactions, overfitting appears to be a significant issue. MDR, a nonparametric, model-free method, is an alternative approach. MDR basically reduces multilocus genotypes into high- or low-risk groups, based on the number of affected and control cases present in a group. Groups in which the ratio between affected and control cases exceeds a predefined threshold are considered as high-risk groups. The method is more powerful than logistic regression in testing high-order interactions and has many possible variations, including generalized MDR.37–39 To perform MDR, we used the MDR package for R from the CRAN repository, and analyzed data with parameters K=2, cv =5, ratio = NULL, equal = “HR”, and genotype = c(0, 1, 2). The ratio of MDR was assumed to be 1:100.
Model building
All four models were built and evaluated as described in the following steps: first, subsets of features were generated automatically using the Bioconductor package in R and evaluated using distance measures. Models were then run until the first 50, 100, or 150 SNPs were selected. To validate the results, 1,000 trees and at least 100 SNPs were used at every split in random forests. In naïve Bayes and kNNs, 80% of the randomly selected cases were used for the training set, while the remaining 20% were used as the test set. In MDR, models were evaluated by fivefold cross-validation. Implicated procedures are summarized in a flowchart and presented in Figure 1.
Results
Preprocessing
A total of 2,371 individual genotypes were analyzed, of which 604 were bipolar patients and 1,767 were controls. The distribution of cases into consent groups was done as reported in Table 1. Studies on bipolar disorders lack clarity of outcome measures, which also presented a limitation to this study. We tried to overcome this defect by eliminating the data of patients with bipolar-related disorders.40 Also, analysis was conducted based on a case–control study design. However, as both cases and controls belong to the American population, random bias risks do exist.
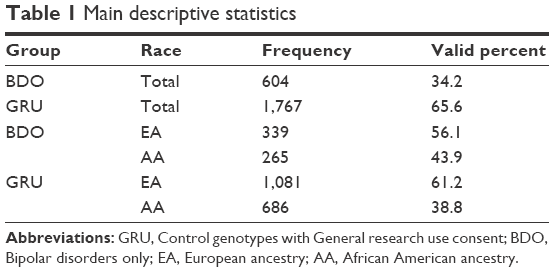 | Table 1 Main descriptive statistics |
After data cleaning, 1,948 SNPs from control cases and 882 from bipolar cases were excluded based on the Hardy–Weinberg equilibrium test (P<0.001). The total genotyping rate in the remaining individuals was 0.97148. Subsequently, 21,597 SNPs were filtered based on the missingness test (GENO >0.1), while 103,715 SNPs were filtered based on the frequency test (MAF <0.05). Among 761,830 SNPs left after pruning, PLINK analysis selected 693 SNPs with P-value <0.001 as candidate-associated variations.
Comparison of different models
Random forests, naïve Bayes, and kNNs identified 16, 13, and ten candidate SNPs, respectively. The top six SNPs identified were common in all the three methods (Table 2). Random forests and kNNs were more successful than naïve Bayes, with recall values above 0.95 (Table 3). On the other hand, MDR generated a model with comparable predictive performance based on only five SNPs identified by the analysis of two-way and three-way interactions.
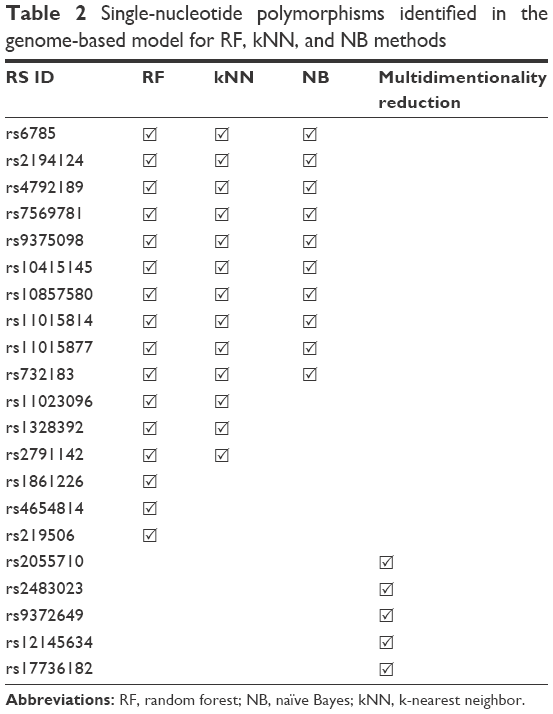 | Table 2 Single-nucleotide polymorphisms identified in the genome-based model for RF, kNN, and NB methods |
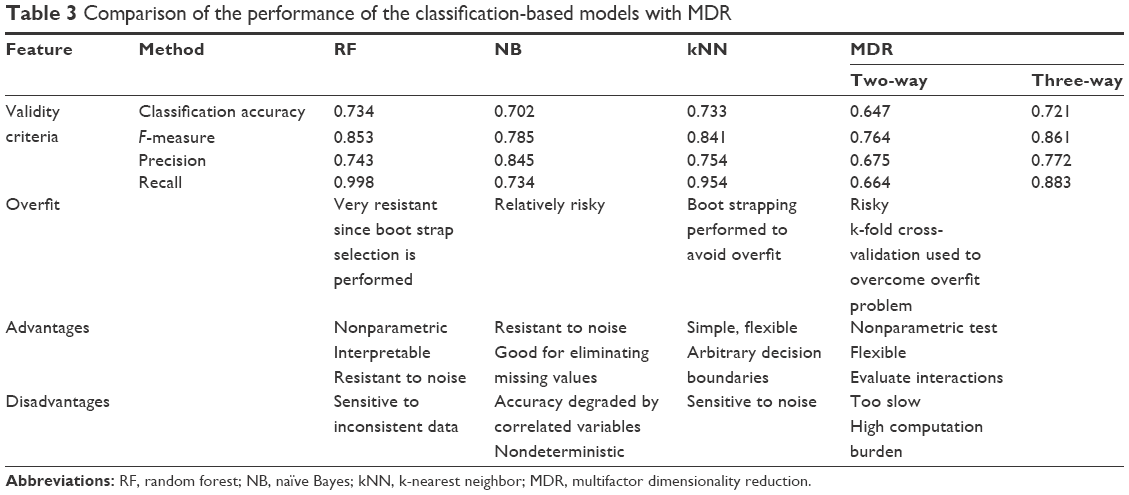 | Table 3 Comparison of the performance of the classification-based models with MDR |
Analysis of SNP–SNP interactions
MDR was used to investigate two-way or three-way SNP–SNP interactions, although three-way interactions were favored due to the large number of SNPs. The most significant two-way interactions were between rs17736182 and rs2055710, which map to two genes KLHL1 and DOCK10, respectively. Patients with specific allelic profiles for these SNPs showed the highest risk (67.54%) of having bipolar disorder. Analysis of three-way interactions identified a risk allele for rs2483023, an SNP on the LEMD1 gene, along with two other novel SNPs. In the two-way interaction analysis, the patients carrying allele A for rs17736182 were found to have an equal risk as the patients carrying allele A for rs2055710, which was 67.54%. In the three-way interaction assessment, patients carrying allele C for rs9372649 showed equal risk with the patients carrying allele A for rs12145634 and allele C for rs2483023, with the prediction performance of 77.2%.
Conclusion
Variant calling and annotation is one way to search for SNPs associated with the disease, but this method is mainly biased toward annotated coding regions of the genome. However, hypothesis-free methods, such as presented here, do not rely on prior knowledge or genomic annotation, and therefore present a potential approach to overcome this bias. This study stands out from previous studies as three different classification methods and MDR (as an SNP–SNP interaction model) were compared for the first time in the literature on the same GWAS data, the dbGAP’s bipolar disorders data. As a result, the advantages and disadvantages of each data mining method were assessed. Also, another novelty of the study is that all cases with bipolar-related disorders were filtered, and the data of cases with bipolar disorders only were analyzed.
The random forests were found to have the best overall classification rate, as well as a more straightforward assessment of the classification errors. Indeed, extensive research using actual or simulated data has demonstrated decision trees to be very flexible and easy to debug. However, simple decision trees tend to overfit the data more than other techniques. Therefore, researchers generally prune trees and tune procedures to do so. Random forest method was originally developed to overcome this issue and, this study has generated the most accurate classification without overfitting. The performance of kNNs was comparable. However, naïve Bayes had the lowest classification rate with regard to tabular data simulation, although application of the feature selection option may improve its performance.41 Previous studies, which compare random forests with other classification methods, also agree with our observation. For instance, Lunetta et al42,43 conducted a simulation experiment to evaluate the ability of random forests to detect interacting SNPs and found that it outperformed Fisher’s exact test, even though both methods were comparable in the absence of such interactions. One major concern about random forest is its high computational cost compared to the others discussed here. In addition, random forest has been reported to be very sensitive to noise or unbalanced data sets, whereas k-nearest neighbor algorithms are more efficient and stable.44 Overall classification rates were between 0.70 and 0.75. Due to bootstrapping and the nature of the methods used, no model achieved classification rates better than 0.9.
In addition, MDR method revealed different SNPs through analyses of two-way and three-way interactions. This may be due to the increased frequency of SNP interactions in polygenic diseases. Nevertheless, the classification success of MDR, based on only three SNPs, was comparable to other models. Notably, physical and functional annotation of the SNPs showed one SNP mapping to the DOCK10 gene, which is also identified with other three methods investigated here. The remaining two SNPs were mapped to the genes related to those found by other models, although these genes were not common to all. So, the high classification performance and relevant biological annotation of the SNPs discovered support that MDR would be an effective alternative method to evaluate SNP–SNP interactions. Also, the reduced number of SNPs, without loss in classification performance, would facilitate validation studies and decision support models, and would reduce the cost to develop predictive and diagnostic tests. Nevertheless, we acknowledge that translation of genomic models to the clinical setting will require models with higher classification performance.
Previous analyses of bipolar disorder genotypes revealed a high level of complexity, and a consensus profile of associated SNPs or genes could not be identified in those studies. Here, six candidate SNPs associated with bipolar disorders were common in all three classification-based methods. These SNPs identified two candidate genes that may potentially be the causative agents. Indeed, pathway analysis in GeneMANIA (http://genemania.org/) indicates that these genes are closely associated with psychiatric disorders.45 Even though the classification performance is not sufficient for translation of the findings into a clinical diagnostic test, we suggest that the consensus SNP profile obtained from the three classification-based methods has high potential to be the causative variants, and further experimental validation would be productive.
Acknowledgments
Funding support for the Whole-Genome Association Study of Bipolar Disorder was provided by NIMH, and the genotyping of samples was provided through the Genetic Association Information Network. The data sets used for the analyses described in this manuscript were obtained from the database of Genotypes and Phenotypes (dbGaP) found at http://www.ncbi.nlm.nih.gov/gap through dbGaP accession number phs000017.v3.p1. Samples and associated phenotype data for the Collaborative Genomic Study of Bipolar Disorder were provided by the NIMH Genetics Initiative for Bipolar Disorder. Data and biomaterials were collected in four projects that participated in NIMH Bipolar Disorder Genetics Initiative. From 1991–1998, the principal investigators and coinvestigators were: Indiana University, Indianapolis, IN, USA, U01 MH46282, John Nurnberger, MD, PhD, Marvin Miller, MD, and Elizabeth Bowman, MD; Washington University, St Louis, MO, USA, U01 MH46280, Theodore Reich, MD, Allison Goate, PhD, and John Rice, PhD; Johns Hopkins University, Baltimore, MD, USA, U01 MH46274, J Raymond DePaulo, Jr, MD, Sylvia Simpson, MD, MPH, and Colin Stine, PhD; NIMH Intramural Research Program, Clinical Neurogenetics Branch, Bethesda, MD, USA, Elliot Gershon, MD, Diane Kazuba, BA, and Elizabeth Maxwell MSW. Data and biomaterials were collected as part of ten projects that participated in the NIMH Bipolar Disorder Genetics Initiative. From 1999–2003, the principal investigators and coinvestigators were: Indiana University, Indianapolis, IN, R01 MH59545, John Nurnberger, MD, PhD, Marvin J Miller, MD, Elizabeth S Bowman, MD, N Leela Rau, MD, P Ryan Moe, MD, Nalini Samavedy, MD, Rif El-Mallakh, MD (at University of Louisville), Husseini Manji, MD (at Wayne State University), Debra A Glitz, MD (at Wayne State University), Eric T Meyer, MS, Carrie Smiley RN, Tatiana Foroud, PhD, Leah Flury, MS, Danielle M Dick, PhD, Howard Edenberg, PhD; Washington University, St Louis, MO, USA, R01 MH059534, John Rice, PhD, Theodore Reich, MD, Allison Goate, PhD, Laura Bierut, MD; Johns Hopkins University, Baltimore, MD, USA, R01 MH59533, Melvin McInnis MD, J Raymond DePaulo, Jr, MD, Dean F MacKinnon, MD, Francis M Mondimore, MD, James B Potash, MD, Peter P Zandi, PhD, Dimitrios Avramopoulos, and Jennifer Payne; University of Pennsylvania, PA, USA, R01 MH59553, Wade Berrettini, MD, PhD; University of California, Irvine, CA, USA, R01 MH60068, William Byerley, MD, and Mark Vawter, MD; University of Iowa, IA, USA, R01 MH059548, William Coryell, MD and Raymond Crowe, MD; University of Chicago, IL, USA, R01 MH59535, Elliot Gershon, MD, Judith Badner, PhD, Francis McMahon, MD, Chunyu Liu, PhD, Alan Sanders, MD, Maria Caserta, Steven Dinwiddie MD, Tu Nguyen, Donna Harakal; University of California, San Diego, CA, USA, R01 MH59567, John Kelsoe, MD, Rebecca McKinney, BA; Rush University, IL, USA, R01 MH059556, William Scheftner, MD, Howard M Kravitz, DO, MPH, Diana Marta, BS, Annette Vaughn-Brown, MSN, RN, and Laurie Bederow, MA; NIMH Intramural Research Program, Bethesda, MD, USA, 1Z01MH002810-01, Francis J McMahon, MD, Layla Kassem, PsyD, Sevilla Detera-Wadleigh, PhD, Lisa Austin, PhD, Dennis L Murphy, MD.
This study performed as a part of PhD thesis in Department of Health Informatics, Graduate School of Informatics, Middle East Technical University, Ankara, Turkey.
Disclosure
The authors report no conflicts of interest in this work.
References
Tosto G, Reitz C. Genome-wide association studies in Alzheimer’s disease: a review. Curr Neurol Neurosci Rep. 2013;13(10):381. | ||
McCarthy MI, Abecasis GR, Cardon LR, et al. Genome-wide association studies for complex traits: consensus, uncertainty and challenges. Nat Rev Genet. 2008;9(5):356–369. | ||
Eichler EE, Flint J, Gibson G, et al. Missing heritability and strategies for finding the underlying causes of complex disease. Nat Rev Genet. 2010;11(6):446–450. | ||
Hirschhorn JN, Lohmueller K, Byrne E, Hirschhorn K. A comprehensive review of genetic association studies. Genet Med. 2002;4(2):45–61. | ||
Galesloot TE, Van Steen K, Kiemeney LALM, Janss LL, Vermeulen SH. A comparison of multivariate genome-wide association methods. PLoS One. 2014;9(4):1–8. | ||
Yatham LN, Torres IJ, Malhi GS, et al. The International Society for Bipolar Disorders – Battery for Assessment of Neurocognition (ISBD-BANC). Bipolar Disord. 2010;12(4):351–363. | ||
Global Burden of Disease Study 2013 Collaborators; Vos T, Barber RM, Bell B, et al. Global, regional, and national incidence, prevalence, and years lived with disability for 301 acute and chronic diseases and injuries in 188 countries, 1990–2013: a systematic analysis for the Global Burden of Disease Study 2013. Lancet. 2015;386(9995):743–800. | ||
Cassidy F. Insight in bipolar disorder: relationship to episode subtypes and symptom dimensions. Neuropsy Dis Treat. 2010;6(1):627–631. | ||
nimh.nih.gov [homepage on the Internet]. NIMH bipolar disorder. Available from: http://www.nimh.nih.gov/health/topics/bipolar-disorder/index.shtml. Accessed July 26, 2014. | ||
American Psychiatric Association. Diagnostic and Statistical Manual of Mental Disorders: DSM-IV-TR. Arlington, VA: American Psychiatric Publishing, Inc.; 2000. | ||
Kieseppä T, Partonen T, Haukka J, Kaprio J, Lönnqvist J. High concordance of bipolar I disorder in a nationwide sample of twins. Am J Psychiatry. 2004;161(10):1814–1821. | ||
McGuffin P, Rijsdijk F, Andrew M, Sham P, Katz R, Cardno A. The heritability of bipolar affective disorder and the genetic relationship to unipolar depression. Arch Gen Psychiatry. 2003;60(5):497–502. | ||
Burmeister M, McInnis MG, Zöllner S. Psychiatric genetics: progress amid controversy. Nat Rev Genet. 2008;9(7):527–540. | ||
Segurado R, Detera-Wadleigh SD, Levinson DF, et al. Genome scan meta-analysis of schizophrenia and bipolar disorder, part III: bipolar disorder. Am J Hum Genet. 2003;73(1):49–62. | ||
Pirooznia M, Seifuddin F, Judy J, et al. Data mining approaches for genome-wide association of mood disorders. Psychiatr Genet. 2012;22(2):55–61. | ||
Winham SJ, Colby CL, Freimuth RR, et al. SNP interaction detection with random forests in high-dimensional genetic data. BMC Bioinformatics. 2012;13(1):164. | ||
Jiawei H, Kamber M. Data Mining: Concepts and Techniques. 2nd ed. New York: Elsevier Inc; 2006. | ||
Cantor RM, Lange K, Sinsheimer JS. Prioritizing GWAS results: a review of statistical methods and recommendations for their application. Am J Hum Genet. 2010;86(1):6–22. | ||
Dick DM, Foroud T, Flury L, et al. Genomewide linkage analyses of bipolar disorder: a new sample of 250 pedigrees from the National Institute of Mental Health Genetics Initiative. Am J Hum Genet. 2003;73(1):107–114. | ||
McInnis MG, Dick DM, Willour VL, et al. Genome-wide scan and conditional analysis in bipolar disorder: evidence for genomic interaction in the National Institute of Mental Health genetics initiative bipolar pedigrees. Biol Psychiatry. 2003;54(11):1265–1273. | ||
Whole Genome Association Study of Bipolar Disorder, dbGaP study accession: phs000017.v3.p1 [database on the Internet]. Available from: http://www.ncbi.nlm.nih.gov/projects/gap/cgi-bin/document.cgi?study_id=phs000017.v3.p1. Accessed July 26, 2016. | ||
The World Health Organization World Mental Health Composite International Diagnostic Interview (WHO WMH-CIDI) [homepage on the Internet]. Available from: http://www.hcp.med.harvard.edu/wmhcidi/index.php. Accessed July 26, 2016. | ||
Esfandiari N, Babavalian MR, Moghadam A-ME, Tabar VK. Knowledge discovery in medicine: current issue and future trend. Exp Syst Appl. 2014;41(9):4434–4463. | ||
He H, Oetting WS, Brott MJ, Basu S. Power of multifactor dimensionality reduction and penalized logistic regression for detecting gene–gene interaction in a case–control study. BMC Med Genet. 2009;10(1):127. | ||
Cordell HJ. Detecting gene–gene interactions that underlie human diseases. Nat Rev Genet. 2009;10(6):392–404. | ||
Breiman L. Bagging predictors. Mach Learn. 1996;24(2):123–140. | ||
Chen X, Ishwaran H. Random forests for genomic data analysis. Genomics. 2012;99(6):323–329. | ||
Goldstein BA, Hubbard AE, Cutler A, Barcellos LF. An application of random forests to a genome-wide association dataset: methodological considerations & new findings. BMC Genet. 2010;11:49. | ||
Wang Y, Goh W, Wong L, Montana G. Random forests on Hadoop for genome-wide association studies of multivariate neuroimaging phenotypes. BMC Bioinformatics. 2013;14(Suppl 16):S6. | ||
Schwarz DF, Szymczak S, Ziegler A, König IR. Picking single-nucleotide polymorphisms in forests. BMC Proc. 2007;1(Suppl 1):S59. | ||
Goldstein BA, Polley EC, Briggs FBS. Random forests for genetic association studies. Stat Appl Genet Mol Biol. 2011;10(1):32. | ||
Zhang H. The optimality of naive Bayes. In: Proceedings of the Nineteenth National Conference on Artificial Intelligence (AAAI- 04); July 25–29, 2004; San Jose, CA, USA. | ||
Wei W, Visweswaran S, Cooper GF. The application of naive Bayes model averaging to predict Alzheimer’s disease from genome-wide data. J Am Med Inform Assoc. 18(4):370–375. | ||
Sambo F, Trifoglio E, Di Camillo B, Toffolo GM, Cobelli C. Bag of naïve Bayes: biomarker selection and classification from genome-wide SNP data. BMC Bioinformatics. 2012;13(Suppl 14):S2. | ||
Malovini A, Barbarini N, Bellazzi R, de Michelis F. Hierarchical naive Bayes for genetic association studies. BMC Bioinformatics. 2012;13(Suppl 14):S6. | ||
Wang J, Zaki M, Toivonen H, Shasha D. Data Mining in Bioinformatics. London: Springer-Verlag; 2005. | ||
Chung Y, Lee SY, Elston RC, Park T. Odds ratio based multifactor-dimensionality reduction method for detecting gene–gene interactions. Bioinformatics. 2007;23(1):71–76. | ||
Martin ER, Ritchie MD, Hahn L, Kang S, Moore JH. A novel method to identify gene–gene effects in nuclear families: the MDR-PDT. Genetic Epidemiol. 2006;30(2):111–123. | ||
Heidema AG, Boer JMA, Nagelkerke N, Mariman ECM, van der A DL, Feskens EJM. The challenge for genetic epidemiologists: how to analyze large numbers of SNPs in relation to complex diseases. BMC Genetics. 2006;7:23. | ||
Maj M, Akiskal HS, López-Ibor JJ, Sartorius Jr N, editors. Bipolar Disorder. Vol 5. West Sussex, UK: John Wiley & Sons; 2002. | ||
Saeys Y, Inza I, Larrañaga P. A review of feature selection techniques in bioinformatics. Bioinformatics. 2007;23(19):2507–2517. | ||
Lunetta KL, Hayward LB, Segal J, Van Eerdewegh P. Screening large-scale association study data: exploiting interactions using random forests. BMC Genet. 2004;5:32. | ||
Cordell HJ. Detecting gene–gene interactions that underlie human diseases. Nat Rev Genet. 2009;10(6):392–404. | ||
Li S, Harner EJ, Adjeroh DA. Random KNN feature selection – a fast and stable alternative to random forests. BMC Bioinformatics. 2011;12(1):450. | ||
Acikel C, Son YA, Celik C, Tutuncu R. Evaluation of Whole Genome Association Study Data in Bipolar Disorders: potential novel SNPs and genes. Bull Clin Psychopharmacol. 2015;25(1):12–18. |
 © 2016 The Author(s). This work is published and licensed by Dove Medical Press Limited. The full terms of this license are available at https://www.dovepress.com/terms.php and incorporate the Creative Commons Attribution - Non Commercial (unported, v3.0) License.
By accessing the work you hereby accept the Terms. Non-commercial uses of the work are permitted without any further permission from Dove Medical Press Limited, provided the work is properly attributed. For permission for commercial use of this work, please see paragraphs 4.2 and 5 of our Terms.
© 2016 The Author(s). This work is published and licensed by Dove Medical Press Limited. The full terms of this license are available at https://www.dovepress.com/terms.php and incorporate the Creative Commons Attribution - Non Commercial (unported, v3.0) License.
By accessing the work you hereby accept the Terms. Non-commercial uses of the work are permitted without any further permission from Dove Medical Press Limited, provided the work is properly attributed. For permission for commercial use of this work, please see paragraphs 4.2 and 5 of our Terms.