")
Back to Journals » Cancer Management and Research » Volume 12
Evaluation of Multiple Prognostic Factors of Hepatocellular Carcinoma with Intra-Voxel Incoherent Motions Imaging by Extracting the Histogram Metrics
Authors Shi G, Han X, Wang Q, Ding Y, Liu H, Zhang Y, Dai Y
Received 21 May 2020
Accepted for publication 26 June 2020
Published 20 July 2020 Volume 2020:12 Pages 6019—6031
DOI https://doi.org/10.2147/CMAR.S262973
Checked for plagiarism Yes
Review by Single anonymous peer review
Peer reviewer comments 2
Editor who approved publication: Dr Eileen O'Reilly
Gaofeng Shi,1,* Xue Han,1,* Qi Wang,1 Yan Ding,1 Hui Liu,1 Yunfei Zhang,2 Yongming Dai2
1Department of Radiology, Fourth Hospital of Hebei Medical University, Shijiazhuang 050000, People’s Republic of China; 2Department of Research Collaboration Hospital (MRI), Central Research Institute, United Imaging Healthcare, Shanghai 201800, People’s Republic of China
*These authors contributed equally to this work
Correspondence: Hui Liu; Yunfei Zhang Tel +86-311-86095716
; Tel +86-311-86095716
Fax +86-311-8609-5692
Email [email protected] [email protected]
Purpose: To predict multiple prognostic factors of HCC including histopathologic grade, the expression of Ki67 as well as capsule formation with intravoxel incoherent motions imaging by extracting the histogram metrics.
Patients and Methods: A total of 52 patients with HCC were recruited with the MR examinations undertaken at a 3T scanner. Histogram metrics were extracted from IVIM-derived parametric maps. Independent student t-test was performed to explore the differences in metrics across different subtypes of prognostic factors. Spearman correlation test was utilized to evaluate the correlations between the IVIM metrics and prognostic factors. ROC analysis was applied to evaluate the diagnostic performance.
Results: According to the independent student t-test, there were 18, 4, and 8 IVIM-derived histogram metrics showing the capability for differentiating the subtypes of histopathologic grade, Ki67, and capsule formation, respectively, with P-values of less than 0.05. Besides, there existed a lot of significant correlations between IVIM metrics and prognostic factors. Finally, by integrating different histogram metrics showing significant differences between various subgroups together via establishing logistic regression based diagnostic models, greatest diagnostic power was obtained for grading HCC (AUC=0.917), diagnosing patients with highly expressed Ki67 (AUC=0.861) and diagnosing patients with capsule formation (AUC=0.839).
Conclusion: Multiple prognostic factors including histopathologic grade, Ki67 expression status, and capsule formation can be accurately predicted with assistance of histogram metrics sourced from a single IVIM scan.
Keywords: diffusion magnetic resonance imaging, intravoxel incoherent motions, hepatocellular carcinoma, prognostic factors, histogram analysis
Introduction
As the most common hepatic malignancy, HCC has posed a tremendous threat to human health for a long time with a notoriously high incidence and mortality.1 Currently, hepatic resection, radiofrequency ablation (RFA), and hepatic transplantation are widely accepted as the first-line treatment options.2 However, a great deal of HCC patients are still suffering from the poor prognosis, including recurrence, unsatisfactory therapeutic outcome, and so on. Thereby, accurately predicting the prognosis of HCC with novel prognostic markers has attracted innumerable attention from investigators. There exist a lot of prognostic factors including histopathologic grade, alpha-fetoprotein (AFP), Ki67, satellite lesions, capsule formation, micro-vascular invasion, tumor size, and so on, which are tightly correlated with the prognosis of HCC.3 Nevertheless, histopathologic examination has to be performed in order to obtain the insights of the above prognostic factors with the disadvantages containing invasiveness, time-consumption, potential sampling bias, and more. Nowadays, due to the development of fascinating functional MRI techniques such as diffusion weighted imaging (DWI), imaging approaches have emerged as alternative solutions to evaluate the prognostic factors of plenty of tumors, with complementary advantages such as being non-invasive and cost-effective.4
Being able to simultaneously provide the quantification of perfusion and diffusion without the contrast agents, intravoxel incoherent motions (IVIM) imaging has shown tremendous clinical potential for biomedical applications including cancer diagnosing, prognosis prediction, and therapeutic evaluation by means of three quantitative parameters containing D (true diffusion coefficient), D* (pseudo diffusion coefficient), and f (perfusion fraction).5 However, the most widely-used quantitative metric derived from the parametric map is the mean value obtained via averaging the whole region of interest (ROI), which could inevitably be accompanied by the following defects: 1) The overall average severely weakens its reflection on tissue heterogeneity. 2) It’s a huge waste as there exist a lot of valuable quantitative biomarkers which serve as the underlying features in comparison to the qualitative image manifestations rather than the mean value.
One recently-emerging histogram analysis provides a novel solution to the aforementioned problem. Taking the tumor heterogeneity into consideration, histogram analysis holds greater potential by incorporating the signal of each voxel into analysis.6 Instead of the inaccurate estimation of the whole lesion with mean value, histogram metrics provide both the much more precise evaluation of overall signal intensity with different percentiles and the direct reflection of tumor heterogeneity with the metrics including the kurtosis, skewness, variance and standard deviation (SD),7 which render itself one effective tool with great clinical significance. Based on the aforementioned points, we hypothesized that there may exist a lot of significant correlations among the histogram metrics of IVIM parametric maps and multiple prognostic factors of HCC. Moreover, these correlations may render the IVIM one effective technique for simultaneously providing the prediction of multiple prognostic factors, which would not only greatly ease the effort of the pathologists but also be meaningful for subsequent clinical management.
Hence, this research aimed to evaluate the multiple prognostic factors of HCC including the histopathologic grade, Ki67, and capsule formation by means of extracting the histogram metrics with IVIM imaging. As far as we are aware, few previous studies aimed to simultaneously predict multiple prognostic factors of HCC via histogram metrics obtained from a single functional MRI technique.
Patients and Methods
Patients
This study was conducted in accordance with the Declaration of Helsinki. Besides, both the approval from the institute review board (IRB) of Fourth Hospital of Hebei Medical University and written informed consent from each patient was successfully obtained. The ethics approval number was kf238. From January 2019 to December 2019, a total of 75 patients were recruited into this prospective research.
Inclusion Criteria
Patients suspected as HCC according to the CT, ultrasonography examinations, or preoperative MR examination.
Exclusion Criteria
1) Pathological results confirmed that it was not HCC, but other abdominal malignancies, such as hemangioma and so on. 2) Previous treatment such as percutaneous ethanol injection, radiofrequency ablation, chemoembolization, or the combination of above. 3) Poor image quality resulted from motion artifacts and so on. 4) Inaccessible histopathologic results. 5) Too small lesions that were difficult for defining the ROIs in the following analysis.
From January 2019 to December 2019, a total of 75 patients preliminarily suspected as HCC were recruited into this research according to the inclusion criteria. Ten patients were excluded because of being diagnosed as other malignancies, including cholangiocarcinoma (n=8), hemangioma (n=1), and gallbladder carcinoma (n=1). In addition, 10 patients were excluded because pathological results were inaccessible. Moreover, one patient was excluded as the lesion was too small to be identified. Also, one patient was excluded because the IVIM scan was not performed correctly. Additionally, one patient was excluded because of poor MR image quality. Therefore, 52 patients were ultimately introduced for subsequent statistical analysis. Patient characteristics are exhibited in Table 1.
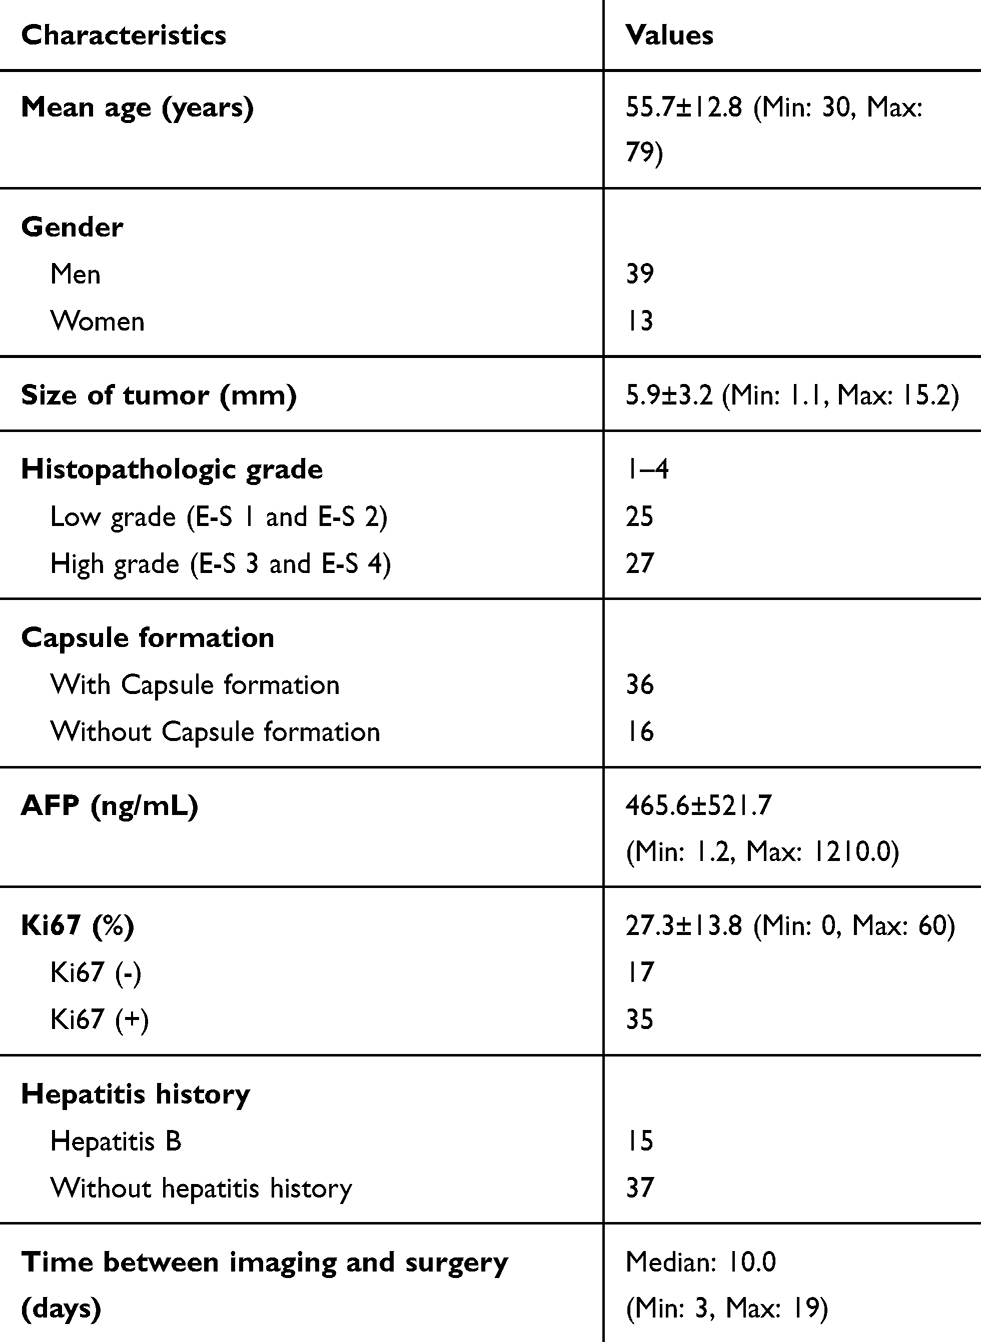 |
Table 1 Patients Characteristics |
MR Examination
All the MR examinations were performed on a 3T scanner (uMR 780, United Imaging Healthcare, Shanghai, China) with a 12-channel body coil. MR protocols included 1) transverse T2 weighted fast spin echo sequence (FSE): TR: 5620.0 ms, TE: 85.8 ms, Flip angle: 90°, slice thickness: 5 mm, intersection gap: 1.0 mm, matrix: 378*504; 2) Dynamic three-dimensional T1 weighted gradient echo (GRE) sequence: TR: 3.05 ms, TE: 1.35 ms, Flip angle: 10°, slice thickness: 5.0 mm, matrix: 360*480; 3) breath-hold two dimensional GRE sequence based susceptibility weighted imaging (SWI): TR: 120.0 ms, TE: 10.0 ms, Flip angle: 30°, slice thickness: 5 mm, intersection gap: 1.0 m, matrix: 303*384; 4) breath-hold three-dimensional T1 weighted dual-echo (in phase and opposed phase) GRE sequence: TR: 4.07 ms, TE: 1.11/2.56 ms, Flip angle: 10°, slice thickness: 5 mm, matrix: 360*480; 5) single-shot echo planar sequence based IVIM: TR: 4294.0 ms, TE: 67.1 ms, Flip angle: 90°, slice thickness: 5 mm, intersection gap: 1.0 mm, matrix: 200*256, b values: 0, 10, 20, 30, 40, 60, 80, 100, 200, 500 and 800 s/mm2.
Image Analysis
All the original data were processed with one in-house prototype software developed by Matlab R2018b.
IVIM: The quantitative pixel-wise parameters derived from the IVIM were obtained through the following fitting model expressed as:

where S and S0 are, respectively, the signal intensity when various b values are applied, f is the perfusion volume fraction, D (unit: m2/s) is the true diffusion coefficient representing pure diffusion, and D* (unit: m2/s) is the pseudo-diffusion coefficient representing perfusion related diffusion (incoherent microcirculation within the voxel).
Blinded to the pathological indexes, two abdominal radiologists were asked to define the volume of interest (VOI) on the basis of the whole lesion of HCC in D map with T2WI image as a reference. The VOIs were firstly defined by a radiologist with 8 years’ experience and then validated by another radiologist with 25 years’ experience. Meanwhile, the necrosis and hemorrhage were carefully avoided to be incorporated into VOIs. Then the freehand VOIs were automatically copied to other parametric maps including D* map and f map. Histogram metrics of IVIM parametric maps were calculated on the basis of the whole lesion with one in-house prototype software developed by Matlab R2018b. The histogram metrics contained the mean, median, standard error of mean (SE), standard deviation (SD), variance, skewness, kurtosis, minimum value (min), maximum value (max), 10th percentile, 25th percentile, 40th percentile, 70th percentile, 75th percentile, and 90th percentile. It should be noted that there are some kinds of open-sourced software which can be utilized for calculating the IVIM parameters (Firevoxel (https://wp.nyu.edu/Firevoxel)) and the histogram metrics of images (Image J software (National institute of Health, Bethesda, MD); Mazda software (http://www.eletel.p.lodz.pl/programy/mazda/)).
Histopathologic Evaluation
One pathologist having more than 10 years’ experience of haptic pathology was asked to grade the HCC ranging from E-S grade 1 to E-S grade 4 with a widely-applied Edmonson-sterner classification standard.8 Patients were then divided into high grade (E-S grades 3 and 4) or low grade (E-S grades 1 and 2). The tumor specimens were stained with MIB-1 (DakoCytomation, Glostrup, Denmark), one specific monoclonal antibody for quantifying the Ki67. According to whether the expression of Ki67 was more than 10%, the patients were divided into Ki67 (+) (expression ≥10%) and Ki67 (-) (expression <10%). The selection of 10% as a threshold for dividing patients into Ki67 (+) and Ki67 (-) was according to previous research.9,10 The presence of capsule formation (capsule formation (+)) was concluded by evaluating the tumor specimens.
Statistical Analysis
In general, a technique flowchart of this research is displayed in Figure 1. Firstly, candidate diagnostic markers, histogram metrics showing significant differences between various subgroups, were obtained via independent Student t-test. Then, the principal component analysis (PCA) was performed to integrate all candidate markers into several principal components. Finally, logistic regression based diagnostic models were established via utilizing principal components for achieving a diagnostic purpose.
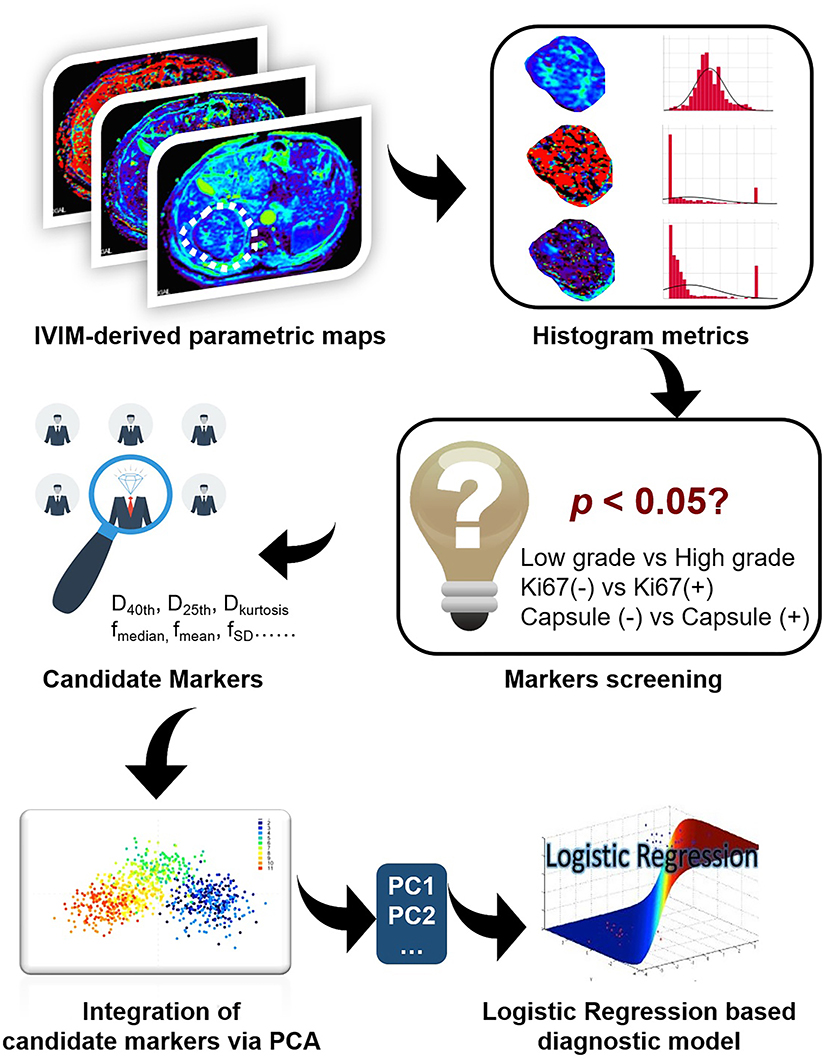 |
Figure 1 Technique flowchart of predicting multiple prognostic factors of HCC via extracting IVIM histogram metrics. |
In detail, the Kolmogorov–Smirnov test was firstly performed to see whether each parameter obeyed normal distribution. Next, Mann–Whitney U-test or independent Student t-test was performed to evaluate if the histogram metrics derived from IVIM had significant differences in various pathological groups. Besides, the potential correlations between histogram metrics derived from IVIM and prognostic factors including the expression of Ki67, capsule formation, and histopathologic grade were explored by Spearman correlation test and quantified by correlation coefficient abbreviated as r. Principal component analysis (PCA) was performed to integrate the candidate diagnostic markers, histogram metrics showing significant differences into several principal components (PCs). For example, there exist 18 histogram metrics (candidate diagnostic markers) derived from IVIM showing significant differences between low grade and high grade HCC patients. Eighteen candidate diagnostic markers were then integrated into three PCs via PCA. Next, the logistic regression based diagnostic model for grading HCC was established with the above three PCs as independent variables. Similarly, predictive models for diagnosing patients with highly expressed Ki67 and capsule formation were also established according to the above methods. Finally, the diagnostic performance of logistic regression based diagnostic model abbreviated as LG model and individual histogram metrics derived from IVIM was evaluated by utilizing the ROC (receiver operating characteristic curve) analysis. All parameters in this research were statistically analyzed with the SPSS 25.0 software (SPSS Inc., Chicago, IL, USA). It was regarded as having statistical significance when the P-value was less than 0.05.
Results
MR Images and Histogram Characteristics
Figures 2 and 3 displayed the representative MR images of two HCC patients with different pathological indexes. Representative IVIM fitting curves of 10 patients randomly selected from the patient cohort are listed in Supplementary Figures S1 and 2.
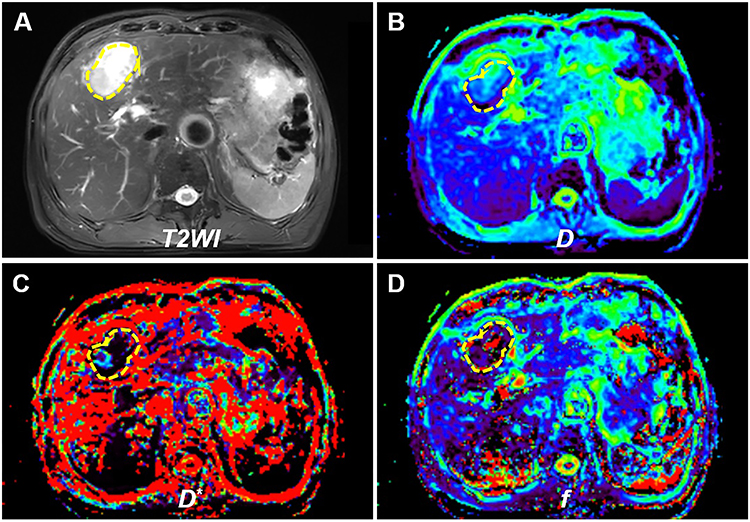 |
Figure 2 Representative MR images of a patient with low grade HCC. (A) T2WI image, (B) D map, (C) D* map, and (D) f map. Note: The main prognostic indexes were: histopathologic grade: 1, AFP: 2.23 ng/mL, Ki67: 3%, tumor size (the longest diameter): 5.7 cm, capsule formation: with capsule formation. |
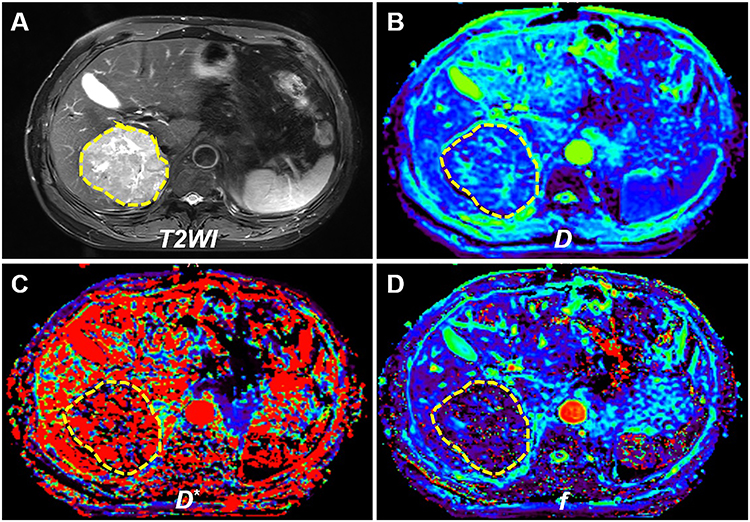 |
Figure 3 Representative MR images of a patient with high grade HCC. (A) T2WI image, (B) D map, (C) D* map, and (D) f map. Note: The main prognostic indexes werehistopathologic grade: 4, AFP: 759.50 ng/mL, Ki67: 40%, tumor size (the longest diameter): 9.7 cm, capsule formation: without capsule formation. |
Figure 4 illustrates the comparison of histogram distribution of each IVIM parameter including D, D* and f between the two representative HCC patients with different pathological indexes. It was obvious that all the histogram distribution deviated from Gaussian distribution to a large extent. Moreover, distinguishable distribution differences between two patients can be clearly identified.
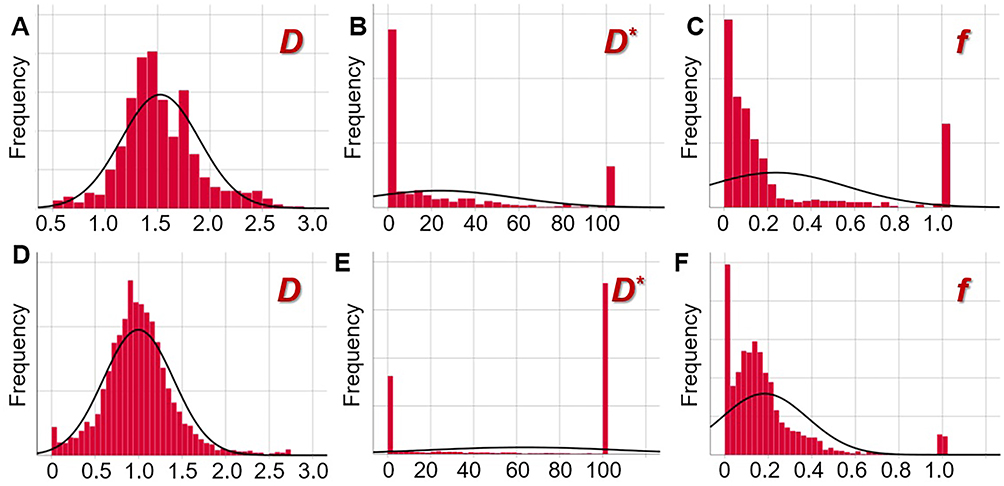 |
Figure 4 Tumor histogram distribution of D (A and D), D* (B and E), and f (C and F) of one patient with low grade HCC (A–C), whose MR images are displayed in Figure 2, and another patient with high grade HCC (D–F), whose MR images are displayed in Figure 3. Note: The smooth black curve represents the theoretical Gaussian distribution. |
Histogram Metrics of IVIM
Briefly, Dmean, Dmedian, Dkurtosis, D10th percentile, D25th percentile, D40th percentile, D70th percentile, D75th percentile, fmean, fmedian, fskewness, fkurtosis, f10th percentile, f25th percentile, f40th percentile, f70th percentile, f75th percentile, and f90th percentile all displayed the capability of differentiating high grade HCC from low grade HCC (P<0.05). Differently, Dmean, fmedian, f40th percentile and f70th percentile showed significant differences between the Ki67 (-) group and Ki67 (+) group. Moreover, it was feasible to predict the capsule formation with Dmedian, D10th percentile, D25th percentile, D40th percentile, D70th percentile, D75th percentile, D*SD, and D*75th percentile. (Table 2).
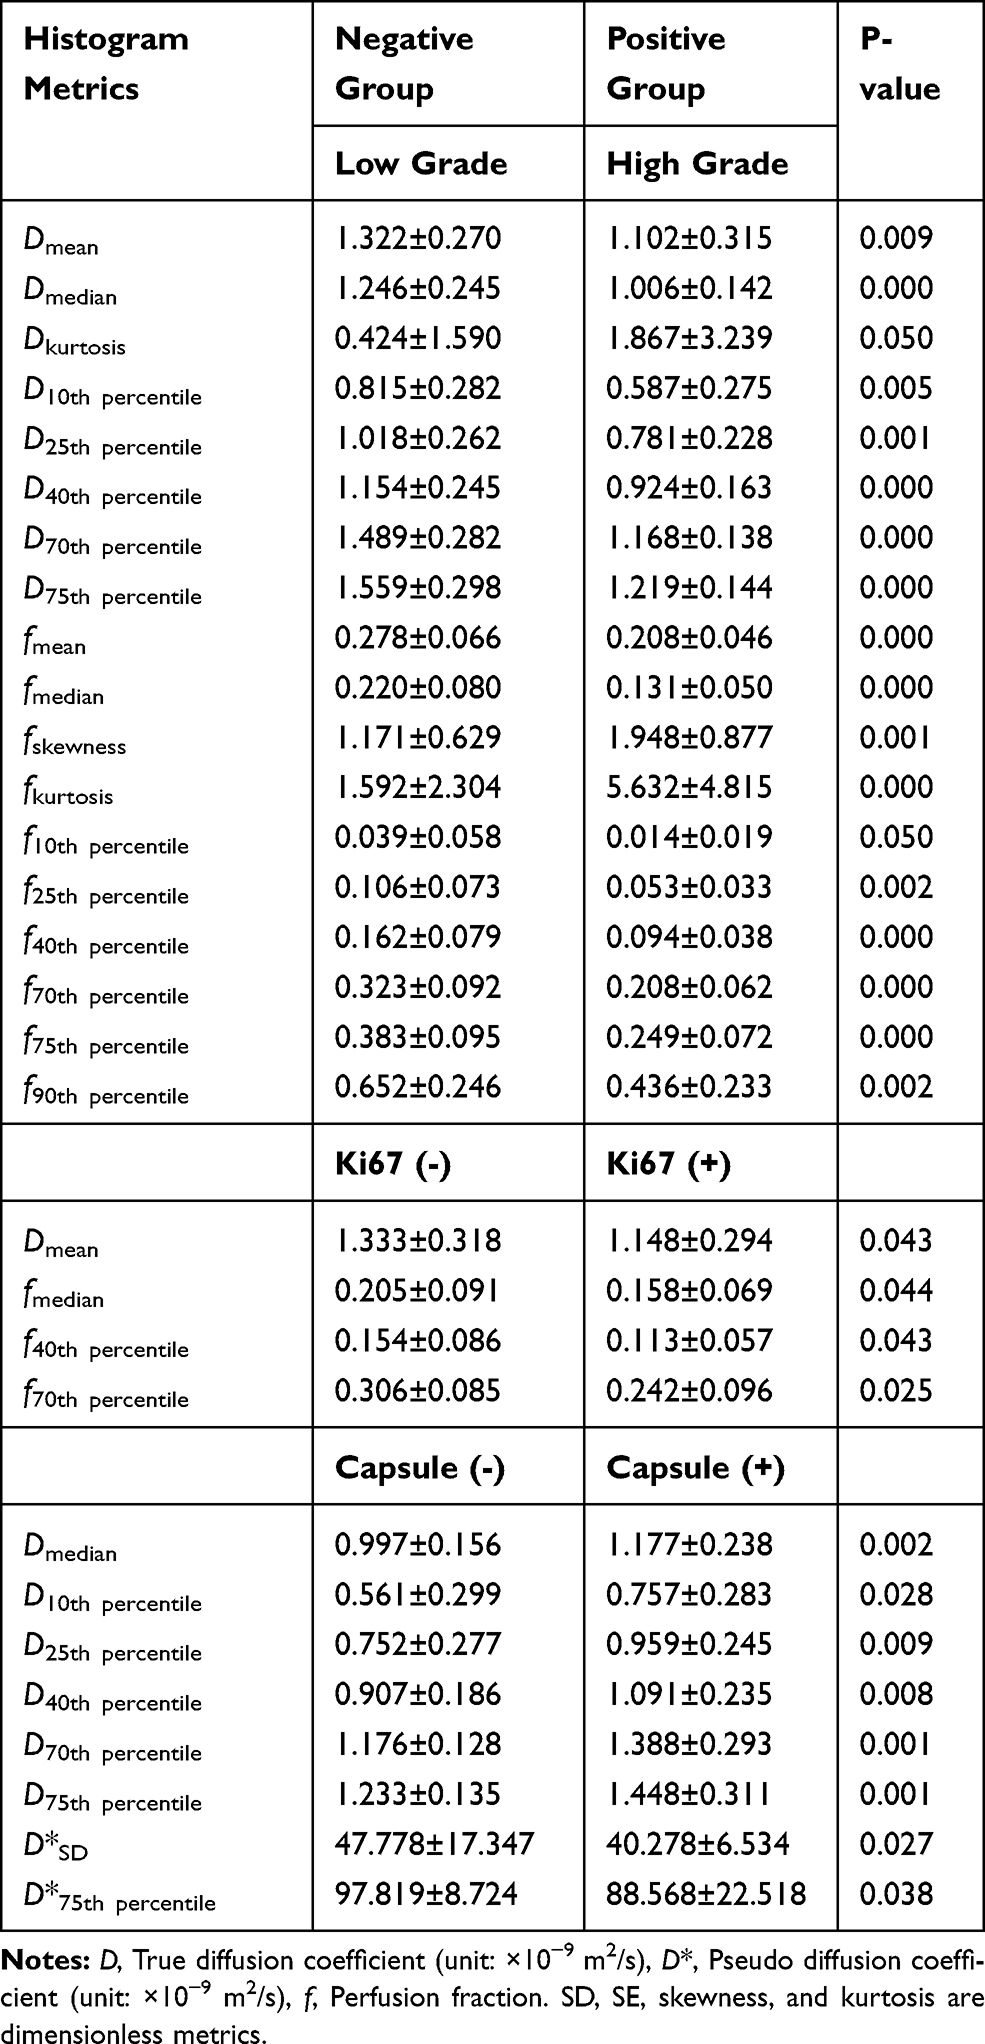 |
Table 2 The Histogram Metrics Display Significant Differences in Various Subgroups |
Correlative Evaluation
As Figure 5 and Tables S1–3 in the Supplementary Material show, histogram metrics derived from IVIM including the Dmean, Dmedian, D10th percentile, D25th percentile, D40th percentile, D70th percentile, D75th percentile, D90th percentile, fmean, fmedian, f25th percentile, f40th percentile, f70th percentile, f75th percentile, and f90th percentile were significantly and inversely correlated with the histopathologic grade in comparison to fskewness, fkurtosis, and D*SD that were positively correlated with the histopathologic grade. Similarly, Dmean, Dvariance, fmean, fmedian, f40th percentile, f70th percentile, and f75th percentile were negatively correlated with the expression of Ki67. As for capsule formation, there existed positive correlations between the histogram metrics including the Dmean, Dmedian, D10th percentile, D25th percentile, D40th percentile, D70th percentile, as well as D75th percentile, and capsule formation, along with a negative correlation between the D*SD and capsule formation.
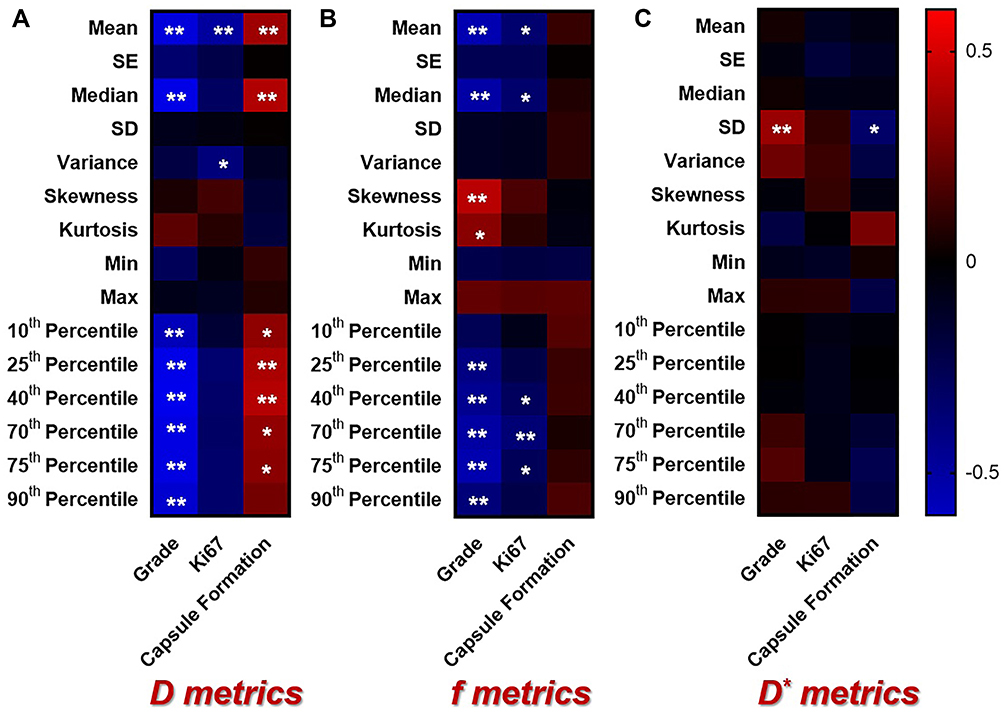 |
Figure 5 The heat maps depict the correlations between the histogram metrics derived from IVIM parametric maps including (A) D, (B) f, as well as (C) D* and prognostic indexes. Note: (1) *P<0.05, ** P<0.01, and *** P<0.001. (2) Blue color suggests that there is a significant negative correlation. Red color suggests that there is a significant positive correlation. (3) The correlation coefficients can be obtained with a reference bar on the right of the heat map. |
Diagnostic Performance Evaluation
With principal component analysis (PCA), eighteen, four, and eight candidate markers which showed significant differences between high grade and low grade groups, Ki67 positive and Ki67 negative groups as well as capsule formation (+) and capsule formation (-) groups were “compressed” into three, two, and two principal components (PCs), respectively. Furthermore, three logistic regression based diagnostic models (LG) were established with the above PCs for diagnosing patients with high grade HCC, positive expression of Ki67 or capsule formation. The detailed processes and results of PCA and logistic regression are displayed in the Supplementary Material as Figures S3–5 and Tables S4–9.
The diagnostic performance of LG and individual IVIM histogram metrics that showed significant differences across various subtypes of HCC were evaluated by ROC curves, which are exhibited in Figure 6 and Table 3. Among all histogram metrics and LG, logistic regression based diagnostic models (LG) yielded the best diagnostic power for grading HCC (AUC=0.917), diagnosing patients with highly expressed Ki67 (AUC=0.861), and diagnosing patients with capsule formation (AUC=0.839) compared to other individual histogram metrics. As for individual histogram metrics sourced from specific IVIM parametric maps, the D75th percentile had the best diagnostic performance (AUC=0.888) of all metrics derived from D map for grading HCC with regard to that f75th percentile was the best indicator (AUC=0.881) derived from f map for grading HCC. Differently, Dmean (AUC=0.730) and f70th percentile (AUC=0.724) were the best diagnostic markers, respectively, derived from D maps and f maps for diagnosing highly-expressed Ki67. As for predicting capsule formation, D40th percentile (AUC=0.764) and D*75th percentile (AUC=0.701), respectively, served as the best diagnostic markers compared to other metrics derived from D maps and D* maps. It should be noted that 1) only candidate markers, metrics showing significant differences between subgroups, were analyzed with the ROC curve. For instance, there were no D* derived metrics which showed significant differences between low grade and high grade HCC. Therefore, the diagnostic performance related results of D*-derived metrics were not exhibited. 2) To avoid the fact that Figure 5 displayed information being too redundant, only histogram metrics sourced from specific parametric maps including D, D*, and f maps with the best diagnostic value were displayed to compare with the mean value. For instance, D75th percentile was the best diagnostic marker sourced from D map with regard to f75th percentile, which was the best diagnostic marker sourced from f map for grading HCC. Moreover, detailed diagnostic performance related parameters such as sensitivity, specificity, accuracy, and so on are displayed in Table 3. In addition, comparisons of AUC of different metrics were listed in the Supplementary Material (Tables S10–12). Briefly, there existed a significant difference between the logistic regression based diagnostic model (LG) and fmean for grading HCC (P=0.030). Additionally, f75th percentile was significantly better than fmean for grading HCC (P=0.035). As for diagnosing patients with highly expressed Ki67, the AUC of LG was significantly higher than that of Dmean (P=0.050), f70th percentile (P=0.042) and fmean (P=0.008). As for predicting capsule formation, the diagnostic power of LG was significantly higher than that of D*75th percentile (P=0.012) and D*mean (P=0.005).
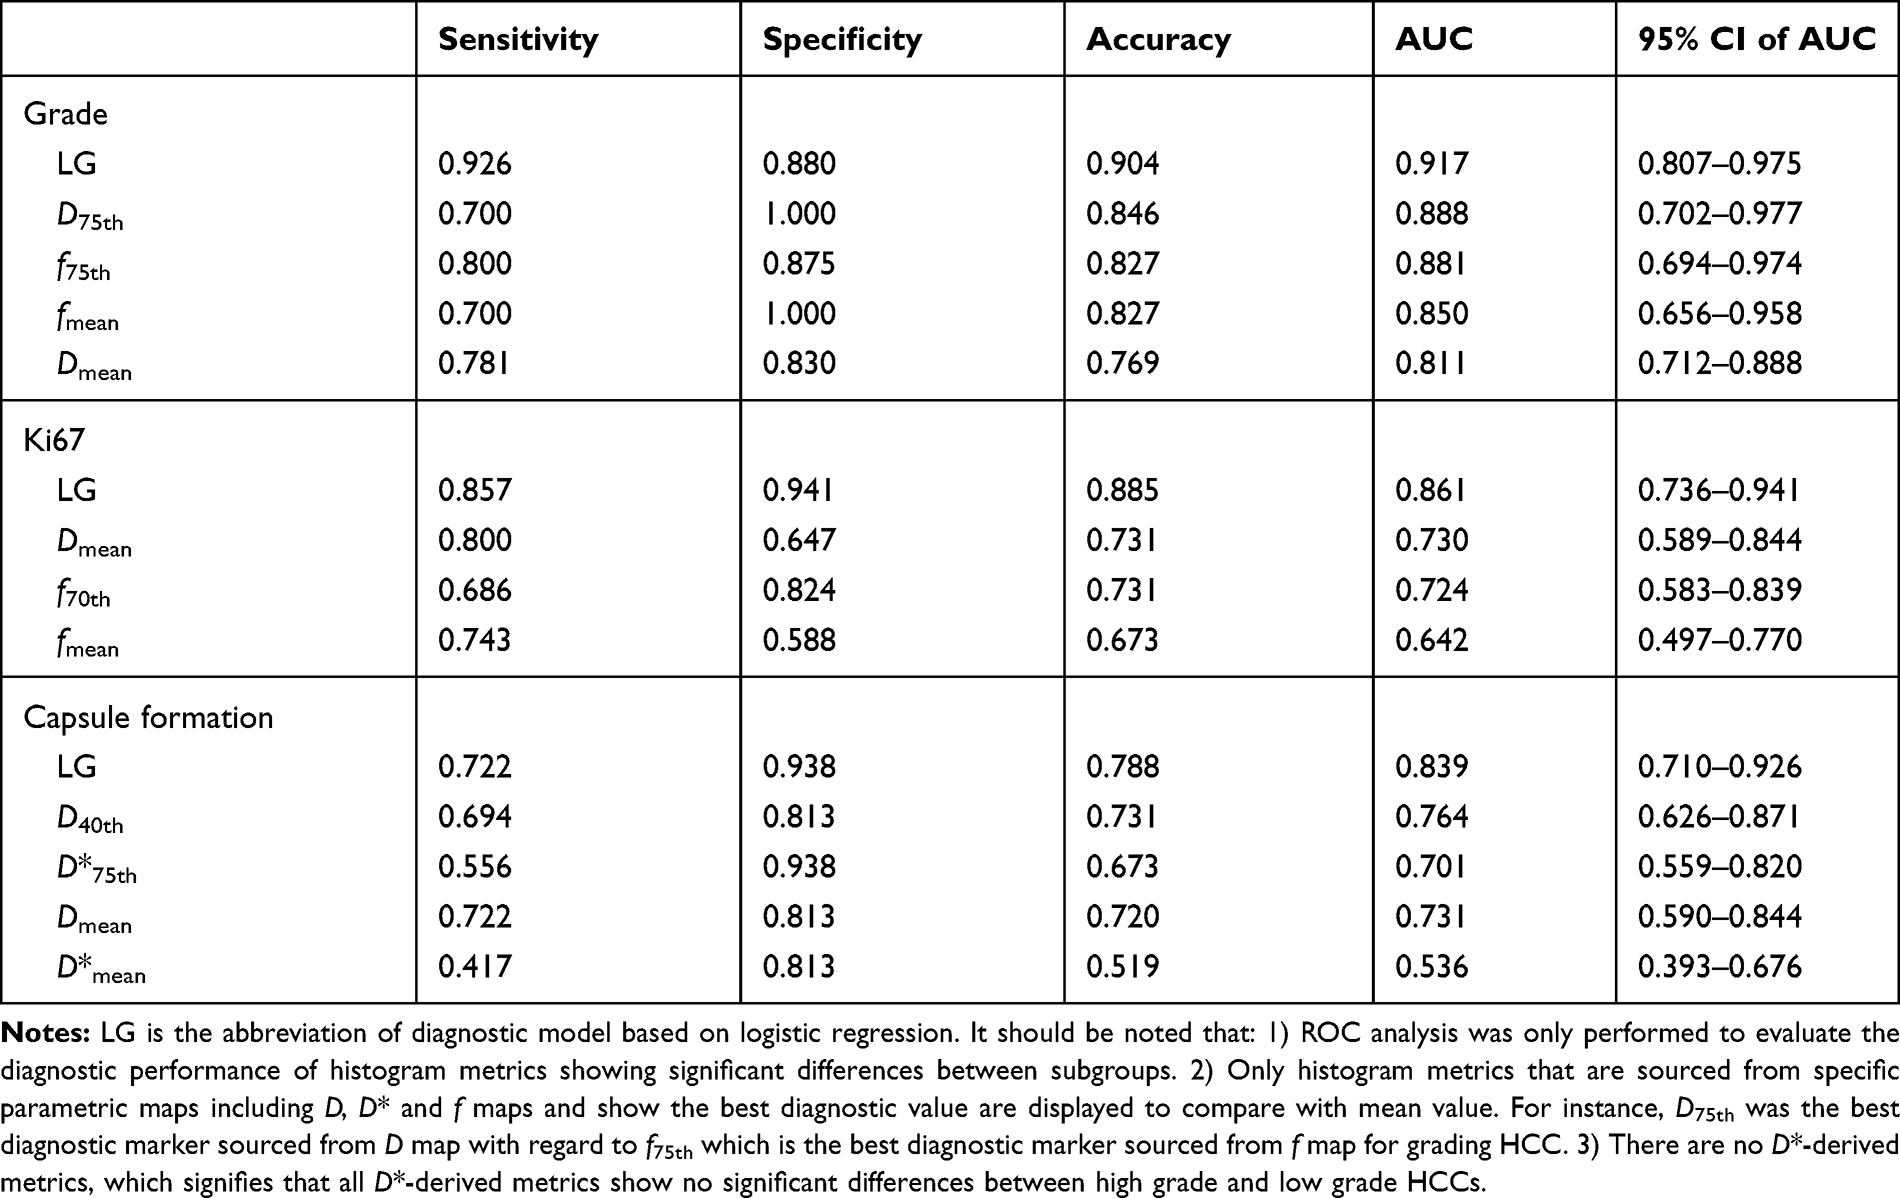 |
Table 3 Diagnostic Performance Evaluation |
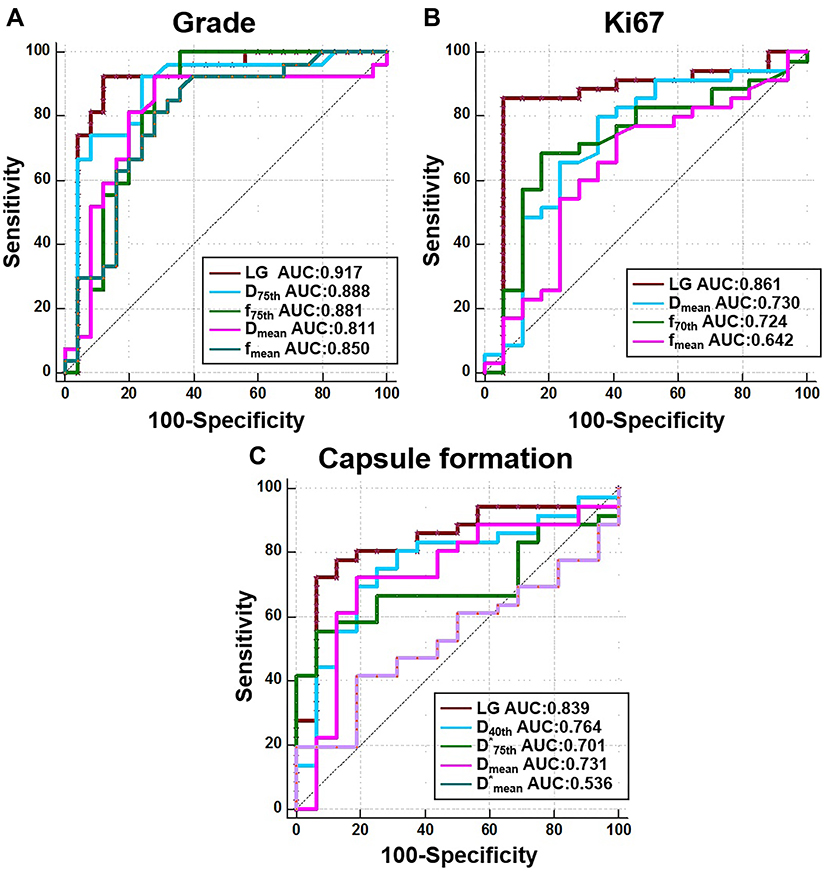 |
Figure 6 Diagnostic performance evaluation. Evaluating the diagnostic performance of different IVIM histogram metrics for (A) grading HCC, (B) diagnosing patients with highly-expressed Ki67, and (C) diagnosing patients with capsule formation. |
Discussion
Histogram Metrics of Different Subtypes and Correlative Analysis
Along with the invasion and metastasis of HCC, increased malignancy of HCC is manifested as the variations of different prognostic factors including an increase in histopathologic grade, an increase in expression of Ki67,3 and the absence of capsule and so on. Moreover, rapid proliferation of tumor cells results in the increase in nuclear to cytoplasmic ratio and the decrease in intercellular space, which leads to the more restricted diffusion characterized by the decreased diffusion coefficient. Hence, D value representing the pure diffusion was significantly higher in the low grade group, Ki67 (-) group, as well as the capsule (+) group. Additionally, it’s understandable that different percentiles of D showed negative correlations with the histopathologic grade as well as the expression of Ki67 that has been widely accepted as an index for quantifying the proliferation of the tumor. “The above results were consistent with several previous researchers.9,11,13 Furthermore, the result of that different percentiles off value were significantly lower in the high grade group and the Ki67 (+) group can be explained by the following causes: with the increase of HCC malignancy manifested as the increase in the histopathologic grade, the expression of Ki67, tumor capillaries characterized by irregular diameters, abnormal vascular branching pattern, incomplete basal membrane, and leaks begin to dominate, resulting in reduced blood circulation.12 Thus, there were significant inverse correlations between the histogram metrics sourced from f map and other prognostic factors including the expression of Ki67 and histopathologic grade. Quite different from metrics derived from D value and f value, nearly all histogram metrics calculated from D* map did not show significant differences between the different subtypes of HCC except D*SD and D*75th percentile that were significantly lower in the capsule formation (+) group. The low signal to noise ratio of D* map may result in difficulty in obtaining a meaningful statistical conclusion, which was widely reported before.11,13 Furthermore, since SD represents the signal inhomogeneity, the increased D*SD can be explained by the much more heterogeneous perfusion in HCC lesion, which also resulted in the significant correlation between the D*SD and grade together with D*SD and capsule formation. Similarly, Dvariance, fskewness and fkurtosis were significantly correlated with the prognostic factors, which further indicated that tumor heterogeneity servers as one prominent feature during carcinogenesis. To the best of our knowledge, hardly have the DWI metrics been applied for evaluating the capsule formation. A lot of researchers proposed that the presence of capsule formation in HCC patients suggests the weaker proliferating capability due to the fact that formed capsules serve as a “proliferative barrier” which results in the slower increase in cellular density as well as angiogenesis.14 As a result, there was a positive correlation between the histogram metrics of D value and capsule formation. Moreover, the result of that D*SD inversely correlated with capsule formation inferred that perfusion heterogeneity was weakened along with the presence of capsule formation.
Diagnostic Performance Analysis
Overall, for individual histogram metrics, D-derived metrics showed better diagnostic performance with regard to D*-derived metrics and f-derived metrics for HCC grading, diagnosing patients with highly expressed Ki67 and capsule formation, which was consistent with several previous researchers. For instance, Wei et al’s13 research suggested that there was merely a significant difference of D value between the different histopathologic grade with regard to f and D*. Additionally, with similar biological inspiration of cellularity, ADC was reported to be associated with the expression of Ki67.15 The causes were speculated as the following: 1) during the progress of tumor invasion and metastasis, the cellularity variation characterized by D value may be more pronounced with regard to the vascularity characterized by D* and f, which leads to the greater diagnostic performance of histogram metrics derived from D map for grading HCC, discriminating the Ki67 (+) patients as well as predicting the capsule formation. 2) Ki67 is a nuclear antigen associated with proliferating cells. Its function is closely related to mitosis and is indispensable in cell proliferation.16 As D and Ki67 provide the similar biological insights of cellularity, D-derived metrics were better at predicting Ki67 (+) than other metrics derived from D* and f. Interestingly, except Dmean serving as the only best marker (AUC=0.730) for diagnosing Ki67 (+) compared to other metrics derived from D map, nearly all individual best diagnostic markers for grading, diagnosing Ki67 (+), and diagnosing capsule formation (+) were other histogram metrics rather than the mean value (Grading: D-derived metrics: D75th percentile (AUC= 0.888); f-derived metrics: f75th percentile (AUC= 0.881), Diagnosing Ki67 (+): f-derived metrics: f70th percentile (AUC= 0.724), Predicting capsule formation (+): D-derived metrics: D40th percentile (AUC= 0.764); D*-derived metrics: D*75th percentile (AUC= 0.701)), which proved the superiority of histogram analysis. Several previous researchers share similar conclusions. For example, Hu et al9 proposed that ADC25th (AUC=0.82) was the best marker for diagnosing Ki67 (+) compared to ADCmean (AUC=0.78). In addition, ADC25th served as the best indicator for grading HCC according to Xu’s17 research. Li et al18 concluded that D5th was most valuable for predicting MVI. The potential explanations were listed as the following: 1) according to previous research, strong heterogeneity results in that it’s difficult to characterize tumor with mean value as overall signal distribution is not uniform.17 2) The signal intensity within each voxel of whole lesion that represents the different percentiles cannot change to the same extent as the degree of tumor malignancy increases, which signifies the signal intensity within some voxels that represent the different percentiles does vary more obviously. However, the overall averaging will weaken such sensitivity as there still exist some “insensitive” voxels. Therefore, mean value would not sensitively and timely capture the image changes within the lesion. In this case, histogram metrics, especially the different percentiles are more powerful for capturing the image changes within the lesion. For example, it’s widely accepted that D value will decrease as histological grade increases. However, the signal intensity within each voxel in D maps of the whole lesion cannot decrease to the same extent. The voxel representing high D value may decrease more obviously. As a result, D75th percentile in this research showed a highest value for grading HCC with regard to other individual D-derived histogram metrics. Most importantly, this research indicated that much better diagnostic performance for predicting prognostic factors was obtained with the assistance of the LG models. The reasons were speculated as the followings: 1) integrating all candidate markers including different histogram metrics derived from different parametric maps together was helpful for characterizing HCC more comprehensively as all markers were fully utilized. 2) With regard to specific cut-off value based diagnosis, diagnostic models such as logistic regression, support vector machine, K nearest neighbor and so on are much better at classifying.19,21
Previous research has demonstrated the clinical potential of mono-exponential DWI or histogram analysis in evaluating the therapeutic response of HCC (for example: TACE or other novel targeted therapies)22 and diagnostic value in combination with LI-RADS.23,25 However, hardly ever were IVIM-derived histogram metrics applied for addressing the above issues. In view of the important functional insights provided by IVIM as well as the numerous potential quantitative markers provided by histogram analysis, IVIM-derived histogram metrics held great potential in accurately diagnosing patients with HCC of different grades in the LI-RADS category and evaluating the therapeutic response of TACE and other novel therapies. Furthermore, it’s of great clinical significance to identify the phenotypical “spectrum” in HCC progression such as biliary phenotype. The strategy proposed in this study may also be helpful for predicting the phenotypical “spectrum” in HCC progression. Some researchers have demonstrated that the variation of perfusion and diffusion caused by the increased proportion of collagen fibers in cirrhotic liver could be characterized by IVIM.26,28 IVIM derived histogram metrics, hence, held great potential in sensitively monitoring the liver cirrhosis.
There were some limitations which should be acknowledged in this research. Firstly, the relatively small sample size and imbalance between different subgroups held risks, resulting in potential statistical bias. In addition, the external validation was not performed because it was difficult to enroll many patients for a prospective study. A larger population should be introduced in subsequent research. Besides, as there existed tight correlations between different pathological indexes and DWI metrics, some statistical models, such as the support vector machine and novel machine learning based diagnostic models, should be established for integrating both DWI insights and pathological insights. Moreover, this study did not evaluate the inter-observer agreement for measuring the IVIM derived histogram metrics. Finally, more pathological indexes including the expression of carcinoembryonic antigen (CA19-9), carcinoembryonic antigen, and so on should also be evaluated in the subsequent work.
Conclusion
In conclusion, this research suggested that extracting histogram metrics with a single IVIM scan held great potential in predicting the multiple prognostic factors of HCC including histopathologic grade, capsule formation, and the expression of Ki67, which suggested that extracting the underlying quantitative image biomarkers is valuable for noninvasively, cost-effectively and accurately predicting the prognostic factors during clinical practice.
Disclosure
Yunfei Zhang and Yongming Dai are employees of Central Research Institute, United Imaging Healthcare. The authors report no other possible conflicts of interest in this work.
References
1. Bray F, Ferlay J, Soerjomataram I, Siegel RL, Torre LA, Jemal A. Global cancer statistics 2018: GLOBOCAN estimates of incidence and mortality worldwide for 36 cancers in 185 countries. CA Cancer J Clin. 2018;68(6):394–424. doi:10.3322/caac.21492
2. Xu XL, Liu XD, Liang M, Luo BM. Radiofrequency ablation versus hepatic resection for small hepatocellular carcinoma: systematic review of randomized controlled trials with meta-analysis and trial sequential analysis. Radiology. 2018;287(2):461–472. doi:10.1148/radiol.2017162756
3. Tandon P, Garcia-Tsao G. Prognostic indicators in hepatocellular carcinoma: a systematic review of 72 studies. Liver Int. 2009;29(4):502–510. doi:10.1111/j.1478-3231.2008.01957.x
4. He Q, Xu RZ, Shkarin P, et al. Magnetic resonance spectroscopic imaging of tumor metabolic markers for cancer diagnosis, metabolic phenotyping, and characterization of tumor microenvironment. Dis Markers. 2003;19(2–3):69–94. doi:10.1155/2004/424395
5. Tang L, Zhou XJ. Diffusion MRI of cancer: from low to high b-values. J Magn Reson Imaging. 2019;49(1):23–40. doi:10.1002/jmri.26293
6. Just N. Improving tumour heterogeneity MRI assessment with histograms. Br J Cancer. 2014;111(12):2205–2213. doi:10.1038/bjc.2014.512
7. Kim H, Park SH, Kim EK, et al. Histogram analysis of gadoxetic acid-enhanced MRI for quantitative hepatic fibrosis measurement. PLoS One. 2014;9(12):e114224. doi:10.1371/journal.pone.0114224
8. Edmondson HA, Steiner PE. Primary carcinoma of the liver: a study of 100 cases among 48,900 necropsies. Cancer. 1954;7(3):462–503. doi:10.1002/1097-0142(195405)7:3<462::AID-CNCR2820070308>3.0.CO;2-E
9. Hu XX, Yang ZX, Liang HY, et al. Whole-tumor MRI histogram analyses of hepatocellular carcinoma: correlations with Ki-67 labeling index. J Magn Reson Imaging. 2017;46(2):383–392. doi:10.1002/jmri.25555
10. Li Y, Yan C, Weng S, et al. Texture analysis of multi-phase MRI images to detect expression of Ki67 in hepatocellular carcinoma. Clin Radiol. 2019;74(10):813 e819–813 e827. doi:10.1016/j.crad.2019.06.024
11. Woo S, Lee JM, Yoon JH, Joo I, Han JK, Choi BI. Intravoxel incoherent motion diffusion-weighted MR imaging of hepatocellular carcinoma: correlation with enhancement degree and histologic grade. Radiology. 2013;270(3):758–767. doi:10.1148/radiol.13130444
12. Shan Q, Chen J, Zhang T, et al. Evaluating histologic differentiation of hepatitis B virus-related hepatocellular carcinoma using intravoxel incoherent motion and AFP levels alone and in combination. Abdom Radiol. 2017;42(8):2079–2088. doi:10.1007/s00261-017-1107-6
13. Wei Y, Gao F, Wang M, et al. Intravoxel incoherent motion diffusion-weighted imaging for assessment of histologic grade of hepatocellular carcinoma: comparison of three methods for positioning region of interest. Eur Radiol. 2019;29(2):535–544. doi:10.1007/s00330-018-5638-1
14. Ishizaki M, Ashida K, Higashi T, et al. The formation of capsule and septum in human hepatocellular carcinoma. Virchows Arch. 2001;438(6):574–580. doi:10.1007/s004280000391
15. Surov A, Meyer HJ, Wienke A. Associations between apparent diffusion coefficient (ADC) and KI 67 in different tumors: a meta-analysis. Part 1: ADCmean. Oncotarget. 2017;8(43):75434–75444. doi:10.18632/oncotarget.20406
16. Li LT, Jiang G, Chen Q, Zheng JN. Ki67 is a promising molecular target in the diagnosis of cancer (review). Mol Med Rep. 2015;11(3):1566–1572. doi:10.3892/mmr.2014.2914
17. Xu YS, Liu HF, Xi DL, et al. Whole-lesion histogram analysis metrics of the apparent diffusion coefficient: a correlation study with histological grade of hepatocellular carcinoma. Abdom Radiol. 2019;44(9):3089–3098. doi:10.1007/s00261-019-02109-w
18. Li H, Zhang J, Zheng Z, et al. Preoperative histogram analysis of intravoxel incoherent motion (IVIM) for predicting microvascular invasion in patients with single hepatocellular carcinoma. Eur J Radiol. 2018;105:65–71. doi:10.1016/j.ejrad.2018.05.032
19. Antonelli M, Johnston EW, Dikaios N, et al. Machine learning classifiers can predict Gleason pattern 4 prostate cancer with greater accuracy than experienced radiologists. Eur Radiol. 2019;29(9):4754–4764. doi:10.1007/s00330-019-06244-2
20. Alis D, Bagcilar O, Senli YD, et al. Machine learning-based quantitative texture analysis of conventional MRI combined with ADC maps for assessment of IDH1 mutation in high-grade gliomas. Jpn J Radiol. 2019;38:135–143. doi:10.1007/s11604-019-00902-7
21. Hamerla G, Meyer H-J, Schob S, et al. Comparison of machine learning classifiers for differentiation of grade 1 from higher gradings in meningioma: a multicenter radiomics study. Magn Reson Imaging. 2019;63:244–249. doi:10.1016/j.mri.2019.08.011
22. Dong Z, Huang K, Liao B, et al. Prediction of sorafenib treatment-related gene expression for hepatocellular carcinoma: preoperative MRI and histopathological correlation. Eur Radiol. 2019;29(5):2272–2282. doi:10.1007/s00330-018-5882-4
23. Hicks RM, Yee J, Ohliger MA, et al. Comparison of diffusion-weighted imaging and T2-weighted single shot fast spin-echo: implications for LI-RADS characterization of hepatocellular carcinoma. Magn Reson Imaging. 2016;34(7):915–921. doi:10.1016/j.mri.2016.04.007
24. Zhang T, Huang ZX, Wei Y, et al. Hepatocellular carcinoma: can LI-RADS v2017 with gadoxetic-acid enhancement magnetic resonance and diffusion-weighted imaging improve diagnostic accuracy? World J Gastroenterol. 2019;25(5):622–631. doi:10.3748/wjg.v25.i5.622
25. Basha MAA, Refaat R, Mohammad FF, et al. The utility of diffusion-weighted imaging in improving the sensitivity of LI-RADS classification of small hepatic observations suspected of malignancy. Abdom Radiol. 2019;44(5):1773–1784. doi:10.1007/s00261-018-01887-z
26. Luciani A, Vignaud A, Cavet M, et al. Liver cirrhosis: intravoxel incoherent motion MR imaging–pilot study. Radiology. 2008;249(3):891–899. doi:10.1148/radiol.2493080080
27. Patel J, Sigmund EE, Rusinek H, Oei M, Babb JS, Taouli B. Diagnosis of cirrhosis with intravoxel incoherent motion diffusion MRI and dynamic contrast-enhanced MRI alone and in combination: preliminary experience. J Magn Reson Imaging. 2010;31(3):589–600. doi:10.1002/jmri.22081
28. Chen F, Chen YL, Chen TW, et al. Liver lobe based intravoxel incoherent motion diffusion weighted imaging in hepatitis B related cirrhosis: association with child-pugh class and esophageal and gastric fundic varices. Medicine. 2020;99(2):e18671. doi:10.1097/MD.0000000000018671
 © 2020 The Author(s). This work is published and licensed by Dove Medical Press Limited. The full terms of this license are available at https://www.dovepress.com/terms.php and incorporate the Creative Commons Attribution - Non Commercial (unported, v3.0) License.
By accessing the work you hereby accept the Terms. Non-commercial uses of the work are permitted without any further permission from Dove Medical Press Limited, provided the work is properly attributed. For permission for commercial use of this work, please see paragraphs 4.2 and 5 of our Terms.
© 2020 The Author(s). This work is published and licensed by Dove Medical Press Limited. The full terms of this license are available at https://www.dovepress.com/terms.php and incorporate the Creative Commons Attribution - Non Commercial (unported, v3.0) License.
By accessing the work you hereby accept the Terms. Non-commercial uses of the work are permitted without any further permission from Dove Medical Press Limited, provided the work is properly attributed. For permission for commercial use of this work, please see paragraphs 4.2 and 5 of our Terms.