")
Back to Journals » International Journal of Nanomedicine » Volume 13
Evaluation of highly carbonated hydroxyapatite bioceramic implant coatings with hierarchical micro-/nanorod topography optimized for osseointegration
Authors Li S, Yu W , Zhang W, Zhang G, Yu L, Lu E
Received 15 December 2017
Accepted for publication 16 March 2018
Published 26 June 2018 Volume 2018:13 Pages 3643—3659
DOI https://doi.org/10.2147/IJN.S159989
Checked for plagiarism Yes
Review by Single anonymous peer review
Peer reviewer comments 2
Editor who approved publication: Dr Linlin Sun
Shuang Li,1,2 Weijun Yu,3 Weiqi Zhang,1 Guohua Zhang,1 Li Yu,1 Eryi Lu1
1Department of Stomatology, Renji Hospital, School of Medicine, Shanghai Jiao Tong University, Shanghai, People’s Republic of China; 2Shanghai Key Laboratory of Orthopedic Implants, Department of Orthopedic Surgery, Shanghai Ninth People’s Hospital, School of Medicine, Shanghai Jiao Tong University, Shanghai, People’s Republic of China; 3College of Stomatology, School of Medicine, Shanghai Jiao Tong University, Shanghai, People’s Republic of China
Background: Optimal osseointegration has been recognized as a pivotal factor in determining the long-term success of biomedical implants.
Materials and methods: In the current study, highly carbonated hydroxyapatite (CHA) with carbonate contents of 8, 12 and 16 wt% and pure hydroxyapatite (HA) were fabricated via a novel hydrothermal method and deposited on the titanium substrates to generate corresponding CHA bioceramic coatings (designated as C8, C12 and C16, respectively) and HA bioceramic coatings (designated as C0).
Results: C8, C12 and C16 were endowed with nanoscale, hierarchical hybrid micro-/nanoscale and microscale surface topographies with rod-like superstructures, respectively. Compared with C0, the micro-/nanotextured CHA bioceramic coatings (C8, C12 and C16) possessed excellent surface bioactivity and biocompatibility, as well as better wettability, which mediated improved protein adsorption, giving rise to simultaneous enhancement of a biological cascade of events of rat bone-marrow-derived mesenchymal stem cells including cell adhesion, proliferation, osteogenic differentiation and, notably, the production of the pro-angiogenic growth factor, vascular endothelial growth factor-A. In particular, C12 with biomimetic hierarchical hybrid micro-/nanorod topography exhibited superior fractal property and predominant performance of protein adsorption, cell adhesion, proliferation and osteogenesis concomitant with angiogenesis.
Conclusion: All these results suggest that the 12 wt% CHA bioceramic coating with synergistic modification of surface chemistry and topography has great prospect for future use as implant coating to achieve optimum osseointegration for orthopedic and dental applications.
Keywords: carbonated hydroxyapatite, micro-/nanohybrid topography, biomimicry, titanium implant
Introduction
For the past 3 decades, titanium and its alloys have been extensively employed as implant biomaterials in dental and orthopedic fields due to their desirable biocompatibility and superior mechanical property.1 Considering the bio-inert nature of the surface of titanium-based implants, a plethora of work has been devoted to modify the surface of titanium-based implants to improve the bioactivity.2 Since surface characteristics, such as free energy, chemical composition, crystal structure, topography and elasticity, exert significant impact on cell–implant interactions, surface modification strategies particularly regarding chemical composition and topography have been massively applied to optimize implant surfaces for improving their bioresponse, osseointegration and, ultimately, the clinical outcome.3,4
Considering that hydroxyapatite (HA) is closely analogous to the inorganic composition of natural bone tissue, HA coatings have been widely adopted to modify metal implant surfaces,5 largely ameliorating the cytocompatibility and osteoinductive capacity of implants. However, biological apatites found in native hard tissues such as bone and teeth are not highly crystalline due to the substitution of a multitude of foreign ions, namely carbonate ions, magnesium, strontium, zinc, silicate, fluorine, etc.6 Biomineralized tissues contain 2–8 wt% carbonate depending on age and tissue type.7,8 According to the substitution of carbonate groups for hydroxyl groups or phosphate ions, carbonated apatite can be categorized into A-type or the more diffused B-type, and the latter has been verified to cause a decrease in crystallinity and hence an increase in solubility.9 Thus far, carbonated hydroxyapatite (CHA) has mostly been applied as ceramic bone substitutes;10–12 meanwhile, it has also gradually become employed as coatings on implant substrates13,14 and drug delivery systems.15 CHA-related investigations have largely reached a consensus on its excellent biocompatibility and bio-resorption properties, yet conflicting results regarding the biological effects on osteoblasts, including adhesion, proliferation and osteogenic differentiation, are still being reported.11–13,15,16
The genuine biological functions of CHA biomaterials compared with those of HA products still remain ambiguous and relatively undesirable, mostly because the content of carbonate incorporated into HA was either undetermined or limited to a low concentration range according to the available literature. As a matter of fact, HA with a higher carbonate content mimicking early biomineralization could contribute to better cell behaviors, as implied by a study involving a wide spectrum of carbonate concentrations from 0 to 16.1 wt%.17
It is well documented that both surface chemistry and topography exert tremendous impacts on biomaterial proficiency, yet the majority of investigations in search of optimal CHA biomaterials merely focused on the most desirable chemical composition, such as the carbonate content, which mostly exhibited unsatisfying results. Therefore, for the optimization of CHA material design and acceleration of its application in clinical practice, more attention should be paid to the endowment of appropriate topographic characteristics to the surface of CHA-relevant biomaterials.
The extracellular matrix (ECM) of native bone is hierarchically assembled from highly organized arrays of embedded apatite mineral crystals and fibrillar collagen on the nanoscale level and bundles of aligned crystallites that are interwoven into the collagen fibers on the microscale level, which can impose overarching influence on cellular responses and fate through their biochemical and biomechanical interactions.18,19
Enlightened by the fact that the structure of nanorod is similar to HA crystals and that ECM possesses a hierarchical micro-/nanohybrid architecture, a biomaterial surface with micro-/nanoscale topographical structures is more likely to provide a biomimetic microenvironment for cellular responses, thus yielding optimal biological activity.20–22 Nevertheless, few attempts have been made to fabricate and evaluate implant surfaces with hierarchical micro-/nanohybrid topography composed of rod-like superstructures.
Previously, numerous techniques have been employed to synthesize CHA crystals, such as the flux method, wet chemical precipitation, microwave irradiation, etc. However, the hydrothermal method possesses several advantages over the conventional processes, such as simplicity, cost-effectiveness, relatively higher dispersion and, most importantly, the production of crystals with well-controlled size and morphology.23
In this study, highly CHA with carbonate contents of 8, 12, and 16 wt% and pure HA crystals with multiscale morphology were fabricated via a novel hydrothermal method using EDTA and cetyltrimethylammonium bromide (CTAB) as templates and were then deposited on titanium substrates to yield corresponding coatings with ensuing varying micro-/nanostructured surface topographies. Furthermore, in vitro experiments were conducted to evaluate the effects of various CHA bioceramic coatings with micro-/nanotextured surface topographies on the biocompatibility and bio-functionality, including osteogenesis and angiogenesis.
Materials and methods
Synthesis and characterizations of highly CHA powders
Stoichiometric pure HA and CHA powders were employed in this study. EDTA and CTAB served as templates for the HA and CHA rod-like crystals. (NH4)2HPO4 and NH4HCO3 solutions were added dropwise to a mixed solution of Ca(NO3)2·4H2O, EDTA and CTAB while keeping the pH at 9–11 via adding ammonium hydroxide solution. Different concentrations of NH4HCO3 (0, 8, 12 and 16 wt%) were applied, and the as-synthesized powders were labeled as HA, CHA8, CHA12 and CHA16, respectively (Table 1). Then, the corresponding suspensions were poured into teflon-lined stainless steel autoclaves, which were then placed in an oven for 24 h at 180°C and cooled down to ambient temperature. The as-obtained precipitate was washed with deionized water and ethyl alcohol and then freeze dried for 12 h, followed by centrifugation to collect the crystal products for characterization. The sols of HA and CHA were synthesized under the same condition as delineated earlier for coating deposition.
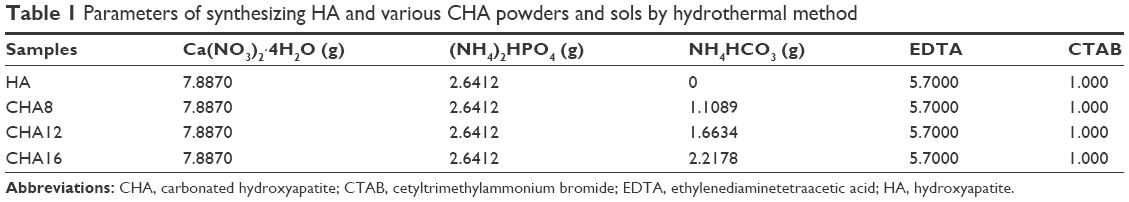 | Table 1 Parameters of synthesizing HA and various CHA powders and sols by hydrothermal method |
The as-obtained powders were characterized by scanning electron microscopy (SEM; Hitachi SU8220; Hitachi Ltd., Tokyo, Japan), transmission electron microscopy (TEM; Tecnai C12 F30 S-Twin; FEI, Hillsboro, OR, USA), X-ray photoelectron spectroscopy (XPS; ESCALAB250Xi; Thermo Fisher Scientific, Waltham, MA, USA), X-ray diffraction (XRD; D8 Advance; Bruker Optik GmbH, Ettlingen, Germany) and Fourier transform infrared spectrometry (FTIR; Alpha; Bruker Corporation, Billerica, MA, USA).
Coating fabrication and surface characterizations
The HA and CHA coatings on titanium substrates were fabricated as previously described.24 Briefly, the commercially pure titanium substrates (96% purity, φ=8×1 mm) were first subjected to a polishing and cleaning procedure, followed by immersion in a 5 mol/L NaOH aqueous solution at 80°C for 8 h, sintering at 600°C for 1 h at a rate of 5°C/min and cooling to ambient temperature. Subsequently, the substrates were dipped into the as-prepared HA and CHA sols at a withdrawal rate of 5 cm/min, and the gels attained from the sols were dried at 150°C for 30 min and then heat-treated at 550°C for 30 min. Overall, five cycles of dip coating and oven drying were applied to obtain the coatings. Titanium substrates coated with the corresponding HA and CHA sols were designated as C0, C8, C12 and C16. Finally, the samples were sterilized in an autoclave for further experiments.
The surface morphology and the cross-sectional view of the samples were observed by SEM (Hitachi SU8220). Surface wettability was assessed using a contact angle goniometer (DSA100; Kruss; Hamburg, Germany) via the sessile drop method.25 Surface topography and surface roughness were characterized by atomic force microscopy (AFM; XE-100; Park Systems Co., Suwon, Korea). Ra values were determined via the AFM software program (NanoScope Analysis; Bruker Optik GmbH) on the basis of at least six independent measurements. As previously described,26 the AFM scans were then processed through conventional mathematical procedures in MATLAB to obtain power spectral density functions (PSDFs), thus quantitatively evaluating the fractal properties of different surfaces with the parameter such as fractal dimension Df. Specifically, in a log–log plot of PSDF, the slope β of the fitted line is related to the Hurst exponent as β=2(H+1). The fractal dimension Df of various surfaces can be equivalently derived from β or H as Df=(8−β)/2 or Df=3−H. The fractal dimension Df for a surface ranges from 2, representing a perfectly flat surface (Euclidean dimension of a surface), to 3, representing an extremely rough surface.
Apatite-forming ability assay
The apatite-forming assay was adopted to evaluate the acellular bioactivity of the various modified coatings. According to a previous method,12 the coated substrates were soaked at 37°C in simulated body fluid (SBF) under an agitation of 100 rpm for 14 days, and the medium was replaced every 3 days for fresh SBF exposure. After a prescribed time, SBF on the samples was removed and immediately dried in a desiccator.
The surface morphologic observation and chemical composition evaluation of the coated layers after SBF immersion were examined with an SEM (Hitachi SU8220) and energy-dispersive X-ray spectrometry (EDX) equipped with it. The data were presented as mean±SD with six measurements per group. The crystallographic structure of the precipitates was analyzed by XRD (D8 Advance) with Cu Kα X-ray source.
Protein adsorption assay
The serum protein adsorption capacities of the coating surfaces were examined as previously reported.21 Briefly, a droplet (1 mL) of α-MEM (HyClone, Logan, UT, USA) containing 10% fetal bovine serum (Thermo Fisher Scientific) was pipetted onto each specimen placed in a 24-well plate. After incubation at 37°C for 4 h, the samples were transferred to a new 24-well plate and gently rinsed with PBS three times. Then, the adsorbed proteins on the samples were detached into 1% sodium dodecyl sulfate (SDS) solution by shaking for 1 h. The protein concentration in the collected solutions was determined using a Micro BCA Protein Assay Kit (Thermo Fisher Scientific) according to the manufacturer’s instructions. Experiments were conducted in triplicate.
Isolation and culture of rat bone-marrow-derived mesenchymal stem cells (rBMSCs)
Sprague-Dawley rats were obtained from the Renji Hospital Animal Center (Shanghai, China), and all procedures were conducted in compliance with the Animal Welfare Act and the implementing Animal Welfare Regulations and approved by Animal Care and Use Committee of the Renji Hospital (Shanghai, China). Primary cultures of rBMSCs were isolated from the femurs and tibias of 4-week-old male Sprague-Dawley rats, as previously described.20 Briefly, the rats were euthanized with an overdose of 5% chloral hydrate. After separating the bilateral femurs and tibias, both ends of the femur were cutoff at the epiphysis to enable the marrow to be flushed out with α-MEM (HyClone) supplemented with 10% fetal bovine serum (Thermo Fisher Scientific) and 1% penicillin/streptomycin (Thermo Fisher Scientific), and the isolated cells were cultured at 37°C in a 5% CO2 incubator. Four days later, the nonadherent cells were rinsed away with PBS several times, and the fresh medium was added. Once reaching 80%–90% confluency, the cells were washed with PBS and passaged with 0.25% trypsin/EDTA. The culture medium was changed every 2 days, and cells of 2–4 passages were used for further study.
Cell attachment, spreading and morphology assay
In light of previous literature,27 cell counting was employed in the initial seeding period (4 and 12 h) to analyze cell attachment on different samples. rBMSCs at a density of 3.0 × 10⁴/well were incubated on the samples in a 24-well plate. At each time point, the remaining cells on the samples were fixed with 4% paraformaldehyde at 4°C for 15 min. The cell nuclei were stained with DAPI (Sigma-Aldrich Co., St Louis, MO, USA) for 10 min at room temperature. The number of attached cells in five random fields was counted at 200× magnification under a confocal laser scanning microscope (CLSM; Leica Microsystems, Wetzlar, Germany).
The seeding procedure for the evaluation of cell spreading and morphology on the coatings was similar to that of the cell attachment assay. After a 24-h incubation, the samples were fixed with 4% paraformaldehyde for 15 min at 4°C, followed by washing twice with PBS. Then, rhodamine–phalloidin (Enzo Life Sciences, Exeter, UK) was applied to label the f-actin cytoskeletons of the cells on the samples for 1 h in the dark. After washing twice with PBS, the nuclei were stained with DAPI for another 10 min, and all specimens were observed via CLSM.
Cell proliferation activity assay
To investigate the proliferation activity of rBMSCs on all samples, the Cell Counting Kit-8 (CCK-8; Dojindo Laboratories Inc., Kumamoto, Japan) assay was performed as previously described.28 First, cells were seeded onto each sample in a 24-well plate at a density of 2.0 × 10⁴/well. After 1, 4 and 7 days of culture, samples were washed twice with PBS and then incubated in 600 μL of α-MEM supplemented with 60 μL of CCK-8 solution for 2 h. The collected solution was carefully transferred to a 96-well plate at 100 μL/well. Then, the absorbance was measured at a wavelength of 450 nm on an ELX800 absorbance microplate reader (Bio-Tek, Winooski, VT, USA). All experiments were performed in triplicate, and the results were shown as optical density (OD) absorbance value.
Alkaline phosphatase (ALP) activity
To determine early osteogenic differentiation of rBMSCs on the different samples,28 rBMSCs were seeded at a density of 5.0×10⁴ cells/well with the osteogenic inductive medium for 7 days. Then, the substrates were fixed and stained by an ALP kit (Shanghai Hongqiao Medical Reagent Company, Shanghai, China). The quantitative ALP activity on day 7 was determined by detecting the OD values at 520 nm using an ALP microplate test kit (Nanjing Jiancheng Bioengineering Institute, Nanjing, China), and total protein concentration was assessed using a BCA Protein Assay Kit (Thermo Fisher Scientific) according to the provided instructions. The ALP activity was finally presented as OD values/mg of total proteins. The measurements were conducted in triplicate.
Calcium deposition assay
To evaluate the mineralization of ECM,29 after 21 days of osteogenic induction, rBMSCs on the four specimens were fixed in 4% paraformaldehyde and stained with 1% alizarin red solution (ARS; Sigma-Aldrich Co.). For the quantitative assay, 10% cetylpyridinium chloride (Sigma-Aldrich Co.) was applied to desorb calcium-bound alizarin red, and OD values were detected at 570 nm. Calcium deposition results were normalized to the total protein content and expressed as OD values at 590 nm/mg of total cellular protein.
Immunofluorescence of osteocalcin (OCN)
Immunofluorescence analysis of OCN was also conducted to assess the osteogenic differentiation ability of rBMSCs on different substrates as previously depicted.28 After culturing in the osteogenic inductive medium for 7 days, cells were fixed in 4% paraformaldehyde for 20 min at 4°C and then permeabilized with 1% Triton X-100 for 30 min prior to being blocked with 3% bovine serum albumin for another 30 min. Afterward, the samples were incubated with primary antibodies against OCN (Abcam, Cambridge, MA, USA) at 4°C overnight. Finally, DyLight 488-conjugated anti-mouse immunoglobulin G antibody (Abcam) was co-incubated at 37°C for 1 h, and the cell nuclei were counterstained with DAPI before observation by CLSM. The experiment was performed in triplicate.
Detection of vascular endothelial growth factor-A (VEGF-A) by enzyme-linked immunosorbent assay (ELISA)
To evaluate the production of pro-angiogenic growth factor, VEGF-A, rBMSCs were seeded onto the various substrates at a density of 1.0×10⁶ cells/mL (200 μL/substrate) as described previously.30 At the culturing time point of days 1, 4 and 7, the culture supernatant was collected and replaced with the fresh medium. The secretion level of VEGF-A was determined using an ELISA kit (R&D Systems, Inc., Minneapolis, MN, USA) following the manufacturer’s instructions. The experiment was performed on four samples for each group.
Statistical analyses
All data are expressed as mean±SD. All in vitro experiments were repeated in triplicate. The results were analyzed via Student’s t-test or one-way analysis of variance using the GraphPad Prism 5.0 statistical software package (GraphPad Software, Inc., La Jolla, CA, USA). Differences were considered statistically significant at P<0.05.
Results
Characterization of CHA powders
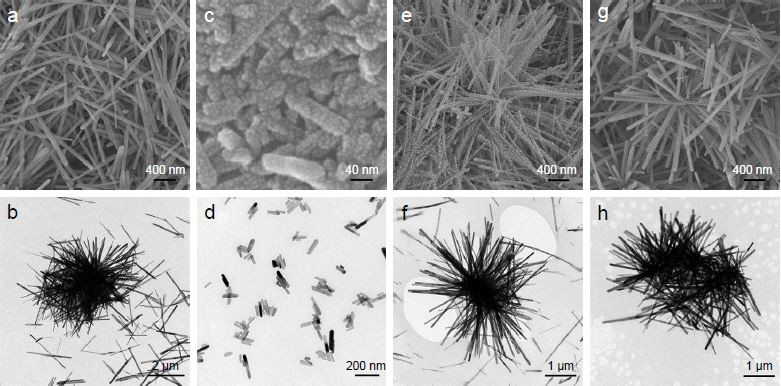
The SEM and TEM examinations (Figure 1) revealed the morphology and size of the as-obtained HA and CHA crystals. On the whole, the crystals of all samples had highly regular rod-like shape but were nonuniform in size. Specifically, the crystal size of HA had a broad distribution from the submicron level to the micron level, with a length ranging from 600 nm to 3 μm and a width of 50–100 nm. The size distribution of CHA8 was largely narrowed down to the nanoscale, with a length measuring 40–200 nm and a width of 15–40 nm. The CHA12 crystals had a length ranging from the nanoscale to the microscale, measuring 50 nm to 2 μm, with a width of 10–30 nm. The crystal size of CHA16 was on the microscale, measuring 1–3 μm in length and 65–100 nm in width.
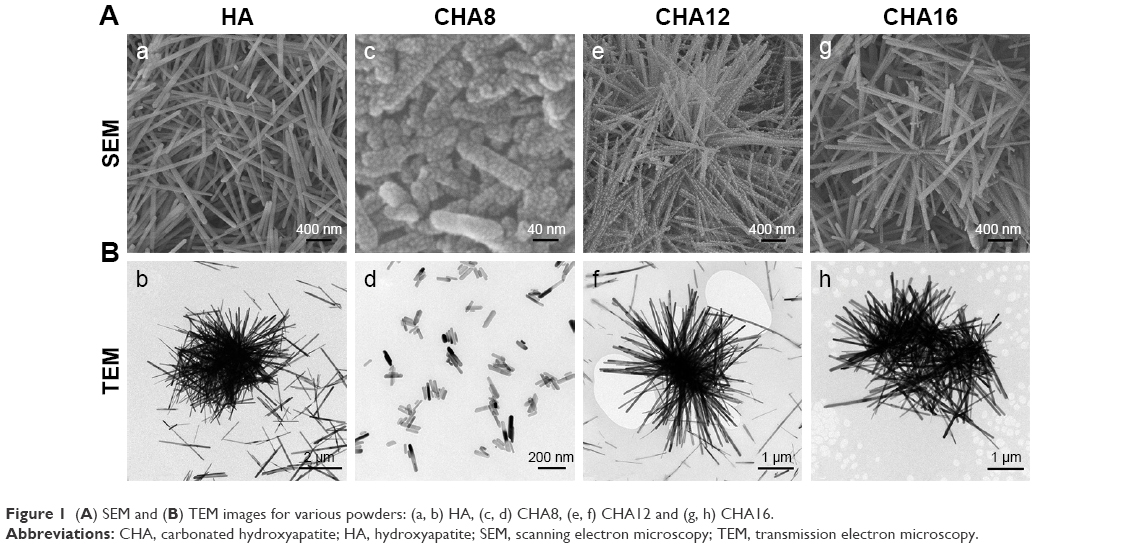 | Figure 1 (A) SEM and (B) TEM images for various powders: (a, b) HA, (c, d) CHA8, (e, f) CHA12 and (g, h) CHA16. |
The diffraction peaks in the XRD patterns (Figure 2A) can be attributed to the (002), (211), (112), (300), (311) and (004) crystallographic planes of HA.31 In comparison with HA, the peaks of all CHA samples broadened and shifted to lower 2θ angles, indicating that crystallinity (lattice perfection and/or crystal size) of the CHA crystals decreased due to the  incorporation. Notably, the extent of peak broadening and angle of CHA powders decreased when the carbonate concentration increased.
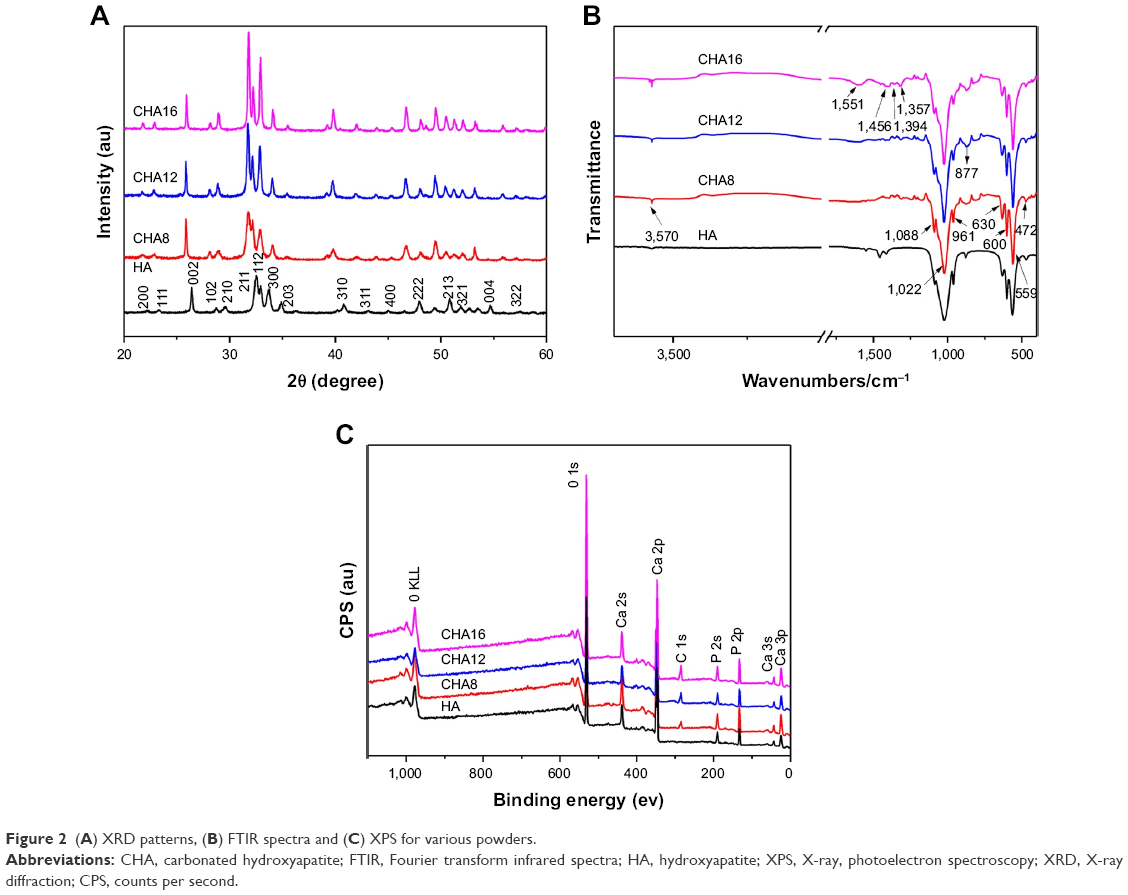 | Figure 2 (A) XRD patterns, (B) FTIR spectra and (C) XPS for various powders. |
The FTIR spectra of the powders (Figure 2B) verified the presence of the typical signals of apatite. Three peaks at 1,088, 1,022 and 961 cm−1 should be associated with υ1 and υ3 modes of phosphate groups, and 600 and 559 cm−1 are assigned to υ4 phosphate modes.32 It was observed that the abovementioned bands attributed to phosphate shifted to lower wavenumber with increasing carbonate incorporation, which was indicative of a decrease in crystallinity with the increase in carbonate doping. The antisymmetric stretching mode of C−O (υ3) ranging from 1,500 to 1,400 cm−1 suggested the incorporation of carbonate ions and the increase in adsorption intensity by the carbonate content. The υ3 vibration mode and υ2 vibration of at 877 cm−1 confirmed the B-type substitution present in all the prepared CHA crystals.8
The XPS spectra of the as-prepared powders are shown in Figure 2C. The varying intensities of the C 1s peak demonstrated the successful incorporation of different amounts of into the apatite lattice. The carbonate levels in HA, CHA8, CHA12 and CHA16 crystals were ~0.09, 7.72, 10.41 and 14.04 wt%, respectively, which were slightly less than designed.
Characterization of the coatings
The surface images of the coating specimens C0, C8, C12 and C16 are shown in Figure 3A. C0 displayed inhomogeneous surface layers of HA crystals, which were composed of a combination of a dense layer and a porous layer with submicron pore size of 300–600 nm. The surface of C8 consisted of relatively homogeneous and densely packed layers of nanoscale crystals. Furthermore, it was observed that the surface of sample C12 was homogeneously paved with rod-like crystals with pores measuring 100–200 nm uniformly scattered on it. The surface of C16 was covered with highly porous apatite layers comprising large pores measuring 600–800 nm and smaller pores inside it measuring 200–400 nm. In addition, the cross-sectional images as shown in Figure 3A (the inset images) demonstrated that the coatings were homogeneously deposited on the titanium substrates with no delamination at the interfaces, indicating that the CHA coatings possessed a satisfying bonding capacity. The thickness of all coatings was ~4–5 μm.
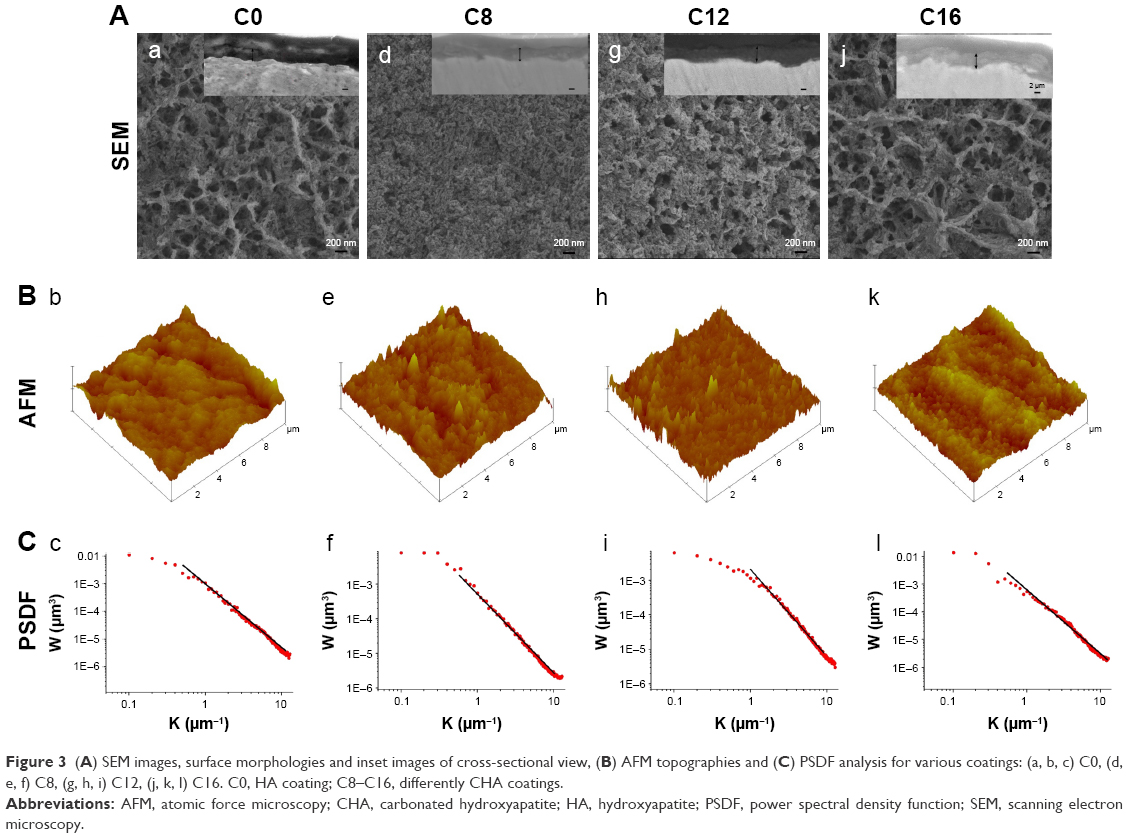 | Figure 3 (A) SEM images, surface morphologies and inset images of cross-sectional view, (B) AFM topographies and (C) PSDF analysis for various coatings: (a, b, c) C0, (d, e, f) C8, (g, h, i) C12, (j, k, l) C16. C0, HA coating; C8–C16, differently CHA coatings. |
The surface topography of the coatings was analyzed via AFM (Figure 3B). For all samples, there were rod-like crystals growing vertically on the substrates, forming an ordered rod-aligned three-dimensional (3D) topography. The C8 and C12 coatings displayed more fine granular surfaces than the C0 and C16 coatings, which was according to the SEM and TEM examinations of the HA and CHA powders (Figure 1). Microcracks could be found on the microtextured surface of C16. A quantitative analysis of the fractality for all substrates was obtained from PSDFs. The images of PSDF are shown in Figure 3C, where the quantity W is plotted over multiple length scales K, ranging from 0.1 to 10.0 μm−1. All curves were analogous to the classical form of the power spectrum of randomly rough natural surfaces. Differences could be observed among the curves for the four samples. The roughness values of the samples measured by AFM are shown in Figure 4A. The Ra values of C0, C8, C12 and C16 were 45.55±0.82, 45.13±0.67, 42.86±0.64 and 44.98±0.77 nm, respectively. It was observed that there was no appreciable difference in the Ra value among the four samples (P>0.05). The fractal dimension Df extracted from the fitting of the curves in the images of PSDF is shown in Figure 4B. The Df values of C0, C8, C12 and C16 were 2.37±0.03, 2.34±0.03, 2.27±0.04 and 2.35±0.02, respectively. C12 exhibited the lowest fractal level among all samples.
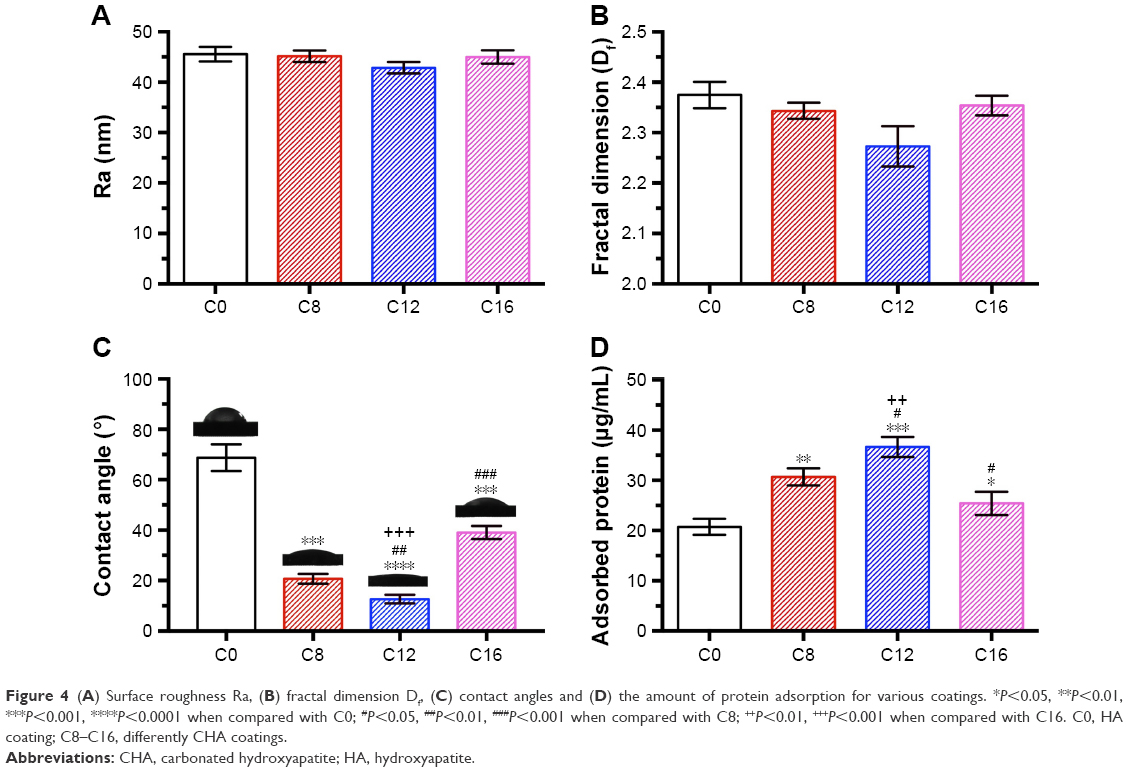 | Figure 4 (A) Surface roughness Ra, (B) fractal dimension Df, (C) contact angles and (D) the amount of protein adsorption for various coatings. *P<0.05, **P<0.01, ***P<0.001, ****P<0.0001 when compared with C0; #P<0.05, ##P<0.01, ###P<0.001 when compared with C8; ++P<0.01, +++P<0.001 when compared with C16. C0, HA coating; C8–C16, differently CHA coatings. |
The surface wettability of the coatings was determined by water contact angle assay (Figure 4C). Compared with C0 (~68°), C8–C16 exhibited significantly lower contact angles (P<0.05). Impressively, the C12 surface was remarkably hydrophilic with the water contact angle value (~12°) being more than three times lower than that of C0 (P<0.0001). Moreover, the contact angle of C8 (~20°) was also significantly lower than that of C16 (~39°).
Protein adsorption
The amounts of serum protein adsorbed onto the coatings are shown in Figure 4D. C8 (30.68±0.98 μg/mL), C12 (36.63±2.45 μg/mL) and C16 (25.42±1.22 μg/mL) showed much higher protein adsorption capacities than C0 (20.75±0.92 μg/mL), indicating that the modified coatings on the whole outperformed the unmodified one (P<0.05). Moreover, C12 adsorbed the most serum protein, followed by C8 and then C16.
Apatite-forming ability
The XRD spectra of samples after 14 days of immersion in SBF solution are shown in Figure 5A. It was observed that all the samples had similar patterns comprising diffraction peaks attributed to HA and titanium. Thus, the deposited crystals on the samples with apatite structures were confirmed. The peaks associated with the HA phase were analogous and exhibited no obvious difference.
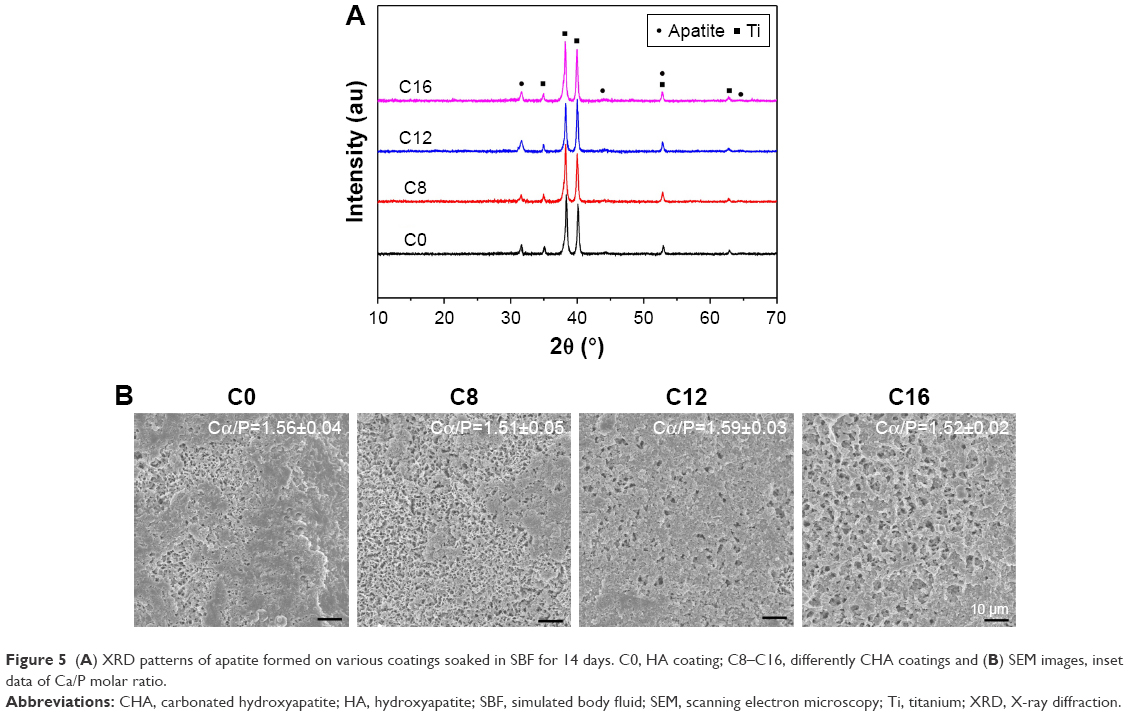 | Figure 5 (A) XRD patterns of apatite formed on various coatings soaked in SBF for 14 days. C0, HA coating; C8–C16, differently CHA coatings and (B) SEM images, inset data of Ca/P molar ratio. |
As shown in Figure 5B, the SEM images showed that all the surfaces were covered by newly formed apatite crystals. Moreover, the apatite layer on C0 was slightly denser than that on C8–C16. Among these, C12 displayed the greatest amount of the crystalline apatite deposition, followed by C8 and C16. In addition, the molar ratio Ca/P of crystals formed on all the samples estimated by EDS was 1.56±0.04, 1.51±0.05, 1.59±0.03 and 1.52±0.02, respectively, further confirming the crystals were calcium-deficient HA.23
Attachment, spreading and morphology of rBMSCs
The attached cells on all the samples were detected using the DAPI assay. As shown in Figure 6, at both the time point of 4 and 12 h, the number of adhesive rBMSCs on the C12 was much greater than that on C0 (P<0.01), C8 (P<0.05) and C16 (P<0.01). After 4 h of culture, C8 also displayed significantly higher amount of adherent cells than C0 did (P<0.05). After an incubation of 12 h, C8–C16 all exhibited much more adherent cells on the surfaces (P<0.05).
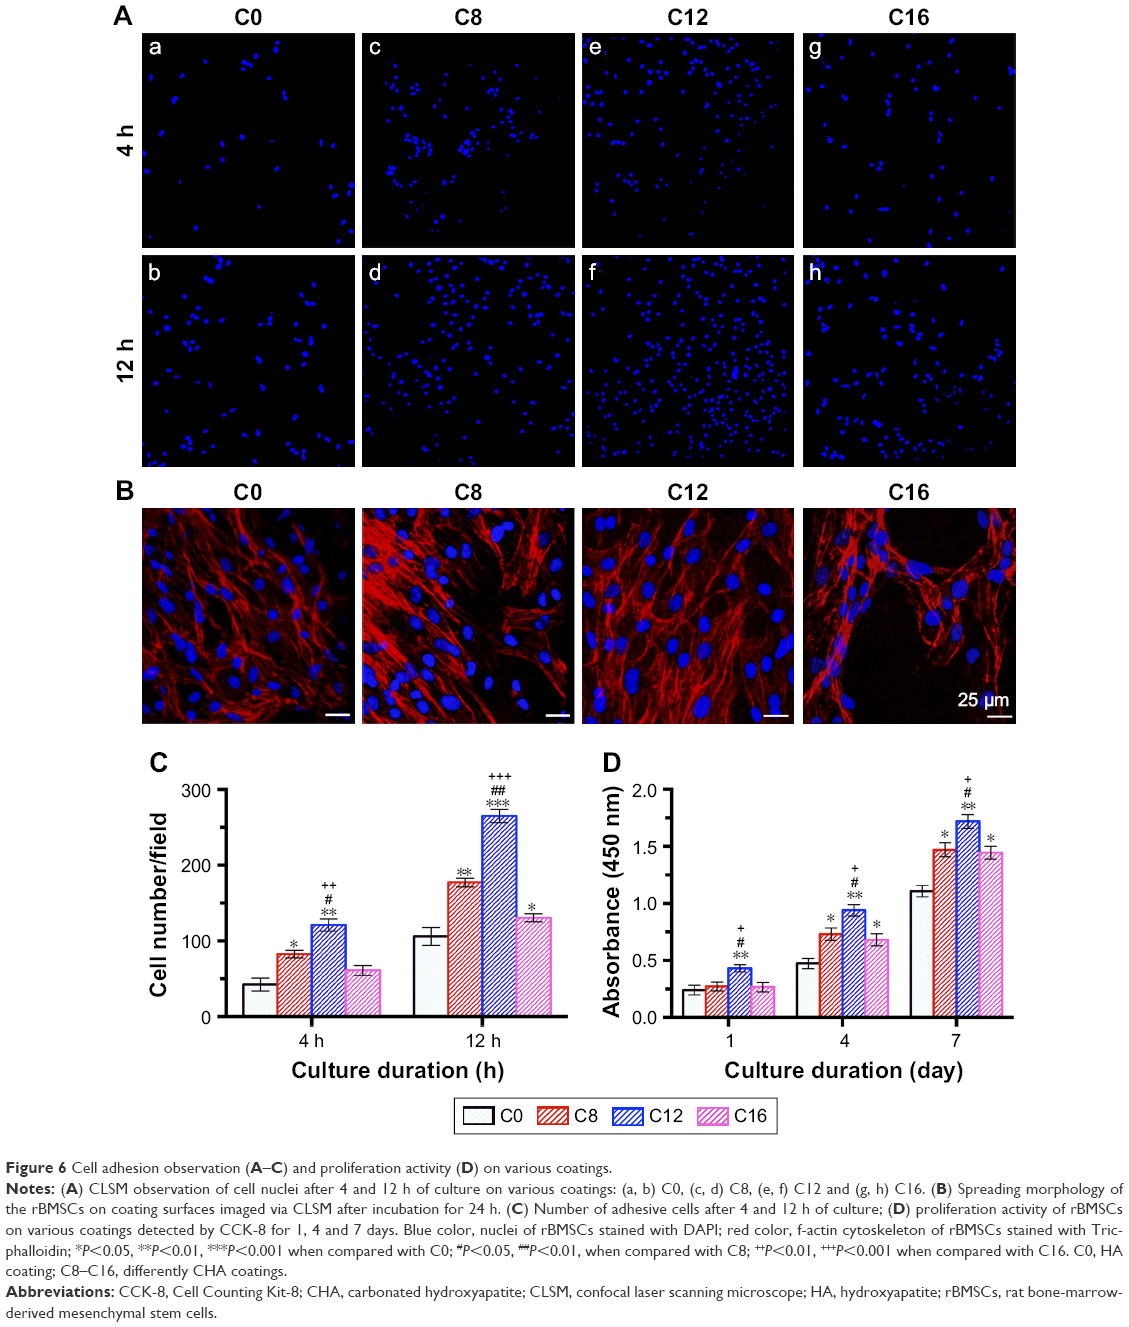 | Figure 6 Cell adhesion observation (A–C) and proliferation activity (D) on various coatings. |
The spreading morphologies of the rBMSCs cultured on all samples for 24 h are shown in Figure 6B. In comparison with cells seeded on C0, the cells on C8–C16 spread better with obvious cytoplasmic extensions and filopodial attachments after 24 h of culture. More importantly, such an improved impact on cell adhesion morphology was even more evident for C12 with a micro-/nanohybrid topographical surface, on which the polymerized f-actin of rBMSCs was well organized and these fully spread cells were interconnected by numerous extended filopodia and lamellipodia, almost covering the entire surface.
Cell proliferation activity
Cell proliferation at 1, 4 and 7 days was determined by the CCK-8 assay (Figure 6D). During the cell culturing span, rBMSCs on all specimens proliferated in a time-dependent manner. Distinctly higher cell proliferation was detected only on C12 compared with that on C0 (P<0.01), C8 (P<0.05) and C16 (P<0.05) at day 1. As culturing proceeded, there was significantly higher proliferation on C8–C16 and C0 at day 4 and day 7, respectively (P<0.01 for C12–C0, P<0.05 for C8–C0 and P<0.05 for C16–C0). More importantly, C12 with hierarchical micro-/nanoscale topography exhibited constantly superior proliferation relative to the other three samples through the observation period.
Evaluation of cell osteogenic differentiation
The osteogenic differentiation of rBMSCs on the coatings was evaluated via qualitative and quantitative study of ALP expression and calcium deposition by ARS assay (Figure 7A and B). As shown in Figure 7A, the most intensive ALP staining (Figure 7Aa) was observed for rBMSCs cultured on C12 compared with C0, C8 and C16, which was consistent with the corresponding statistically significant difference in ALP activity (Figure 7Ab). Moreover, the ALP activity analysis also corroborated that ALP activity involving C8–C16 was markedly higher than that on C0 (P<0.05 for C8 and C16, P<0.01 for C12). The results of the ARS assay on day 21 as shown in Figure 7B showed a highly similar trend as mentioned earlier.
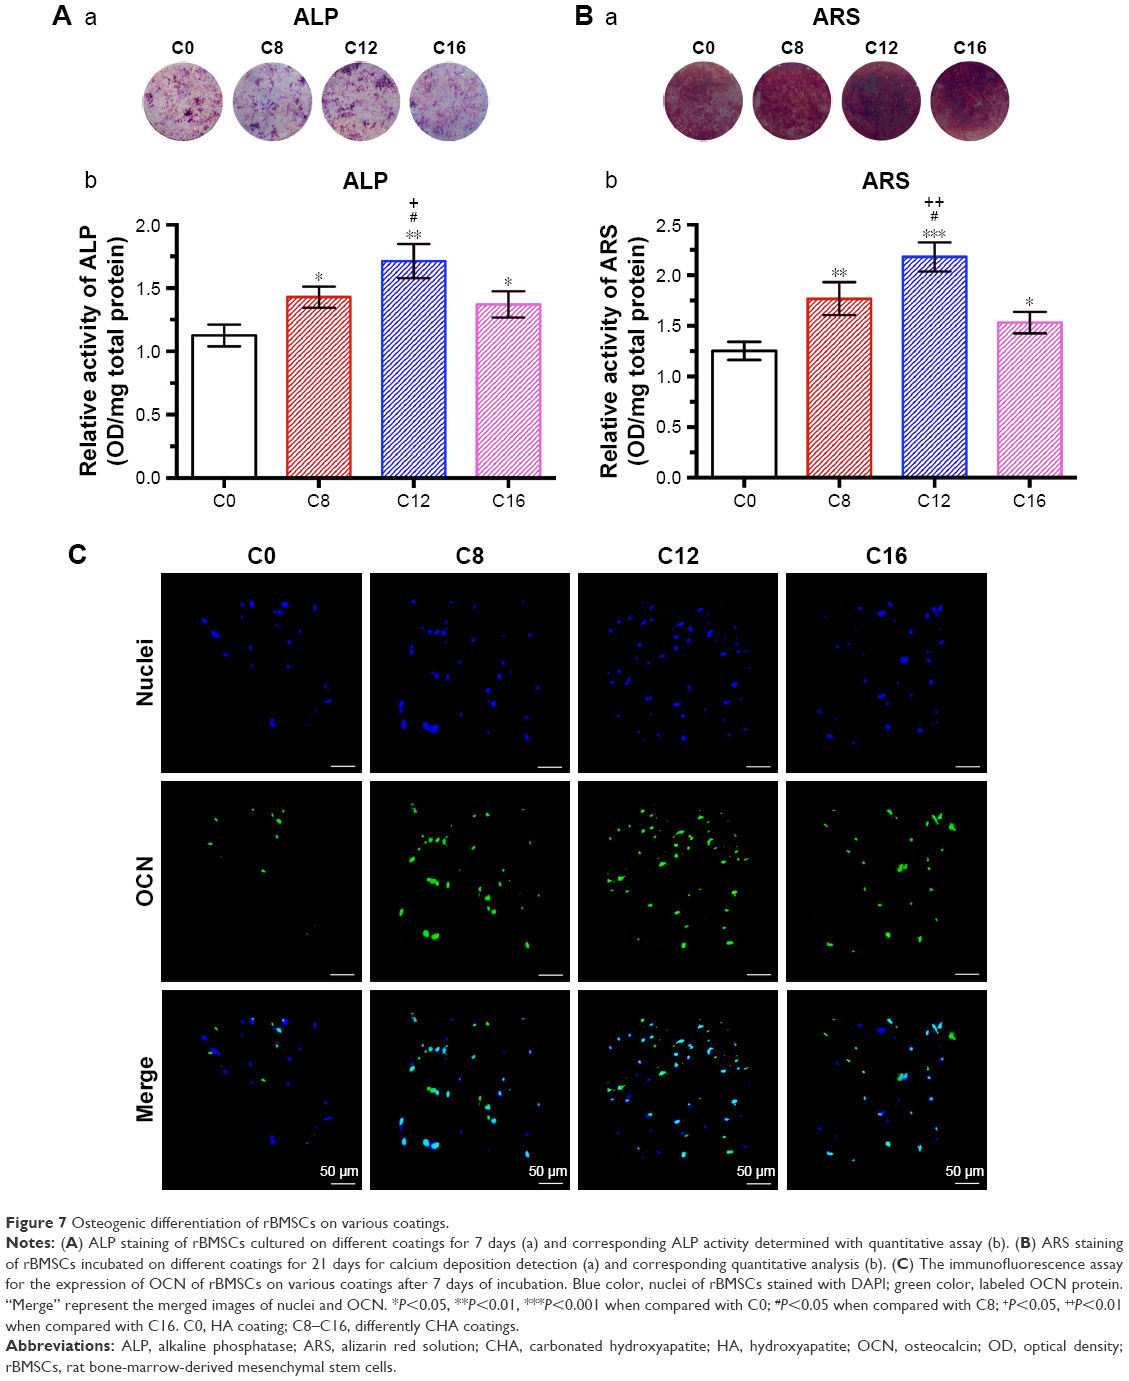 | Figure 7 Osteogenic differentiation of rBMSCs on various coatings. |
Immunofluorescence of OCN
The expression of the osteogenic-relevant protein OCN of rBMSCs cultured on the specimens was examined by immunofluorescence assay (Figure 7C). It could be observed that OCN-positive staining was more evident on all modified coatings (C8–C16), among which C12 exhibited the highest fluorescence intensity, indicative of the highest expression of OCN protein in the cells grown on it.
Concentration of VEGF-A
The secretion level of VEGF-A by rBMSCs cultured on all samples (Figure 8) after incubation of 1, 4 and 7 days is demonstrated in Figure 8. At day 1, rBMSCs cultured on C12 secreted more VEGF-A than cells grown on the remaining groups (P<0.05). At days 4 and 7, the production of VEGF-A on C12 was substantially elevated compared with that on C0 (P<0.01), C8 (P<0.05) and C16 (P<0.05). Compared with C0, the VEGF-A secretion of cells on C8 and C16 was significantly higher (P<0.05) at day 4 and day 7.
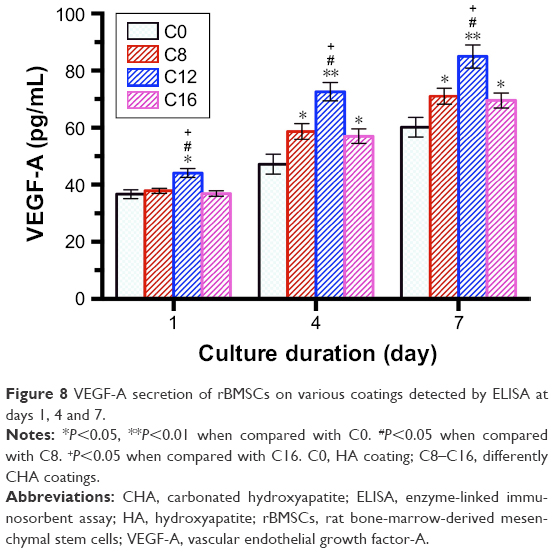 | Figure 8 VEGF-A secretion of rBMSCs on various coatings detected by ELISA at days 1, 4 and 7. |
Discussion
Both the surface chemistry and topography of biomaterials constitute potent factors in determining biological responses. For bioceramic materials, modification strategies regarding surface chemistry have been widely adopted, whereas limited efforts were devoted to the creation of micro–nanostructured topographies on the bioceramic surface to further achieve robust biological effects due to the inherently challenging brittleness. In the current study, a novel hydrothermal method was adopted to fabricate various highly CHA bioceramic coatings in an attempt to achieve concurrent modification of surface chemistry and appropriate surface topography.
The HA and CHA crystals presented various morphologies (Figure 1): micro-/submicron hybrid rod for HA, nanorod for CHA8, hybrid micro-/nanorod for CHA12 and microrod for CHA16. As indicated by SEM and AFM images of corresponding coatings (Figure 3A and B), the as-synthesized rod-like apatite crystals with multiscale rod length assembled on the titanium substrates in a 3D manner and weaved into varying 3D-structured coatings (C0–C16). Interestingly, there was no significant difference in the average surface roughness (Ra value) among the four substrates with roughness over multiple length scales (Figures 3C and 4A), whereas the fractal dimension of the surfaces varied and ranged between 2 and 3 (Figure 4B), indicating that these substrates are randomly rough and behave as self-affine fractal surfaces.26 There were investigations deeply revealing that self-affine nanostructured surfaces could impose critical effects on cellular responses including cell adhesion and proliferation.26,33 Moreover, C0 displayed microscale/submicron scale topography with submicron spacing on the surface. C8 exhibited densely nanotextured surface topography, whereas C16 presented microtextured topography with porous surface features. Most notably, C12 possessed highly biomimetic hierarchical micro-/nanotextured surface with homogeneous nanoscale spacing on it. Some investigators have reported that the clustering of a ligated integrins involved in the formation of focal adhesion requires a distance between two neighboring integrins to be smaller than 50–70 nm;34 thus, it is plausible to deduce that coatings with the smaller spacing on it, such as C8 and C12 in the current study, were conducive for cell attachment. Furthermore, in view of the fact that the ECM consists of a gradient of biofunctional micro-/nanostructures, C12 with hierarchical hybrid micro-/nanotopographical surface was expected to yield more biologically encouraging effects. The bulk of the investigations supported the idea that hierarchical micro-/nanostructured surface topography played a fundamental role in enhancing the biofunctionalities of the biomaterials.35
The surface wettability of biomaterials is hinged on surface features, such as surface chemistry and surface topography.36 In this study, the water contact angle results (Figure 4C) revealed that the surface hydrophilicity of the coatings increased in the following order: C0, C16, C8 and C12, suggesting that, with the incorporation of carbonate ions, the hydrophilicity of CHA coatings was largely enhanced relative to the HA coating and C12 surface was the most hydrophilic among all groups. A possible explanation for this tendency is as follows: on the one hand, the better hydrophilicity of C8–C16 than C0 could be attributed to the surface chemical factor deriving from the existence of hydrophilic hydroxyl (−OH) groups in the B-type substituted CHA in which the phosphate group is replaced (Figure 2B).9 On the other hand, compared with nanotextured C8 and microtextured C16, hierarchical micro-/nanotextured C12 displayed remarkably improved hydrophilicity, suggesting that topographical cues could also account for the hydrophilicity difference among the three CHA coatings (C8–C16). In other words, both chemical and topographical factors contributed to the discrepancies in wettability among the as-fabricated coatings. Meanwhile, a great number of studies reported that hydrophilic surfaces were prone to enhancing the sequential biological activities including early stages of cell adhesion, proliferation, differentiation, and bone mineralization compared with hydrophobic surfaces.37
The protein adsorption capacity of biomaterials depends on the protein property and surface topography as well as surface properties including wettability.4 The protein adsorption assay (Figure 4D) manifested that C8–C16 displayed evidently higher protein adsorption ability than C0, and C12 showed the best performance among the carbonated bioceramic coatings (C8–C16). Thus, the protein adsorption amount increased in the following order: C0, C16, C8 and C12, which shared a highly consistent trend with that of surface hydrophilicity evaluation among the groups (Figure 4C and D). The excellent protein adsorption capacity of the CHA coatings (C8–C16) could most likely be ascribed to the abovementioned surface hydrophilicity enhancement, which was consistent with previous findings.38 In addition, the hierarchical micro-/nanotopographical surface (C12) presented a remarkable amount of adsorbed protein, which could be attributed to the larger surface area provided by the hierarchical micro-/nanohybrid topography for more protein anchorage.21 It is widely accepted that initial cellular responses to material surface, such as attachment and/or spreading, are mediated by a layer of preadsorbed proteins on the surface of implant materials.39
The in vitro apatite-forming ability assay revealed that the CHA coatings (C8–C16) were favorable for crystalline apatite deposition in SBF, and C12 outperformed the remaining groups (Figure 5). Since the apatite-forming capacity is regarded as an important parameter to evaluate the surface reactivity and acellular bioactivity of medical biomaterials,40 the as-obtained CHA coatings (C8–C16) displayed excellent biological potential for clinical practice.
Overall, it is envisaged that the micro-/nanorod topography and increased hydrophilicity are likely to make major contributions to facilitate interfacial cellular functioning via the increase in protein adsorption on the surface, which tends to promote initial cell adhesion and eventually strengthens the biological responses of rBMSCs grown on the carbonate-modified bioceramic coating surfaces.37
Consequently, the cell attachment assay (Figure 6A and C) corroborated that the number of initially adherent rBMSCs on sample C8–C16 was much greater than those on C0 after seeding for 12 h and cells adhered on C12 markedly outnumbered those on the other three samples after 4 and 12 h of incubation. The spreading morphology observations (Figure 6B) demonstrated that the modified C8–C16 surfaces relative to C0, particularly the C12 surface with hierarchical micro-/nanorod topography, tended to elicit flat and even morphologies of rBMSCs. These results altogether manifested that carbonate-incorporated coatings with appropriate architectures positively altered the initial adhesion behavior of rBMSCs. Considering the parallel trend between adsorbed protein level and the morphological performance for all groups, it is plausible to assume that it is the enhancement of protein adsorption that facilitates the binding and clustering of integrins involved in the formation of focal adhesions, followed by the interaction between focal adhesions with cytoskeleton filaments, facilitating the spreading of the adherent cells grown on the material substrates.41
The CCK-8 assay (Figure 6D) demonstrated that C8–C16, especially C12, significantly promoted cell proliferation for almost the entire period, indicating that the differently CHA coatings displayed no apparent toxicity and excellent biocompatibility and allowed profoundly greater cell metabolism than the C0 surface. For C12, the hierarchical micro-/nanotopographical surface with a larger surface area could lead to increased cell quantity, which was likely to boost cellular metabolic activities.
Notably, various fractal properties of the four self-affine surfaces are postulated to directly affect cellular adhesion behaviors and proliferation activity. Cell adhesion and proliferation were maximized on C12 surface with the lowest fractal dimension among all surfaces, supporting the notion that lower surface fractal dimension enhanced cell adhesion status. Marino et al33 elucidated that rat mesenchymal stem cells on surfaces with high H exponent (equivalent to low fractal dimension) were able to develop mature focal adhesions and to polymerize actin in well-organized stress fibers which could potentially affect proliferation and differentiation of stem cells via integrin-mediated mechanically induced signaling pathways. Gentile et al26 revealed that engineered fractal silicon substrates selectively modulated cell behaviors. In this study, substrates with higher roughness (Ra~50 nm) and lower fractal dimension (Df~2.2), presenting more regular ridges, were conducive for stable establishment and maturation of focal adhesions. It is therefore legitimate to speculate that in this study, the decrement of fractal features decorated on C12 substrates may contribute to the attachment and spreading of stem cells via the reinforcement in the stabilization and maturation of focal adhesions as well as cytoskeleton conformation. Interestingly, Gentile et al also revealed that cell proliferation rate was maximized on surfaces with large fractal dimension (Df~2.4), where there was no significant difference in the protein adsorption ability among the substrates and fractal properties acted as the predominating factor. The conflicting finding concerning the effect of fractality on cell proliferation activity in the current study was possibly ascribed to the theory that the cell adhesion status enhanced by both superior surface protein adsorption capacity and surface fractal level played a more fundamental role in regulating cell proliferative metabolism on the rough surface than the topographical cues did.
The osteogenic capacity of rBMSCs cultured on all samples is shown in Figure 7. ALP staining and activity assay was adopted to detect the expression of ALP (an early marker for osteogenic differentiation), whereas ARS staining and quantitative study was used to evaluate the mineralization of the ECM. Moreover, the expression of OCN (a later marker of osteogenic differentiation) was scrutinized via fluorescence. For both the visual and quantitative study of ALP and ARS staining, C8–C16 displayed significantly enhanced rBMSC osteogenesis relative to C0, whereas C12 with hierarchical micro-/nanoscale surface features exhibited the most satisfying osteogenic property among C8–C16. In addition, the results of OCN expression level revealed a highly compatible trend with that of the staining tests. All the assays pertinent to the evaluation of osteogenic potential suggested that the modified coatings (C8–C16) significantly reinforced the osteogenic differentiation of rBMSCs incubated on them, and among the modified coatings, C12 with a hierarchical micro-/nanohybrid surface topography remarkably surpassed C8 with a nanostructured topographical surface and C16 with a microtextured surface in osteoinduction.
The results concerning the production of pro-angiogenic factor VEGF-A on various samples (as shown in Figure 8) indicated that VEGF-A secretion of rBMSCs was sensitive to the incorporation of carbonate ions into bioceramic coatings (C1–C3). Furthermore, through the prescribed culturing period, the gradiently (micro-/nanohybrid) structured surface of C12 potently stimulated higher VEGF-A production than the remaining groups, which was postulated to be a function of the biomimetic gradient micro-/nanohybrid surface topography and dominant surface hydrophilicity. Moreover, from day 4 to day 7, the C8 and C16 groups also exhibited elevated levels of VEGF-A secretion relative to the C0 group, which at least was partially due to the better wettability and subsequently enhanced cell proliferation on these surfaces, leading more cells to secret VEGF-A.
In the context of physiological microenvironment, rBMSCs and osteoblasts are encompassed by ECM with a 3D hierarchical architecture consisting of interwoven microscale collagen fibrils embedded with nanoscale apatite crystals and collagen fibers.42 Indeed, from a perspective of biomimicry, biomaterial surfaces possessing multiscale surface topography are more likely to generate conducive cell–substrate interaction to strengthen cellular functioning such as osteogenesis of mesenchymal stem cells (MSCs).21 Previous investigations concerning bioinspired implant materials have demonstrated that hierarchical hybrid micro-/nanotextured surfaces were able to concurrently facilitate osteoblast proliferation and differentiation and further accelerate bone–implant osseointegration relative to single-scale (micro-/nano-) topographic surfaces.43–45 Therefore, the hierarchically structural resemblance of the C12 surface to ECM may explain its overwhelming advantage in osteoinductivity over C8 and C16 with single-scale surface features.
Numerous studies have verified the close relationship between cell adhesion and osteogenic differentiation. The processes harnessing cell adhesion, including the binding of adhesion receptor integrins to the proteins in ECM or on material surface and the expression of focal adhesion and better f-actin arrangement accompanied by better cell spreading, can activate the downstream mechanotransduction, including osteogenic-related signaling pathways, thus steering the osteogenic differentiation of stem cells.46,47 This may also offer a legitimate explanation for the superior osteogenic differentiation capability of rBMSCs grown on C8–C16, especially for the cells cultured on C12 with a fully spread morphology.
Angiogenesis is an indispensable process for implants to attain clinically successful osseointegration with the host tissue. A previous study has shown that the combination of desirable surface topography and high surface energy on titanium substrates can enhance angiogenesis of osteoblasts concomitantly with osseointegration via an integrin-mediated signaling pathway.48 Typical of the synergistic modification of biomaterial surface properties of surface chemistry and topography, C12 with a hierarchical micro-/nanohybrid surface topography and favorable wettability indeed exhibited predominant adhesion morphology, indicative of good integrin-binding and related processes, suggesting that signaling events through integrins may regulate the production of pro-angiogenic growth factor VEGF, which is favorable for inducing the migration of endothelial cells and subsequent capillary formation from the ambient vasculature during healing. In addition, the cellular functions, including osteogenesis and angiogenesis, can be triggered on the basis of normal growth, which partly accounted for the phenomenon of the markedly increased level of VEGF-A yielded by rBMSCs on C12 and C16 from day 1 to day 4. Furthermore, it is worth mentioning that the secretion of angiogenic factors is associated with the status of osteogenic maturation of osteoblasts.49 This finding may also partially account for the observation that there was a slightly rising trend of VEGF-A production in rBMSCs for all groups from day 4 to day 7 when cell proliferation was supposed to slow down and osteogenic differentiation was about to dominate. To conclude, the angiogenesis potential of rBMSCs grown on CHA coatings was activated by surface properties as well as the upstream stimulated cellular responses.
Apart from surface topographical property, surface chemical factors stemming from the carbonation of HA could also contribute to the favorable biological effects of C8–C16 relative to C0. The carbonate ions released to the medium could serve as a trigger for crystal nucleation during mineral formation, which may explain for the better mineralization results for C8–C16 compared with C0 indicated by the ARS staining and activity (Figure 7B). Moreover, the B-type substitution of CHA in which  group is substituted by a less negatively charged group led to a decrease in surface charge density might alter the serum protein adsorption and thus the protein–cell interactions and cellular attachment.17 In addition, the XRD and FTIR (Figure 2A and B) results revealed that the crystallinity of all the CHA crystals decreased relative to pure HA crystals. It is well admitted that the poor crystallinity of CHA tended to increase its dissolution rate, resulting in excessive release of Ca2+ to the surrounding.50 Lazary et al51 reported that Ca2+ exerts positive impact on proliferation and ALP activity of osteoblasts. Since higher level of cytoplasm extension could strengthen ionic exchange activity on the cell membrane,52 it is reasonable to assume that proliferation and differentiation of the well-spread cells grown on the surfaces of CHA coatings (C8–C16) could be further promoted by excessive Ca2+ released from CHA dissolution.
To sum up, the results revealed that CHA coatings differed chemically and structurally depending on the original carbonate content, and the CHA coating with an initial carbonate content of 12 wt% possessed a hierarchical hybrid micro-/nanorod topography, excellent fractal property and superior hydrophilicity, which constituted major contributors to broadly enhance the biological functions of rBMSCs including adhesion, proliferation, osteogenic differentiation and angiogenic induction, giving rise to adequate peri-implant bone mass as well as bone maturation accompanied with neovascularization for optimal osseointegration. However, further investigation should be conducted to illuminate the mechanism involved in the improved biological performance of CHA bioceramic coatings, and in vivo studies should be performed to verify the potential for clinical application.
Conclusion
Highly CHA with carbonate contents of 8, 12 and 16 wt% and pure HA were fabricated by a novel hydrothermal method. Meanwhile, the as-obtained multiscale rod-like HA and CHA crystals were interwoven into the 3D-structured coatings on titanium substrates, exhibiting microscale/submicron scale, nanoscale, hierarchical hybrid micro-/nanoscale and microscale surface topographies for C0, C8, C12 and C16, respectively. Compared with C0, the micro-/nanotextured CHA bioceramic coatings (C8–C16) presented comparable surface reactivity, better wettability and improved protein adsorption level, which might simultaneously support a series of cellular responses including adhesion, proliferation, osteogenic differentiation and notably angiogenic induction. In particular, C12 with biomimetic hierarchical micro-/nanohybrid topography demonstrated superior fractal features, the best capacity in protein adsorption and the ensuing biological activities. Conclusively, these results suggest that the 12 wt% CHA bioceramic coating (C12) with synergistic modification of surface chemistry and topography has great potential for future use as implant coating to achieve optimum osseointegration for orthopedic and dental applications.
Acknowledgments
This work was supported by grants from the National Natural Science Foundation of China (No 81570948), Science and Technology Commission of Shanghai Municipality (No 17140903400) and the Medicine and Engineering Cross Research Foundation of Shanghai Jiao Tong University (No YG2017ZD06). The authors thank Xinglong Hu and Shengbing Yang for technical assistance.
Author contributions
Eryi Lu made substantial contributions to the conception and design of the study and the drafting of the manuscript. Li Yu and Guohua Zhang contributed substantially to the conception and design of the study. Shuang Li contributed to data acquisition and analysis and drafting of the manuscript. Weijun Yu contributed to data acquisition, analysis and interpretation for the study. Weiqi Zhang contributed to data acquisition and analysis of the study. All the authors contributed to the critical revision for important intellectual content of the study and approved the final version to be published. All the authors have agreed to be accountable for the accuracy and integrity of the study.
Disclosure
The authors report no conflicts of interest in this work.
References
Long M, Rack HJ. Titanium alloys in total joint replacement – a materials science perspective. Biomaterials. 1998;19(18):1621–1639. | ||
Amin Yavari S, van der Stok J, Chai YC, et al. Bone regeneration performance of surface-treated porous titanium. Biomaterials. 2014;35(24):6172–6181. | ||
Sul YT, Johansson C, Wennerberg A, Cho LR, Chang BS, Albrektsson T. Optimum surface properties of oxidized implants for reinforcement of osseointegration: surface chemistry, oxide thickness, porosity, roughness, and crystal structure. Int J Oral Maxillofac Implants. 2005;20(3):349–359. | ||
Skoog SA, Kumar G, Narayan RJ, Goering PL. Biological responses to immobilized microscale and nanoscale surface topographies. Pharmacol Ther. 2018;182:33–55. | ||
Ma XY, Feng YF, Ma ZS, et al. The promotion of osteointegration under diabetic conditions using chitosan/hydroxyapatite composite coating on porous titanium surfaces. Biomaterials. 2014;35(26):7259–7270. | ||
Graziani G, Bianchi M, Sassoni E, Russo A, Marcacci M. Ion-substituted calcium phosphate coatings deposited by plasma-assisted techniques: a review. Mater Sci Eng C Mater Biol Appl. 2017;74:219–229. | ||
Boanini E, Gazzano M, Bigi A. Ionic substitutions in calcium phosphates synthesized at low temperature. Acta Biomater. 2010;6(6):1882–1894. | ||
Rey C, Renugopalakrishnan V, Collins B, Glimcher MJ. Fourier transform infrared spectroscopic study of the carbonate ions in bone mineral during aging. Calcif Tissue Int. 1991;49(4):251–258. | ||
LeGeros RZ. Calcium phosphates in oral biology and medicine. Monogr Oral Sci. 1991;15:1–201. | ||
Rupani A, Hidalgo-Bastida LA, Rutten F, Dent A, Turner I, Cartmell S. Osteoblast activity on carbonated hydroxyapatite. J Biomed Mater Res A. 2012;100(4):1089–1096. | ||
Adams BR, Mostafa A, Schwartz Z, Boyan BD. Osteoblast response to nanocrystalline calcium hydroxyapatite depends on carbonate content. J Biomed Mater Res A. 2014;102(9):3237–3242. | ||
Borkowski L, Sroka-Bartnicka A, Draczkowski P, et al. The comparison study of bioactivity between composites containing synthetic non-substituted and carbonate-substituted hydroxyapatite. Mater Sci Eng C Mater Biol Appl. 2016;62:260–267. | ||
Kaneko H, Sasaki H, Honma S, et al. Influence of thin carbonate-containing apatite coating with molecular precursor method to zirconia on osteoblast-like cell response. Dent Mater J. 2014;33(1):39–47. | ||
de Souza ID, Cruz MA, de Faria AN, et al. Formation of carbonated hydroxyapatite films on metallic surfaces using dihexadecyl phosphate-LB film as template. Colloids Surf B Biointerfaces. 2014;118:31–40. | ||
Xiao W, Bal BS, Rahaman MN. Preparation of resorbable carbonate-substituted hollow hydroxyapatite microspheres and their evaluation in osseous defects in vivo. Mater Sci Eng C Mater Biol Appl. 2016;60:324–332. | ||
Calasans-Maia MD, Melo BR, Alves AT, et al. Cytocompatibility and biocompatibility of nanostructured carbonated hydroxyapatite spheres for bone repair. J Appl Oral Sci. 2015;23(6):599–608. | ||
Pieters IY, Van den Vreken NM, Declercq HA, Cornelissen MJ, Verbeeck RM. Carbonated apatites obtained by the hydrolysis of monetite: influence of carbonate content on adhesion and proliferation of MC3T3-E1 osteoblastic cells. Acta Biomater. 2010;6(4):1561–1568. | ||
Deligianni DD, Katsala ND, Koutsoukos PG, Missirlis YF. Effect of surface roughness of hydroxyapatite on human bone marrow cell adhesion, proliferation, differentiation and detachment strength. Biomaterials. 2001;22(1):87–96. | ||
Stevens MM, George JH. Exploring and engineering the cell surface interface. Science. 2005;310(5751):1135–1138. | ||
Zhang W, Li Z, Huang Q, et al. Effects of a hybrid micro/nanorod topography-modified titanium implant on adhesion and osteogenic differentiation in rat bone marrow mesenchymal stem cells. Int J Nanomedicine. 2013;8:257–265. | ||
Zhao L, Mei S, Chu PK, Zhang Y, Wu Z. The influence of hierarchical hybrid micro/nano-textured titanium surface with titania nanotubes on osteoblast functions. Biomaterials. 2010;31(19):5072–5082. | ||
Costa DO, Allo BA, Klassen R, Hutter JL, Dixon SJ, Rizkalla AS. Control of surface topography in biomimetic calcium phosphate coatings. Langmuir. 2012;28(8):3871–3880. | ||
Lin K, Wu C, Chang J. Advances in synthesis of calcium phosphate crystals with controlled size and shape. Acta Biomater. 2014;10(10):4071–4102. | ||
Ji X, Lou W, Wang Q, et al. Sol-gel-derived hydroxyapatite-carbon nanotube/titania coatings on titanium substrates. Int J Mol Sci. 2012;13(4):5242–5253. | ||
Geng Z, Wang R, Zhuo X, et al. Incorporation of silver and strontium in hydroxyapatite coating on titanium surface for enhanced antibacterial and biological properties. Mater Sci Eng C Mater Biol Appl. 2017;71:852–861. | ||
Gentile F, Medda R, Cheng L, et al. Selective modulation of cell response on engineered fractal silicon substrates. Sci Rep. 2013;3:1461. | ||
Lin K, Xia L, Gan J, et al. Tailoring the nanostructured surfaces of hydroxyapatite bioceramics to promote protein adsorption, osteoblast growth, and osteogenic differentiation. ACS Appl Mater Interfaces. 2013;5(16):8008–8017. | ||
Wen J, Lu T, Wang X, et al. In vitro and in vivo evaluation of silicate-coated polyetheretherketone fabricated by electron beam evaporation. ACS Appl Mater Interfaces. 2016;8(21):13197–13206. | ||
Li G, Cao H, Zhang W, et al. Enhanced osseointegration of hierarchical micro/nanotopographic titanium fabricated by microarc oxidation and electrochemical treatment. ACS Appl Mater Interfaces. 2016;8(6):3840–3852. | ||
Zhang W, Wray LS, Rnjak-Kovacina J, et al. Vascularization of hollow channel-modified porous silk scaffolds with endothelial cells for tissue regeneration. Biomaterials. 2015;56:68–77. | ||
Legeros RZ, Trautz OR, Legeros JP, Klein E, Shirra WP. Apatite crystallites: effects of carbonate on morphology. Science. 1967;155(3768):1409–1411. | ||
Liou SC, Chen SY, Lee HY, Bow JS. Structural characterization of nano-sized calcium deficient apatite powders. Biomaterials. 2004;25(2):189–196. | ||
Marino A, Desii A, Pellegrino M, et al. Nanostructured Brownian surfaces prepared through two-photon polymerization: investigation of stem cell response. ACS Nano. 2014;8(11):11869–11882. | ||
Zhou J, Li B, Han Y, Zhao L. The osteogenic capacity of biomimetic hierarchical micropore/nanorod-patterned Sr-HA coatings with different interrod spacings. Nanomedicine. 2016;12(5):1161–1173. | ||
Ding X, Zhou L, Wang J, et al. The effects of hierarchical micro/nanosurfaces decorated with TiO2 nanotubes on the bioactivity of titanium implants in vitro and in vivo. Int J Nanomedicine. 2015;10:6955–6973. | ||
Rupp F, Gittens RA, Scheideler L, et al. A review on the wettability of dental implant surfaces I: theoretical and experimental aspects. Acta Biomater. 2014;10(7):2894–2906. | ||
Lotz EM, Olivares-Navarrete R, Berner S, Boyan BD, Schwartz Z. Osteogenic response of human MSCs and osteoblasts to hydrophilic and hydrophobic nanostructured titanium implant surfaces. J Biomed Mater Res A. 2016;104(12):3137–3148. | ||
Takemoto S, Kusudo Y, Tsuru K, Hayakawa S, Osaka A, Takashima S. Selective protein adsorption and blood compatibility of hydroxy-carbonate apatites. J Biomed Mater Res A. 2004;69(3):544–551. | ||
Villarreal DR, Sogal A, Ong JL. Protein adsorption and osteoblast responses to different calcium phosphate surfaces. J Oral Implantol. 1998;24(2):67–73. | ||
Kokubo T, Takadama H. How useful is SBF in predicting in vivo bone bioactivity? Biomaterials. 2006;27(15):2907–2915. | ||
Biggs MJ, Richards RG, Dalby MJ. Nanotopographical modification: a regulator of cellular function through focal adhesions. Nanomedicine. 2010;6(5):619–633. | ||
Fisher OZ, Khademhosseini A, Langer R, Peppas NA. Bioinspired materials for controlling stem cell fate. Acc Chem Res. 2010;43(3):419–428. | ||
Gittens RA, Olivares-Navarrete R, Cheng A, et al. The roles of titanium surface micro/nanotopography and wettability on the differential response of human osteoblast lineage cells. Acta Biomater. 2013;9(4):6268–6277. | ||
Ueno T, Tsukimura N, Yamada M, Ogawa T. Enhanced bone-integration capability of alkali- and heat-treated nanopolymorphic titanium in micro-to-nanoscale hierarchy. Biomaterials. 2011;32(30):7297–7308. | ||
Kant K, Low SP, Marshal A, Shapter JG, Losic D. Nanopore gradients on porous aluminum oxide generated by nonuniform anodization of aluminum. ACS Appl Mater Interfaces. 2010;2(12):3447–3454. | ||
Guvendiren M, Burdick JA. The control of stem cell morphology and differentiation by hydrogel surface wrinkles. Biomaterials. 2010;31(25):6511–6518. | ||
Marino A, Filippeschi C, Genchi GG, Mattoli V, Mazzolai B, Ciofani G. The Osteoprint: a bioinspired two-photon polymerized 3-D structure for the enhancement of bone-like cell differentiation. Acta Biomater. 2014;10(10):4304–4313. | ||
Raines AL, Olivares-Navarrete R, Wieland M, Cochran DL, Schwartz Z, Boyan BD. Regulation of angiogenesis during osseointegration by titanium surface microstructure and energy. Biomaterials. 2010;31(18):4909–4917. | ||
Gittens RA, Olivares-Navarrete R, McLachlan T, et al. Differential responses of osteoblast lineage cells to nanotopographically-modified, microroughened titanium-aluminum-vanadium alloy surfaces. Biomaterials. 2012;33(35):8986–8994. | ||
Miyamoto Y, Toh T, Ishikawa K, Yuasa T, Nagayama M, Suzuki K. Effect of added NaHCO3 on the basic properties of apatite cement. J Biomed Mater Res. 2001;54(3):311–319. | ||
Lazary A, Balla B, Kosa JP, et al. Effect of gypsum on proliferation and differentiation of MC3T3-E1 mouse osteoblastic cells. Biomaterials. 2007;28(3):393–399. | ||
Salter DM, Robb JE, Wright MO. Electrophysiological responses of human bone cells to mechanical stimulation: evidence for specific integrin function in mechanotransduction. J Bone Miner Res. 1997;12(7):1133–1141. |
 © 2018 The Author(s). This work is published and licensed by Dove Medical Press Limited. The full terms of this license are available at https://www.dovepress.com/terms.php and incorporate the Creative Commons Attribution - Non Commercial (unported, v3.0) License.
By accessing the work you hereby accept the Terms. Non-commercial uses of the work are permitted without any further permission from Dove Medical Press Limited, provided the work is properly attributed. For permission for commercial use of this work, please see paragraphs 4.2 and 5 of our Terms.
© 2018 The Author(s). This work is published and licensed by Dove Medical Press Limited. The full terms of this license are available at https://www.dovepress.com/terms.php and incorporate the Creative Commons Attribution - Non Commercial (unported, v3.0) License.
By accessing the work you hereby accept the Terms. Non-commercial uses of the work are permitted without any further permission from Dove Medical Press Limited, provided the work is properly attributed. For permission for commercial use of this work, please see paragraphs 4.2 and 5 of our Terms.