")
Back to Journals » Patient Preference and Adherence » Volume 10
Evaluation of health care service quality in Poland with the use of SERVQUAL method at the specialist ambulatory health care center
Authors Manulik S, Rosinczuk J , Karniej P
Received 11 March 2016
Accepted for publication 6 May 2016
Published 2 August 2016 Volume 2016:10 Pages 1435—1442
DOI https://doi.org/10.2147/PPA.S108252
Checked for plagiarism Yes
Review by Single anonymous peer review
Peer reviewer comments 3
Editor who approved publication: Dr Johnny Chen
Stanisław Manulik,1 Joanna Rosińczuk,2 Piotr Karniej3
1Non-Public Health Care Institution, “Ambulatory of Cosmonauts” Ltd. Liability Company, 2Department of Nervous System Diseases, Faculty of Health Science, 3Department of Organization and Management, Faculty of Health Science, Wroclaw Medical University, Wroclaw, Poland
Introduction: Service quality and customer satisfaction are very important components of competitive advantage in the health care sector. The SERVQUAL method is widely used for assessing the quality expected by patients and the quality of actually provided services.
Objectives: The main purpose of this study was to determine if patients from state and private health care facilities differed in terms of their qualitative priorities and assessments of received services.
Materials and methods: The study included a total of 412 patients: 211 treated at a state facility and 201 treated at a private facility. Each of the respondents completed a 5-domain, 22-item SERVQUAL questionnaire. The actual quality of health care services in both types of facilities proved significantly lower than expected.
Results: All the patients gave the highest scores to the domains constituting the core aspects of health care services. The private facility respondents had the highest expectations with regard to equipment, and the state facility ones regarding contacts with the medical personnel.
Conclusion: Health care quality management should be oriented toward comprehensive optimization in all domains, rather than only within the domain identified as the qualitative priority for patients of a given facility.
Keywords: health care service quality, patients’ expectations, qualitative priorities, outpatient health care facilities
Introduction
The need to establish quality standards for services and findings of studies focused on this process have led to the creation of various models illustrating the dynamic relationships between quality factors. The models constituted a basis for developing a service quality (SQ) assessment method for evaluating both the potential and the outcome of the process. The method is used to identify high-quality factors and measure customer satisfaction. They are also crucial to the process of quality improvement, thus allowing the identification of any “weak points”. Standard management tools commonly used in quality management include flowcharts, brainstorming, the Pareto Chart, the Eisenhower Box, analysis of punishment and reward, critical incident techniques, importance–performance analysis, and quantitative methods.1–3
Quality management is an approach in which quality takes precedence over other issues and is treated as a priority.4 For this reason, synthetic methods, such as gap models (including the SERVQUAL model), are important in creating and assuring quality in services.
The gap model was developed by Parasuraman et al5 by means of empirical studies using statistical formulas. This approach made it possible to distinguish five gaps and the factors that affect them. The model identifies gaps in service delivery and its perception by the consumer, which results in the customer assessing the level of service as low quality.2,6
The increasingly common gap model provides for practical identification of shortcomings in SQ and indicates corrective actions to improve them. The derivative of the gap model is the SERVQUAL model. In 1985, Parasuraman et al5 attempted to determine the essential criteria underlying expectations of service recipients and evaluate the degree of expectation fulfillment through the delivered service. The researchers conducted 12 focus groups for the project, three for each group from the following areas: retail banking, credit cards, futures exchange, and repair and maintenance services.7 The results of this study formed the basis for the SERVQUAL model used for quality measures. This model measures gaps between customers’ expectations of SQ and perceptions of the service they receive.
The quality of service, perceived subjectively, plays an increasingly important role as an element of competitive advantage in the health sector. Findings of numerous studies are consistent. One of the most commonly used comprehensive methods of assessing expected and perceived SQ is the SERVQUAL model, which is becoming more and more popular as a tool used to evaluate quality offered by health facilities.
Introducing market mechanisms into the health sector meant that financial results have become one of the functional priorities for public institutions that aim at winning a contract with the National Health Fund, which is in turn conditioned by the demand for service. At the same time, in the continually expanding private health care sector, customers’ satisfaction and loyalty are key competitive advantages.
In the light of these considerations, it was decided to measure the level of customers’ expectations of SQ and perceptions of the service they received in public and private health institutions, using the SERVQUAL model.
Objectives
The principal purpose of this study was to identify and evaluate the quality of services provided and expected by patients on the basis of direct surveys. It was assumed that patients of a health facility that operates as an autonomous public health facility (public; in the presentation of the study results referred to as “facility A”) and health facility enterprises (nonpublic; in the presentation of the study results referred to as “facility B”) differ in terms of their quality priorities and assessment of the quality of services rendered to patients. It was also assumed that patients of a health facility enterprise would have higher expectations about quality described by all of the five SERVQUAL instrument dimensions and would rate the quality of the services offered to them more highly in all the dimensions. Furthermore, based on the available literature, it was anticipated that, irrespective of the dimension or type of facility, quality perceptions would be noticeably lower than expectations.
Materials and methods
The respondents
The research conducted in the years 2013–2015 included a total of 412 patients referred to allergy clinics. Participation in the study was voluntary and one of the inclusion criteria was the patient’s consent to take part in it. Physical inability and cognitive functions were set as the exclusion criteria. The respondents included 211 patients receiving care at public facilities (facility A) and 201 patients receiving care at private facilities (facility B). Table 1 presents more information about the respondents.
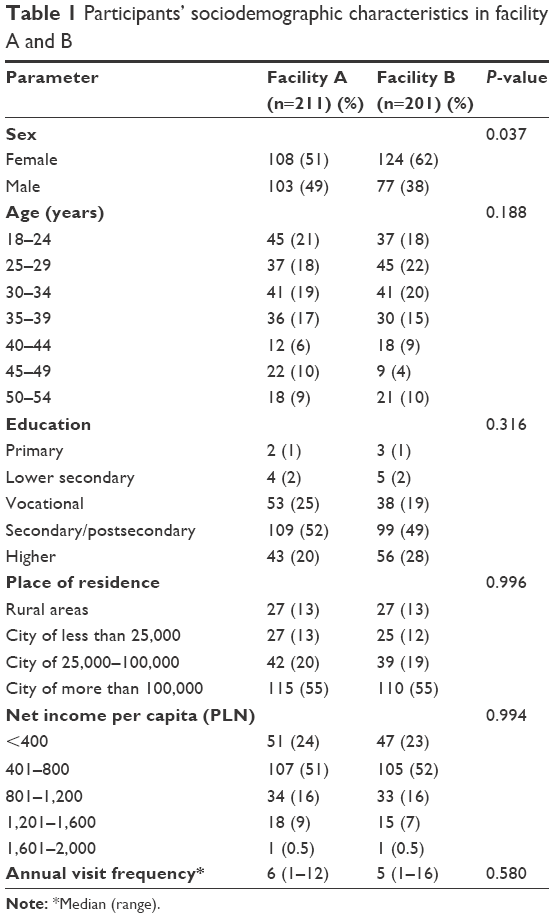 | Table 1 Participants’ sociodemographic characteristics in facility A and B |
The respondents were asked, after they had given their informed consents and had been instructed by the hospital staff as to how to approach the task, to fill in the SERVQUAL questionnaire and then place it into a specially designed box. Those patients who during the study period used the services offered by the facility more than once completed the questionnaire only during their first visit. The Bioethics Board of Wroclaw Medical University approved the study protocol (No KB-751/2011).
Institutions’ specification
As a public facility model, used was a health facility that was not an enterprise, operated as an autonomous public health facility and had a legal personality (public; in the presentation of the study results: “facility A”). The principal goal of the institution was to provide health services falling within primary or specialist health care in the form of outpatient or inpatient services, prophylaxis, health promotion, as well as performance of teaching, scientific, and research tasks.
As a nonpublic facility model, used was a health facility enterprise with a legal personality (nonpublic; in the presentation of the study results: “facility B”). The entity was an employee-owned company company (limited liability company, LLC). The goal of the health facility enterprise was to provide outpatient health services in the area of activities aimed at saving, restoring or improving health, and other medical activities related to the treatment process or special regulations governing the principles of their performance.
Quality measurements
The study was conducted in the context of the SERVQUAL five dimensions subdivided into 22 perception-oriented questions (items) measured using a 5-point Likert-type scale. The level of expectations and perceptions of SQ was measured by calculating scores assigned to all five dimensions: 1) tangibility (appearance of physical facilities, equipment, personnel); 2) reliability (ability to perform the promised service accurately and dependably); 3) responsiveness (willingness to provide prompt service and ability to help customers); 4) assurance (knowledge and courtesy of employees, their ability to establish confidence and to convey trust); and 5) empathy (caring, individualized attention the firm provides to its customers).
In the first part of the study, the respondents declared their expectations of SQ regarding these five items, and in the second part, the level of perceived performance.7 Each response was scored on a 1–5 scale, where 1 meant “completely disagree” and 5 meant “completely agree”. The following formula was used to calculate service expectation fulfillment in all five dimensions (overall SQ):
SQ = Comparison of expectation (E) with performance (P), SQ = P–E | (1) |
Negative scores in SQ index indicate recipient dissatisfaction, and positive scores – recipient excessive satisfaction.7–9
Statistical analysis
The Shapiro–Wilk test was used to test the assumption that the variables were normally distributed. Since none of the variables were normally distributed, their statistical characteristics were summarized using median, lower, and upper quartile values, and extreme values (ranges). The Mann–Whitney U-test was used to compare differences between groups. Statistical characteristics of discrete and qualitative variables were presented as number and percentage distributions; Pearson’s chi-square test or Fisher’s exact test were used for their comparisons. Spearman rank-order correlation coefficient (ρ) was used to measure the strength and direction of a relationship between the two variables. All calculations were performed using Statistica 10 software (StatSoft Polska, Dell Inc., Tulsa, OK, USA) and the level of significance was set at P≤0.05.
Results
Respondents’ expectations as to quality of medical services
The statistical characteristics of the respondents’ expectations, expressed as ratings given to individual SERVQUAL dimensions, are presented in Table 2. Customers of facility A and B differed significantly in their ratings given to individual dimensions (P<0.001). An exception to this was the dimension “tangibles”, where customers of facility A and facility B did not differ statistically significantly as regards ratings given to individual statements (P=0.817). Furthermore, customers of facility A gave much higher ratings to all the dimensions than respondents of facility B.
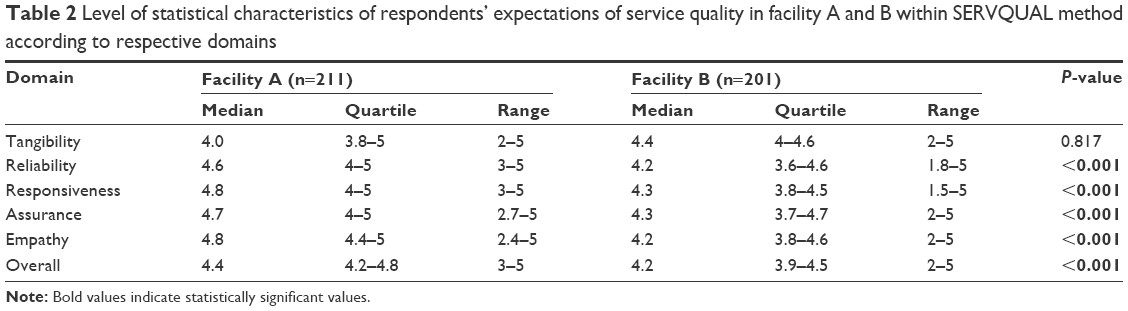 | Table 2 Level of statistical characteristics of respondents’ expectations of service quality in facility A and B within SERVQUAL method according to respective domains |
Respondents’ ratings regarding the quality of actually provided medical services
The statistical characteristics of the respondents’ perceptions, expressed as ratings assigned to individual SERVQUAL dimensions, are presented in Table 3. Customers of facility A and facility B differed significantly in terms of ratings given to all the instrument’s dimensions (P<0.001). The smallest differences of statistical significance were observed in the case of the dimension “responsiveness” (P=0.026). Additionally, customers of facility A gave much lower ratings to all the dimensions, apart from the dimension “assurance”, which they rated more highly.
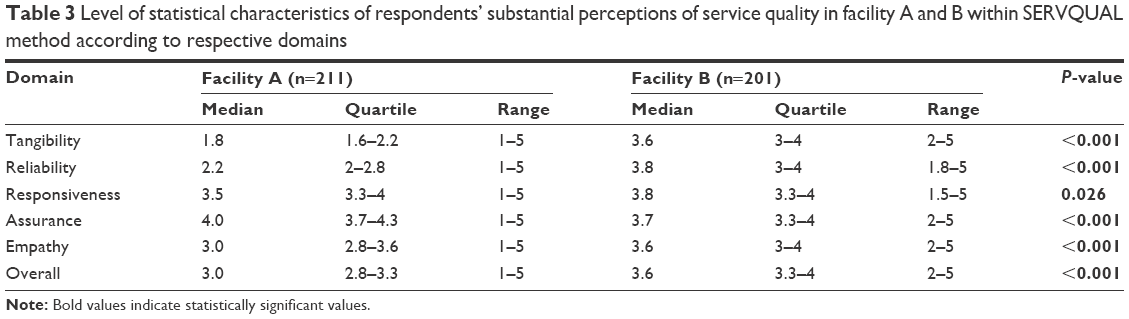 | Table 3 Level of statistical characteristics of respondents’ substantial perceptions of service quality in facility A and B within SERVQUAL method according to respective domains |
Differences between expectations and perceptions in the surveyed groups
The statistical characteristics of the differences between the respondents’ expectations and perceptions, expressed as ratings assigned to individual SERVQUAL dimensions, are presented in Table 4. Customers of facility A and facility B differed significantly in terms of ratings given to all of the instrument’s dimensions (P<0.001). An exception to this was the dimension “assurance”, where customers of facility A and facility B did not differ significantly as regards ratings given to individual statements (P=0.241). Furthermore, in the case of customers of facility A, the difference between expectations and perceptions to the disadvantage of the latter in all the dimensions except for “assurance” was significantly bigger than in the case of respondents of facility B.
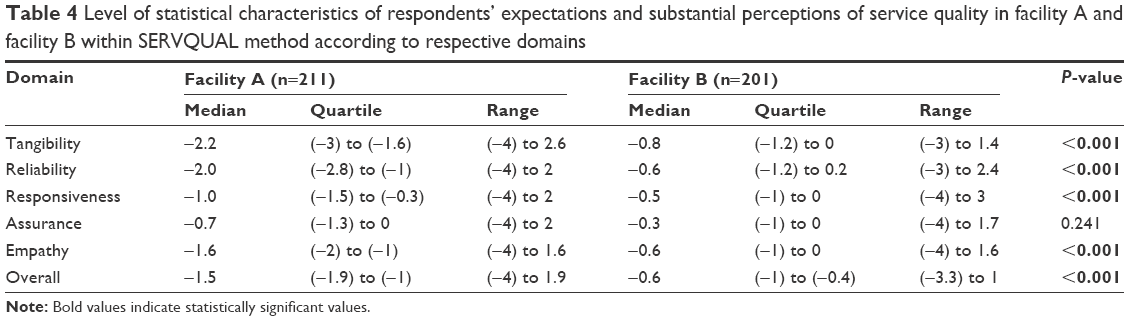 | Table 4 Level of statistical characteristics of respondents’ expectations and substantial perceptions of service quality in facility A and facility B within SERVQUAL method according to respective domains |
Figure 1 shows a summary of characteristics of gaps between respondents’ expectations and perceptions of SQ among public and private facilities. It has to be clarified that the groups shared sociodemographic characteristics except for sex distribution. Females outnumbered males in groups of patients receiving care in private facilities (facility B).
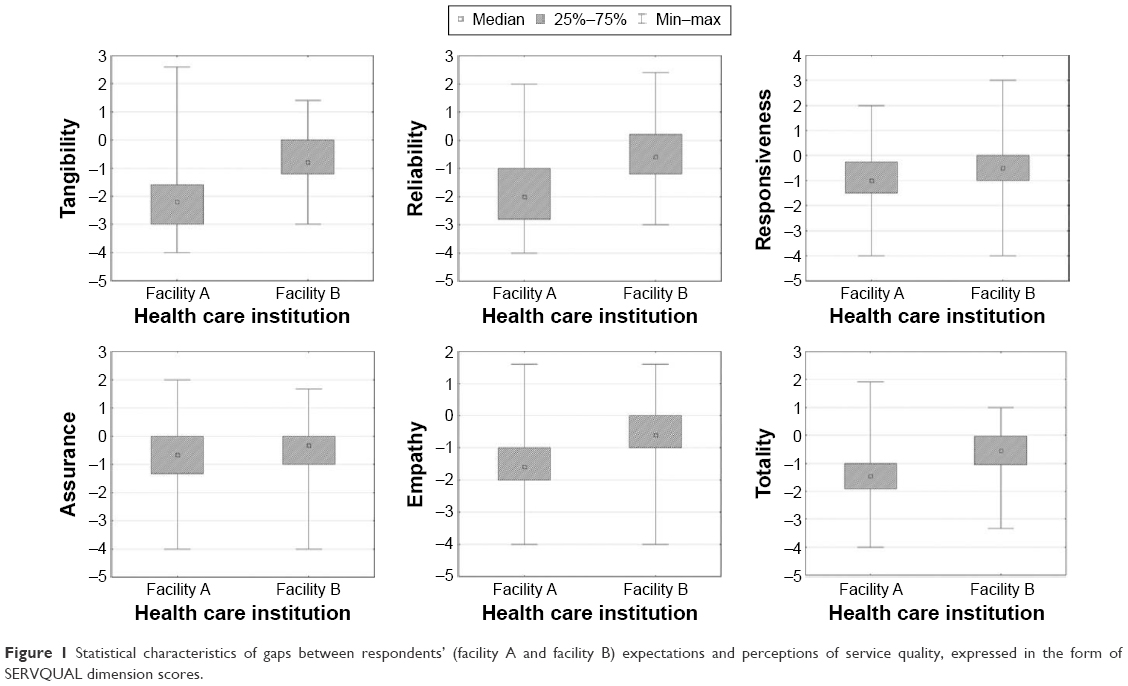 | Figure 1 Statistical characteristics of gaps between respondents’ (facility A and facility B) expectations and perceptions of service quality, expressed in the form of SERVQUAL dimension scores. |
Discussion
The main purpose of the study was to compare the quality of services offered by a public health facility (facility A) and a nonpublic health facility (facility B), subjectively assessed by their patients. The analysis took account of the expected quality level in individual SERVQUAL questionnaire dimensions and the quality of services actually provided in the dimensions. Based on such data, the discrepancy between the respondents’ expectations and perceptions as to quality in individual dimensions was determined. It was assumed that the actual quality provided to customers of a nonpublic facility would be superior, because, as opposed to a public facility, it should regard the parameter as an element of its competitive advantage. The hypothesis has been proven empirically. The health facility enterprise’s customers rated the actual quality of services provided to them in all of the SERVQUAL questionnaire dimensions, apart from “assurance”, considerably higher than patients of facility A. Save for “assurance”, the gap between the nonpublic facility patients’ expectations and perceptions was substantially smaller than in the case of the public facility patients. The higher quality ratings in the dimension “assurance” given by the public facility patients seem to predominantly result from the fact that it concerns such subjective issues as developing patients’ trust and providing them with a sense of security.9,10
It should be borne in mind that facility A, whose patients participated in the survey, is an academic institution, which in itself might have suggested a higher competence of its staff, and so another component of “assurance” in the SERVQUAL model. When commencing the study, it was assumed that not only would the nonpublic facility customers rate the quality actually provided to them higher, but that their expectations in this respect would be significantly higher than those of patients of facility A. The possibility of such a distribution of expectations was indicated by the findings of the previous SERVQUAL studies.11
Interestingly enough, the hypothesis has not been confirmed empirically. It was customers of facility A who proved to have noticeably higher expectations as to quality in all of the SERVQUAL model dimensions, except for “tangibles”. Perhaps this surprising observation was a result of the previously mentioned fact that the study involved a public academic institution, and its customers – especially those who made use of its services for the first time – might have had relatively high expectations as to quality. None of the previous SERVQUAL studies involved a direct comparison of the quality of services rendered by public and nonpublic health facilities, so it is difficult to determine whether the higher expectations of customers of facility A in this respect constitute a universal tendency or reflect the effects of the interfering factor referred to earlier, or of any other (unidentified) factors.
Both this study and the earlier analyses carried out using the SERVQUAL model11–19 unambiguously confirm that the quality expectations concerning the services rendered by health facilities are much higher than quality perceptions. The relationship has been confirmed in many countries in regard to both public13,14,16–18,20 and nonpublic institutions,12,13,19,21 and at both outpatient13,17,18 and inpatient facilities.14–16,20,22
Interestingly, the results of a majority of the earlier studies indicate a characteristic distribution of priorities of patients of public and nonpublic facilities with respect to expectations and perceptions. Public facility customers who have participated in an overwhelming majority of the previous studies had significantly lower expectations with respect to the facility’s infrastructure, which is the main subject of the dimension “tangibles”.11 They paid more attention to their relations with the medical staff, described by “empathy” in the SERVQUAL instrument,22 while nonpublic facility patients usually treated them as any other service organization and paid much attention to the first impression, including infrastructure, and less attention to personal relations.20
The above differences usually manifested themselves in the size of the gap between the expected and actual quality provided. With regard to nonpublic facility customers, it was usually the biggest in the case of “empathy” and the smallest in the case of “tangibles”. Such a relationship was found, for instance, in a study involving 272 patients treated at a hospital in Korea,15 685 outpatients of 12 middle-sized hospitals in Taiwan,18 and 195 patients with chronic renal failure undergoing dialysis at four public facilities in Iran.11 In turn, the biggest gap between expectations and perceptions in the case of nonpublic facility customers was usually observed in “tangibles”, and the smallest one in “empathy”. Such relations in patients’ priorities have been noticed by, for instance, Zarei et al19 who used the SERVQUAL 983 instrument to randomly survey selected patients of eight nonpublic hospitals in Iran. In all of the above-described studies, the patients’ high expectations about quality in specific dimensions were not matched by their perceptions.
The above characteristic distribution of quality priorities of patients of public or nonpublic facilities is not, however, a universal phenomenon. This has been proven, for instance, by Mohd Suki et al23 who used the SERVQUAL instrument to survey 191 patients of three Malaysian nonpublic health facilities. As opposed to the previously mentioned studies involving customers of nonpublic facilities, the biggest gap between quality expectations and perceptions was found in the case of “empathy” and the smallest one in the case of “tangibles”.23
The profile of the quality priorities of patients of a health facility that is not an enterprise (facility A) and a health facility enterprise (facility B) participating in this study was similar to that described in the earlier studies. The respondents treated at facility A showed the highest expectations about quality described in the dimension “empathy” of the SERVQUAL instrument, and the lowest ones for “tangibles”. In turn, customers of facility B had the biggest expectations with regard to “tangibles” and the smallest ones with regard to “empathy” and “reliability”.
The role of the last two components as significant determinants of quality provided by nonpublic facilities was pointed out earlier by other authors, for instance those of a study involving patients of nonpublic outpatient clinics in South Korea24 and Turkey,25 as well as inpatient and outpatient institutions in India.26
It is worth noting that in the case of neither facilities participating in this study, the highest ratings were given to the dimensions in which the highest expectations had been held, that is, “empathy” for facility A and “tangibles” for facility B. Furthermore, in the case of both public and nonpublic health facilities, the lowest ratings for perceived quality were given in the dimension “tangibles”. While the relationship for facility A was consistent with the respondents’ expectations; for facility B, a noticeable discrepancy between the expectations and perceptions was recorded. In the case of both facility A and facility B, the smallest gap between the expected and perceived quality was observed for the dimension “assurance” and the biggest one for “tangibles”. The above observations indicate that irrespective of their sources of finance, Polish health facilities do not satisfy their patients’ expectations concerning quality in areas of high priority to them. This suggests that the Polish health care system, both public and nonpublic, is still at a very early stage of market development, during which added value is of little importance.
As mentioned earlier, when interpreting data obtained by using the SERVQUAL model, one should not overlook the fact that quality in individual dimensions should be considered as a system of interconnected elements.27 Thus, a shortage in one of the dimensions, of special importance to a customer, will most probably result in a lowering of ratings in the other dimensions. For instance, the lack of an appropriate approach of medical staff toward patients, which constitutes the essence of quality in “empathy”, can counteract a public facility’s good image built by the employment of experienced doctors (high ratings in “assurance”). On the other hand, hiring highly regarded staff or reducing waiting times for a visit (reflected in high ratings in “assurance” and “reliability”) will most probably not counterbalance the lack of an appropriate infrastructure expected by customers of a nonpublic facility (low ratings in “tangibles”). This regularity has been confirmed by the findings of a number of earlier studies, in which it was proven that quality in the SERVQUAL model dimension with the biggest gap between the customers’ expectations and perceptions had an adverse effect on ratings given to other dimensions.23
The above data show that the relationships between patient characteristics and patients’ priorities concerning quality of health services are extremely complex. For none of the factors covered by this study were its findings fully consistent with the data presented in the literature. Also a comparison of the results of the earlier studies did not lead to an unambiguous identification of any sociodemographic factors that would determine patients’ expectations concerning quality in the area of health services. This is partly due to the considerable diversity (already mentioned a few times earlier) of the examined studies in terms of the cultural context (eg, the social role of females, the physician’s authority), economic context (eg, social classes), and legal context (eg, the system of financing health services).
Furthermore, as has also been pointed out earlier, certain data (eg, those concerning the financial status) may have been withheld by the respondents or subject to reporting errors. Besides, it should be borne in mind that all the studies referred to earlier, including minor ones, regarded sick people, and, unquestionably, the clinical variables have an impact on quality expectations and perceptions. Several studies have shown that perceptions improve together with a sick person’s subjective state of health.19,28,29 Undoubtedly, quality expectations are also affected by subjective indicators of the state of health and the type of the disease entity. One can hardly expect a seriously ill person, or one who may be fatally ill, to attach as much significance to SQ as a patient who reports for a scheduled operation, the effect of which is mainly cosmetic. Consequently, clinical variables should definitely be regarded as an important factor interfering with the findings of both this and any successive studies.
The above deliberations lead to a question about the advisability of taking the above variables into account when managing quality at a health facility. It seems that an answer to this question should principally be negative. Apart from few exceptions (like gynecological or geriatric clinics), health facilities, both public and health facility enterprises, have patients representing a whole spectrum of sociodemographic characteristics. Thus, taking account of the higher quality priorities of any of the groups identified on the basis of such variables would be difficult logistically. Furthermore, such a patient segmentation within one facility or a facility network would be unethical. Finally, as has already been mentioned earlier, patients visiting a facility for the first time can hardly be expected to complete complex questionnaires on the basis of which they would be assigned to a specific group of quality priorities.
What are the practical implications resulting from this study and a review of the literature? First, irrespective of the type of facility (public vs nonpublic), patients’ expectations and perceptions of the quality of services provided by a facility should be monitored regularly. Both this study and the literature indicate the existence of significant gaps between expected and perceived quality. Although the fundamental quality priority of customers of nonpublic facilities is their medical equipment and buildings in which they are located, and that of customers of public facilities good relations with the staff members and their friendliness, one should not concentrate on any single dimension, but rather strive for an across-the-board improvement. This follows from the fact that the literature indicates that a significant gap between expectations and perceptions in one dimension may have an adverse effect on ratings given in other dimensions, foiling the expenditures incurred on their improvement. The findings of this study show that long-term management should also focus on the other quality indicators. Furthermore, it has been proven that a sine qua non condition is not a significant capital investment into equipment or premises. It seems that comparable results regarding quality perception by customers and their loyalty may be achieved by investing into staff training in the area of interpersonal communication, or by creating systems that would motivate staff members to change their attitude to patients.
Conclusion
Both at public and nonpublic health facilities, patients’ expectations of SQ differ substantially from their perceptions to the disadvantage of the latter. The highest rating for both facilities was given to quality in the dimensions that do not constitute a competitive advantage, but are the core element of health services. Nonpublic facility customers have the highest expectations concerning quality in respect of equipment and infrastructure, while public facility customers have the highest expectations in respect of relations with medical staff. Management of quality at a health facility should focus on its optimization in all the dimensions, and not only in one identified as the priority for customers of a given facility. Low-cost actions that bring about an improvement in quality in one of the dimensions (eg, “empathy”) may boost perceptions of quality provided in other dimensions, including more capital-intensive ones (eg, “tangibles”). The monitoring of customers’ quality perceptions and expectations, for example, by means of the SERVQUAL instrument, should be a permanent element of the marketing activities performed at a health facility.
Acknowledgment
We hereby acknowledge that this study received no specific grant from any funding agency within the public, commercial, or not-for-profit sectors.
Disclosure
The authors report no conflicts of interest in this work.
References
Dahlgaard J, Kristensen K, Kanji G. Fundamentals of Quality Management. Warsaw, Poland: Polish Scientific Publishers PWN; 2000. | ||
Garczarczyk J. The Quality of Banking and Insurance Services. Poznan, Poland: Poznan Economic Academy Publisher; 2000. | ||
Pukas A. Methods of testing the quality of services. In: Styś A, editor. Marketing Services. Warsaw, Poland: Polish Economic Publishers Inc; 2003:93–95. | ||
Buchacz T, Rogala P. Quality management – an outlook for the future. Qual Probl. 2004;36(2):5–8. | ||
Parasuraman A, Zeithaml V, Berry L. A conceptual model of service quality and its Implication for future research. J Mark. 1985;49:41–50. | ||
Griffin R. Fundamentals of Organizational Management. Warsaw, Poland: Polish Scientific Publishers PWN; 1998. | ||
Mazur J. Marketing Management Services. Warsaw, Poland: Difin Inc; 2002. | ||
Lovelock CH, Wright L. Principles of Service Marketing and Management. Upper Saddle River, NJ: Prentice Hall; 1999. | ||
Parasuraman A. Measuring and monitoring service quality. In: Glynn W, Barnes J, editors. Understanding Services Management. Chichester: Wiley and Sons Publisher; 1995:146–147. | ||
Parasuraman A, Zeithaml V, Berry L. SERVQUAL: A multiple-item scale for measuring consumer perceptions of service quality. J Retail. 1988;64(1):12–40. | ||
Bahadori M, Raadabadi M, Heidari Jamebozorgi M, Salesi M, Ravangard R. Measuring the quality of provided services for patients with chronic kidney disease. Nephrourol Mon. 2014;6(5):e21810. | ||
Camilleri D, O’Callaghan M. Comparing public and private hospital care service quality. Int J Health Care Qual Assur. 1998;11(4–5):127–133. | ||
Karydis A, Komboli-Kodovazeniti M, Hatzigeorgiou D, Panis V. Expectations and perceptions of Greek patients regarding the quality of dental health care. Int J Qual Health Care. 2001;13(5):409–416. | ||
Andaleeb SS, Siddiqui N, Khandakar S. Patient satisfaction with health services in Bangladesh. Health Policy Plan. 2007;22(4):263–273. | ||
Lee MA, Yom Y-H. A comparative study of patients’ and nurses’ perceptions of the quality of nursing services, satisfaction and intent to revisit the hospital: a questionnaire survey. Int J Nurs Stud. 2007;44(4):545–555. | ||
Bakar C, Akgün HS, Al Assaf AF. The role of expectations in patient assessments of hospital care: an example from a university hospital network, Turkey. Int J Health Care Qual Assur. 2008;21(4):343–355. | ||
Chin LY, Amir LH. Survey of patient satisfaction with the breastfeeding education and support services of The Royal Women’s Hospital, Melbourne. BMC Health Serv Res. 2008;8:83. | ||
Huang Y-Y, Li S-J. Understanding quality perception gaps among executives, frontline employees, and patients: the outpatient services in Taiwan hospitals. Qual Manag Health Care. 2010;19(2):173–184. | ||
Zarei A, Arab M, Froushani AR, Rashidian A, Tabatabaei SMG. Service quality of private hospitals: the Iranian patients’ perspective. BMC Health Serv Res. 2012;12(1):31. | ||
Lin D-J, Sheu I-C, Pai J-Y, et al. Measuring patient’s expectation and the perception of quality in LASIK services. Health Qual Life Outcomes. 2009;7:63. | ||
Butt MM, Run EC de. Private healthcare quality: applying a SERVQUAL model. Int J Health Care Qual Assur. 2010;23(7):658–673. | ||
Lin D-J, Li Y-H, Pai J-Y, et al. Chronic kidney-disease screening service quality: questionnaire survey research evidence from Taichung city. BMC Health Serv Res. 2009;9(1):239. | ||
Mohd Suki N, Chwee Lian JC, Suki NM. A comparison of human elements and nonhuman elements in private health care settings: customers’ perceptions and expectations. J Hosp Mark Public Relat. 2009;19(2):113–128. | ||
Choi Y-K, Nam C-W, Lee J-H, Park Y-H. The effects of taping prior to PNF treatment on lower extremity proprioception of hemiplegic patients. J Phys Ther Sci. 2013;25(9):1119–1122. | ||
Taner T, Antony J. Comparing public and private hospital care service quality in Turkey. Int J Health Care Qual Assur Inc Leadersh Health Serv. 2006;19(2–3):i–x. | ||
Narang R. Measuring perceived quality of measuring quality health care services in India. Int J Health Care Qual Assur. 2010;23(2):171–186. | ||
Suki NM, Lian JCC, Suki NM. Do patients’ perceptions exceed their expectations in private healthcare settings? Int J Health Care Qual Assur. 2011;24(1):42–56. | ||
Da Costa D, Clarke AE, Dobkin PL, et al. The relationship between health status, social support and satisfaction with medical care among patients with systemic lupus erythematosus. Int J Qual Health Care. 1999;11(3):201–207. | ||
Rahmqvist M. Patient satisfaction in relation to age, health status and other background factors: a model for comparisons of care units. Int J Qual Health Care. 2001;13(5):385–390. |
 © 2016 The Author(s). This work is published and licensed by Dove Medical Press Limited. The full terms of this license are available at https://www.dovepress.com/terms.php and incorporate the Creative Commons Attribution - Non Commercial (unported, v3.0) License.
By accessing the work you hereby accept the Terms. Non-commercial uses of the work are permitted without any further permission from Dove Medical Press Limited, provided the work is properly attributed. For permission for commercial use of this work, please see paragraphs 4.2 and 5 of our Terms.
© 2016 The Author(s). This work is published and licensed by Dove Medical Press Limited. The full terms of this license are available at https://www.dovepress.com/terms.php and incorporate the Creative Commons Attribution - Non Commercial (unported, v3.0) License.
By accessing the work you hereby accept the Terms. Non-commercial uses of the work are permitted without any further permission from Dove Medical Press Limited, provided the work is properly attributed. For permission for commercial use of this work, please see paragraphs 4.2 and 5 of our Terms.