")
Back to Journals » Diabetes, Metabolic Syndrome and Obesity » Volume 14
Evaluation of Eight Anthropometric Indices for Identification of Metabolic Syndrome in Adults with Diabetes
Authors Guo X, Ding Q, Liang M
Received 23 December 2020
Accepted for publication 3 March 2021
Published 30 March 2021 Volume 2021:14 Pages 1431—1443
DOI https://doi.org/10.2147/DMSO.S294244
Checked for plagiarism Yes
Review by Single anonymous peer review
Peer reviewer comments 2
Editor who approved publication: Prof. Dr. Juei-Tang Cheng
Xintong Guo,1 Qinpei Ding,1 Min Liang2
1Guangxi Medical University, Nanning, Guangxi Province, People’s Republic of China; 2Department of Endocrinology, The First Affiliated Hospital of Guangxi Medical University, Nanning, Guangxi Province, People’s Republic of China
Correspondence: Min Liang
Department of Endocrinology, The First Affiliated Hospital of Guangxi Medical University, Nanning, Guangxi, People’s Republic of China
Tel +138-7883-8907
Email [email protected]
Purpose: Several previous reports have highlighted the association between adiposity and risk of metabolic syndrome (MetS). Although it is necessary to identify which adiposity indices are best suited to identify MetS, no such study has been completed in diabetic patients. The aim of this study was to evaluate the ability of eight anthropometric indices to identify MetS in diabetic, middle-aged and elderly Chinese patients.
Patients and Methods: A cross-sectional study was conducted in 906 type 2 diabetic patients in Guangxi.
Results: The highest odds ratios for the identification of MetS were identified with CUN-BAE (OR = 28.306). The largest areas under the curve (AUCs) were observed for WHtR and BRI in men aged 40– 59; CUN-BAE in men aged 60 and over; WHtR, BRI, and TyG in women aged 40– 59; and BMI for women aged 60 and over. The weakest indicator for the screening of MetS in type 2 diabetes was the ABSI.
Conclusion: The most effective anthropometric indicator for the identification of MetS varied across sex and age subgroups.
Keywords: metabolic syndrome, anthropometric indices, diabetes
Introduction
Diabetes is a long-standing global health issue that increases the risk of cardiovascular complications, an important cause of death in patients with diabetes. Metabolic syndrome (MetS) is defined as the accumulation of cardiovascular risk factors such as dyslipidemia, abnormal glycemia, elevated blood pressure, and abdominal obesity. With an increasing incidence, MetS heightens the risk of cardiovascular diseases (CVDs) in type 2 diabetes.1–3 Early diagnosis is crucial to allow for appropriate actions to combat MetS.
Obesity is an important risk factor in the occurrence and development of several diseases,4 such as type 2 diabetes,5 MetS,6,7 CVDs,8,9 and numerous tumors.10 It is also at the core of MetS. Although some previous publications have addressed the association between adiposity and the risk of MetS, some unambiguity remains as to which obesity index is best used to diagnose MetS.11 BMI is reported to be the most commonly used index to evaluate obesity;12 Waist to height ratio (WHtR) is reported to be a good predictor of MetS in childhood;13 And several novel adiposity indices have been constructed recently for screening MetS, including: body roundness index (BRI),14 a body shape index (ABSI),15,16 conicity index (CI), Clínica Universidad de Navarra-body adiposity estimator (CUN-BAE),17–20 triponderal mass index (TMI), and triglyceride-glucose (TyG) index.21–24
The relationships between classic and novel adiposity indices has not been studied in diabetic patients. Moreover, there is no consensus regarding which index is the best for identifying diabetic subjects with MetS. To our knowledge, only one previous study has been conducted in China in which the relationship between BRI and MetS was analyzed in type 2 diabetes using a small group of 585 patients.25 The aim of this study was to analyze the predictive capacity of new anthropometric indices, such as the ABSI, BRI, CI, TMI, TyG, and CUN-BAE, for identifying MetS in middle-aged patients with diabetes in China. We also aimed to compare the usefulness of these new indices to that of traditional measurements such as BMI and WHtR.
Patients and Methods
Subjects
From January 2018 to December 2019, 2032 middle-aged and elderly diabetic subjects aged 40–90 years (mean 59.87 ± 8.83) were recruited in this study. Participants were from the First Affiliated Hospital of Guangxi Medical University. All the participants were of Han ethnicity and came from Southeast China. Exclusion criteria were as follows: (1) patients with infection; (2) severe CVDs, heart failure, liver cirrhosis, cancer, thyroid dysfunction, significant liver or renal impairments; (3) type 1 diabetes; (4) diabetic lactic acidosis, diabetic ketoacidosis, hyperglycemic hyperosmotic, severe fluid and electrolyte imbalance, diabetic foot, and severe diabetic nephropathy, diabetic cardio-cerebrovascular disease. Ultimately, 906 subjects (379 women and 527 men) were included. The study was approved by the Ethics Committee of the First Affiliated Hospital of Guangxi Medical University, and this study obeyed the principles of Helsinki Declaration. All subjects provided informed consent before study initiation.
Calculation of Anthropometric Indices and Adiposity Index
BMI, WHtR, CI, TyG,26 CUN-BAE,27 TMI,28 ABSI17 and BRI14 were calculated with the following formulas:
BMI=weight(kg)/height2 (m2);
WHtR = WC (cm)/ height (cm);
CI = 0.109−1WC (m)[Weight (kg)/Height (m)]−1/2;
ABSI = WC(m)/ BMI2/3(kg/m) × height1/2;
BRI = 364.2 − 365.5[1 − π−2WC2 (m) Height−2 (m)]1/2;
TMI = Weight (kg)/ Height3(m).
CUN-BAE
This index was recommended by Gomez-Ambrosi27 to estimate body fat with the following formula: −44.988 + (0.503 × age) + (10.689 × gender) + (3.172 × BMI) − (0.026 × BMI2) + (0.181 × BMI × gender) − (0.02 BMI × age) − (0.005 × BMI2 × gender) + (0.00021 × BMI2 × age) where age was in years, and gender was coded as zero for males and one for females.
TyG
The TyG index was calculated with the following formula Ln[fasting triglycerides (mg/dL) × fasting glucose (mg/dL)/2].26
Definition of Metabolic Syndrome
MetS was defined as per the Chinese Diabetes Society. Participants had to accord with any three or more of five factors: 1) WC ≥90 cm (males) and 85 cm (females), 2) FPG ≥6.1 mmol/L or 2-hour PG levels ≥7.8 mmol/L after a 75-goral glucose-tolerance test or have been diagnosed with diabetes, 3) blood pressure ≥130/85 mmHg or had been diagnosed with hypertension, 4) TG ≥1.7 mmol/L, and 5) HDL-c <1.04 mmol/L.
Data Collection
The homeostasis model assessment of insulin resistance (HOMA-IR) index was obtained by the program HOMA Calculator v2.2.2.29 The smoking status and alcohol drinking were obtained from hospitalizations. Two options (yes\no) were used for smoking and drinking (no means never smoking/drinking, yes means current or former smoking/drinking). The participants who smoked cigarettes or drunk during the study were classified as current smokers or drinkers, and those who had not smoked or drunk for 6 months were classified as former smokers or drinkers.
Anthropometric Measures and Blood Pressure
Anthropometric measurements were performed following standardized procedures by well-trained nurses and physicians. Height and weight were measured in light clothing without shoes, using a digital scale with a precision of 1 cm and 1kg. WC was measured using a tape measure placed halfway between the lower border of the ribs and the iliac crest in a horizontal plane at the end of normal expiration and measured to the nearest 1 cm.
After 10 minutes of rest, systolic and diastolic blood pressure were measured for 2 times from the right and left arm of the participants in the seated position, using a manometer (Reister) cuff and stethoscope (Reister). The average of Systolic and diastolic blood pressure was calculated for the statistical analysis.
Biochemical Factors
Total cholesterol (TC), Triglyceride (TG), total cholesterol (TC), high-density lipoprotein cholesterol (HDL-c), low-density lipoprotein cholesterol (LDL-c), fasting glucose, C peptide, glycosylated hemoglobin (HbA1C) was originated from hospitalizations. After 8–12 hours of fasting, blood samples were collected from the ante-brachial vein. These biochemical indices were measured by professional laboratory scientific officers of the First Affiliated Hospital of Guangxi Medical University.
Statistical Analysis
Continuous variables followed a normal distribution and are expressed as mean ± standard deviation (SD). Discrete variables are expressed as percentage and frequency. Comparisons between different subgroups were analyzed using one-way analysis of variance (ANOVA) tests for normally distributed continuous variables. Mann–Whitney U-tests were used for highly skewed variables. All categorical variables are presented as numbers and proportions. Chi-square and Fisher’s exact tests were calculated for analysis of proportion. The Spearman correlation coefficient was used to measure the correlation. Quartiles of BMI, WHtR, TMI, CI, BRI, ABSI, TyG, and CUN-BAE were calculated. Logistic regression models adjusted for sex and age were applied to estimate the odds ratio. The lowest quartiles were set as reference. Receiver operating characteristic (ROC) analyses were used to assess the feasibility of the eight obesity indices to predict MetS. Statistical analyses were completed using SPSS software (version 23.0 for windows; SPSS, Chicago, IL, USA). The ROC analysis was performed using MedCalc version 12.0 for Windows (MedCalc Software, Mariakerke, Belgium). P values less than 0.05 were considered statistically significant.
Results
Characteristics of the Study Subjects
Baseline characteristics of study participants were stratified by biological sex and are presented in Table 1, which shows the anthropometric measurements and biochemical parameters of the recruited diabetic patients. The average age of the participants was 59.88 ± 8.33 years for men and 55.54 ± 5.35 years for women. The average BMI was 24.58 in the subject group. Of the total participants, 35.4% were overweight (BMI = 25.0–29.9 kg/m2), 7.6% were obese (BMI ≥ 30.0 kg/m2), and 68.9% had detectable MetS (Table 2).
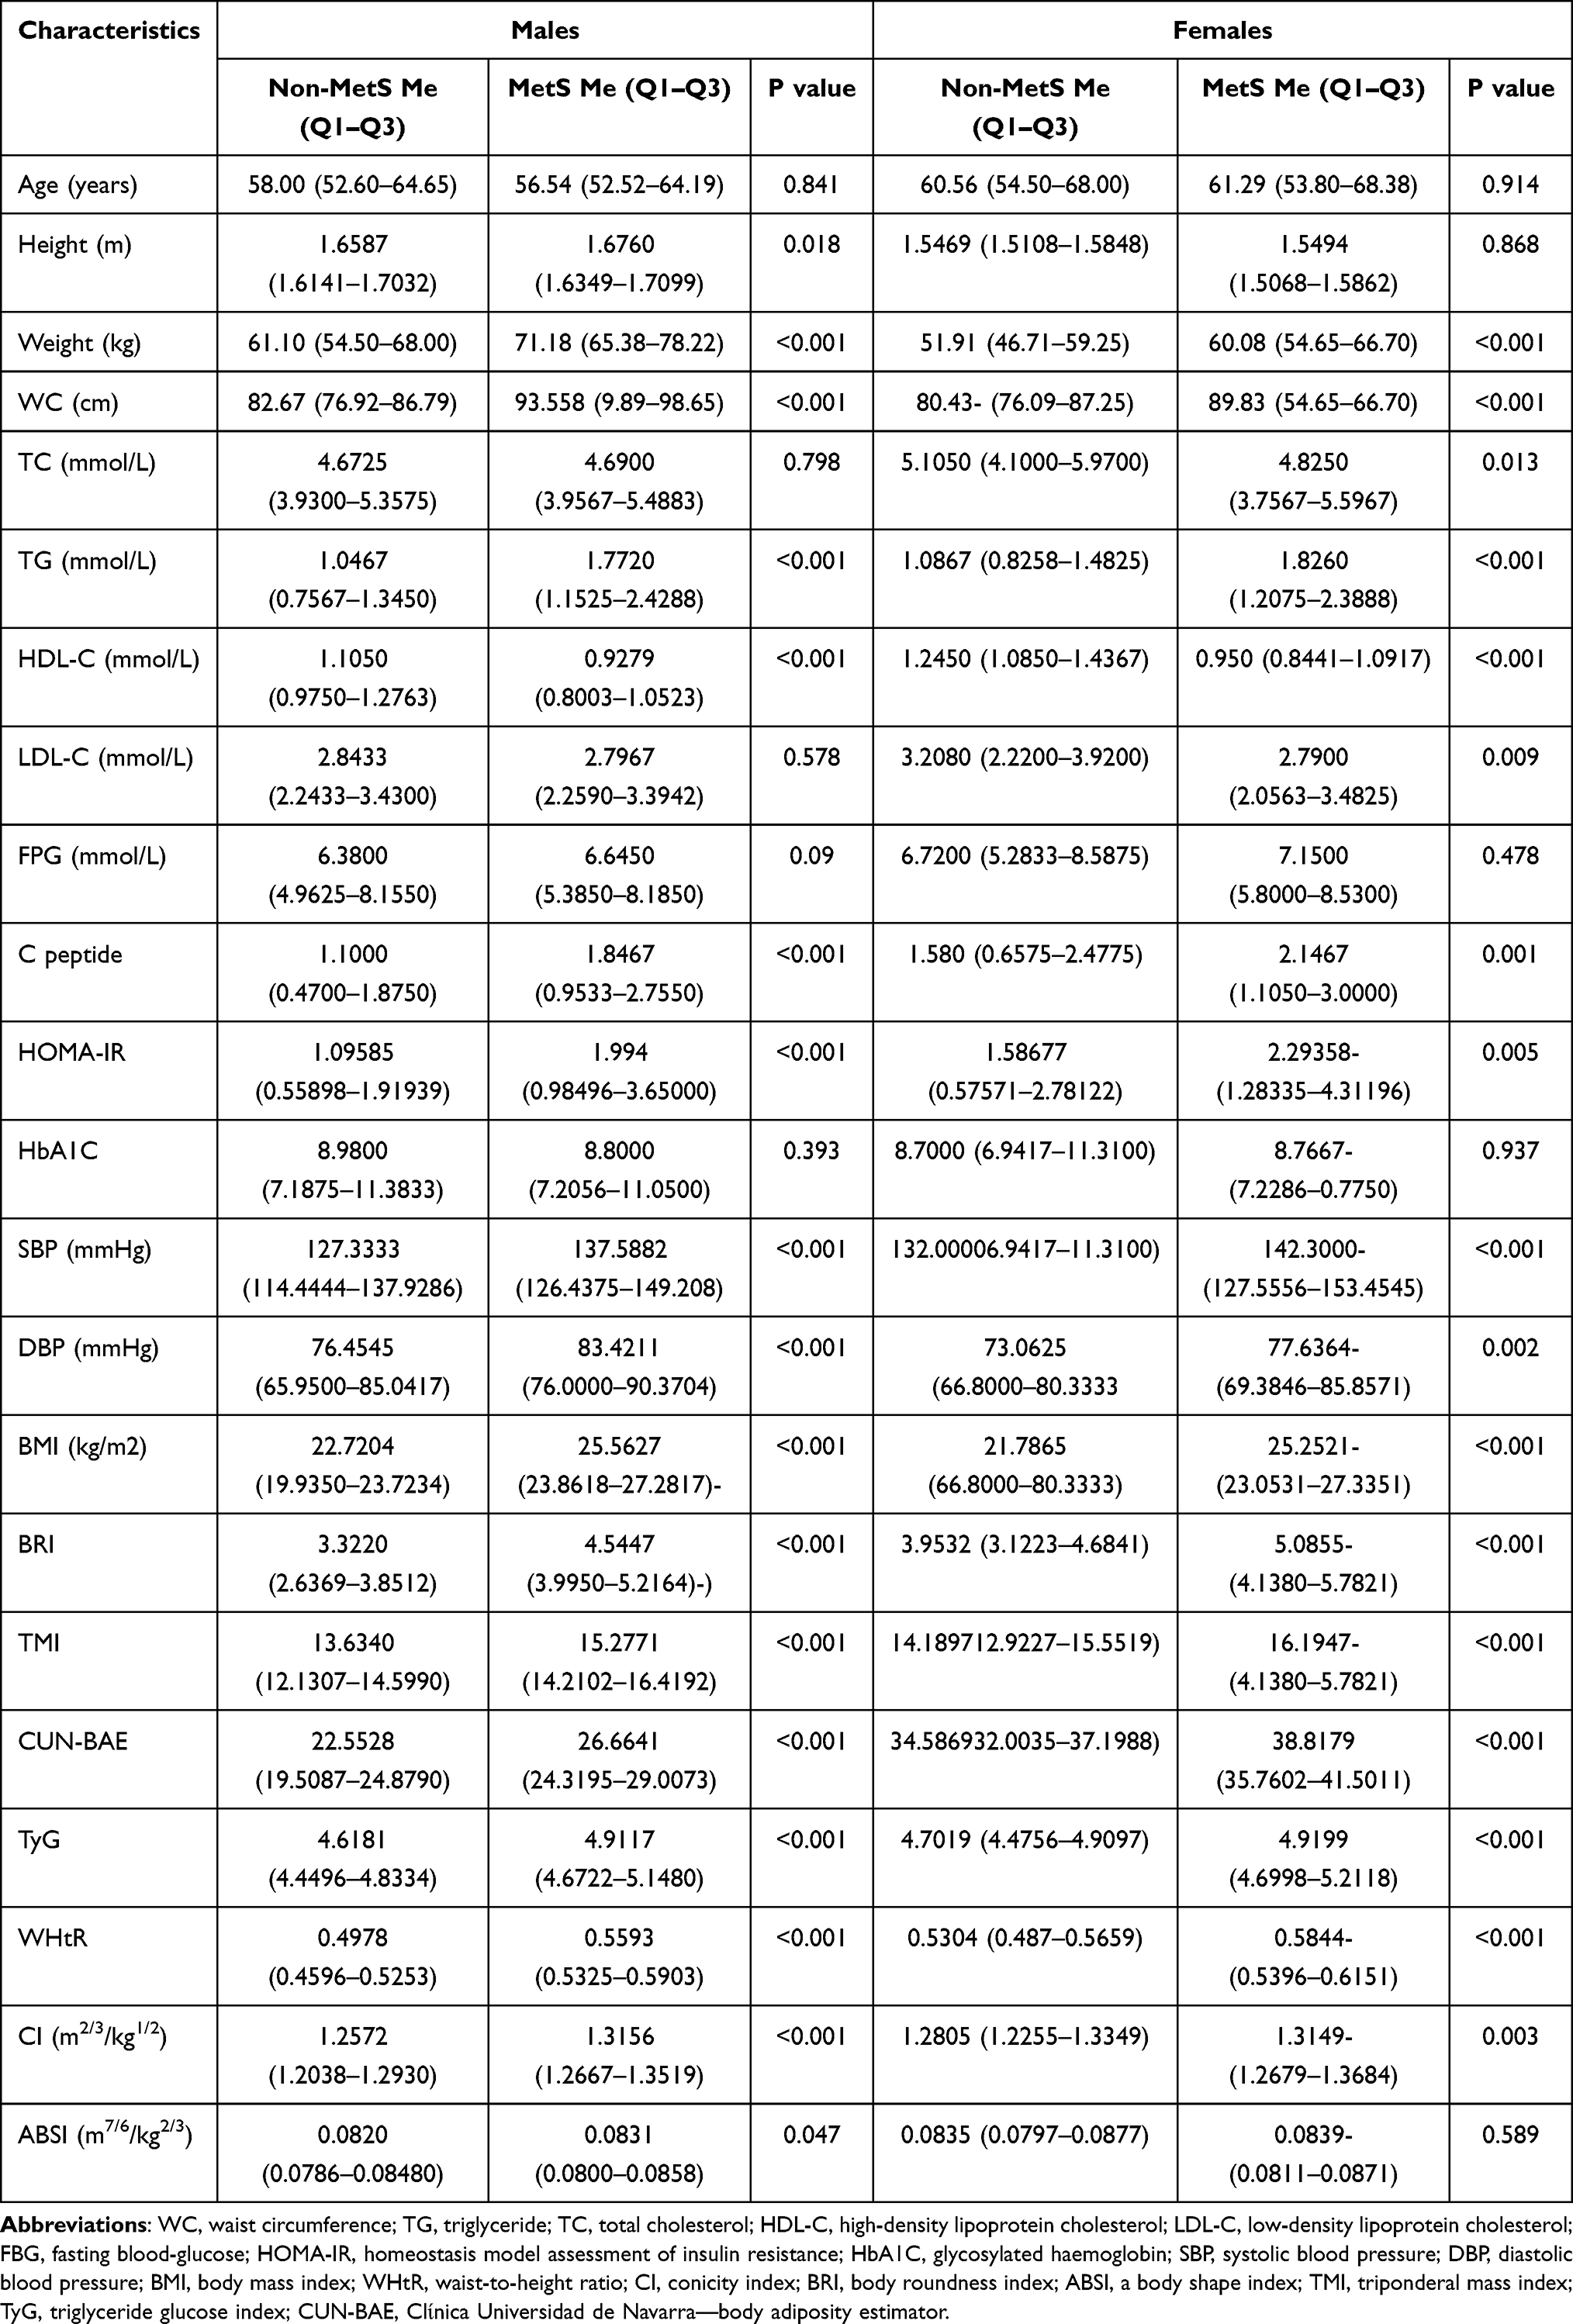 |
Table 1 Baseline Characteristics of the Study Population Stratified by Gender |
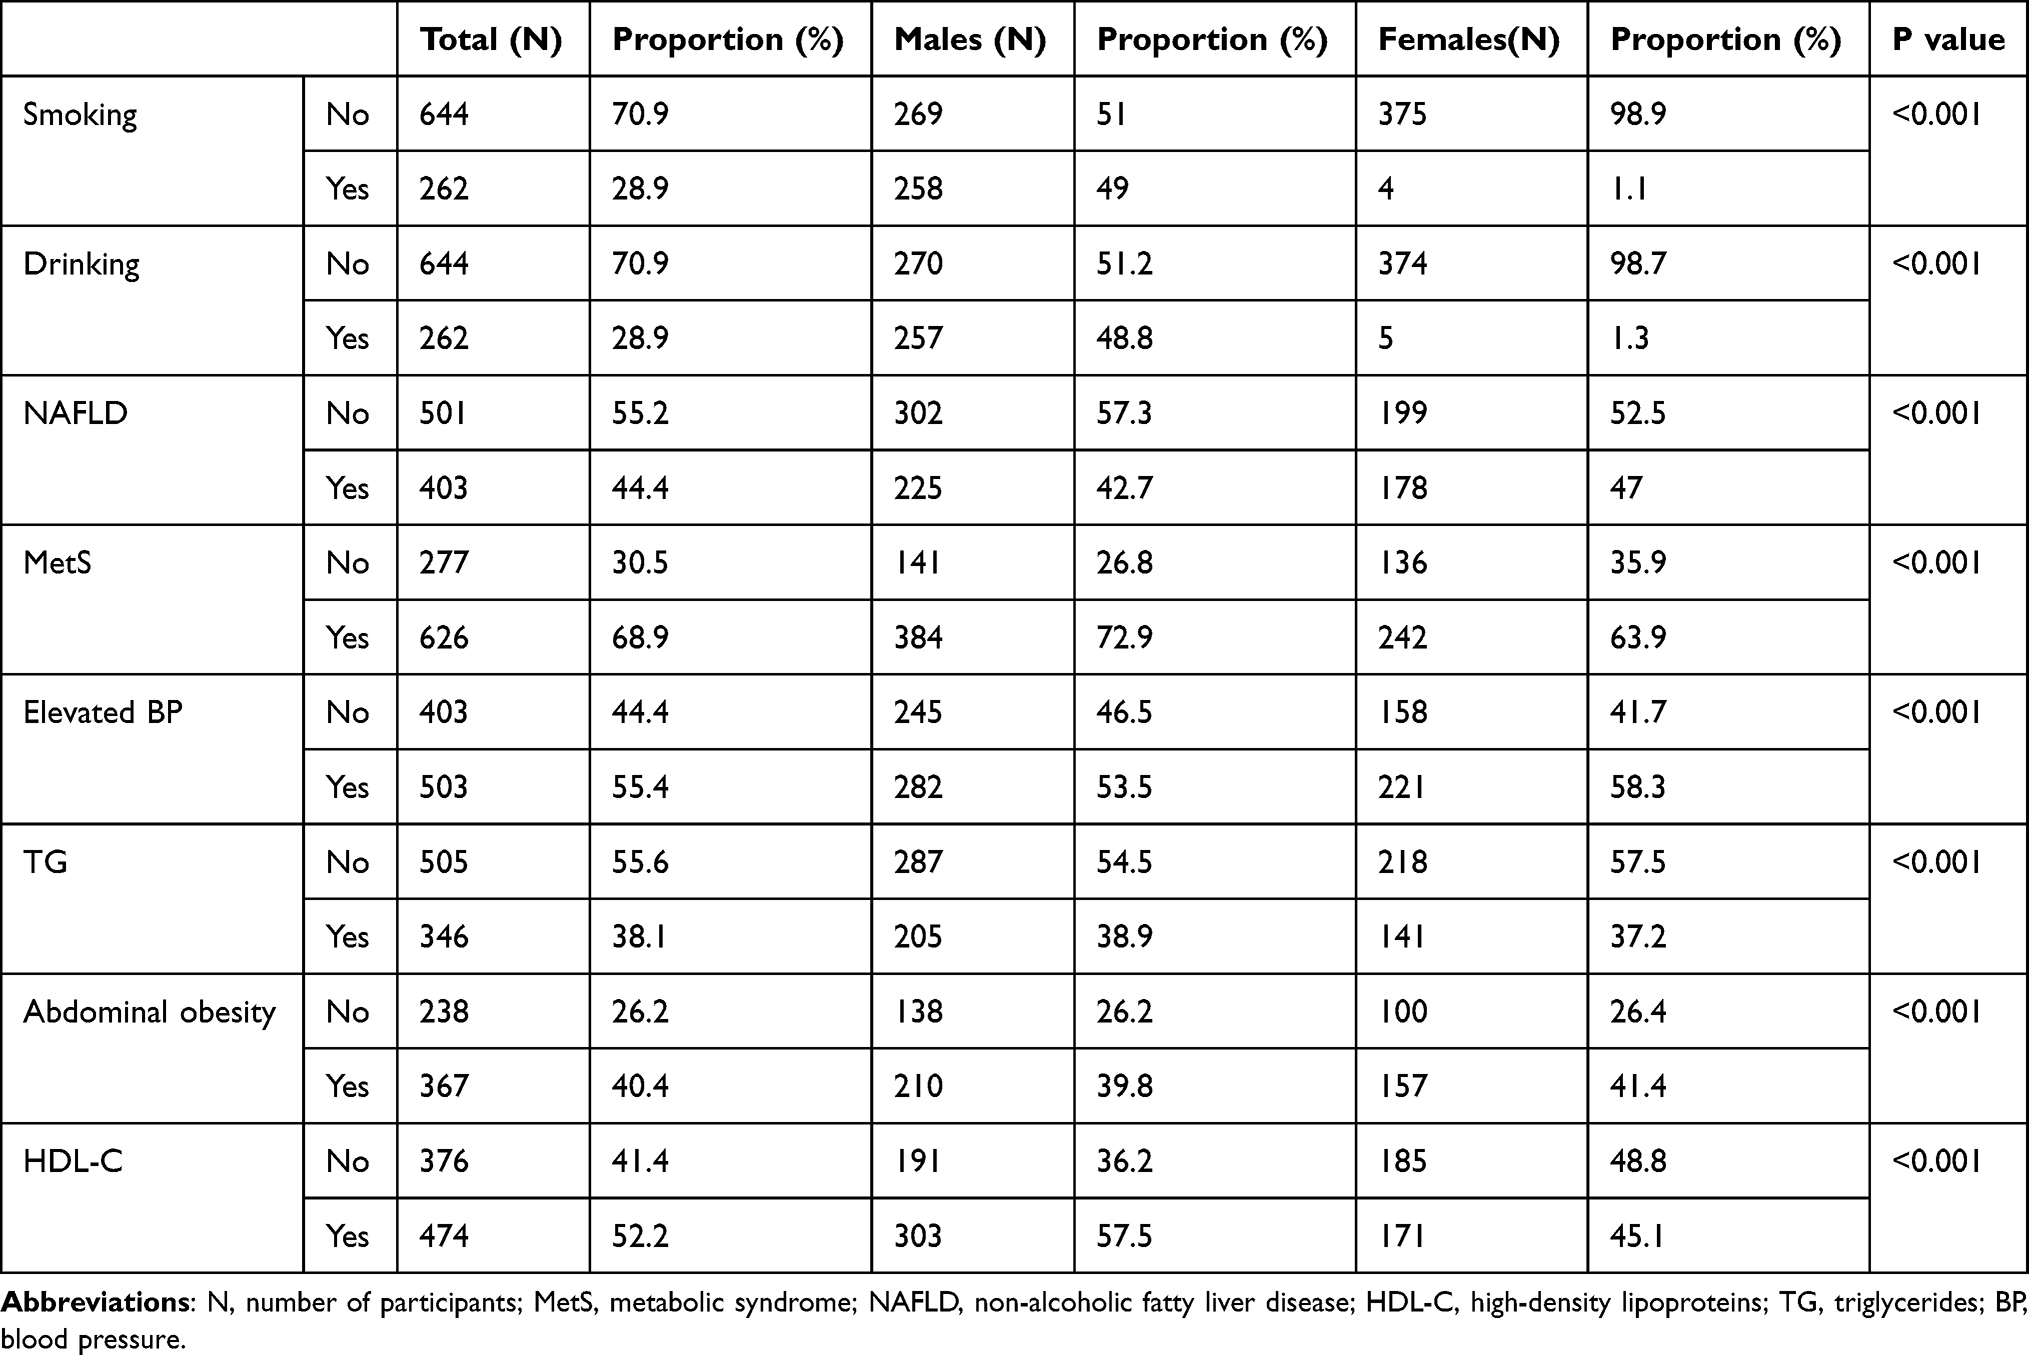 |
Table 2 Components of Metabolic Syndrome, NAFLD and Lifestyle Habits in the Subject Groups |
For anthropometric indices, BMI, WHtR, ABSI, BRI, CI, CUN-BAE, TMI, and TyG were higher in patients with MetS than those without MetS (all P < 0.05). Participants with MetS were more likely to have a history of hypertension and nonalcoholic fatty liver disease (NAFLD) compared to those without MetS (P < 0.001). Diabetic patients with MetS had higher systolic and diastolic blood pressure (SBP and DBP), mass, WC, and triglyceride (TG) levels, and lower high-density lipoprotein cholesterol (HDL-c) compared to those without MetS (all P < 0.05). No differences were observed for fasting plasma glucose (FPG), age, or C-peptide in participants with and without MetS, across both sexes (all P > 0.05). Diabetic patients with MetS had higher low-density lipoprotein cholesterol (LDL-c) and insulin resistance (IR) compared to those without MetS, and total cholesterol (TC) was lower in women.
Correlations of Different Adiposity Indices and MetS Components
For all subjects, BMI was most strongly correlated with TMI in all subjects (r = 0.953 males; r = 0.966 females; Figure 1). CUN-BAE was most strongly correlated with BMI in males (r = 0.955; P < 0.001), whereas TMI was most strongly correlated with BMI in females (r = 0.966; P < 0.001). WHtR and BRI were strongly correlated with one another in both sex groups (r = 1; P < 0.001). ABSI and CI were also strongly correlated (r = 0.898; r = 0.911). BMI showed the strongest correlation with CUN-BAE in both sexes (r = 0.955 males; r = 0.949 females). TMI was most strongly correlated with mass in females (r = 0.772), and with WC in males (r = 0.757). Variables that correlate with mass also correlate with WC. IR and fasting C-peptide were most frequently correlated with all anthropometric indices, except for indicators concluded in the formula.
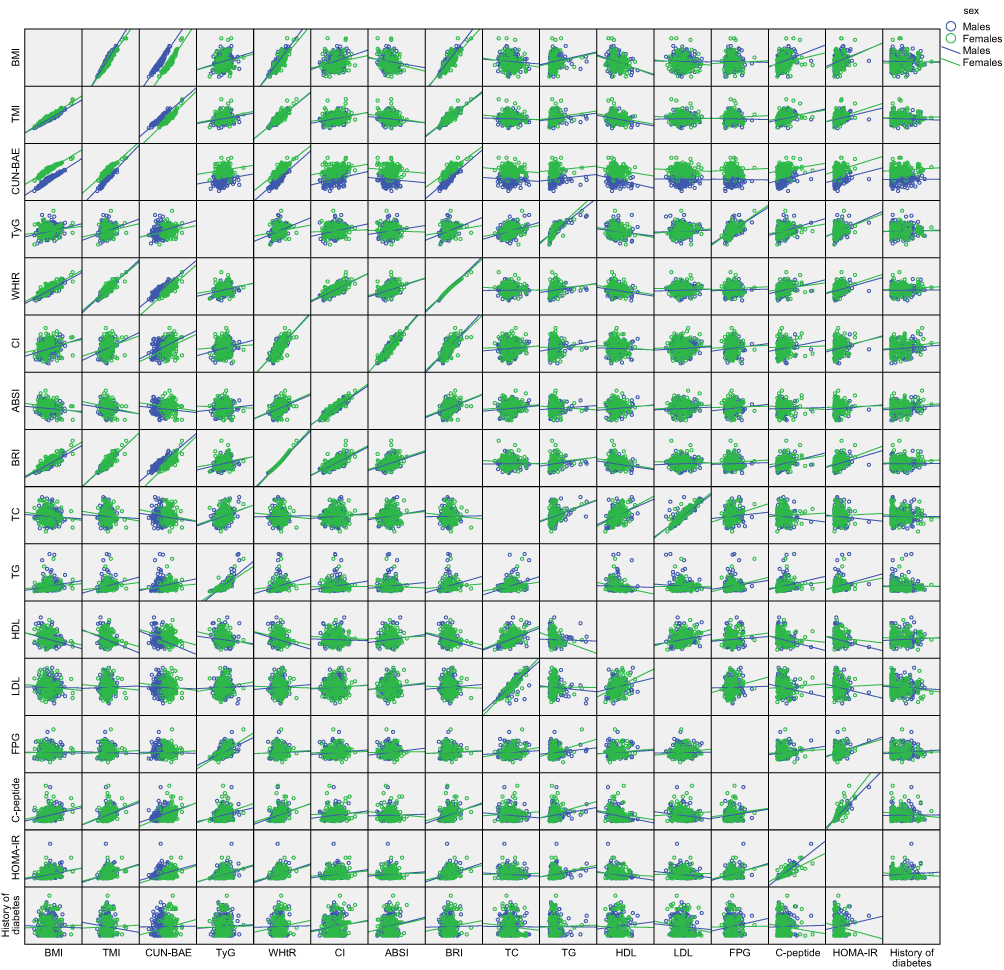 |
Figure 1 Correlations of different adiposity indices and MetS components stratified by gender. Abbreviations: WC, waist circumference; TG, triglyceride; TC, total cholesterol; HDL-c, high- density lipoprotein cholesterol; LDL-c, low-density lipoprotein cholesterol; FBG, fasting blood-glucose; HOMA-IR, homeostasis model assessment of insulin resistance; HbA1C, glycosylated haemoglobin; SBP, systolic blood pressure; DBP, diastolic blood pressure; BMI, body mass index; WHtR, waist-to-height ratio; CI, conicity index; BRI, body roundness index; ABSI, a body shape index; TMI, triponderal mass index; TyG, triglyceride glucose index; CUN-BAE, Clίnica Universidad de Navarra—body adiposity estimator. |
Odds Ratios and 95% Confidence Intervals of Various Obesity Indices for MetS
Binary logistic regression analysis showed that the eight anthropometric measurements included in the study were independently associated with MetS risk, even after adjustment for age, sex and history of smoking and drinking (Table 3A and B). Participants in the highest quartile of obesity indices showed the highest risk for developing MetS, compared to those in the lower quartile. The odds ratios grew in models adjusted for age, sex, smoking, and alcohol consumption along with quartiles for all analyzed anthropometric indices, except ABSI and CI. The highest odds ratios for the occurrence of MetS were noted for WHtR (OR = 22.045; P < 0.001) and BMI (OR = 16.09; P < 0.001).
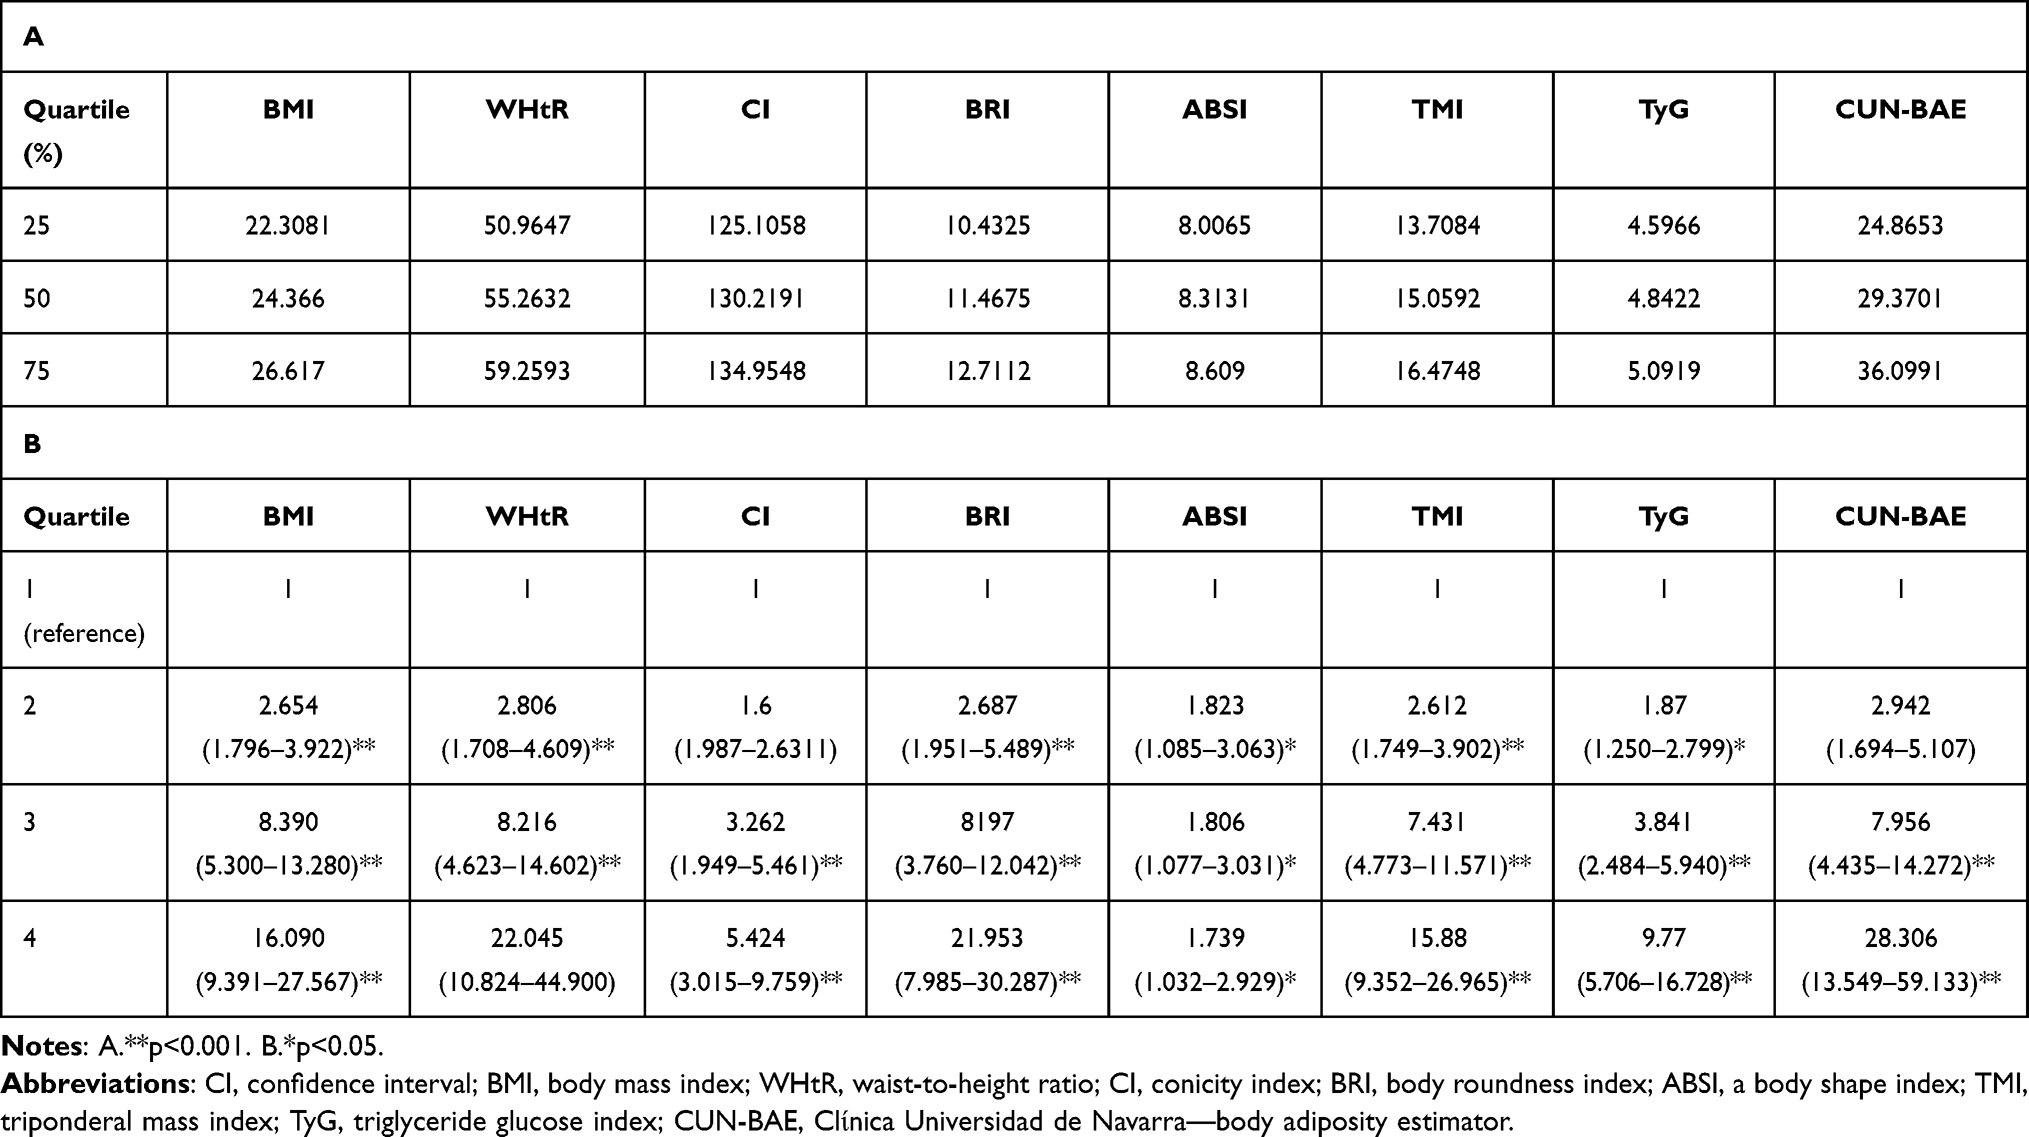 |
Table 3 A: Quartiles of Different Anthropometric Indices. B: Odds Ratios and 95% Confidence Intervals for MetS After Adjustment for Age, Sex and History of Smoking and Drinking |
Capacity of the Adiposity Indices to Predict MetS Using ROC Analysis
The ROC analysis revealed that, with the exception of ABSI, all obesity indices included in the study were able to discriminate between patients with and without MetS (AUCs > 0.6, P < 0.05) (Table 4A and B, Figure 2). In male diabetic patients aged 40–59 years, WHtR and BRI (0.892) showed the highest AUC; in females, TyG (0.731) also showed high AUC. For patients over age 60, CUN-BAE (0.870) and BMI (0.795) had the highest AUC values in men and women, respectively, for discriminating between patients with and without MetS. WHtR and BRI had the same AUC values; the similarity in the predictive feasibility may be explained by the correlation between these two indices.
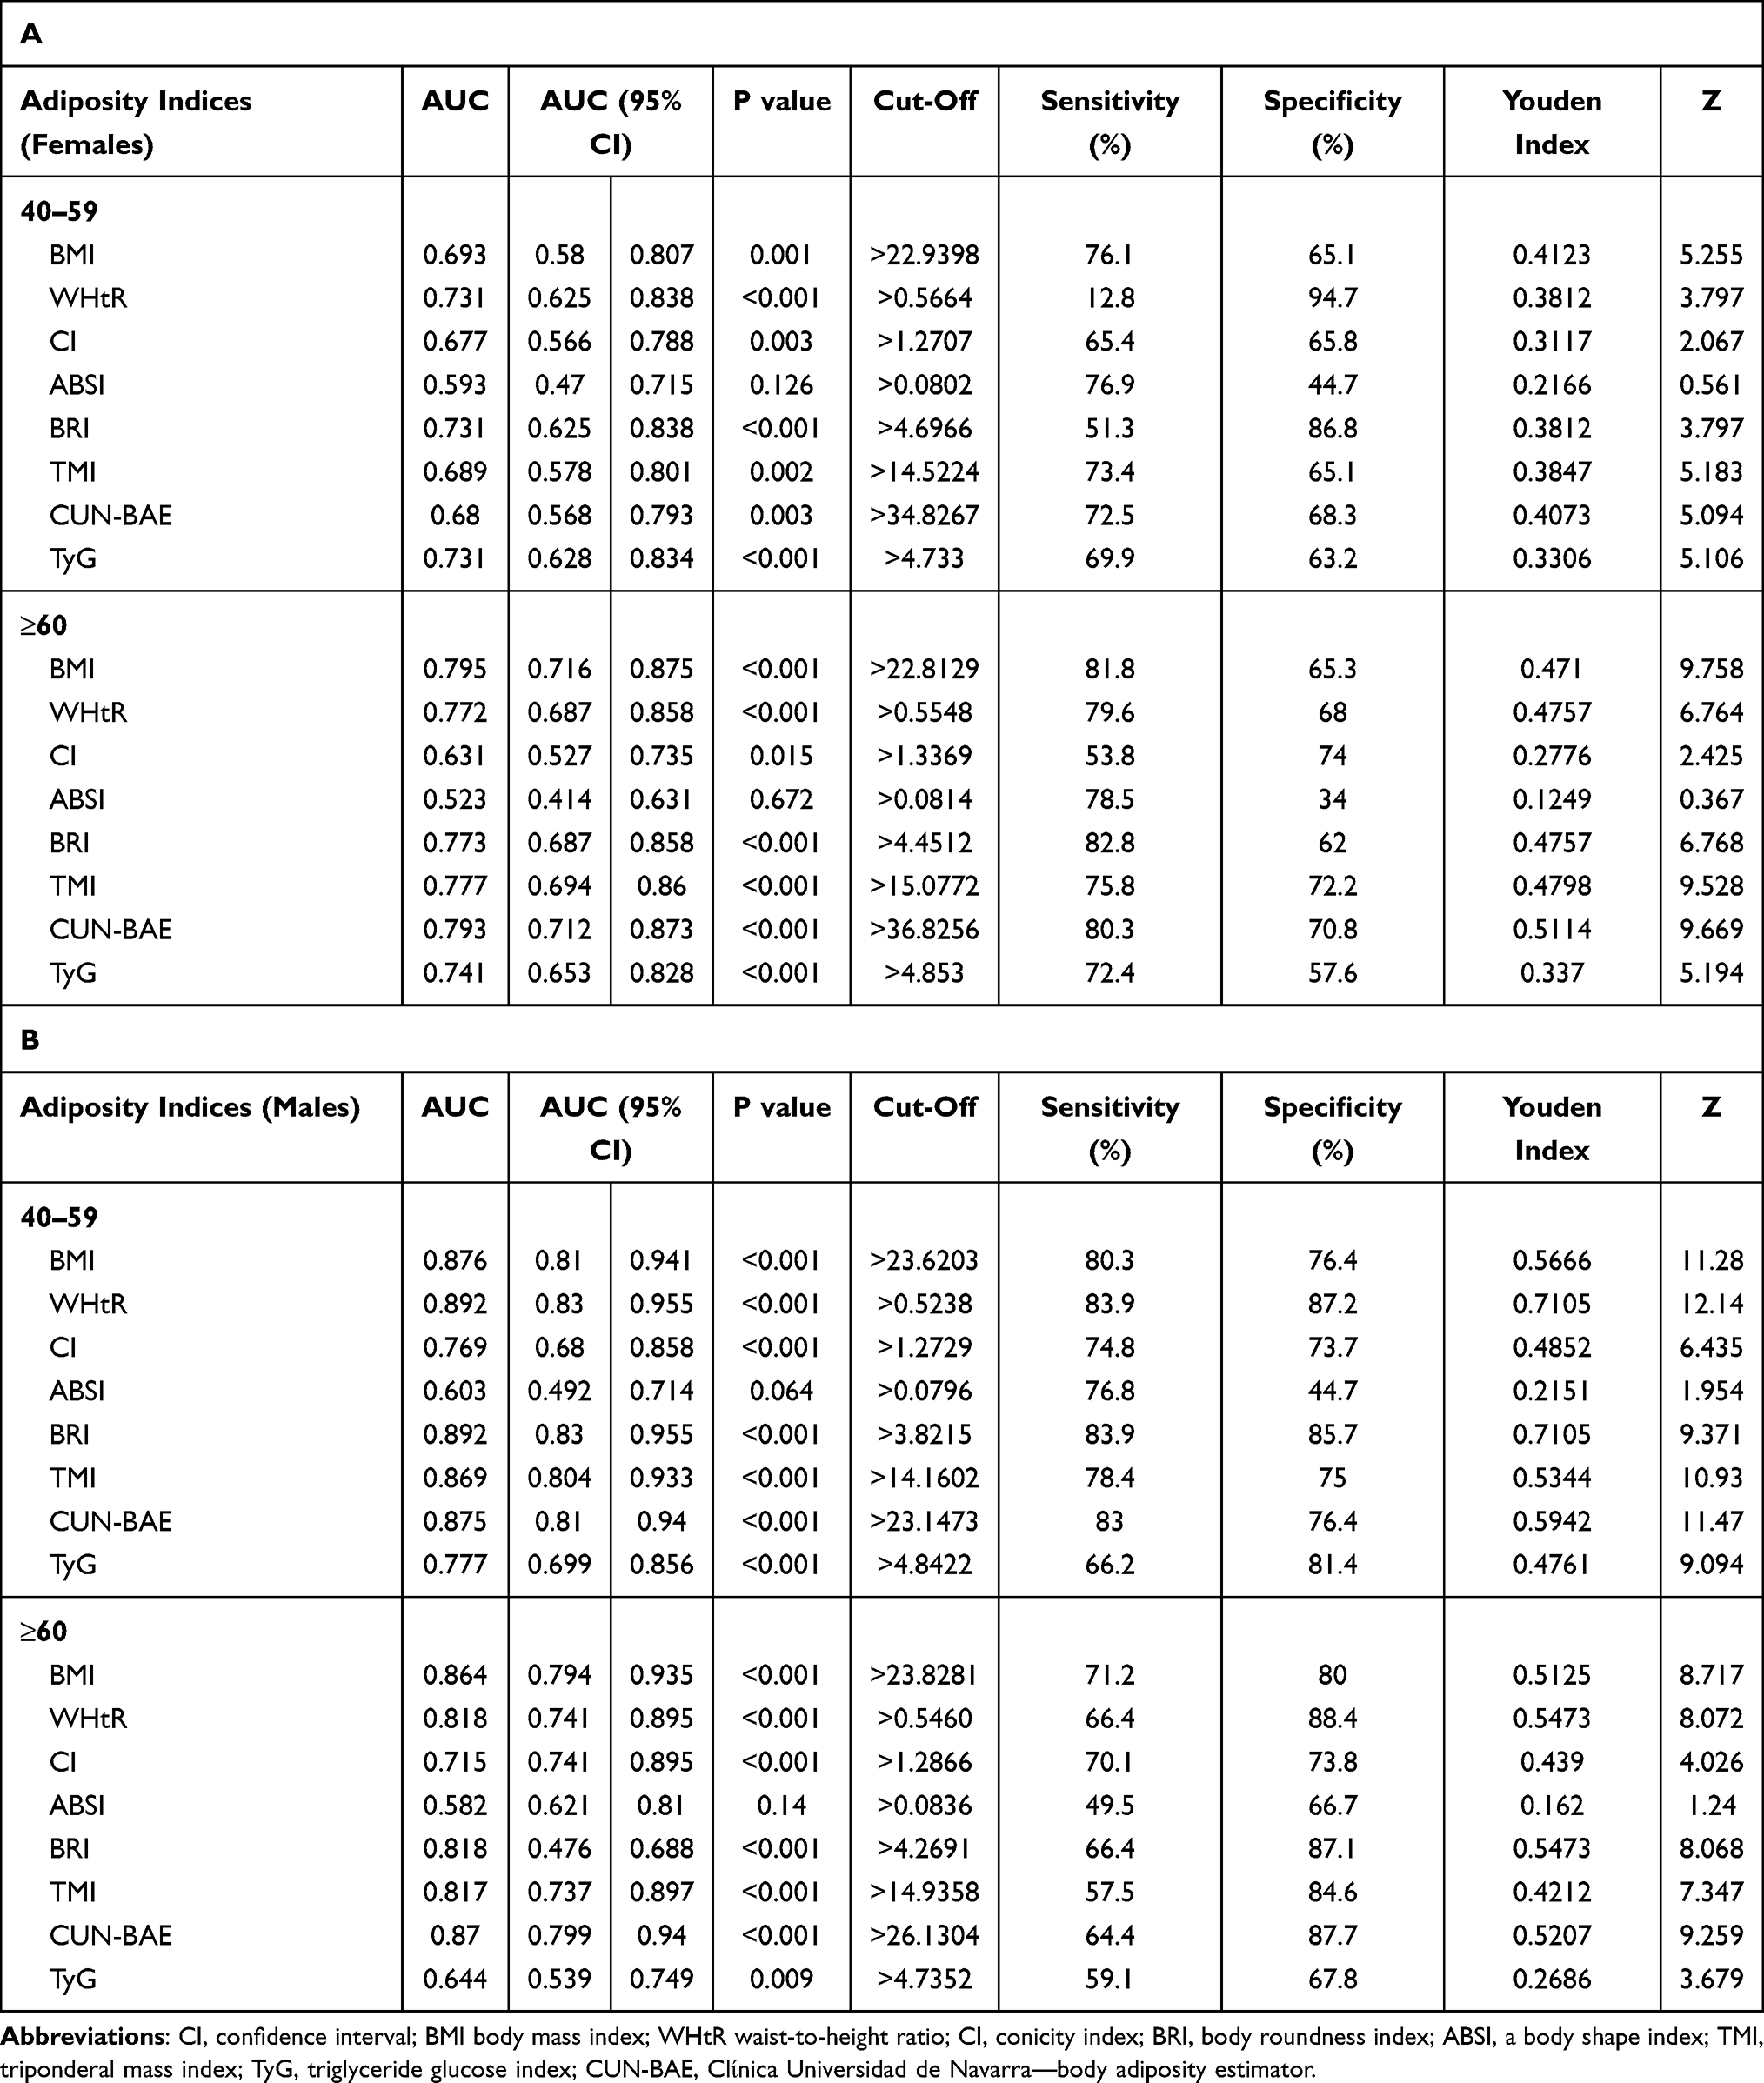 |
Table 4 AUC (95% CI) of Different Obesity Indices in Diagnosis of MetS Stratified by Age and Gender |
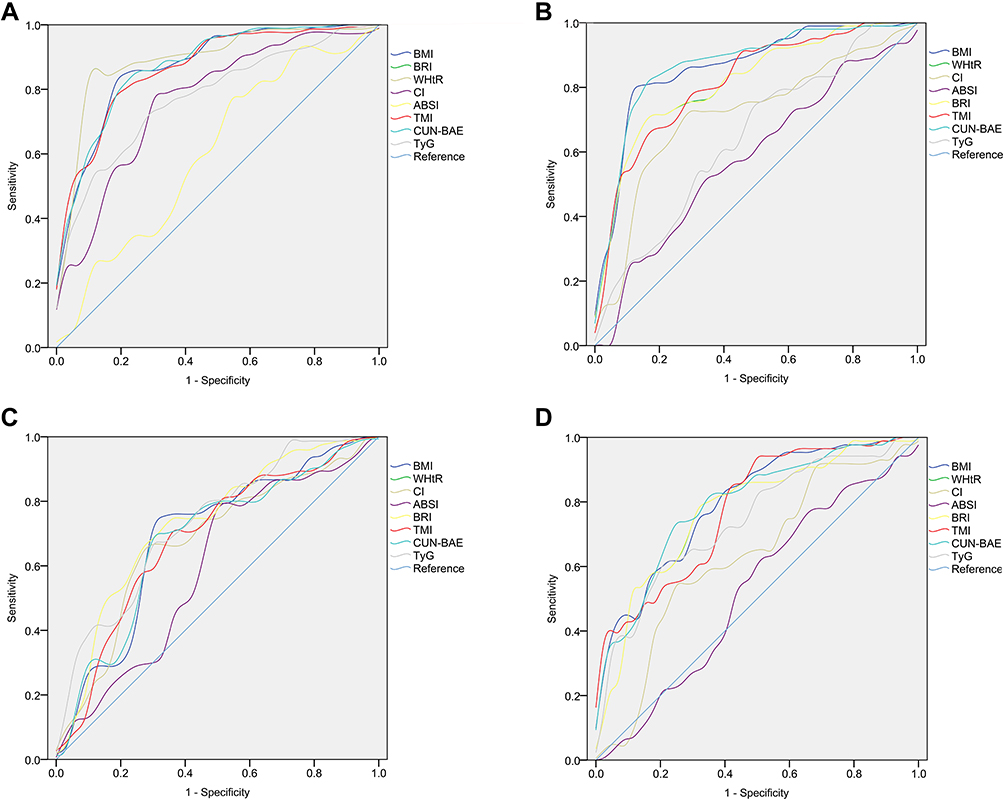 |
Figure 2 ROC curves for different obesity indices used to identify the presence of MetS in type 2 diabetes stratified by gender and age. Abbreviations: BMI, body mass index; WHtR, waist-to-height ratio; CI, conicity index; BRI, body roundness index; ABSI, a body shape index; TMI, triponderal mass index; TyG, triglyceride glucose index; CUN-BAE, Clίnica Universidad de Navarra—body adiposity estimator. Notes: (A) Males aged 40–69; (B) males aged 60 and over; (C) females aged 40–69; (D) females aged 60 and over. |
It is obvious that CUN-BAE exhibited the highest odds ratio for MetS. However, WHtR and BRI had the highest AUC values in male patients aged 40–59 years for discriminating between patients with and without MetS. This may be explained by the statistical methods used and by the different age group. The WHtR index had the highest Youden index values in men aged 40–59 (0.54) and over 60 (0.425), whereas for females, BMI (0.41) and CUN-BAE (0.51) showed the highest values.
The cut-off values of the optimal adiposity indices were as follows: 0.870 for CUN-BAE in men over age 60; 0.5238 for WHtR and 3.8215 for BRI in men aged 40–59; 0.5664 for WHtR, 4.6966 for BRI, and 4.733 for TyG in women aged 40–59; and 22.8129 for BMI in women over age 60.
Discussion
There have been various conclusions drawn about the feasibility of anthropometric indexes in identifying metabolic and obesity disorders. Khader et al recommended WHtR as a diagnostic index for metabolic disorders. However, none of the included anthropometric indices (BMI, WC, and WHtR) was better than the others, as was also found in studies conducted in Spanish population. This study indicated that all obesity indices had a similar capacity to predict MetS. However, when the subjects were stratified by biological sex, BMI showed the largest AUC in men, whereas WHtR and BRI in women.30,31 Davila-Batista concluded that CUN-BAE was the best indices for the evaluation of individuals with MetS. In the Chinese population, the best predictors of MetS were reported to be BRI and WHtR.32 In a study of the Polish population, logistic regression analysis yielded the same results as ROC curve analysis, showing that WHtR, BRI and CUN-BAE were the best anthropometric indices to identify MetS in men and women (separately) in the Polish population. Previous studies in Asian adults30,31 or in obese adolescents30,31 have shown WHtR to have greater feasibility for diagnosing subjects with MetS; CUN-BAE and ABSI were not included in these indices. In a Women’s Health Initiative Study32 of 2672 postmenopausal females, BMI was shown to have greater predictive feasibility than WHtR. The variation across these studies may largely depend on sex,33 ethnicity,34,35 disease,36,37 and age of participants,38 as well as the anthropometric indices selected for analysis.
We think that this study is the first to explore and compare the MetS predictive capacity of the eight obesity indexes which evaluate general (BMI), abdominal (CI, WHtR), and visceral (BRI, ABSI) obesity, as well as three newly devised indices (TyG, CUN-BAE, and TMI) among Chinese diabetes patients. Our study suggested that all these indexes were significantly associated with MetS following adjustment for sex, age, and history of drinking and smoking.
In this study, ROC analyses were performed and in patients aged 40–59 years the index with the largest AUC was WHtR, in both sexes. Similar results have previously been reported, demonstrating that WHtR can predict MetS better than BMI.39–44 The underlying mechanism may be related to the fact that WHtR takes height into consideration, which allows for better consideration of central adiposity. Thus, WHtR has the potential to serve as a prediction index for MetS in Chinese adults. Moreover, WHtR has several advantages including low cost, ease of use, common use in both men and women, and pervious applications in various populations.
In this analysis, the largest AUC from ROC analyses and highest odds ratio in men aged over 60 was for CUN-BAE. Gomes Marcos also considered that the index with the highest odds ratio of MetS was CUN-BAE, according to their analysis. It is important to consider that CUN-BAE evaluates body fat content, and high values increase the risk for obesity complications.45,46 Previous studies suggest that MetS can be better predicted using body fat percentage.47,48 Although the CUN-BAE formula is based on BMI, this new index has an advantage because it also takes age and sex of subjects into consideration. Vinknes has also reported that CUN-BAE is a better index than BMI for prediction of MetS.49
Several previous reports have detailed the limitations of BMI,50–52 because this index cannot distinguish between muscle mass and body fat, and it has no ability to accurately reflect body fat distribution. In agreement with other previous reports,53,54 our findings suggested that, when compared with other measurements, BMI showed improved accuracy, reliability, cost-effectiveness, and precision.
ABSI was the only index that did not perform well and was the weakest predictor of MetS in our study. Previous studies have reported similar findings, where the lowest AUC or the lowest odds ratio for MetS was with ABSI.18,55–57. Only a few studies suggest that the ABSI may be more useful than the classical adiposity indices.18 In the Spanish population, ABSI was reported to be as a better MetS risk indicator in men.40 A study conducted in China also indicated that ABSI was the best measurement for estimating MetS risk in males.58 ABSI can estimate body shape regardless of body size, and thus, this index allows for better prediction of premature mortality than the traditional adiposity indices.51 Several studies have also indicated that ABSI performs better than WHtR and BMI as an adiposity measurement to predict metabolic diseases.59–61 These inconsistencies between our study and others may be explained by different end point variables, a different subject characteristic. For example, subject height was 1.69 meters in the study by Krakauer,17 but was 1.61 meters in the present study. Thus, we postulate that height may play a role in the feasibility of ABSI to identify MetS.
The CI index formula includes height, weight, and abdomen circumference and has been It demonstrated to be an equal indicator to WHtR.62 Compared with WHtR, CI has several advantages; an adjustment of WC for height and weight is included with a theoretical range; abdominal adiposity is compared directly; and fat distribution is assessed without hip circumference. A previous study identified CI as the most useful predictor of cardiovascular events among adiposity indices.63 However, a Heart Study found that CI was not a better index compared with classical measurements for predicting CVDs.64 Our study identified CI as an inferior predictor for MetS compared with BMI, BRI and WHtR, which is in agreement with other studies conducted within the Chinese population.65,66 These conflicting reports may be explained by differing ethnicity and other features of study subjects, and by overall study size.
BRI has been used as a novel measurement of body fat and visceral obesity.14,61 This study indicated that though BRI was able to identify MetS, it did not show better predictive capacity compared to other indices. In previous studies, BRI and WHtR were reported to have the same predictive power (identical areas under the ROC curve), which is in agreement with the findings in our study.51,67,68 Some previous reports have demonstrated a potential for BRI to identify MetS and its components,67,69,70 while other studies have reported that BRI is not better at identifying MetS than traditional indicators such as BMI and WHtR.67,69,71–73 Zhang also reported that the capacity of BRI to identify subjects with MetS was equivalent to that of other indices.41 Several similar results have been reported in postmenopausal women, as well as in obese and overweight adults.53,72,73
Our study has several merits, but was not without limitation. The participants in this study created a homogeneous sample, coming from the same location with the same lifestyle, culture, and eating habits. Importantly, study participants were grouped by biological sex and age, and this was the first study to compare the efficacy of eight adiposity indices for identifying MetS in patients with diabetes.
However, because this study included a self-selected sample of Asian patients, the findings were not applicable to the general population or to other age groups of different regions. Additional studies are needed to confirm our findings.
Conclusion
With the exception of ABSI, other anthropometric indices may be useful in a clinical setting to identify subjects with diabetes. WHtR was found to be useful in identifying MetS and is simple to use. Therefore, we recommend WHtR be used as a screening tool to identify patients at high risk of MetS. ABSI was the weakest indicator of MetS. For elderly patients (aged 60 and over), CUN-BAE may serve as an alternative index to BMI for identification of MetS.
Disclosure
The authors report no conflicts of interest in this work.
References
1. Guzder RN, Gatling W, Mullee MA, Byrne CD. Impact of metabolic syndrome criteria on cardiovascular disease risk in people with newly diagnosed type 2 diabetes. Diabetologia. 2006;49(1):49–55. doi:10.1007/s00125-005-0063-9
2. Bonora E, Targher G, Formentini G, et al. The Metabolic Syndrome is an independent predictor of cardiovascular disease in Type 2 diabetic subjects. Prospective data from the Verona Diabetes Complications Study. Diabetic Med. 2004;21(1):52–58. doi:10.1046/j.1464-5491.2003.01068.x
3. Yao M-F, He J, Sun X, et al. Gender differences in risks of coronary heart disease and stroke in patients with type 2 diabetes mellitus and their association with metabolic syndrome in china. Int J Endocrinol. 2016;2016:8483405. doi:10.1155/2016/8483405
4. Głuszek S, Bociek A, Suliga E, et al. The Effect of Bariatric Surgery on Weight Loss and Metabolic Changes in Adults with Obesity. Int J Environ Res Public Health. 2020;17(15):5342. doi:10.3390/ijerph17155342
5. Marott SCW, Nordestgaard BG, Tybjaerg-Hansen A, Benn M. Causal Associations in Type 2 Diabetes Development. J Clin Endocrinol Metab. 2019;104(4):1313–1324. doi:10.1210/jc.2018-01648
6. Weiss R, Dziura J, Burgert TS, et al. Obesity and the metabolic syndrome in children and adolescents. N Eng J Med. 2004;350(23):2362–2374. doi:10.1056/NEJMoa031049
7. Jahangiry L, Khosravi-far L, Sarbakhsh P, Kousha A, EntezarMahdi R, Ponnet K. Prevalence of metabolic syndrome and its determinants among Iranian adults: evidence of IraPEN survey on a bi-ethnic population. Sci Rep. 2019;9(1):97937. doi:10.1038/s41598-019-44486-8
8. Csige I, Ujvarosy D, Szabo Z, et al. The Impact of Obesity on the Cardiovascular System. J Diabetes Res. 2018;2018:20183407306. doi:10.1155/2018/3407306
9. Afshin A, Forouzanfar MH, Reitsma MB, et al. Health effects of overweight and obesity in 195 Countries over 25 Years. N Eng J Med. 2017;377(1):13–27. doi:10.1056/NEJMoa1614362
10. Shaukat A, Dostal A, Menk J, Church TR. BMI is a risk factor for colorectal cancer mortality. Dig Dis Sci. 2017;62(9):2511–2517. doi:10.1007/s10620-017-4682-z
11. Głuszek S, Ciesla E, Głuszek-Osuch M, et al. Anthropometric indices and cut-off points in the diagnosis of metabolic disorders. PLoS One. 2020;15(6):e0235121. doi:10.1371/journal.pone.0235121
12. Suliga E, Koziel D, Gluszek S. Prevalence of metabolic syndrome in normal weight individuals. Ann Agr Environ Med. 2016;23(4):631–635. doi:10.5604/12321966.1226858
13. Ochoa Sangrador C, Ochoa-Brezmes J. Waist-to-height ratio as a risk marker for metabolic syndrome in childhood. A meta-analysis. Pediatr Obes. 2018;13(7):421–432. doi:10.1111/ijpo.12285
14. Thomas DM, Bredlau C, Bosy-Westphal A, et al. Relationships between body roundness with body fat and visceral adipose tissue emerging from a new geometrical model. Obesity. 2013;21(11):2264–2271. doi:10.1002/oby.20408
15. Bozorgmanesh M, Sardarinia M, Hajsheikholeslami F, Azizi F, Hadaegh F. CVD-predictive performances of “a body shape index” versus simple anthropometric measures: tehran lipid and glucose study. Eur J Nutr. 2016;55(1):147–157. doi:10.1007/s00394-015-0833-1
16. Dhana K, Ikram MA, Hofman A, Franco OH, Kavousi M. Anthropometric measures in cardiovascular disease prediction: comparison of laboratory-based versus non-laboratory-based model. Heart. 2015;101(5):377–383. doi:10.1136/heartjnl-2014-306704
17. Krakauer NY, Krakauer JC, New Body A. Shape index predicts mortality hazard independently of body mass index. PLoS One. 2012;7(7):e39504. doi:10.1371/journal.pone.0039504
18. Haghighatdoost F, Sarrafzadegan N, Mohammadifard N, Asgary S, Boshtam M, Azadbakht L. Assessing body shape index as a risk predictor for cardiovascular diseases and metabolic syndrome among Iranian adults. Nutrition. 2014;30(6):636–644. doi:10.1016/j.nut.2013.10.021
19. Costa EC, Ferezini de Sa JC, Mafaldo Soares EM. Anthropometric indices of central obesity how discriminators of metabolic syndrome in Brazilian women with polycystic ovary syndrome. Gynecol Endocrinol. 2012;28(1):12–15. doi:10.3109/09513590.2011.583956
20. Motamed N, Sohrabi M, Poustchi H, et al. The six obesity indices, which one is more compatible with metabolic syndrome? A population based study. Diabetes Metab Syndr Clin Res Rev. 2017;11(3):173–177. doi:10.1016/j.dsx.2016.08.024
21. Navarro-Gonzalez D, Sanchez-Inigo L, Pastrana-Delgado J, Fernandez-Montero A, Alfredo Martinez J. Triglyceride-glucose index (TyG index) in comparison with fasting plasma glucose improved diabetes prediction in patients with normal fasting glucose: the Vascular-Metabolic CUN cohort. Prev Med. 2016;86:99–105. doi:10.1016/j.ypmed.2016.01.022
22. Moon S, Park J-S, Ahn Y. The cut-off values of triglycerides and glucose index for metabolic syndrome in american and korean adolescents. J Korean Med Sci. 2017;32(3):427–433. doi:10.3346/jkms.2017.32.3.427
23. Zhang M, Wang B, Liu Y, et al. Cumulative increased risk of incident type 2 diabetes mellitus with increasing triglyceride glucose index in normal-weight people: the Rural Chinese Cohort Study. Cardiovasc Diabetol. 2017;16(1):1630. doi:10.1186/s12933-017-0514-x
24. Unger G, Fabiana Benozzi S, Perruzza F, Laura Pennacchiotti G. Triglycerides and glucose index: a useful indicator of insulin resistance. Endocrinologia Y Nutricion. 2014;61(10):533–540. doi:10.1016/j.endonu.2014.06.009
25. Liu B, Liu B, Wu G, Yin F. Relationship between body-roundness index and metabolic syndrome in type 2 diabetes. Diabetes Metab Syndr Obes. 2019;12:931–935. doi:10.2147/dmso.S209964
26. Guerrero-Romero F, Simental-Mendia LE, Gonzalez-Ortiz M, et al. The product of triglycerides and glucose, a simple measure of insulin sensitivity. comparison with the euglycemic-hyperinsulinemic clamp. J Clin Endocrinol Metab. 2010;95(7):3347–3351. doi:10.1210/jc.2010-0288
27. Gomez-Ambrosi J, Silva C, Catalan V, et al. Clinical usefulness of a new equation for estimating body fat. Diabetes Care. 2012;35(2):383–388. doi:10.2337/dc11-1334
28. Peterson CM, Su H, Thomas DM, et al. Tri-ponderal mass index vs body mass index in estimating body fat during adolescence. JAMA Pediatr. 2017;171(7):629–636. doi:10.1001/jamapediatrics.2017.0460
29. Geloneze B, Vasques A, Stabe C, et al. HOMA1-IR and HOMA2-IR indexes in identifying insulin resistance and metabolic syndrome: brazilian Metabolic Syndrome Study (BRAMS). Arq Bras Endocrinol Metabol. 2009;53(2):281–287. doi:10.1590/s0004-27302009000200020
30. Alberti KGMM, Eckel RH, Grundy SM, et al. Harmonizing the Metabolic Syndrome A Joint Interim Statement of the International Diabetes Federation Task Force on Epidemiology and Prevention; National Heart, Lung, and Blood Institute; American Heart Association; World Heart Federation; International Atherosclerosis Society; and International Association for the Study of Obesity. Circulation. 2009;120(16):1640–1645. doi:10.1161/circulationaha.109.192644
31. Lam BCC, Koh GCH, Chen C, Wong MTK, Fallows SJ. Comparison of Body Mass Index (BMI), Body Adiposity Index (BAI), Waist Circumference (WC), Waist-To-Hip Ratio (WHR) and Waist-To-Height Ratio (WHtR) as Predictors of Cardiovascular Disease Risk Factors in an Adult Population in Singapore. PLoS One. 2015;10(4):e0122985. doi:10.1371/journal.pone.0122985
32. Kabat GC, Heo M, Van Horn LV, et al. Longitudinal association of anthropometric measures of adiposity with cardiometabolic risk factors in postmenopausal women. Ann Epidemiol. 2014;24(12):896–902. doi:10.1016/j.annepidem.2014.10.007
33. Tian S, Zhang X, Xu Y, Dong H. Feasibility of body roundness index for identifying a clustering of cardiometabolic abnormalities compared to BMI, waist circumference and other anthropometric indices: the China Health and Nutrition Survey, 2008 to 2009. Medicine. 2016;95(34):e4642. doi:10.1097/md.0000000000004642
34. Mongraw-Chaffin M, Golden SH, Allison MA, et al. The sex and race specific relationship between anthropometry and body fat composition determined from computed tomography: evidence from the multi-ethnic study of atherosclerosis. PLoS One. 2015;10(10):e0139559. doi:10.1371/journal.pone.0139559
35. Heymsfield SB, Peterson CM, Thomas DM, Heo M, Schuna JM. Why are there race/ethnic differences in adult body mass index-adiposity relationships? A quantitative critical review. Obesity Reviews. 2016;17(3):262–275. doi:10.1111/obr.12358
36. Zhou CM, Zhan L, Yuan J, Tong XY, Peng YH, Zha Y. Comparison of visceral, general and central obesity indices in the prediction of metabolic syndrome in maintenance hemodialysis patients. Eating Weight Dis Stud Anorexia Bulimia Obesity. 2020;25(3):727–734. doi:10.1007/s40519-019-00678-9
37. Liu Q, Li YX, Hu ZH, Jiang XY, Li SJ, Wang XF. Comparing associations of different metabolic syndrome definitions with ischemic stroke in Chinese elderly population. Eur J Intern Med. 2018;47:75–81. doi:10.1016/j.ejim.2017.10.010
38. Wu X, Li B, Lin W-Q, et al. The association between obesity indices and hypertension: which index is the most notable indicator of hypertension in different age groups stratified by sex? Clin Exp Hypertens. 2019;41(4):373–380. doi:10.1080/10641963.2018.1489546
39. Amirabdollahian F, Haghighatdoost F. Anthropometric indicators of adiposity related to body weight and body shape as cardiometabolic risk predictors in british young adults: superiority of waist-to-height ratio. J Obes. 2018;2018:8370304. doi:10.1155/2018/8370304
40. Corbatón Anchuelo A, Martínez-Larrad M, Serrano-García I, Fernández Pérez C, Serrano-Ríos M. Body fat anthropometric indexes: which of those identify better high cardiovascular risk subjects? A comparative study in Spanish population. PLoS One. 2019;14(5):e0216877. doi:10.1371/journal.pone.0216877
41. Zhang J, Zhu W, Qiu L, Huang L, Fang L. Sex- and age-specific optimal anthropometric indices as screening tools for metabolic syndrome in chinese adults. Int J Endocrinol. 2018;2018:1067603. doi:10.1155/2018/1067603
42. Ashwell M, Gibson S. Waist-to-height ratio as an indicator of “early health risk’: simpler and more predictive than using a “matrix’ based on BMI and waist circumference. BMJ Open. 2016;6(3):e010159. doi:10.1136/bmjopen-2015-010159
43. Zhu Q, Shen F, Ye T, Zhou Q, Deng H, Gu X. Waist-to-height ratio is an appropriate index for identifying cardiometabolic risk in Chinese individuals with normal body mass index and waist circumference. J Diabetes. 2014;6(6):527–534. doi:10.1111/1753-0407.12157
44. Li W-C, Chen IC, Chang Y-C, Loke -S-S, Wang S-H, Hsiao K-Y. Waist-to-height ratio, waist circumference, and body mass index as indices of cardiometabolic risk among 36,642 Taiwanese adults. Eur J Nutr. 2013;52(1):57–65. doi:10.1007/s00394-011-0286-0
45. Waters DL, Ward AL, Villareal DT. Weight loss in obese adults 65 years and older: a review of the controversy. Exp Gerontol. 2013;48(10):1054–1061. doi:10.1016/j.exger.2013.02.005
46. Starr KNP, Bales CW. Excessive Body Weight in Older Adults. Clin Liver Dis. 2015;19(3):311. doi:10.1016/j.cger.2015.04.001
47. Dlamini Z, Hull R, Makhafola TJ, Mbele M. Regulation of alternative splicing in obesity-induced hypertension. Diabetes Metab Syndr Obesity Targets Ther. 2019;12:1597–1615. doi:10.2147/dmso.S188680
48. Di Daniele N, Noce A, Vidiri MF, et al. Impact of Mediterranean diet on metabolic syndrome, cancer and longevity. Oncotarget. 2017;8(5):8947–8979. doi:10.18632/oncotarget.13553
49. Vinknes KJ, Nurk E, Tell GS, Sulo G, Refsum H, Elshorbagy AK. The relation of CUN-BAE index and BMI with body fat, cardiovascular events and diabetes during a 6-year follow-up: the Hordaland Health Study. Clin Epidemiol. 2017;9:555–566. doi:10.2147/clep.S145130
50. Okorodudu DO, Jumean MF, Montori VM, et al. Diagnostic performance of body mass index to identify obesity as defined by body adiposity: a systematic review and meta-analysis. Int J Obes. 2010;34(5):791–799. doi:10.1038/ijo.2010.5
51. Batsis JA, Mackenzie TA, Bartels SJ, Sahakyan KR, Somers VK, Lopez-Jimenez F. Diagnostic accuracy of body mass index to identify obesity in older adults: NHANES 1999–2004. Int J Obes. 2016;40(5):761–767. doi:10.1038/ijo.2015.243
52. Gomez-Ambrosi J, Silva C, Galofre JC, et al. Body mass index classification misses subjects with increased cardiometabolic risk factors related to elevated adiposity. Int J Obes. 2012;36(2):286–294. doi:10.1038/ijo.2011.100
53. Gomez-Marcos MA, Gomez-Sanchez L, Patino-Alonso MC, et al. Capacity adiposity indices to identify metabolic syndrome in subjects with intermediate cardiovascular risk (MARK study). PLoS One. 2019;14(1):e0209992. doi:10.1371/journal.pone.0209992
54. Ortega FB, Sui X, Lavie CJ, Blair SN. Body mass index, the most widely used but also widely criticized index: would a criterion standard measure of total body fat be a better predictor of cardiovascular disease mortality? Mayo Clinic Proce. 2016;91(4):443–455. doi:10.1016/j.mayocp.2016.01.008
55. Friedewald WT, Fredrickson DS, Levy RI. Estimation of concentration of low-density lipoprotein cholesterol in plasma, without use of preparative ultracentrifuge. Clin Chem. 1972;18(6):499. doi:10.1093/clinchem/18.6.499
56. Behboudi-Gandevani S, Tehrani FR, Cheraghi L, Azizi F. Could “a body shape index” and “waist to height ratio” predict insulin resistance and metabolic syndrome in polycystic ovary syndrome? Eur J Obstetrics Gynecol Reproduct Biol. 2016;205:110–114. doi:10.1016/j.ejogrb.2016.08.011
57. Ramdas Nayak VK, Nayak KR, Vidyasagar S. Predictive performance of traditional and novel lipid combined anthropometric indices to identify prediabetes. Diabetes Metab Syndr. 2020;14(5):1265–1272. doi:10.1016/j.dsx.2020.06.045
58. Wang F, Chen Y, Chang Y, Sun G, Sun Y. New anthropometric indices or old ones: which perform better in estimating cardiovascular risks in Chinese adults. BMC Cardiovasc Disord. 2018;1814. doi:10.1186/s12872-018-0754-z
59. Dhana K, Kavousi M, Ikram MA, Tiemeier HW, Hofman A, Franco OH. Body shape index in comparison with other anthropometric measures in prediction of total and cause-specific mortality. J Epidemiol Community Health. 2016;70(1):90–96. doi:10.1136/jech-2014-205257
60. Malara M, Keska A, Tkaczyk J, Lutoslawska G. Body shape index versus body mass index as correlates of health risk in young healthy sedentary men. J Transl Med. 2015;13:1375. doi:10.1186/s12967-015-0426-z
61. Bouchi R, Asakawa M, Ohara N, et al. Indirect measure of visceral adiposity ‘A Body Shape Index’ (ABSI) is associated with arterial stiffness in patients with type 2 diabetes. BMJ Open Diabetes Res Care. 2016;4(1):e000188. doi:10.1136/bmjdrc-2015-000188
62. Valdez R, Seidell JC, Ahn YI, Weiss KM. A NEW INDEX OF ABDOMINAL ADIPOSITY AS AN INDICATOR OF RISK FOR CARDIOVASCULAR-DISEASE - A CROSS-POPULATION STUDY. Int J Obes. 1993;17(2):77–82.
63. Motamed N, Perumal D, Fhea M, et al. Conicity index and waist-to-hip ratio are superior obesity indices in predicting 10-year cardiovascular risk among men and women. Clin Cardiol. 2015;38(9):527–534. doi:10.1002/clc.22437
64. Kim KS, Owen WL, Williams D, Adams-Campbell LL. A comparison between BMI and conicity index on predicting coronary heart disease: the Framingham Heart Study. Ann Epidemiol. 2000;10(7):424–431. doi:10.1016/s1047-2797(00)00065-x
65. Zhang J, Fang L, Qiu L, Huang L, Zhu W, Yu Y. Comparison of the ability to identify arterial stiffness between two new anthropometric indices and classical obesity indices in Chinese adults. Atherosclerosis. 2017;263:263–271. doi:10.1016/j.atherosclerosis.2017.06.031
66. Li L-M, Lei S-F, Chen X-D, et al. Anthropometric indices as the predictors of trunk obesity in Chinese young adults: receiver operating characteristic analyses. Ann Hum Biol. 2008;35(3):342–348. doi:10.1080/03014460802027049
67. Tian S, Zhang X, Xu Y, Dong H. Feasibility of body roundness index for identifying a clustering of cardiometabolic abnormalities compared to BMI, waist circumference and other anthropometric indices: the China Health and Nutrition Survey, 2008 to 2009. Medicine. 2016;95(34):e4642. doi:10.1097/md.0000000000004642
68. Maessen MFH, Eijsvogels TMH, Verheggen RJHM, Hopman MTE, Verbeek ALM, de Vegt F. Entering a new era of body indices: the feasibility of a body shape index and body roundness index to identify cardiovascular health status. PLoS One. 2014;9(9):e107212. doi:10.1371/journal.pone.0107212
69. Chang Y, Guo X, Chen Y, et al. A body shape index and body roundness index: two new body indices to identify diabetes mellitus among rural populations in northeast China. Bmc Public Health. 2015:15794. doi:10.1186/s12889-015-2150-2
70. Chang Y, Guo X, Guo L, Li Z, Li Y, Sun Y. The feasibility of two new anthropometric indices to identify hypertension in rural China A cross-sectional study. Medicine. 2016;95(44):e5301. doi:10.1097/md.0000000000005301
71. Zaid M, Ameer F, Munir R, et al. Anthropometric and metabolic indices in assessment of type and severity of dyslipidemia. J Physiol Anthropol. 2017:3619. doi:10.1186/s40101-017-0134-x
72. Liu PJ, Ma F, Lou HP, Zhu YN. Body roundness index and body adiposity index: two new anthropometric indices to identify metabolic syndrome among Chinese postmenopausal women. Climacteric. 2016;19(5):433–439. doi:10.1080/13697137.2016.1202229
73. Li G, Wu H-K, Wu X-W, et al. The feasibility of two anthropometric indices to identify metabolic syndrome, insulin resistance and inflammatory factors in obese and overweight adults. Nutrition. 2019;57:194–201. doi:10.1016/j.nut.2018.05.004
 © 2021 The Author(s). This work is published and licensed by Dove Medical Press Limited. The full terms of this license are available at https://www.dovepress.com/terms.php and incorporate the Creative Commons Attribution - Non Commercial (unported, v3.0) License.
By accessing the work you hereby accept the Terms. Non-commercial uses of the work are permitted without any further permission from Dove Medical Press Limited, provided the work is properly attributed. For permission for commercial use of this work, please see paragraphs 4.2 and 5 of our Terms.
© 2021 The Author(s). This work is published and licensed by Dove Medical Press Limited. The full terms of this license are available at https://www.dovepress.com/terms.php and incorporate the Creative Commons Attribution - Non Commercial (unported, v3.0) License.
By accessing the work you hereby accept the Terms. Non-commercial uses of the work are permitted without any further permission from Dove Medical Press Limited, provided the work is properly attributed. For permission for commercial use of this work, please see paragraphs 4.2 and 5 of our Terms.