")
Back to Journals » Diabetes, Metabolic Syndrome and Obesity » Volume 14
Evaluation of Anthropometric Indices and Lipid Parameters to Predict Metabolic Syndrome Among Adults in Mexico
Authors Datta Banik S , Pacheco-Pantoja E, Lugo R , Gómez-de-Regil L, Chim Aké R , Méndez González RM, Gutiérrez Solis AL
Received 15 September 2020
Accepted for publication 20 November 2020
Published 16 February 2021 Volume 2021:14 Pages 691—701
DOI https://doi.org/10.2147/DMSO.S281894
Checked for plagiarism Yes
Review by Single anonymous peer review
Peer reviewer comments 3
Editor who approved publication: Prof. Dr. Antonio Brunetti
Sudip Datta Banik,1 Elda Pacheco-Pantoja,2 Roberto Lugo,3 Lizzette Gómez-de-Regil,3 Rodolfo Chim Aké,3 Rosa María Méndez González,1 Ana Ligia Gutiérrez Solis3
1Center for Research and Advanced Studies (Cinvestav-IPN), Merida, Yucatan, Mexico; 2School of Medicine, Health Sciences Division, Universidad Anáhuac Mayab, Merida, Yucatan, Mexico; 3Regional High Speciality Hospital of the Yucatan Peninsula (HRAEPY), Merida, Yucatan, Mexico
Correspondence: Ana Ligia Gutiérrez Solis Email [email protected]
Background: Metabolic syndrome (MetS) is a cluster of conditions that increases the risk of cardiovascular disease (CVD) and is related to genetic background, dietary habits, and lifestyle. Anthropometric indices and lipid parameters have been shown to be simple and useful tools in clinical practice for predicting MetS. The aim of the present study was to evaluate the differential magnitudes of anthropometric characteristics (waist circumference and body mass index [BMI]) and lipid parameters, namely, lipid accumulation product (LAP), cardiometabolic index (CMI), and Castelli Risk Index (CRI-I), to estimate MetS, usingappropriate cut-off values, among adults from a public hospital in Yucatan, Mexico.
Methods: A cross-sectional study among 250 adults (77 men, 173 women) was carried out in the Regional High Speciality Hospital of the Yucatan Peninsula (HRAEPY) in Merida, Yucatan. MetS was diagnosed using standard criteria (central obesity, arterial hypertension, hyperglycemia, and dyslipidemia), and derived parameters (LAP, CMI, and CRI-I) were calculated. Binary logistic regression analysis-based receiver operating characteristics (ROC) curves were used to predict MetS.
Results: Of the 250 participants, 48% had MetS. High prevalences of overweight (35.2%) and obesity (48.8%) were found in the sample. The CMI and LAP were found to be the best parameters in the prediction of MetS in men and women. The optimal cut-off values of the parameters were higher in men and decreased with advancing age.
Conclusion: The CMI and LAP were shown to be the most effective indicators to diagnose MetS among adults from Yucatan, Mexico.
Keywords: BMI, waist circumference, blood pressure, lipid profile, lipid accumulation product, cardiometabolic index, Castelli Risk Index, cut-off values
Background
Non-communicable diseases (NCDs) are the major cause of death worldwide.1 A similar situation is observed in Mexico, where cardiovascular diseases (CVDs) and type 2 diabetes mellitus (T2DM) are the leading causes of mortality, according to the Ministry of Health of the Federal Government of Mexico.2 Metabolic syndrome (MetS) is characterized by the presence of risk factors, namely, central obesity, hypertension, elevated levels of fasting plasma glucose (FPG) and triglycerides (TG), and reduced levels of high-density lipoprotein cholesterol (HDL-C).3 Scientific evidence has linked MetS to the risk of developing CVDs and T2DM.4 MetS represents one of the major public health challenges for the Mexican healthcare system. In Mexico, government reports have revealed high rates of obesity and T2DM among adults and children.2 Therefore, the adoption of preventive measures and the early diagnosis of MetS are important in Mexico.
Anthropometric indices and lipid parameters have been shown to be simple and useful tools in the clinical setting for predicting CVDs, diabetes, and MetS.5,6 However, studies from different countries and ethnic groups have reported different results regarding the differential advantages of the predictors. Differences have been found in the selection of cut-off values of the parameters used to diagnose MetS. It is recommended that the appropriate cut-off points to identify the best predictors of MetS should be estimated for separate populations.6–8
Most of the literature representing the Mexican population has addressed the utility of some predictors, namely, body mass index (BMI), waist circumference (WC), and waist-to-height ratio (WHtR), in identifying cardiometabolic risk.9,10 A prospective study reported WC as a better predictor for T2DM, compared to BMI and WHtR, in Mexican Americans.11 Another study demonstrated that WHtR, with a cut-off value ≥0.6, was a better predictor for MetS than WC and BMI in obese adolescents in Mexico.12 However, there is no agreement on the selection of the best predictor. In the past decade, new anthropometric indices and lipid parameters have been developed to evaluate MetS in different populations across the world to overcome some limitations of BMI, WC, and WHtR. The lipid accumulation product (LAP),13 cardiometabolic index (CMI),14 and Castelli Risk Index I (CRI-I)15 are some of the indicators that have been postulated and explored as good predictors of MetS.
Against this background, the aim of the present study was to evaluate the differential magnitudes of anthropometric characteristics (WC and BMI) and lipid parameters (LAP, CMI, and CRI-I) to estimate MetS, using appropriate cut-off values, among adults in a public hospital in Yucatan, Mexico.
Methods
Study Design
The present cross-sectional study was carried out between August and November 2018. A total of 13,959 individuals attended the outpatient specialty units at the Regional High Speciality Hospital (HRAEPY in the Spanish acronym) in Merida, Yucatan, Mexico. Patients under medical treatment for specific diseases in the cardiology, neurology, endocrinology, and oncology units, as well as pregnant women, were excluded from the study; accordingly, the records of 6888 patients were selected. To ensure the representativeness of the population, a sample size was calculated using a standard formula for an unknown population.16 The parameters were 95% confidence level, an estimation error of 6.2%, and an unknown prevalence of 50% for MetS. From this calculation, the minimum required sample size was 246 individuals. Finally, a sample of 250 patients (77 men and 173 women) aged 20–65 years who received services at the outpatient units was selected for this study (Figure 1).
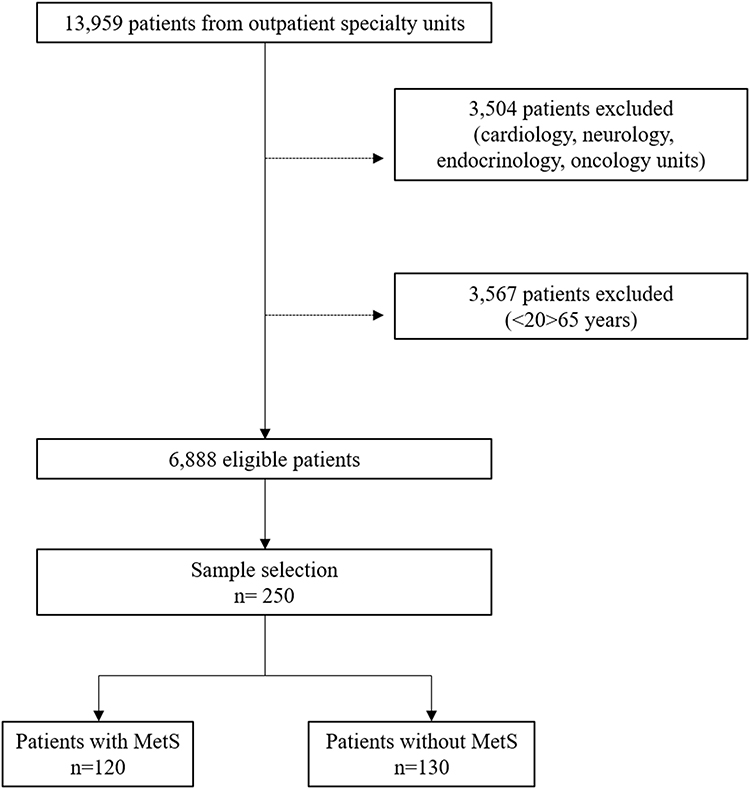 |
Figure 1 Sampling design to select participants (n=250). |
Ethical Clearance
The study was approved by the Ethics Committee of the HRAEPY (no. CONBIOETICA-31-CEI-002-20170731) in connection with a research project (identification code: 2017-025), following the guideline for human experiments as laid down in the Helsinki Declaration. The participants signed the informed consent form before the start of the study.
Anthropometric Measurements
Anthropometric measurements were recorded from the individuals, who were wearing light clothes. Weight (kg) and height (cm) were measured using an electronic scale (Seca, Germany) and a stadiometer (Seca, Germany), respectively. Body weight was recorded to the nearest 0.05 kg and height (cm) was measured to the nearest 0.1 cm. Waist circumference (WC) (cm) was measured to the nearest 0.1 cm using a standard tape measure (Lufkin) at the midpoint between the lower costal margin and the superior of the iliac crest. BMI was calculated as weight divided by the square of height (kg/m2).17
Blood pressure (BP) (systolic and diastolic, SBP and DBP, respectively) was estimated after 15 minutes of rest in the sitting position, using an automatic electronic sphygmomanometer (Omron, Japan).18 A prevalidated questionnaire was used to collect a brief clinical history of the participants.
Clinical Biochemistry, Diagnostic Criteria, and Calculations
Blood samples were collected after 12 hours of overnight fasting, by a trained researcher following standard procedures. Clinical biochemistry tests were conducted following standard protocols to estimate levels of fasting plasma glucose (FPG) (mg/dL), cholesterol (mg/dL), triglycerides (TG) (mg/dL), and high-density lipoproteincholesterol (HDL-C) (mg/dL). Prevalidated equipment (autoanalyzer COBAS® Integra 400 Plus, Roche Diagnostics) was used for the clinical biochemistry tests.
The diagnosis of MetS was based on the National Cholesterol Education Program Adult Treatment Panel III (NCEP ATP III) criteria,3 if subjects had three out of the following five components:
- Abdominal obesity (WC >102 cm for men, >88 cm for women)
- Elevated FPG (≥100 mg/dL)
- Elevated TG (≥150 mg/dL)
- Low level of HDL-C (<40 mg/dL for men, <50 mg/dL for women)
- Elevated BP (SBP ≥130 mmHg or DBP ≥85 mmHg or current use of antihypertensive medications).
The derived lipid parameters were calculated following standard equations:
Lipid accumulation product (LAP) in men = [(WC– 65) (TG)]
Lipid accumulation product (LAP) in women = [(WC – 58) (TG)]
Cardiometabolic index (CMI) = [WHtR (TG/HDL − C)]
Castelli Risk Index I (CRI-I) = [TC/HDL − C]
Clinical history (pre-existing hypertension and diabetes) and lifestyle habits (smoking, alcohol consumption, and physical activity) were recorded for each participant.
Statistical Analyses
Data were analyzed using SPSS statistical software (version 15.00) and the statistical package Jamovi (version 0.9). Based on the diagnosis of MetS, the participants were assigned to either the with MetS or the without MetS group. Analyses were performed taking the entire sample of men (n=77) and women (n=173) and also by age groups of 20–39 years (46 women), 40–59 years (45 men, 101 women), and above 60 years (15 men, 26 women). No men had MetS in the age group of 20–39 years (n=17), which was excluded from the analysis. The distribution of variables was tested following the principle of the Shapiro–Wilk test (p>0.05). Since variables did not show a normal distribution, median values were used for the Mann–Whitney U-test. Descriptive statistics (median values and interquartile ranges [IQRs]) of MetS components, anthropometric indices, and lipid indices were computed. The area under the receiveroperating characteristics (ROC) curve (AUC) was estimated using binomial logistic regression analysis, which was has been used to assess the discriminatory abilities of anthropometric and lipid indices to identify MetS (Yes = 1, No = 0).
Cut-off values were based on the Youden Index (sensitivity + specificity −1). The sensitivity and specificity of each cut-off value of the MetS components, and the anthropometric and lipid indices were calculated to evaluate MetS. Furthermore, AUC and cut-off values for anthropometric and lipid indices were grouped by age among women (20–39, 40–59, and ≥60 years) and men (40–59 and ≥60 years). Statistical significance was set at p<0.05 for all analyses.
Results
Prevalence of MetS and Its Components
The prevalence of MetS in the sample (n=250) was remarkable (48%); 92 (36%) women and 28 (11.2%) men were diagnosed as having MetS. The average age of individuals with MetS was significantly higher (50.8±9.53 years) than the group without MetS (46.83±11.75 years). Among the participants, 67 (26.8%) had been previously diagnosed with T2DM and 85 (34%) with hypertension; 88 participants (35.2%) were overweight and 122 (48.8%) were obese. Besides, 98 (39.2%) participants presented with dyslipidemia (elevated levels of TG and low levels of HDL).
Table 1 shows the baseline characteristics of the sample of men (n=77). The mean age in men with MetS (54 years) was higher than in those without MetS (49 years); 83% of men were excess weight (overweight and obesity). Among men, 15 participants (19.48%) had an earlier diagnosis of T2DM and 25 individuals (32.46%) of hypertension. In addition, 11 men (14.28%) reported smoking, 15 (19.48%) regular alcohol consumption, and 28 (32.46%) having regular physical activity. Median values of MetS components, anthropometric indices, and lipid indices were higher (except HDL-C and LAP) in men with MetS in comparison with those without MetS.
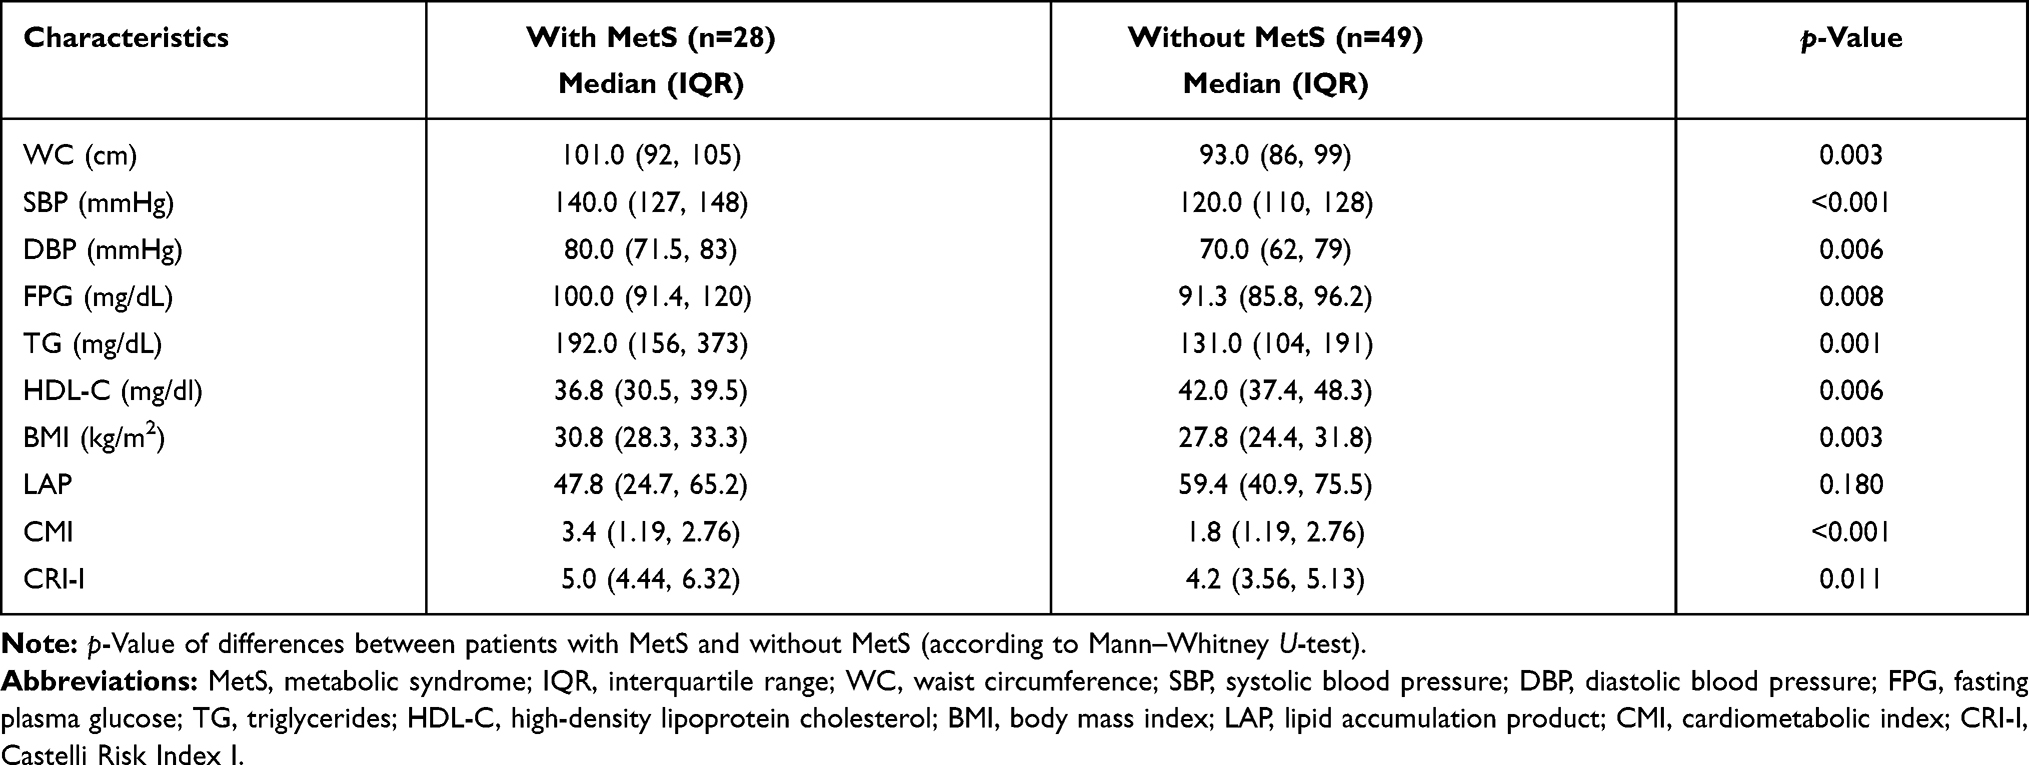 |
Table 1 Descriptive Characteristics of Men (n=77) Between 20 and 65 Years With and Without MetS |
Table 2 displays the characteristics of the sample of women (92 with MetS, 81 without MetS). Lifestyle habits of women, such as smoking in four (2.31%), alcohol use in 15 (8.67%), and physical activity in 42 (24.27%), were reported. An earlier diagnosis of T2DM and hypertension was found in 52 (30%) and 60 women (34.68%), respectively. MetS components and other characteristics were statistically significantly different between the two groups. The majority of the women (84%) were excess weight (overweight and obesity).
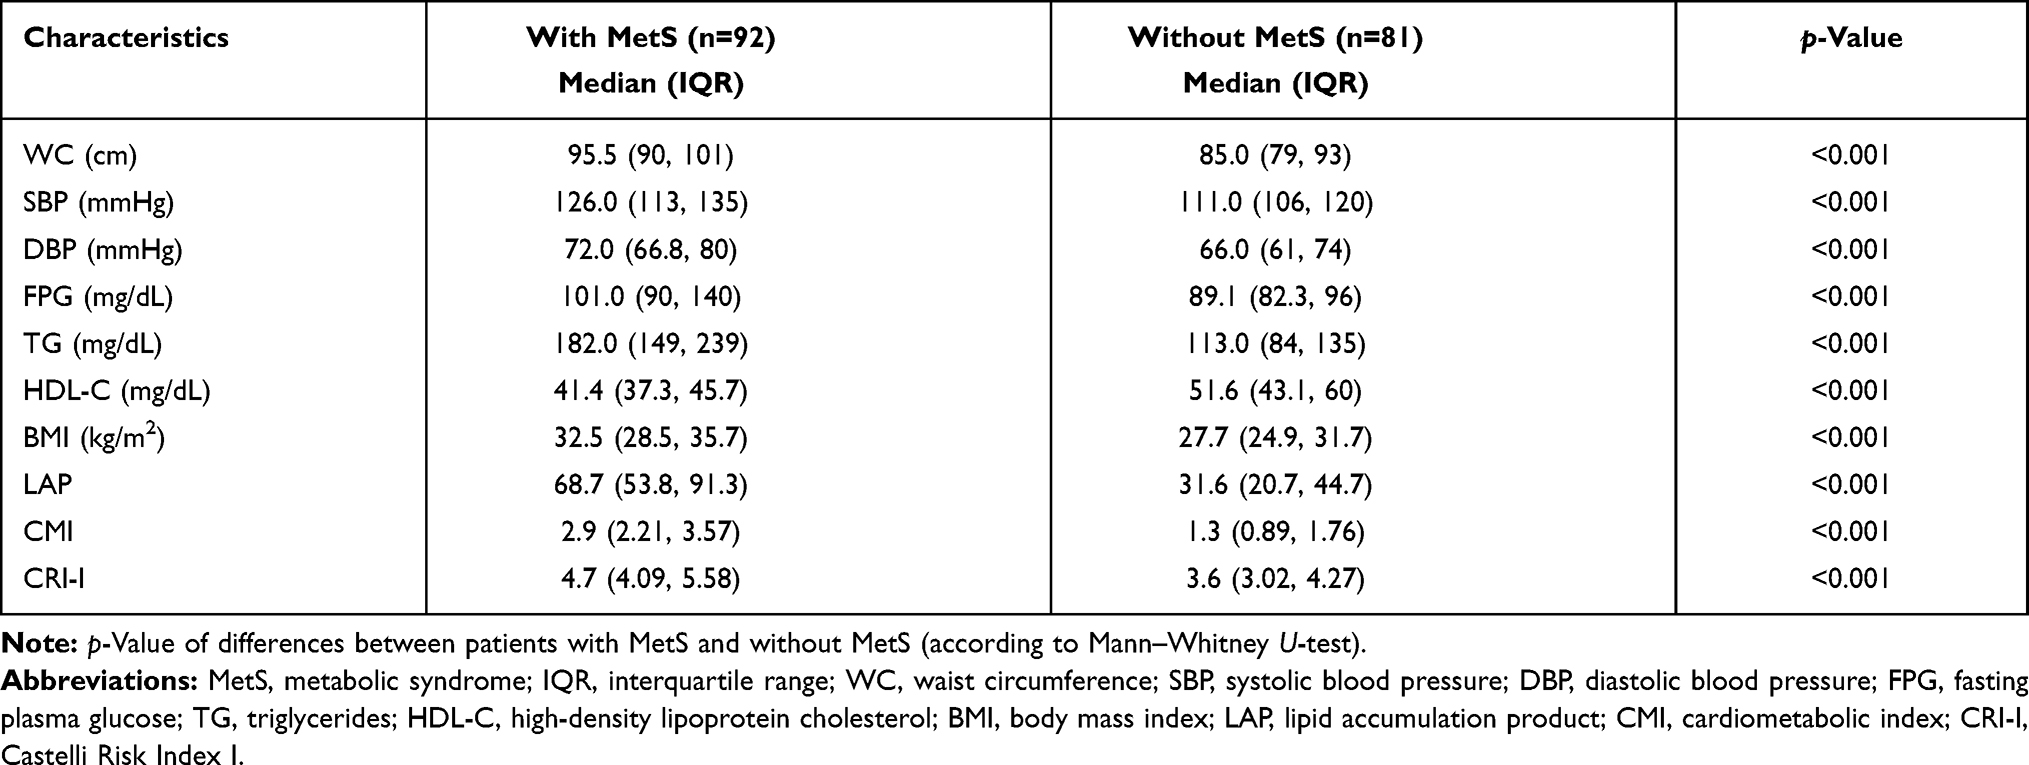 |
Table 2 Descriptive Characteristics of Women (n=173) Between 20 and 65 Years With and Without MetS |
Among the patients with MetS, the prevalences of pre-existing hypertension (men 18.18%, women 27.16%) and T2DM (men 10.38%, women 23.12%) were higher than in the participants without MetS (prehypertensive men 14.28% and women 7.51%; pre-existing T2DM in 9.09% of men and 6.93% of women). Significant differences in median values with respect to the anthropometric and lipid parameters and derived indices were observed between the groups (MetS and without MetS) in men and women, as expected. Among the participants, women had lower mean values of SBP, DBP, WC, FPG, TG, LAP, CMI, and CRI-I, and higher BMI compared to men (Tables 1 and 2).
Optimal Cut-Off Values of MetS Components Among the Population in Yucatan
The AUCs were developed using binomial logistic regression analysis, with MetS (Yes = 1, No = 0) as a response variable and anthropometric and lipid parameters as the predictors. Table 3 and Figure 2 show that the AUCs for the components of MetS among men were greater than 0.5 (p<0.05), suggesting their diagnostic significance for MetS. Among the variables, SBP reported the largest AUC (0.75), with a cut-off value of 126.50 mmHg, followed by TG (0.72), with a cut-off value of 156 mg/dL, WC (0.70), with a cut-off value of 100.5 cm, HDL-C (0.68), with a cut-off value of 39.60 mg/dL, and FPG (0.68), with a cut-off value of 101.45 mg/dL. The lowest AUC was for DBP (0.68), with a cut-off value of 71.50 mmHg. In men, the highest value of the Youden Index (0.53) was found for SBP, with an odds ratio (OR) of 1.05.
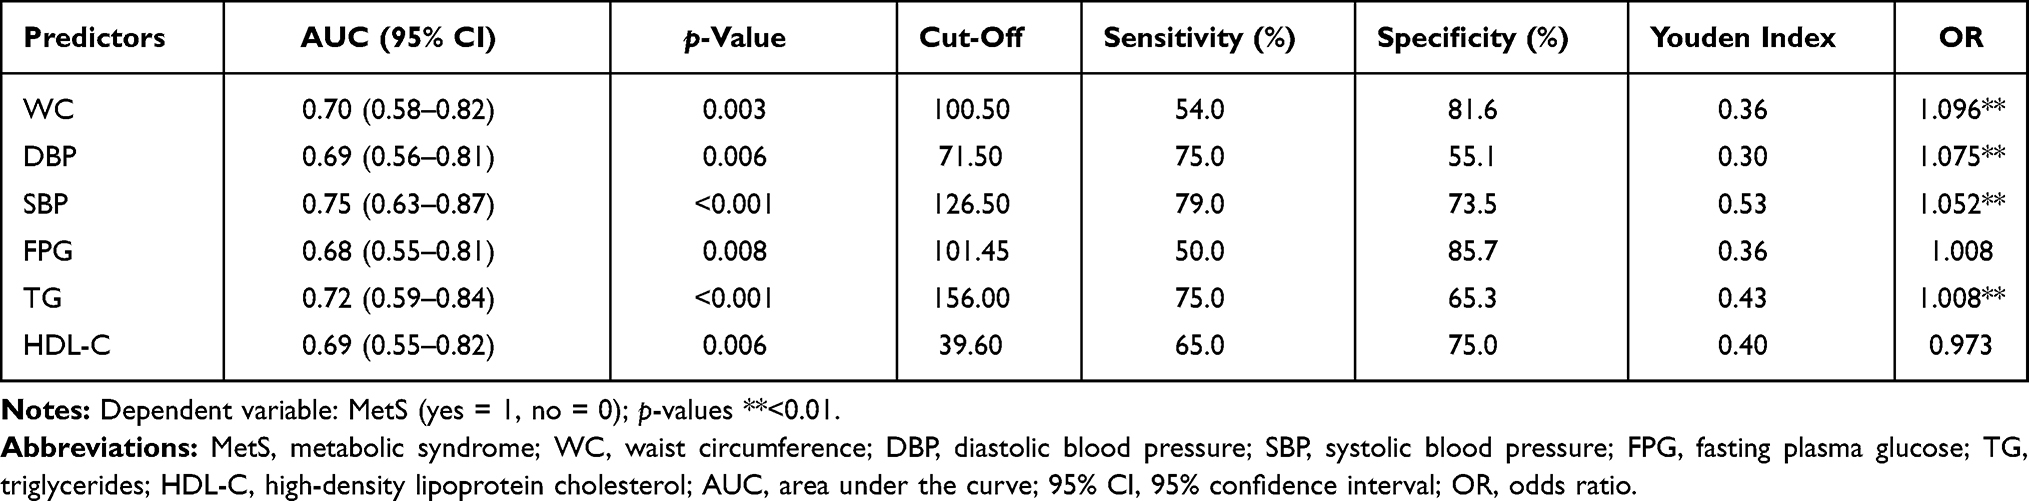 |
Table 3 Area Under the Receiver Operating Characteristics Curve, Optimal Cut-Off Points of the MetS Components in Men (n=77) |
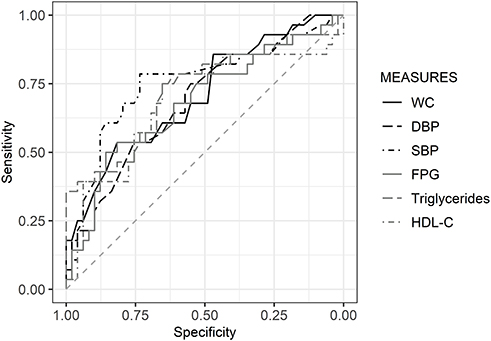 |
Figure 2 Area under the receiver operating characteristics curve of the parameters to predict MetS in men (n=77). |
Table 4 and Figure 3 show the AUCs for MetS components in women. The result show that TG had the largest AUC (0.81), with a cut-off value of 148.0 mg/dL, followed by WC (0.77), with a cut-off value of 85.50 cm, HDL-C (0.74), with a cut-off value of 51.55 mg/dL, SBP (0.72), with a cut-off value of 122.5 mmHg, and FPG (0.70), with a cut-off value of 95.45 mg/dL. DBP showed the lowest AUC (0.67), with a cut-off value of 68.50 mmHg. In women, the highest value of the Youden Index (0.58) was obtained for TG, with an OR of 1.016.
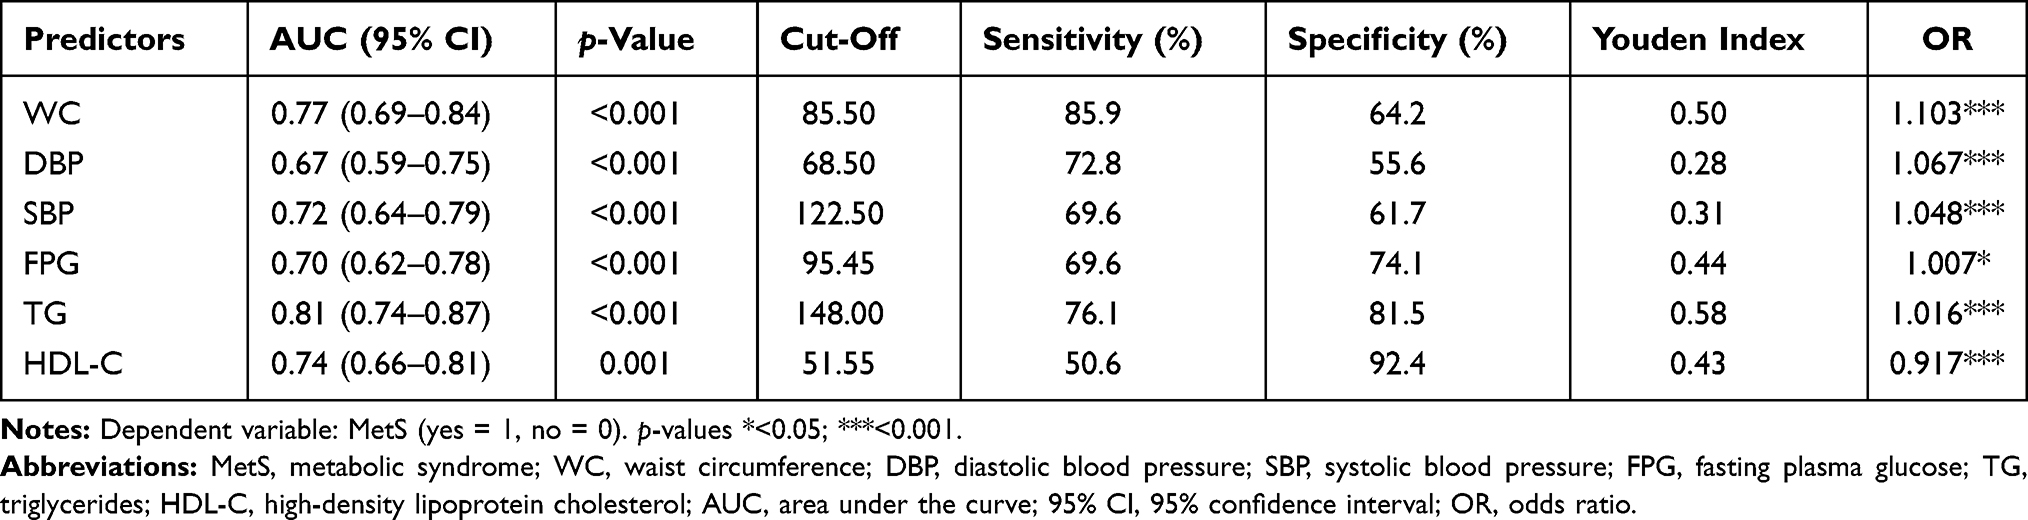 |
Table 4 Area Under the Receiver Operating Characteristics Curve, Optimal Cut-Off Points of the MetS Components in Women (n=173) |
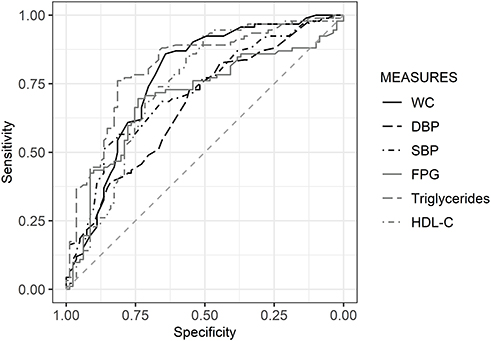 |
Figure 3 Area under the receiver operating characteristics curve of the parameters to predict MetS in women (n=173). |
AUC, Optimal Cut-Off Points, and Validity of the Predictors of MetS
Table 5 and Figure 4 illustrate the results of logistic regression models in men by age group; the AUCs for indices were greater than 0.5 (p<0.05). In men between 40 and 59 years of age (n=45), the highest AUCs were found for LAP (0.72), with a cut-off value of 58.83, and CMI (0.72), with a cut-off value of 2.78. However, CMI reported a higher Youden Index (0.39) and OR (1.62) than LAP. In men aged 60 years and above (n=15), CMI had the highest values of the Youden Index (0.82) and OR (4.66), with an AUC of 0.90.
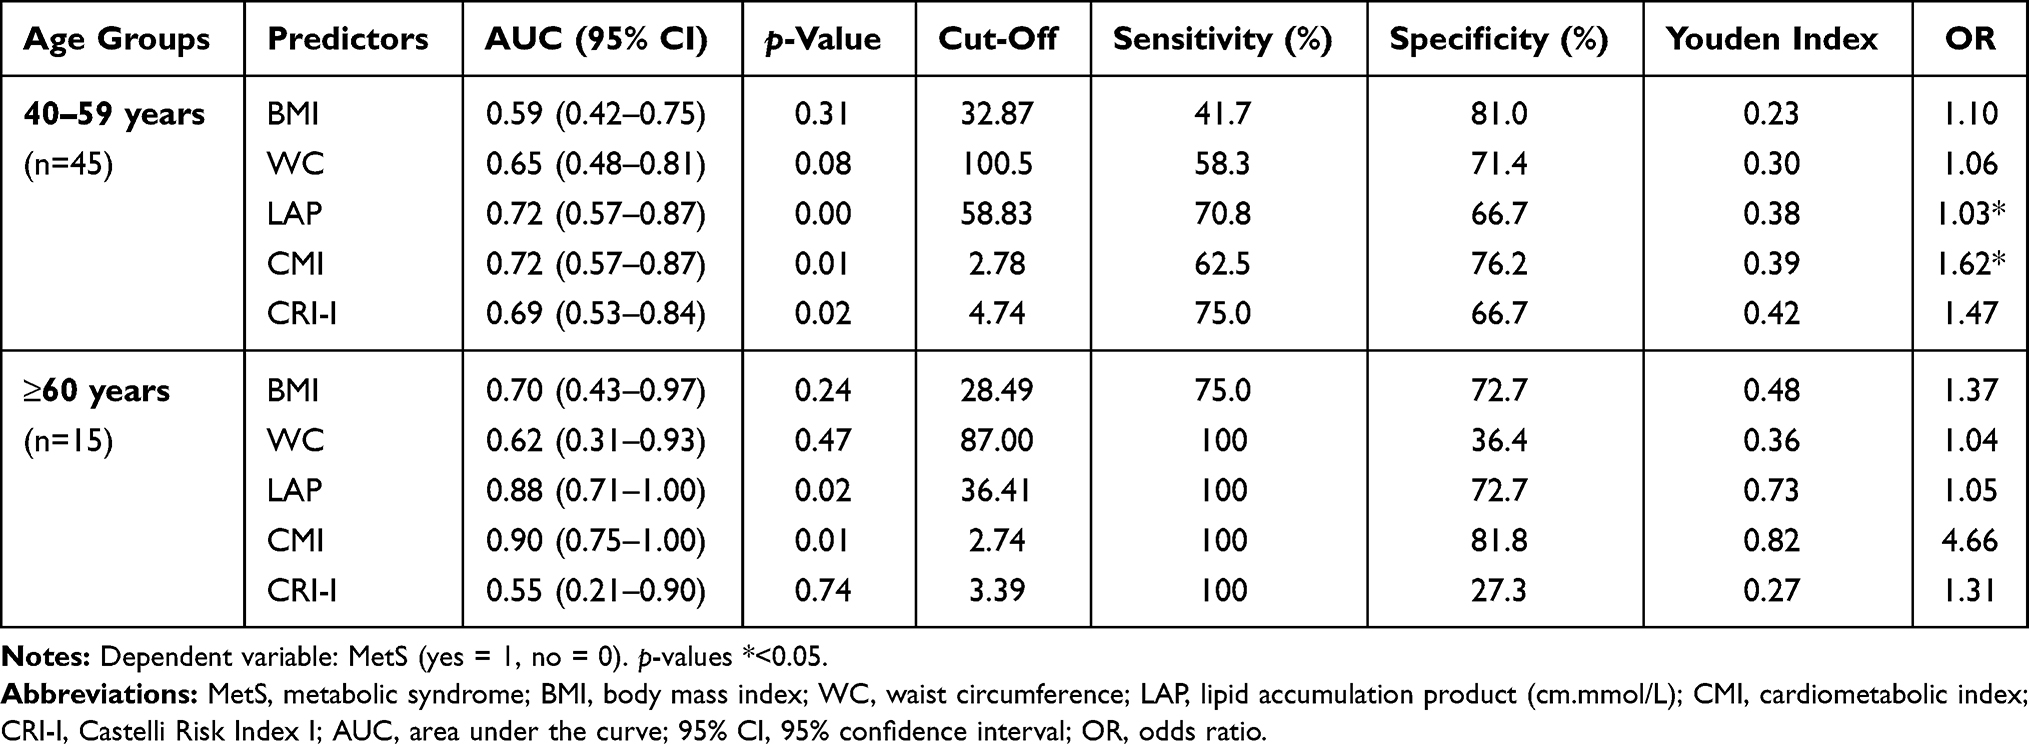 |
Table 5 Area Under the Receiver Operating Characteristics Curve and Cut-Off Points of the Indices Predicting MetS in Men (n=60) by Age Group |
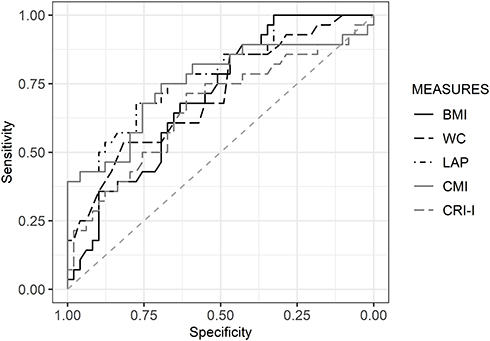 |
Figure 4 Area under the receiver operating characteristics curve of the anthropometric characteristics and lipid indices to predict MetS in men (n=60). |
Table 6 and Figure 5 present the AUCs of predictors (anthropometric indices and lipid parameters) in women. The AUC values were greater than 0.5 (p<0.05). In women aged 20–39 years (n=46), WC had the largest AUC (0.82), with a cut-off value of 91.50 cm. In women between 40 and 59 years of age (n=101), CMI was observed to be the best predictor, with an AUC of 0.90 and a cut-off value of 1.97. CMI reported the highest Youden Index (0.73) and OR (7.65). In women aged 60 years and above (n=26), LAP was found to have the highest AUC (0.96), Youden Index (0.95), and OR (1.14); the cut-off value was 42.06.
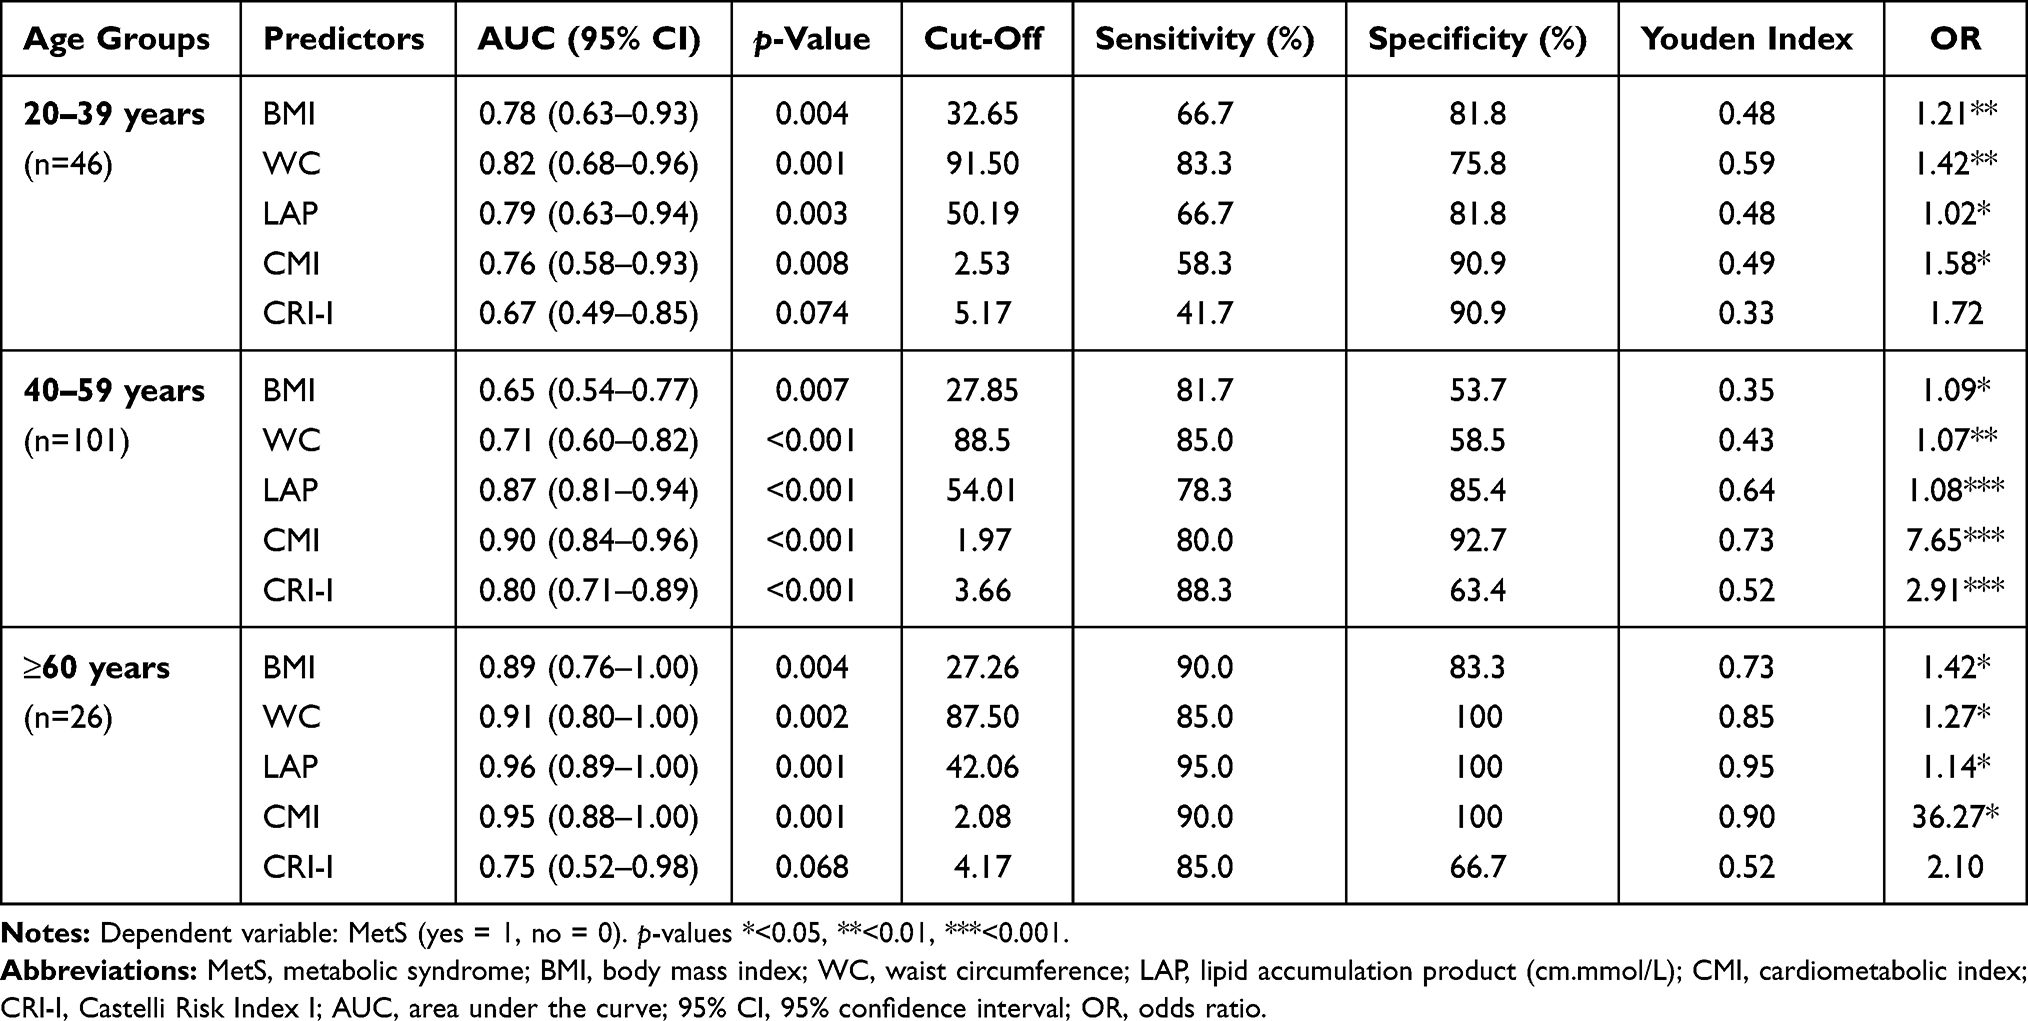 |
Table 6 Area Under the Receiver Operating Characteristics Curve and Cut-Off Points of the Indices Predicting MetS in Women (n=173) by Age Group |
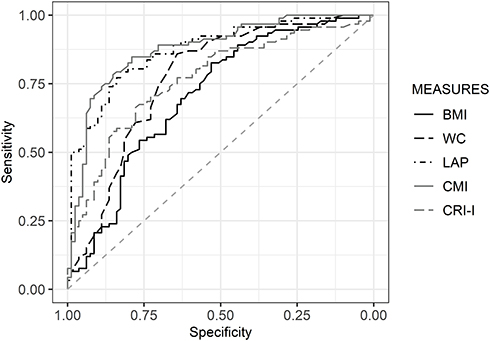 |
Figure 5 Area under the receiver operating characteristics curve of the anthropometric characteristics and lipid indices to predict MetS in women (n=173). |
Discussion
We observed a high prevalence of MetS (48%) in the sample. Among the MetS components, the most frequent health problems were elevated levels of triglycerides (54.5%) in men and low levels of HDL-C (72.9%) in women, but triglycerides were observed to the better predictor for the risk of MetS in both sexes. Regarding the anthropometric indices and lipid parameters, CMI and LAP were other important predictors. The optimal cut-off values of the parameters showed higher values in men. The cut-off values decreased with age in men and women. To the best of our knowledge, this is the first study of its kind, at least from the Yucatan Peninsula in Mexico, that obtained optimal cut-off values and assessed the ability of the individual components and selected derived parameters to predict the risk of MetS.
The MetS prevalence found in this study (48%) was higher than that reported in a meta-analysis of MetS prevalence among adults in Mexico (41%).19 Most of the studies on the estimation of the prevalence of MetS in Mexico were based on samples from central and northern Mexico, and the highest frequency was 69%.19,20 Accumulating evidence indicates that MetS prevalence has been constantly increasing not only for high- but also for low- and middle-income countries.21,22 MetS and obesity can be considered major contributors to the problem of chronic diseases worldwide.23,24 Key risk factors for MetS were observed in this study: high prevalences of overweight (35.2%) and obesity (48.8%) were recorded. A high prevalence of obesity among adults was reported in the West South Central (37.5%) and East South Central (37.2%) provinces of the USA.25 That study also reported a high MetS prevalence (≥35%) in these regions.25
In the present study, elevated levels of triglycerides were the most frequent component (54.5%) in men and low levels of HDL-C (72.9%) in women. The results are in agreement with earlier reports;26,27 where high levels of triglycerides and low HDL-C were shown to be two of the most important components in estimating MetS prevalence among populations from central Mexico. Until now, only one study carried out in the Yucatan Peninsula has assessed the prevalence of MetS, reporting a high prevalence (49%), and estimated central obesity using WC (59.8%); hypertriglyceridemia (50%) was the most frequent health problem.28 It was evident in the present study that low HDL-C levels, elevated levels of triglycerides, and central obesity were the major health risks among adults with MetS in Yucatan. The diverse ethnic and genetic backgrounds and lifestyle habits of Mexican populations are the principal characteristics of the country. Yucatan is one of the states in Mexico with the highest prevalence of obesity and diabetes.2 Therefore, it is important to establish the optimal cut-off values of the individual MetS components for the early diagnosis of several health problems. Simple, cost-effective and reliable anthropometric indices or lipid parameters are the effective criteria in this regard.
The lack of consensus on the diagnostic criteria for MetS is an important issue. Owing to the differences in standards criteria (ATP III, IDF, AHA/NHLBI, and WHO) used to diagnose MetS and discrepancies in the cut-off values,29 it is often difficult to compare the results obtained in different studies. Results from our study revealed that the optimal cut-off values were different in men and women. In general, men showed higher values of optimal cut-offs of the parameters than those estimated among women, which conformed with the results obtained in previous studies.30 Regarding sex differences, with respect to the parameters in the present study, compared with other reports, the criteria proposed by ATP III, IDF, and AHA/NHLBI seem to be reliable in diagnosing MetS in Mexican populations.29 Most reports from Asian and African countries have, in general, found lower cut-off values of parameters than the corresponding values obtained in the studies on Mexican adults, especially for WC. A study carried out among Ethiopian adults showed WC cut-off values of 78.0 cm in women and 83.7 in men to diagnose MetS.31 Another study from Indonesia reported a WC cut-off value of 76.8 cm for adults,32 and in China, cut-off values of WC were ≥85 cm for men and ≥82 cm for women.33 A study from Merida, Mexico, estimated a WC cut-off value of 93 cm to identify central obesity among women aged 22–41 years with Mayan ethnic background.34 This result is similar to the WC cut-off value of 91.50 cm in women aged 20–39 years to identify MetS in our study.
Some of the anthropometric and lipid indices that were analyzed as predictors in the present study showed significant ability to estimate the risk of MetS. In general, AUC values of the parameters were higher among women than men. The vast majority of the studies in Mexico that explored the utility of some indices as predictors focused on WC, BMI, and waist-to-height ratio (WHtR). In a study from Guerrero (central Mexico), WC was the best predictor,with an AUC of 0.85, followed by BMI and WHtR, with AUCs of 0.79 and 0.63, respectively.35 However, the results from our study showed that WC was a good predictor in women.
A new era of the use of anthropometric indices and lipid parameters has recently started. For example, LAP, CMI, and CRI-I were found to be effective proxy indicators of several health problems, including CVDs36,37 and chronic kidney diseases.38,39 However, the predictive power of these parameters did not match between studies representing different populations. The parameters have not been explored in Mexican populations before. Kahn described LAP for the first time in 2005; since then, this parameter has been widely used in different populations.40 A cross-sectional study among middle-aged and older Korean men and women investigated the usefulness of LAP and WHtR as predictors for MetS; LAP (AUC=0.92) had higher accuracy in the diagnosis.41 In women with polycystic ovary syndrome, LAP has been found to be a useful marker to screen subjects susceptible to diabetes and other insulin resistance-related comorbidities, including CVD.42 A study by Rivera-Mancía et al among the residents of Mexico City reported that LAP was strongly associated with prehypertension.43 In 2015, Wakabayashi and Daimon introduced and evaluated CMI among Japanese men and women and reported that this parameter was a good predictor of both coronary artery disease and MetS.14 In our study, both LAP and CMI have been observed to be effective indicators in predicting MetS among men and women. Studies have reported that interactions of lipid ratios can reveal important and additional information for patients with chronic diseases such as dyslipidemia and MetS.19 In our study, CRI-I was shown to be a good predictor among women aged 40 years and above and among men aged 40–59 years. However, LAP and CMI were found to be better predictors of MetS than CRI-I.
The optimal cut-off values of anthropometric indices and lipid parameters as predictors of MetS in a Mexican population were assessed in the present study. It is known that values can vary widely depending on the lifestyle habits of people in different populations. Our results showed that the cut-off value for WC was similar to the one that has been established before, following the standard criteria to diagnose MetS. However, BMI showed a higher cut-off value (27.85 kg/m2); this disparity between the actual and expected global average of BMI may be due to the relatively short adult height in the study population (152.9±9.35 cm). Overall, the cut-off values of parameters were higher than in other reports,5,14,31,37 which may be due to the high prevalences of obesity and diabetes in the Mexican population.2,44 The cut-off values reported here could be considered for further verification in future studies.
Limitations and Strengths
The present work has some limitations. The study was cross-sectional in nature, which limits the interpretation of causality of the association of anthropometric and lipid indices with MetS. Even though several variables were integrated, information on other potential confounders such as environmental factors, dietary habits, and genetic predispositions was not considered. Despite these limitations, our study has contributed some important data from Mexico. The findings provide the first evidence from this region of the optimal cut-off values of anthropometric and lipid indices to predict MetS.
Conclusion
Establishing the indicators for effective and easy diagnosis of MetS is crucial, especially in clinical settings where resources are very limited, particularly in the Yucatan Peninsula. In summary, our study reports a high prevalence of MetS in Mexican adults. In addition, CMI and LAP were found to be effective indicators to predict the risk of MetS. However, given the limitations of our study, further well-designed longitudinal studies are warranted to confirm our findings.
Abbreviations
AUC, area under the ROC curve; BMI, body mass index; CMI, cardiometabolic index; CVD, cardiovascular disease; CRI-I, Castelli Risk Index I; DBP, diastolic blood pressure; FPG, fasting plasma glucose; HDL-C, high-density lipoprotein cholesterol; LAP, lipid accumulation product; MetS, metabolic syndrome; NCDs, non-communicable diseases; T2DM, type 2 diabetes mellitus; ROC, receiver operating characteristics; SBP, systolic blood pressure; TG, triglycerides; WC, waist circumference.
Data Sharing Statement
The authors agree to allow the publication and distribution of the materials submitted in all available forms, without limiting territory or language, provided that the material is accepted for publication. The authors confirm that all information is original and free from plagiarism.
Ethics Approval and Consent to Participate
This study was part of a project titled Prevalence of Metabolic Syndrome, its components and its relationship with the levels of IL-6, TNF-α, CPR and expression of incretins receptors among outpatients of the Regional Hospital of High Specialty Hospital of the Yucatan Peninsula (HRAEPY) (no. 2017-025), which has been approved by the Research Committee and the Ethics Committee from the Regional High Speciality Hospital of the Yucatan Peninsula (no. CONBIOETICA-31-CEI-002-20170731).
Consent for Publication
The authors agree to allow the publication, and declare that the submitted work has not been presented and will not be published elsewhere in any language, and the published article will not be shared with anyone without the earlier written permission of the publisher, except for academic purposes.
Acknowledgments
The authors are very grateful to the participants. Also, we would like to thank Mr. Julio Vega for helping in data analysis and Mr. Rodrigo García and Ms. Sarhaí Herrera for other support.
Author Contributions
All authors made substantial contributions to conceptualization, design, acquisition of data, analysis and interpretation of data and results; took part in drafting the article and revising it critically for important intellectual content; agreed to submit to the current journal; gave final approval of the version to be published; and agreed to be accountable for all aspects of the work.
Funding
The present study did not receive any specific research grants from public, commercial, or non-profit agencies.
Disclosure
The authors declare no competing interests in this work.
References
1. Forouzanfar MH, Afshin A, Alexander LT, et al. Global, regional, and national comparative risk assessment of 79 behavioural, environmental and occupational, and metabolic risks or clusters of risks, 1990–2015: a systematic analysis for the Global Burden of Disease Study 2015. Lancet. 2016;388(10053):1659–1724.
2. de Salud S; Instituto Nacional de Salud Pública, Instituto Nacional de Estadística y Geografía. Encuesta Nacional de Salud y Nutrición (ENSANUT) 2018. Presentación De Resultados. 2018.
3. Alberti K, Eckel RH, Grundy SM. International diabetes federation task force on epidemiology and prevention; national heart, lung, and blood institute; American heart association; world heart federation; international atherosclerosis society; international association for the study of obesity: harmonizing the metabolic syndrome: a joint interim statement of the international diabetes federation task force on epidemiology and prevention; national heart, lung, and blood institute; American heart association; world heart federation; international atherosclerosis society; and international association for the study of obesity. Circulation. 2009;120:1640–1645. doi:10.1161/CIRCULATIONAHA.109.192644
4. Bozkurt B, Aguilar D, Deswal A, et al. Contributory risk and management of comorbidities of hypertension, obesity, diabetes mellitus, hyperlipidemia, and metabolic syndrome in chronic heart failure: a scientific statement from the American Heart Association. Circulation. 2016;134(23):e535–e578. doi:10.1161/CIR.0000000000000450
5. Adejumo EN, Adejumo AO, Azenabor A, et al. Anthropometric parameter that best predict metabolic syndrome in South west Nigeria. Diabetes Metab Syndr. 2019;13(1):48–54. doi:10.1016/j.dsx.2018.08.009
6. Wang H, Liu A, Zhao T, et al. Comparison of anthropometric indices for predicting the risk of metabolic syndrome and its components in Chinese adults: a prospective, longitudinal study. BMJ Open. 2017;7(9):e016062. doi:10.1136/bmjopen-2017-016062
7. Elsayed EF, Sarnak MJ, Tighiouart H, et al. Waist-to-hip ratio, body mass index, and subsequent kidney disease and death. Am J Kidney Dis. 2008;52(1):29–38. doi:10.1053/j.ajkd.2008.02.363
8. Nimmanapalli HD, Kasi AD, Devapatla P, Nuttakki V. Lipid ratios, atherogenic coefficient and atherogenic index of plasma as parameters in assessing cardiovascular risk in type 2 diabetes mellitus. Int J Res Med Sci. 2016;4(7):2863–2869. doi:10.18203/2320-6012.ijrms20161966
9. Aguilar-Morales I, Colin-Ramirez E, Rivera-Mancía S, Vallejo M, Vázquez-Antona C. Performance of waist-to-height ratio, waist circumference, and body mass index in discriminating cardio-metabolic risk factors in a sample of school-aged Mexican children. Nutrients. 2018;10(12):1850. doi:10.3390/nu10121850
10. Gnatiuc L, Alegre-Díaz J, Wade R, et al. General and abdominal adiposity and mortality in Mexico City: a prospective study of 150 000 adults. Ann Intern Med. 2019;171(6):397–405. doi:10.7326/M18-3502
11. Wei M, Gaskill SP, Haffner SM, Stern MP. Waist circumference as the best predictor of Noninsulin Dependent Diabetes Mellitus (NIDDM) compared to body mass index, waist/hip ratio and other anthropometric measurements in Mexican Americans—a 7-year prospective study. Obes Res. 1997;5(1):16–23. doi:10.1002/j.1550-8528.1997.tb00278.x
12. Rodea-Montero ER, Evia-Viscarra ML, Apolinar-Jiménez E. Waist-to-height ratio is a better anthropometric index than waist circumference and BMI in predicting metabolic syndrome among obese mexican adolescents. Int J Endocrinol. 2014;2014:195407. doi:10.1155/2014/195407
13. Xia C, Li R, Zhang S, et al. Lipid accumulation product is a powerful index for recognizing insulin resistance in non-diabetic individuals. Eur J Clin Nutr. 2012;66(9):1035–1038. doi:10.1038/ejcn.2012.83
14. Wakabayashi I, Daimon T. The “cardiometabolic index” as a new marker determined by adiposity and blood lipids for discrimination of diabetes mellitus. Clin Chim Acta. 2015;438:274–278. doi:10.1016/j.cca.2014.08.042
15. Bhardwaj S, Bhattacharjee J, Bhatnagar M, Tyagi S. Atherogenic index of plasma, castelli risk index and atherogenic coefficient-new parameters in assessing cardiovascular risk. Int J Pharm Biol Sci. 2013;3(3):359–364.
16. Scheaffer RL, Mendenhall W, Ott RL, Gerow KG. Elementary survey sampling. Cengage Learn. 2011.
17. WHO. Physical status: the use of and interpretation of anthropometry, Report of a WHO Expert Committee. 1995.
18. Pickering TG, Hall JE, Appel LJ, et al. Recommendations for blood pressure measurement in humans and experimental animals: part 1: blood pressure measurement in humans: a statement for professionals from the Subcommittee of Professional and Public Education of the American Heart Association Council on high blood pressure research. Circulation. 2005;111(5):697–716. doi:10.1161/01.CIR.0000154900.76284.F6
19. Gutiérrez-Solis AL, Datta Banik S, Méndez-González RM. Prevalence of metabolic syndrome in mexico: a systematic review and meta-analysis. Metab Syndr Relat Disord. 2018;16(8):395–405. doi:10.1089/met.2017.0157
20. Isordia-Salas I, Santiago-Germán D, Rodrìguez-Navarro H, et al. Prevalence of metabolic syndrome components in an urban Mexican sample: comparison between two classifications. Exp Diabetes Res. 2011;2012:2012. doi:10.1155/2012/202540
21. van Vliet-ostaptchouk JV, Nuotio M-L, Slagter SN, et al. The prevalence of metabolic syndrome and metabolically healthy obesity in Europe: a collaborative analysis of ten large cohort studies. BMC Endocr Disord. 2014;14(1):9. doi:10.1186/1472-6823-14-9
22. Sigit F, Tahapary D, Sartono E, et al. The prevalence of metabolic syndrome and its association with body fat distribution in a Dutch and Indonesian population. Atherosclerosis. 2019;287:e135–e136. doi:10.1016/j.atherosclerosis.2019.06.400
23. Lee EY, Han K, Kim DH, et al. Exposure-weighted scoring for metabolic syndrome and the risk of myocardial infarction and stroke: a nationwide population-based study. Cardiovasc Diabetol. 2020;19(1):1–12. doi:10.1186/s12933-020-01129-x
24. Banik SD, Cardoza RH, González RMM, Solis ALG. Fasting plasma glucose, lipid ratios, and atherogenic coefficient are the risk factors for hypertension in chronic kidney disease patients on hemodialysis: a report from the Regional High Speciality Hospital of Peninsular Yucatan, Mexico. Anthropol Rev. 2020;83(3):251–260. doi:10.2478/anre-2020-0019
25. Gurka MJ, Filipp SL, DeBoer MD. Geographical variation in the prevalence of obesity, metabolic syndrome, and diabetes among US adults. Nutr Diabetes. 2018;8(1):1–8. doi:10.1038/s41387-018-0024-2
26. Murguía-Romero M, Jiménez-Flores JR, Sigrist-Flores SC, et al. Prevalence of metabolic syndrome in young Mexicans: a sensitivity analysis on its components. Nutr Hosp. 2015;32(1):189–195. doi:10.3305/nh.2015.32.1.9031
27. Rojas R, Aguilar-Salinas CA, Jiménez-Corona A, et al. Metabolic syndrome in Mexican adults: results from the National Health and Nutrition Survey 2006. Salud Publica Mex. 2010;52(Suppl 1):S11–18. doi:10.1590/S0036-36342010000700004
28. Castro-Sansores Carlos JH-EV, Arjona-Villicaña R. Prevalencia de Síndrome Metabólico en sujetos adultos que viven en Mérida, Yucatán, México. Rev Biomed. 2011;22:49–58.
29. Grundy SM, Brewer HB, Cleeman JI, Smith SC, Lenfant C. Definition of metabolic syndrome: report of the National Heart, Lung, and Blood Institute/American Heart Association conference on scientific issues related to definition. Circulation. 2004;109(3):433–438. doi:10.1161/01.CIR.0000111245.75752.C6
30. Llinás MG, Janer PE, Agudo SG, Casquero RG, González IC. Utilidad en enfermería de diferentes índices antropométricos y analíticos para valorar la existencia de síndrome metabólico con los criterios NCEP ATPIII e IDF en población mediterránea española. Medicina Balear. 2017;32(1):26–34.
31. Sinaga M, Worku M, Yemane T, et al. Optimal cut-off for obesity and markers of metabolic syndrome for Ethiopian adults. Nutr J. 2018;17(1):109. doi:10.1186/s12937-018-0416-0
32. Hastuti J, Kagawa M, Byrne NM, Hills AP. Determination of new anthropometric cut-off values for obesity screening in Indonesian adults. Asia Pac J Clin Nutr. 2017;26(4):650–656. doi:10.6133/apjcn.072016.09
33. He J, Ma R, Liu J, et al. The optimal ethnic-specific waist-circumference cut-off points of metabolic syndrome among low-income rural Uyghur adults in Far western China and implications in preventive public health. Int J Environ Res. 2017;14(2):158.
34. Banik SD, Dickinson F. Waist circumference cut-off in relation to body mass index and percentage of body fat in adult women from Merida, Mexico. Anthropol Anz. 2015;72(4):369–383. doi:10.1127/anthranz/2015/0525
35. Domínguez-Reyes T, Quiroz-Vargas I, Salgado-Bernabé AB, Salgado-Goytia L, Muñoz-Valle JF, Parra-Rojas I. Las medidas antropométricas como indicadores predictivos de riesgo metabólico en una población mexicana. Nutr Hosp. 2017;34(1):96–101. doi:10.20960/nh.983
36. Hosseinpanah F, Barzin M, Mirbolouk M, Abtahi H, Cheraghi L, Azizi F. Lipid accumulation product and incident cardiovascular events in a normal weight population: Tehran Lipid and Glucose Study. Eur J Prev Cardiol. 2016;23(2):187–193. doi:10.1177/2047487314558771
37. Shi W-R, Wang H-Y, Chen S, Guo X-F, Li Z, Sun Y-X. Estimate of prevalent diabetes from cardiometabolic index in general Chinese population: a community-based study. Lipids Health Dis. 2018;17(1):236. doi:10.1186/s12944-018-0886-2
38. Biyik Z, Guney I. Lipid accumulation product and visceral adiposity index: two new indices to predict metabolic syndrome in chronic kidney disease. Eur Rev Med Pharmacol Sci. 2019;23(5):2167–2173. doi:10.26355/eurrev_201903_17262
39. Wang H-Y, Shi W-R, Yi X, Wang S-Z, Luan S-Y, Sun Y-X. Value of reduced glomerular filtration rate assessment with cardiometabolic index: insights from a population-based Chinese cohort. BMC Nephrol. 2018;19(1):294. doi:10.1186/s12882-018-1098-8
40. Kahn HS. The “lipid accumulation product” performs better than the body mass index for recognizing cardiovascular risk: a population-based comparison. BMC Cardiovasc Disord. 2005;5(1):26. doi:10.1186/1471-2261-5-26
41. Shin K-A, Kim Y-J. Usefulness of surrogate markers of body fat distribution for predicting metabolic syndrome in middle-aged and older Korean populations. Diabetes Metab Syndr Obes. 2019;12:2251. doi:10.2147/DMSO.S217628
42. Nascimento JXPT, da Costa Chein MB, de Sousa RML, Dos Santos Ferreira A, Navarro PA, Brito LMO. Importance of lipid accumulation product index as a marker of CVD risk in PCOS women. Lipids Health Dis. 2015;14(1):62. doi:10.1186/s12944-015-0061-y
43. Rivera-Mancía S, Colín-Ramírez E, Cartas-Rosado R, Infante O, Vargas-Barrón J, Vallejo M. Indicators of accumulated fat are stronger associated with prehypertension compared with indicators of circulating fat: a cross-sectional study. Medicine. 2018;97(34):e11869. doi:10.1097/MD.0000000000011869
44. Loria A, Arroyo P, Fernandez V, Pardio J, Laviada H. Prevalence of obesity and diabetes in the socioeconomic transition of rural Mayas of Yucatan from 1962 to 2000. Ethn Health. 2020;25(5):679–685. doi:10.1080/13557858.2018.1442560
 © 2021 The Author(s). This work is published and licensed by Dove Medical Press Limited. The full terms of this license are available at https://www.dovepress.com/terms.php and incorporate the Creative Commons Attribution - Non Commercial (unported, v3.0) License.
By accessing the work you hereby accept the Terms. Non-commercial uses of the work are permitted without any further permission from Dove Medical Press Limited, provided the work is properly attributed. For permission for commercial use of this work, please see paragraphs 4.2 and 5 of our Terms.
© 2021 The Author(s). This work is published and licensed by Dove Medical Press Limited. The full terms of this license are available at https://www.dovepress.com/terms.php and incorporate the Creative Commons Attribution - Non Commercial (unported, v3.0) License.
By accessing the work you hereby accept the Terms. Non-commercial uses of the work are permitted without any further permission from Dove Medical Press Limited, provided the work is properly attributed. For permission for commercial use of this work, please see paragraphs 4.2 and 5 of our Terms.