")
Back to Journals » Cancer Management and Research » Volume 10
Evaluation and prediction of hepatocellular carcinoma prognosis based on molecular classification
Authors Ke K, Chen G, Cai Z, Huang Y, Zhao B , Wang Y , Liao N , Liu X, Li Z , Liu J
Received 28 June 2018
Accepted for publication 9 September 2018
Published 5 November 2018 Volume 2018:10 Pages 5291—5302
DOI https://doi.org/10.2147/CMAR.S178579
Checked for plagiarism Yes
Review by Single anonymous peer review
Peer reviewer comments 2
Editor who approved publication: Dr Xueqiong Zhu
Kun Ke,1–3,* Geng Chen,2–4,* Zhixiong Cai,2–4 Yanbing Huang,1–3 Bixing Zhao,2,3 Yingchao Wang,2,3 Naishun Liao,2,3 Xiaolong Liu,2,3 Zhenli Li,2,3 Jingfeng Liu1–3,5
1The First Affiliated Hospital of Fujian Medical University, Fuzhou 350005, China; 2The United Innovation of Mengchao Hepatobiliary Technology Key Laboratory of Fujian Province, Mengchao Hepatobiliary Hospital of Fujian Medical University, Fuzhou 350025, China; 3The Liver Center of Fujian Province, Fujian Medical University, Fuzhou 350025, China; 4School of Life Science and Technology, Xi’an Jiaotong University, Xi’an 710049, China; 5Liver Disease Center, The First Affiliated Hospital of Fujian Medical University, Fuzhou 350005, China
*These authors contributed equally to this work
Purpose: Prediction of hepatocellular carcinoma (HCC) prognosis faced great difficulty due to tumor heterogeneity. We aimed to identify the prognosis-associated molecular subtypes existing in HCC patients and construct an evaluation model based on identified molecular classification.
Materials and methods: Non-negative matrix factorization consensus clustering was performed using 371 HCC patients from The Cancer Genome Atlas (TCGA) to identify molecular subtypes, based on the expression profile of the survival-associated genes. Signature genes for different subtypes were identified by Significance Analysis of Microarray and Prediction Analysis for Microarrays . Model for subtype discrimination and prognosis evaluation was established using binary logistic regression. The model and its clinical implications were further validated in GSE5436 cohort and Fujian cohort.
Results: Based on TCGA data, we observed two molecular subtypes with distinct clinical outcomes including significantly different overall survival, tumor differentiation, TNM stage, and vascular invasion (all P<0.05). The existence of these two molecular subtypes was further validated in five other Gene Expression Omnibus datasets. Furthermore, we constructed an evaluation model based on six subtype signature genes, which can discriminate different subtypes with the cutoff of 0.385. Meanwhile, both Cox regression analysis and stratification analysis showed that the calculated continuous prognostic value could also effectively indicate HCC prognosis, regardless of patients’ clinical conditions. The prognostic evaluation model was successfully validated in GSE54236 cohort and Fujian cohort.
Conclusion: Two prognostic molecular subtypes existed among HCC patients, which provided promising strategies for overcoming HCC heterogeneity and could be utilized in future clinical application for predicting HCC prognosis.
Keywords: hepatocellular carcinoma, transcriptome, molecular classification, prognosis evaluation, HCC heterogeneity
Introduction
Currently, hepatocellular carcinoma (HCC) is the sixth most prevalent malignancy and the third leading cause of cancer-related mortality worldwide, resulting in ~745,500 deaths globally, half of whom are Chinese patients.1,2 Although partial hepatectomy is considered as the most promising treatment for primary liver cancer cases, patients receiving surgical operation still suffer from high rates of recurrence and metastasis after hepatectomy.3,4 Despite recent improvements in surgical technology and development of other novel treatments, the overall 5-year survival of HCC remains poor.
Assessment of the HCC prognostic risk would greatly benefit the application of available clinical treatments. Currently, prognosis assessment of HCC was mostly based on multiple well-applied staging systems including Barcelona Clinic Liver Cancer, TNM, Okuda staging system, and Child-Pugh grade.5 In recent years, since increasing reports suggested the importance of tumor biomarkers in the prediction of HCC prognosis, some staging or scoring systems incorporating biomarkers have also been developed, such as Cancer of the Liver Italian Program, Chinese University Prognostic Index, Japanese Integrated Staging score, and Advanced Liver Cancer Prognostic System Score.6 Additionally, a novel scoring system has been developed using five serum markers including bilirubin, albumin, AFP-L3, alpha-fetoprotein (AFP), and DCP (named as BALAD).7 Though so many staging classifications and scoring systems exist, there is currently no globally validated classification.6,8 This inconsistency may stem from HCC heterogeneity with respect to liver function, tumor burden, and even regional differences.6
Recently, several studies that use molecular signatures have provided another promising strategy for the prediction of HCC prognosis.9,10 However, these predictions were based on some of the differentially expressed or manually curated genes, and the intrinsic features of the HCC heterogeneity were still neglected. We hypothesize that due to HCC heterogeneity, distinct molecular subtypes associated with HCC prognosis may exist in HCC patients, and prediction of the HCC prognosis based on the prognosis-associated subtypes would be more accurate and clinically significant.
In this study, we identified two prognostic subtypes with distinct biological features and clinical outcomes based on The Cancer Genome Atlas (TCGA) whole transcriptome data. Furthermore, based on the subtype signature genes, a prognostic evaluation model consisting of six genes was constructed. The prognostic evaluation model can discriminate HCC patients between different subtypes as well as provide an evaluation for patients’ prognosis, which have also been validated in another two independent cohorts. Thus, this molecular subtyping provided a promising strategy for overcoming HCC heterogeneity in prognosis evaluation and could be utilized in clinical application for accurately predicting HCC prognosis.
Materials and methods
External data source
TCGA expression data, follow-up, and clinical information of HCC samples were downloaded from the UCSC cancer browser (https://genome-cancer.ucsc.edu).11 Log2(x+1)-transformed RSEM normalized gene expression data (HiSeqV2) of 371 HCC patients were used for subsequent clustering. Additionally, expression data available for both primary HCC tissues and paired normal tissues were also extracted (n=50).
For validation purpose, datasets with available whole-genome expression data and follow-up data from Gene Expression Omnibus (GEO) database were also downloaded (accession number: GSE54236).12 The expression data were based on Agilent-014850 Whole Human Genome Microarray. For genes corresponding to multiple probes, geometric mean was calculated to represent the expression level. Finally, expression data of 78 HCC patients and 76 paired samples (tumor and paired normal tissue) were used for subsequent analysis. Meanwhile, another four GEO datasets with whole-transcriptome microarray data but no available survival information, including GSE9843,13 GSE20017,14 GSE36376,15 and GSE63938, were also adopted to validate the clustering results.
Identification of HCC prognosis subtypes
In order to discover HCC prognosis subtypes, HCC prognosis-associated genes were firstly identified based on TCGA HCC dataset. Whole transcriptome data of 371 primary HCC patients were achieved and all genes of low variance (variance <1) across all the HCC patients were excluded. Then, for patients with available follow-up and clinical information (n=308), genome-wide Cox regression assessing the associations of all the candidate genes with overall survival (OS) were conducted using R package “survival”. Multivariate Cox proportional hazards regression analysis using gender, age, and TNM stages as covariates was performed to identify genes that can act as independent factors for HCC prognosis prediction. Eventually, genes significantly affecting HCC OS (P<0.05) were used for sample clustering. Non-negative matrix factorization (NMF) clustering was performed on the expression profile of identified prognosis-associated genes for TCGA dataset samples. The same clustering method was also applied to GSE54236, GSE9843, GSE20017, GSE36376, and GSE63938 dataset for validation. Optimal number of clusters with maximum cophenetic coefficient was selected.
Identification and characterization of subtype-specific gene signatures
To minimize the impact of possible outliers, silhouette width was calculated to identify samples that were close to the center of its own clusters.16 Samples with negative value of silhouette width were excluded in subsequent analysis. Then genes differentially expressed among different subtypes were identified by Significance Analysis of Microarray (SAM) with cutoff of false discovery rate set to zero.17 Expression profiles of the SAM analysis-selected genes were further subjected to Prediction Analysis for Microarrays (PAM) to predict subtype-specific signature genes.18 Enrichment analysis for KEGG and Reactome pathway was performed via the web tool ConsensusPathDB to explore the pathways enriched in subtype-specific signature genes.19
Establishment and validation of HCC prognostic evaluation model
Prognostic model for subtype differentiation and prognosis evaluation was built based on the most representative genes of each subtype (absolute value of PAM score >0.5 for either subtype). Firstly, the subtype representative genes were screened based on conditional logistic regression using forward selection. The remaining genes in the conditional logistic regression model were then used to establish a prognostic model by binary logistic regression using generalized linear model function. The model for predicting the prognosis of HCC could be described as a linear combination of the selected subtype signature genes’ normalized expression value, which was weighted by regression coefficients from the logistic regression model. The association between the prognostic value calculated by the prognosis evaluation model and HCC patients’ OS was further assessed by multivariate Cox regression analysis. Receiver operating characteristic (ROC) curve was constructed to identify the optimal cutoff according to the maximal Youden index (sensitivity + specificity − 1).
Patient selection and tissue sample collection of Fujian cohort
HCC patients used for clinical evaluation of the prognosis model were recruited in Mengchao Hepatobiliary Hospital of Fujian Medical University from February 2014 to September 2015. The patients were further selected according to the following criteria: 1) patients were diagnosed with HCC by at least two experienced pathologists; 2) patients did not undergo any other antitumor therapy before receiving the first liver resection; and 3) patients did not die of nonliver disease-related causes. Based on above mentioned criteria, 113 HCC patients were enrolled and corresponding tissue samples were collected. Tumor specimens insufficient for RNA extraction were excluded. All tissue samples were collected and then frozen immediately at –80°C. The Institution Review Board of Mengchao Hepatobiliary Hospital of Fujian Medical University approved the collection of tissue samples. Meanwhile, all patients had signed the informed consents.
RNA extraction and real-time quantitative PCR analysis
The mRNA relative expression level was analyzed by real-time quantitative PCR (qPCR). Briefly, total RNA was extracted from HCC samples using TransZol Up RNA kit (TransGen Biotech Ltd., Beijing, China) according to the manufacturer’s protocol and the quality of RNA was measured by the NanoDrop 2000 (Thermo Fisher Scientific, Waltham, MA, USA). Then qualified RNA (1,000 ng) was reverse-transcribed following the manufacturer’s protocol of the Transcriptor First Strand cDNA Synthesis Kit (Roche Ltd., Basel, Switzerland). Finally, the relative expression levels were examined with the StepOnePlusTM real-time PCR system (AB Applied Biosystems, Foster City, CA, USA) using Bsetar® SybrGreen qPCR Mastermix (DBI, Ludwigshafen, Germany) following the manufacturer’s protocol. 18S rRNA was used as endogenous control. The sequences of all primers are shown in Table S1. The relative expression levels were calculated with the 2−ΔΔCt method.20
Statistical analysis
Chi-squared test for categorical variables was applied to examine the differences between the two HCC prognostic subtypes. The difference in expression levels of subtype-specific signature genes between HCC tissues and paired normal tissues was evaluated by Wilcoxon matched-pairs signed-rank test. Survival differences between the two subtypes were evaluated using Kaplan–Meier analysis, with significance assessed according to log-rank test.21 Univariate and multivariate Cox regression analysis were used to further identify the independent prognosis factors. A P-value of less than 0.05 was considered as statistically significant. All statistical analyses were carried out using SPSS 19.0 (SPSS Inc., Chicago, IL, USA) and GraphPad Prism 6.0 (GraphPad Software, San Diego, CA, USA).
Results
Identification of molecular subtypes associated with prognostic subtypes
To identify molecular subtypes associated with HCC prognosis, transcriptome data of 371 primary HCC patients were obtained from TCGA database (Figure 1). For patients with available follow-up and clinical information (n=308), genome-wide Cox regression analysis was performed, which was adjusted for gender, age, and TNM stage. As a result, a total of 774 genes significantly associated with OS were identified. Then, all these 371 HCC patients were clustered according to the expression profile of above mentioned 774 prognosis-associated genes using NMF consensus clustering. This analysis yielded clusters with highest stability (cophenetic coefficient =0.9946) when k=2 (Figure 2A). Using previously mentioned k=2 subtype classification, significant prognostic difference was observed (Cox regression P<0.0001, log-rank test P<0.0001, Figure 2B), with a longer median survival time (MST) for molecular subtype 1 (n=246, MST=81.9 months, 95% CI: 62.0–101.7) than molecular subtype 2 (n=102, MST=27.9 months, 95% CI: 13.1–42.7, P<0.0001). Meanwhile, the two molecular subtypes also showed significant differences in several clinical features including tumor differentiation (P=0.005), TNM stage (P=0.0001), vascular invasion (P=0.001), and serum AFP level (P=0.001) (Table 1).
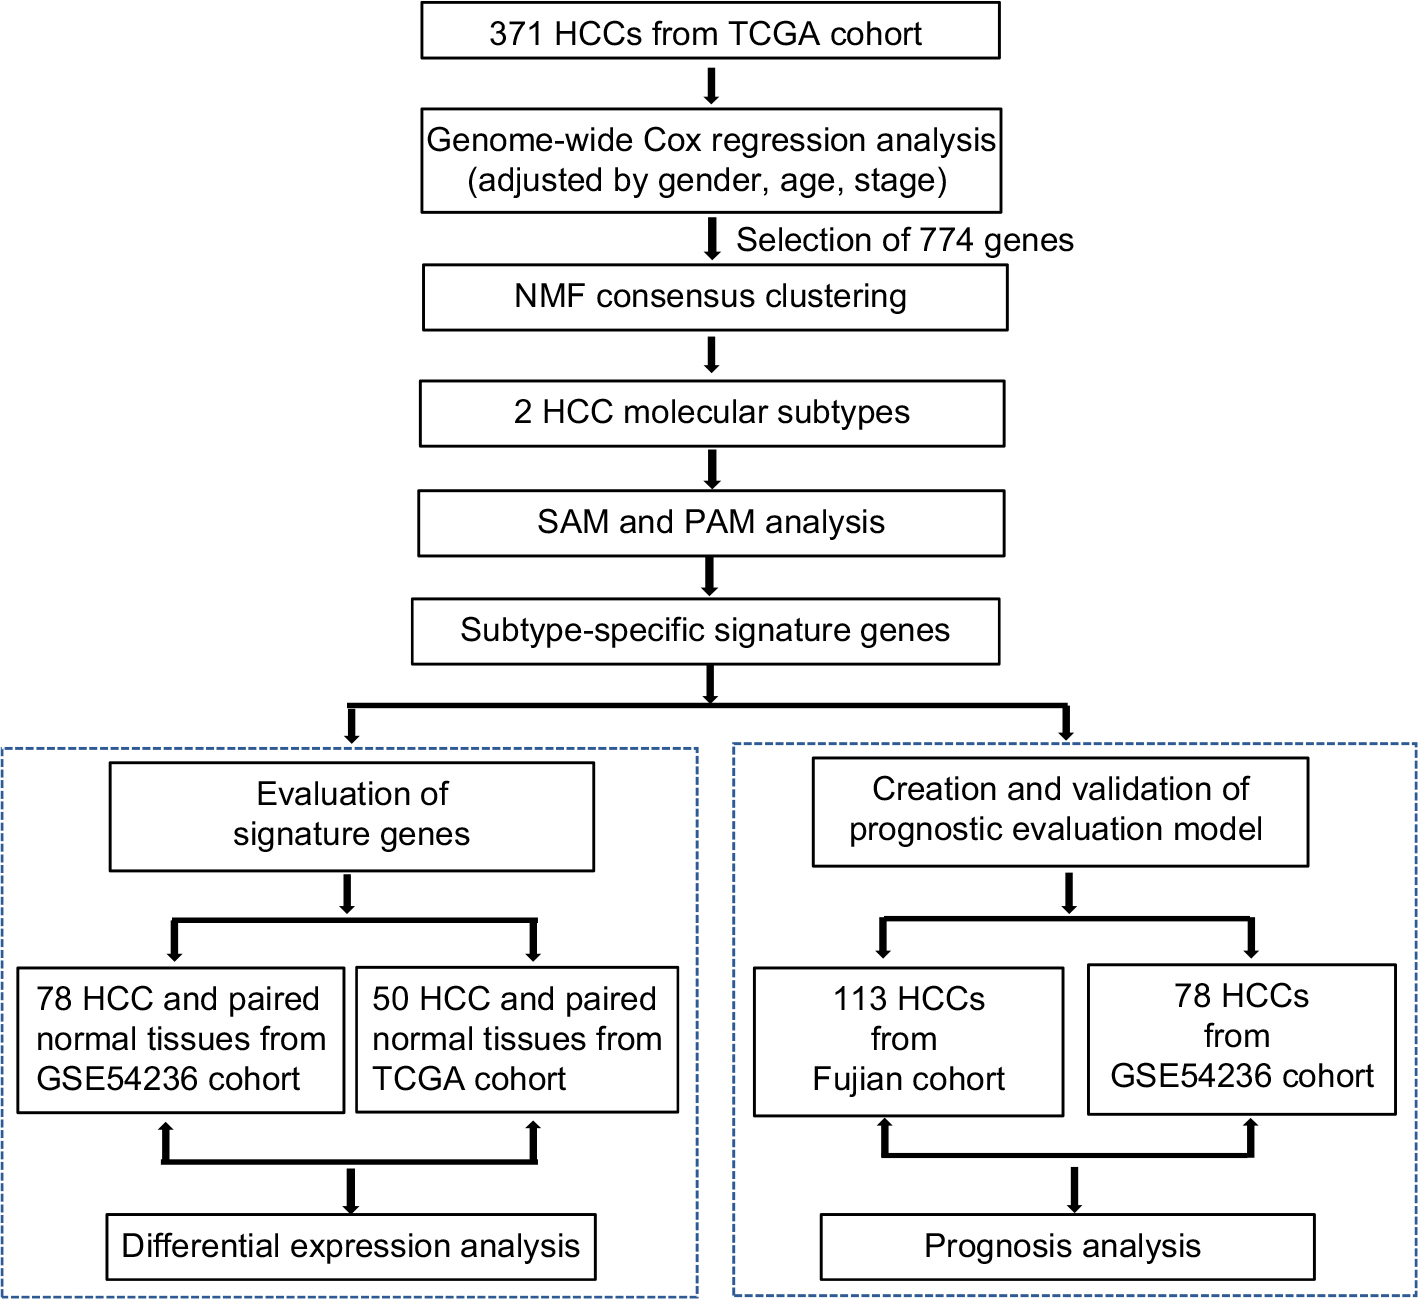 | Figure 1 Flow chart for the construction of the prognostic evaluation model. Abbreviations: HCC, hepatocellular carcinoma; TCGA, The Cancer Genome Atlas; NMF, non-negative matrix factorization; PAM, Prediction Analysis for Microarrays; SAM, Significance Analysis of Microarray. |
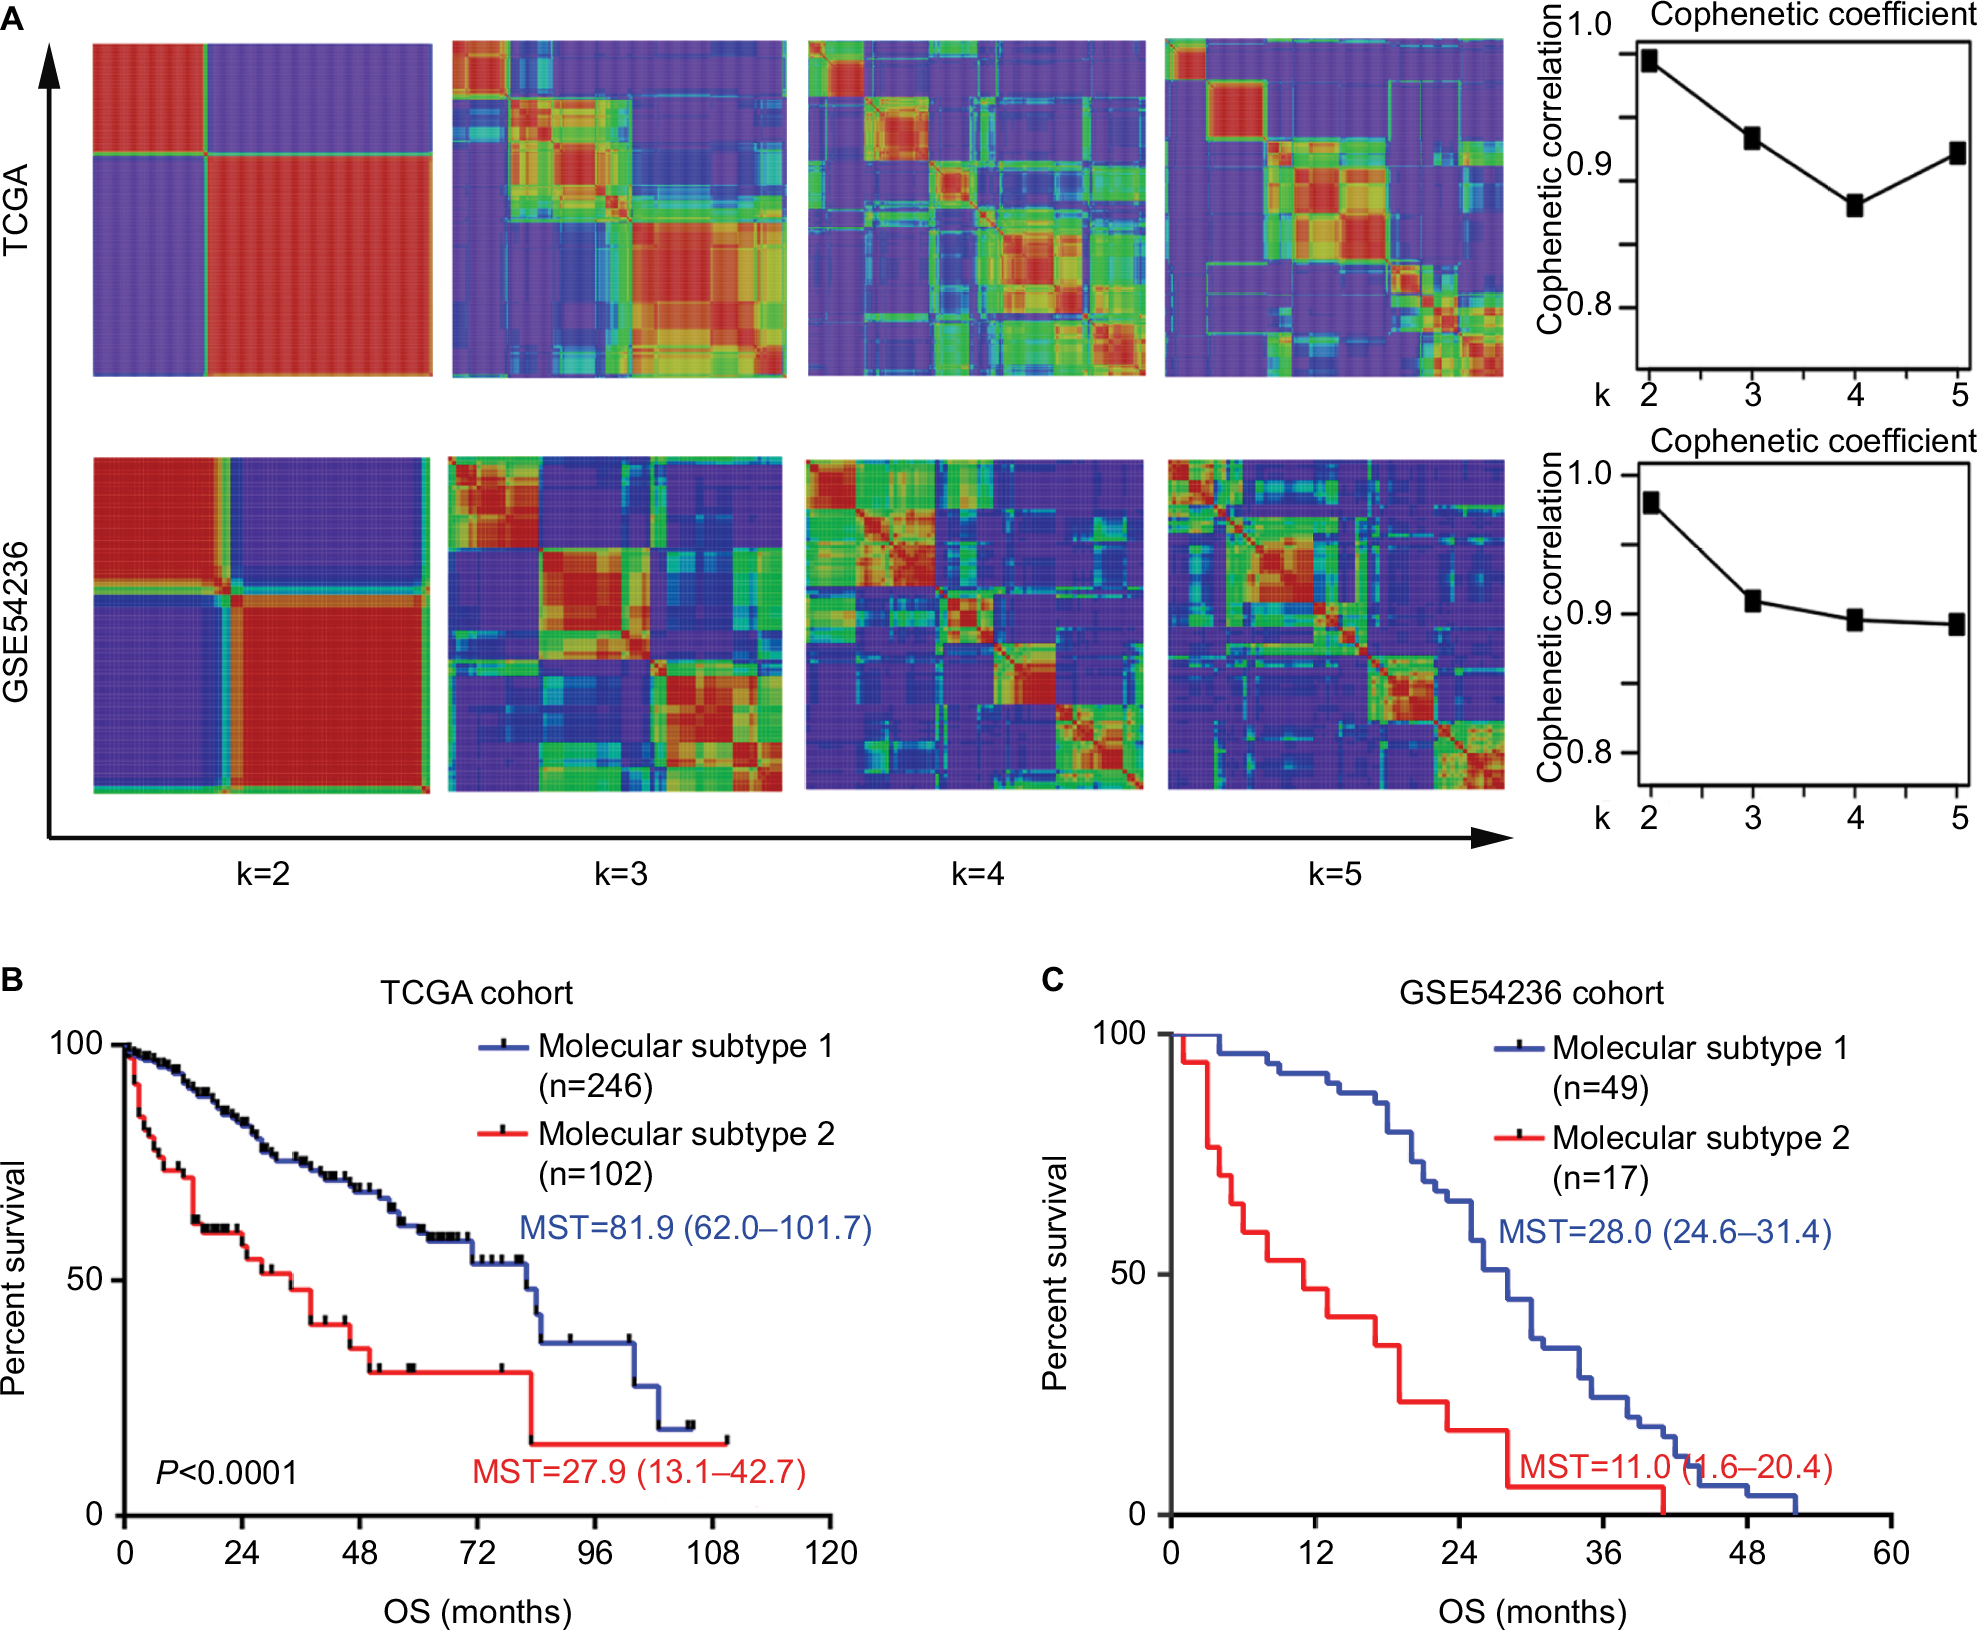 | Figure 2 Molecular subtype identification by NMF consensus clustering in TCGA and GSE54236 cohorts. Notes: (A) NMF clustering using all the 774 prognostic signature genes. Left: the clustering results using k=2–5 are shown for TCGA cohort and GSE54236 cohort. Right: the cophenetic correlation coefficient under corresponding k values. For both cohorts, optimal number of classifications were chosen with k=2, with highest cophenetic correlation coefficients and most harmonious models. The OS difference between the two molecular subtypes in (B) TCGA cohort and (C) GSE54236 cohort is illustrated. The P-values were calculated by log-rank test. Abbreviations: NMF, non-negative matrix factorization; MST, median survival time; OS, overall survival; TCGA, The Cancer Genome Atlas. |
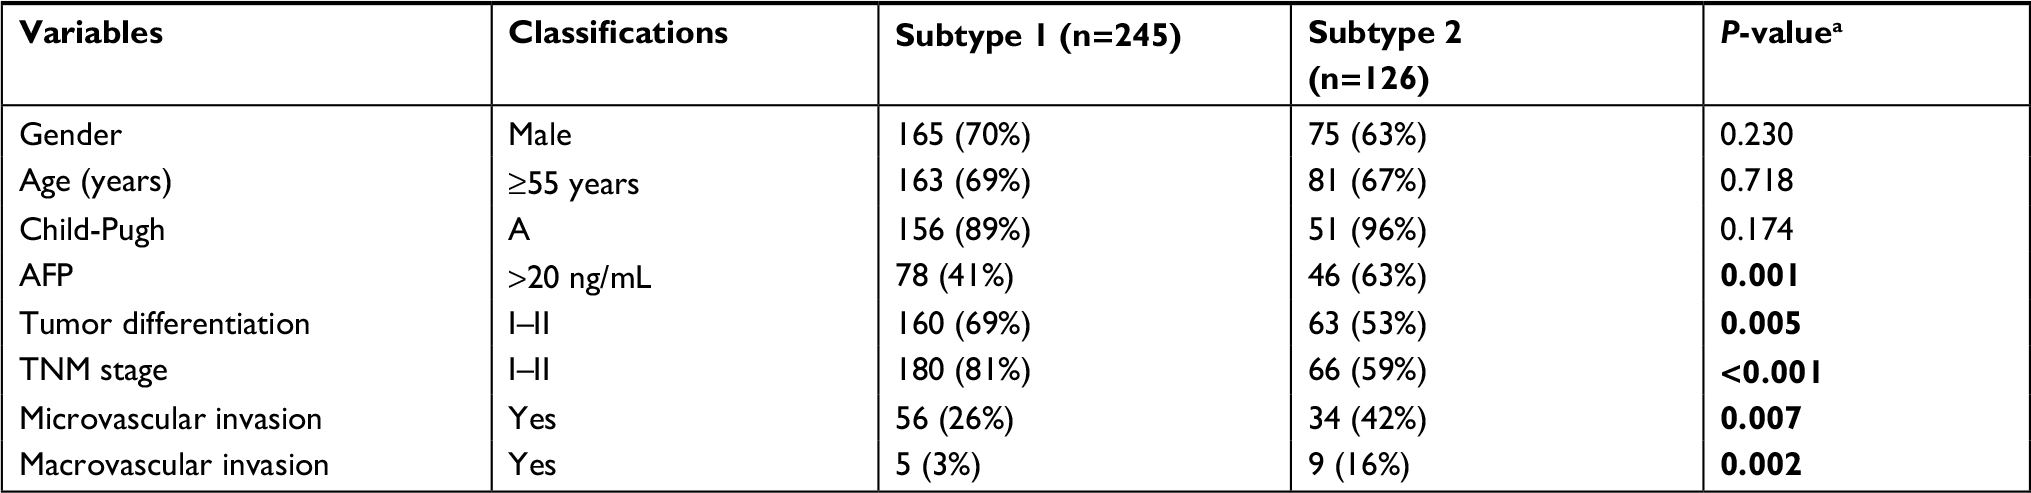 | Table 1 Clinicopathological features of HCC patients from different molecular subtypes Notes: Patients without available information regarding Child-Pugh, AFP, tumor differentiation, TNM stage, and vascular invasion were excluded in corresponding statistical analysis. aP-values were calculated using chi-squared test. Abbreviations: AFP, alpha-fetoprotein; HCC, hepatocellular carcinoma. |
To confirm the existence of these two prognostic-associated molecular subtypes in HCC, another five independent HCC datasets (GSE54236, GSE9843, GSE20017, GSE36376, and GSE63938) were adopted. Consistent with the above mentioned result, NMF consensus clustering according to the 774 prognostic genes also provided a strong evidence for two subtype classifications since correspondingly high cophenetic coeffcients were observed when k=2 for all the five datasets (Figure 2A and Figure S1). Furthermore, similar prognostic difference was also observed in the GSE54236 cohort (n=78, with available survival information), with molecular subtype 1 (n=49) showing a significantly longer OS time than that for molecular subtype 2 (n=17) (MST of molecular subtype 1: 28.0 months, 95% CI: 24.6–31.4; MST of molecular subtype 2: 11.0 months, 95% CI: 1.6–20.4, P<0.0001) (Figure 2C).
Transcriptome feature of the molecular subtypes associated with HCC prognosis
To better characterize the two molecular subtypes, SAM and PAM analyses were performed and 337 subtype-specific signature genes were identified, with 56 signature genes for molecular subtype 1 and 281 signature genes for molecular subtype 2 (Table S2). Pathway analysis of subtype-specific genes revealed that numerous “metabolism” associated pathways were significantly enriched for subtype 1 signature genes, while abundant pathways concerning “cell cycle” were observed for subtype 2 signature genes (Figure 3A and B, Table S3). Additionally, comparison of signature genes’ expression levels between HCC tissues and adjacent normal tissues revealed that signature genes of subtype 1 were significantly downregulated in HCC tissues, while signature genes of subtype 2 were significantly upregulated in HCC tissues (both P<0.0001, Figure 3C and 3D). To intuitively display the characteristics of the two prognostic subtypes, a heatmap was drawn based on the top 30 signature genes with highest PAM scores (Figure 3E). The result clearly showed that HCC patients were indeed divided into two distinct subtypes.
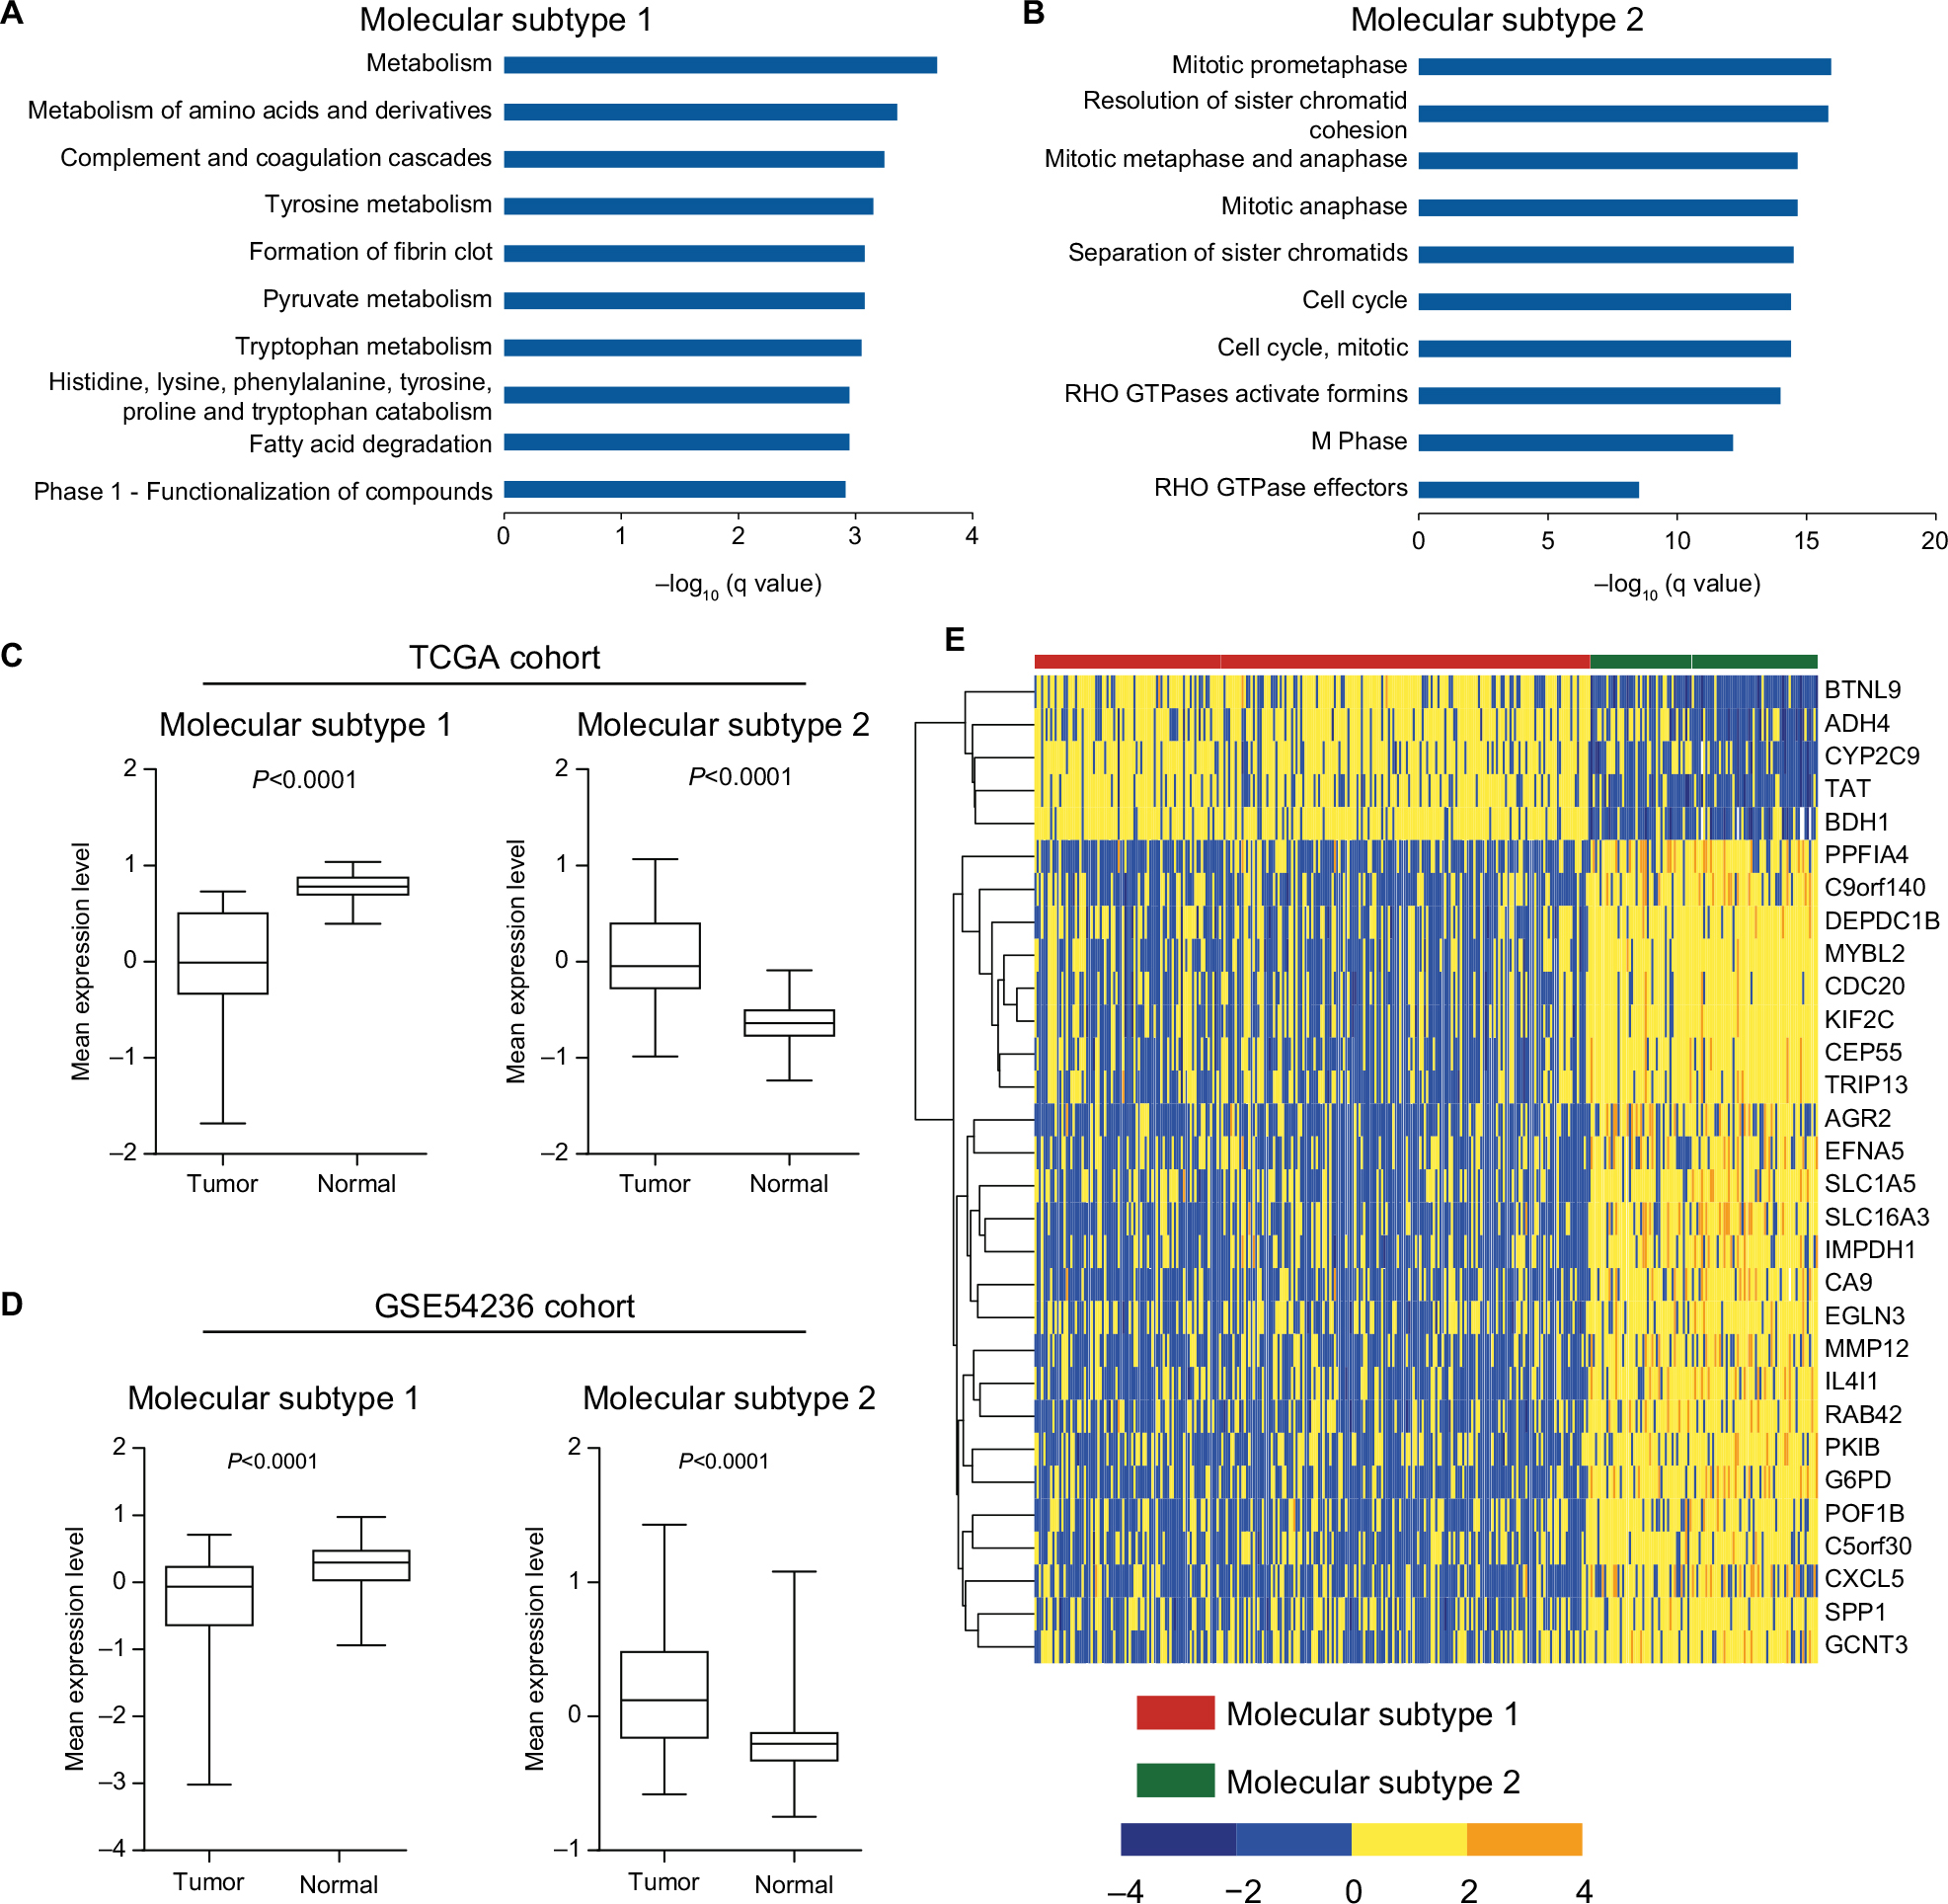 | Figure 3 Transcriptome features of the two molecular subtypes. Notes: Enrichment of KEGG and Reactome pathways of signature genes for (A) molecular subtype 1 and (B) molecular subtype 2. Only the top ten significantly enriched pathways are shown (the full list of significantly enriched pathways are given in Table S5). Differences of mean expression (z-score) of signature genes for molecular subtype 1 and molecular subtype 2 between HCC tumor and adjacent normal tissue in (C) TCGA cohort and (D) GSE54236 cohort are provided. P-values were calculated by Wilcoxon signed-rank test. (E) Heatmap of the top 30 signature genes with highest PAM scores in molecular subtype 1 and molecular subtype 2. Abbreviations: HCC, hepatocellular carcinoma; PAM, Prediction Analysis for Microarrays; TCGA, The Cancer Genome Atlas. |
Meanwhile, SAM and PAM analyses were also performed for GSE54236 dataset to identify subtype-specific signature genes. About 95.4% (104/109) of the identified subtype-specific signature genes overlapped with TCGA results. Convincingly, the expression of all 104 commonly identified signature genes in both datasets showed consistent patterns among these two subtypes (Table S4), demonstrating that the subtypes identified by the two independent datasets were intrinsically the same. As a validation, comparison of expression level of TCGA subtype-specific genes between HCC tissue and adjacent normal tissues was also performed in GSE54236 dataset. The analysis yielded similar results, with signature genes of molecular subtype 1 were significantly downregulated in HCC tissues, while signature genes of molecular subtype 2 were significantly upregulated in HCC tissue (each P<0.0001, Figure 3D). The results demonstrated that HCC patients could indeed be divided into two molecular subtypes with distinct expression features, which in turn affected their prognostic outcome.
Construction of the HCC prognostic evaluation model
Based on the above mentioned molecular characteristics of the existing two subtypes, a prognostic evaluation model was further constructed to provide an accurate prediction for HCC patients’ prognostic outcome. To minimize the impact of possible outliers, samples with negative value of silhouette width were excluded in subsequent model creating (n=25, Figure S2). Then logistic regression analysis with z-score normalized expression profile of the most representative genes from each subtype (absolute value of PAM score >0.5 for either subtype) was performed and six genes were included in the final model using forward selection. The established prognostic model of HCC using these six signature genes can efficiently distinguish two molecular subtypes and further predict HCC patients’ outcome.
The detailed prognostic evaluation model is as follows:
|
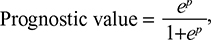
p = 1.64 * CA9 + 1.22 * CXCL5 + 1.52 * MMP12 + 1.93 * MYBL2 + 0.76 * SLC1A5 + 2.43 * G6PD - 3.86
Significant association between prognostic value and overall survival was observed via Cox regression analysis after adjusting for gender, age, and TNM stage (P<0.0001, Table S5). The optimal cutoff for maximum sensitivity and specificity was identified according to the maximal Youden index using ROC curves (Figure S3). A cutoff of 0.385 was selected with a sensitivity of 98% and a specificity of 96%, and the area under curve (AUC) was 0.992 (95% CI: 0.985–0.998). In addition, as shown by the ROC curves (Figure S3), the prognostic value showed better performance than any of the single genes in discriminating different molecular subtypes with highest AUC. Noteworthy, the molecular subtype defining using the prognostic evaluation model (based on the six-gene signature) or NMF clustering (using all the 774 prognostic genes) achieved almost perfect agreement, with Cohen’s kappa coefficient of 0.968.22
Validation of the prognostic model
To evaluate the accuracy of prognostic model based on the six-gene signature, we applied the model to GSE54236 cohort. Consistently, the prognostic value calculated from the model was significantly associated with overall survival among HCC patients (P=0.001) in Cox regression analysis. Additionally, higher prognostic value was also significantly associated with poorer survival after excluding samples with negative silhouette width (n=13) (P=1.2×10⁻⁴). Furthermore, our result also showed that the previous acquired cutoff of 0.385 could clearly divide HCC patients in GSE54236 into two subtypes with distinct prognostic outcome, regardless of not excluding or excluding the samples with negative silhouette width (P=0.0002 and P<0.0001, respectively, Figure 4A and B).
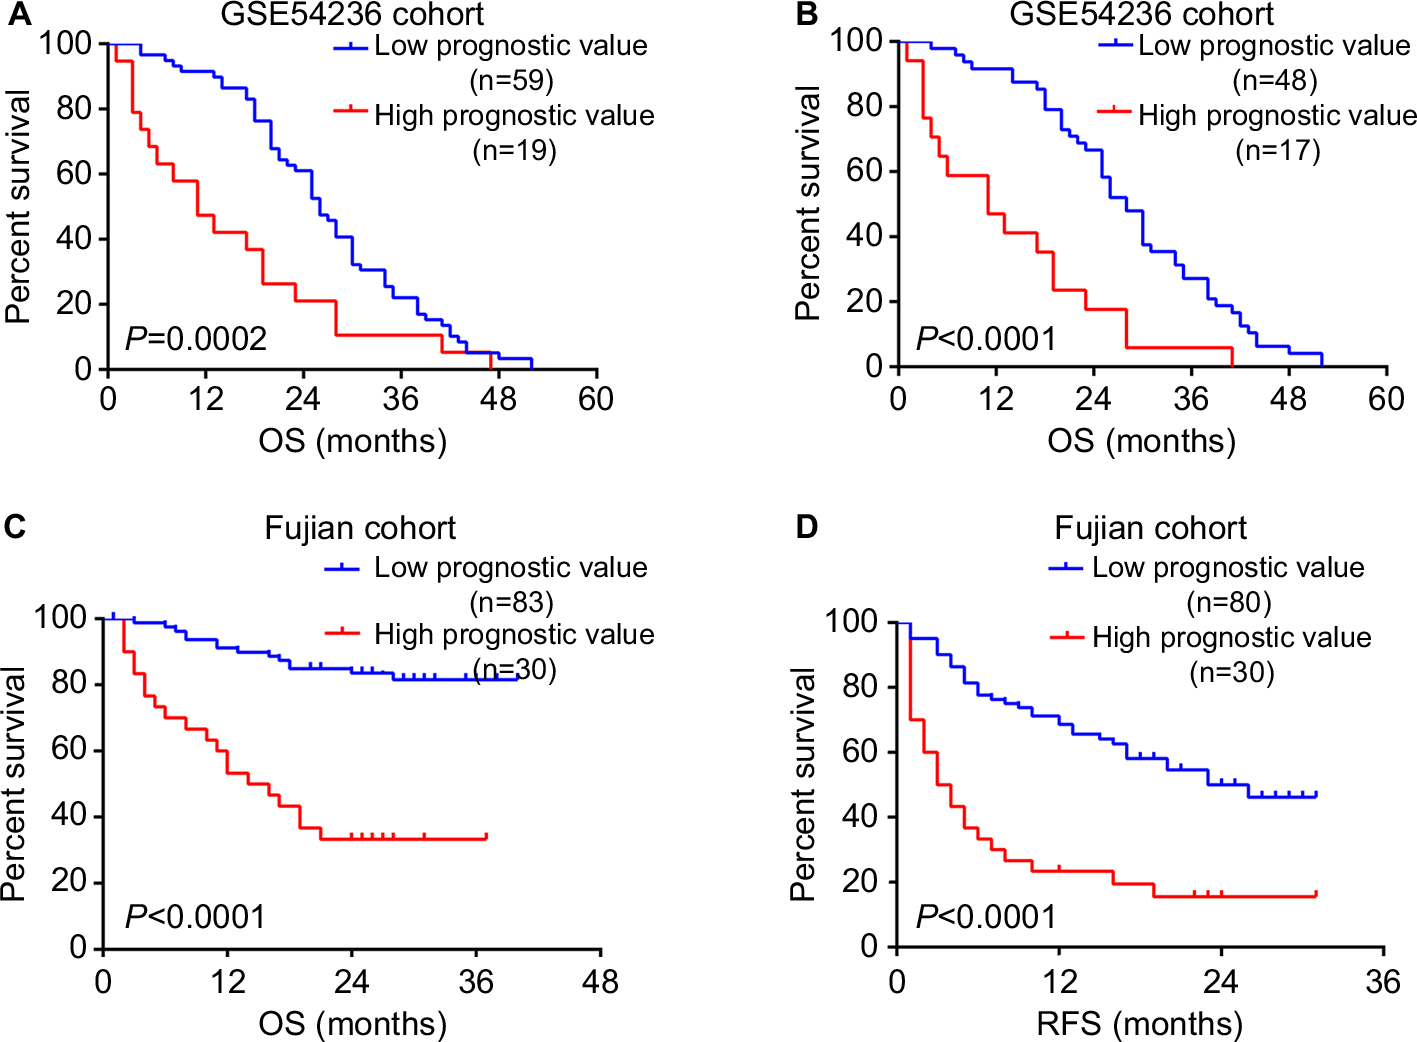 | Figure 4 Validation of the prognostic evaluation model. Notes: Kaplan–Meier survival analysis of HCC patients with high prognostic value and low prognostic value in GSE54236 cohort (A) without excluding and (B) excluding patients with negative silhouette width. The difference of (C) OS and (D) RFS was compared between HCC patients with high prognostic value and low prognostic value. The P-values were assessed by log-rank test. Abbreviation: HCC, hepatocellular carcinoma; OS, overall survival; RFS, recurrence free survival. |
Clinical implications of the prognostic evaluation model
The clinical implications of this prognostic model were further evaluated using an additional cohort recruited from Mengchao Hepatobiliary Hospital of Fujian Medical University. This cohort consisted of 113 patients, with their clinical information available in Table S6. Using primers designed for the six genes in the above mentioned model (Table S1), we detected the relative expression levels with real-time qPCR. To determine whether the calculated prognostic value of this model can serve as an independent risk factor, both univariate and multivariate Cox regression analyses were conducted. Univariate Cox analysis clearly indicated that continuous prognostic value was a significant indicator for overall survival (P<0.0001), with multiple clinical characteristics including TNM stage, tumor size, microvascular invasion, metastasis, and bilirubin showing significant association with overall survival (all P<0.05). Furthermore, multivariate analysis including prognostic value and all the significant pathological features confirmed that continuous prognostic value was indeed a strong independent indicator for HCC overall survival (P=0.0001) (Table 2).
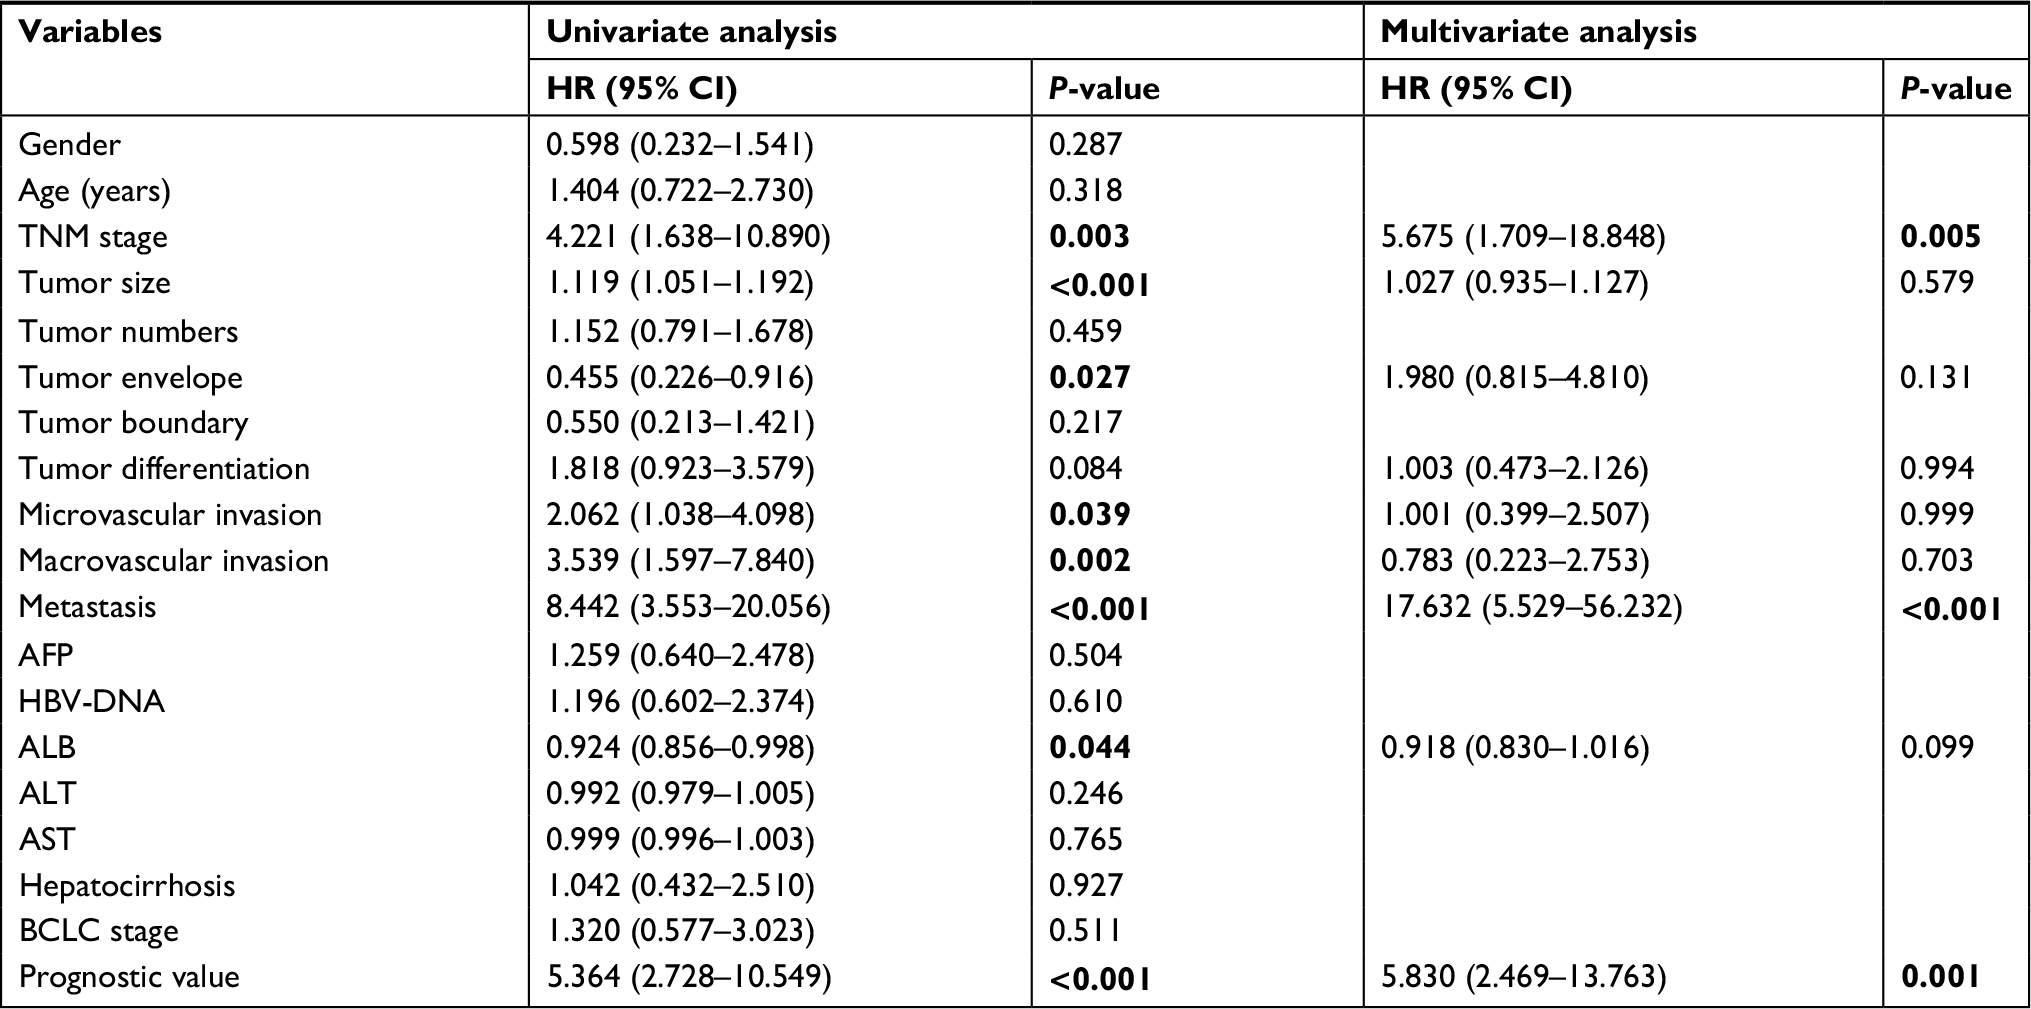 | Table 2 Univariate and multivariate Cox regression analyses of HCC patients in Fujian cohort Notes: HRs and P-values were calculated by univariate and multivariate Cox proportional hazards regression. P-values <0.05 were considered as significant and were highlighted in bold. Abbreviations: ALB, albumin; ALT, alanine aminotransferase; AST, aspartate aminotransferase; BCLC stage, Barcelona Clinic Liver Cancer stage. |
After confirming the clinical significance of this model’s prognostic value, we next investigated whether the previously identified cutoff of 0.385 can also differentiate HCC patients with distinct clinical outcomes in Fujian cohort. Kaplan–Meier survival analysis revealed that patients with high prognostic value (n=30) had significant shorter overall survival time and recurrence-free survival time than patients with low prognostic value (n=83) (both P<0.0001) (Figure 4C and D). In addition, patients with high prognostic value also have more unfavorable clinical outcomes such as larger tumor size (P<0.001), incomplete or no tumor envelope (P<0.001), poor differentiation (P<0.001), and macrovascular invasion (P=0.005) (Table 3) compared to patients with low prognostic value.
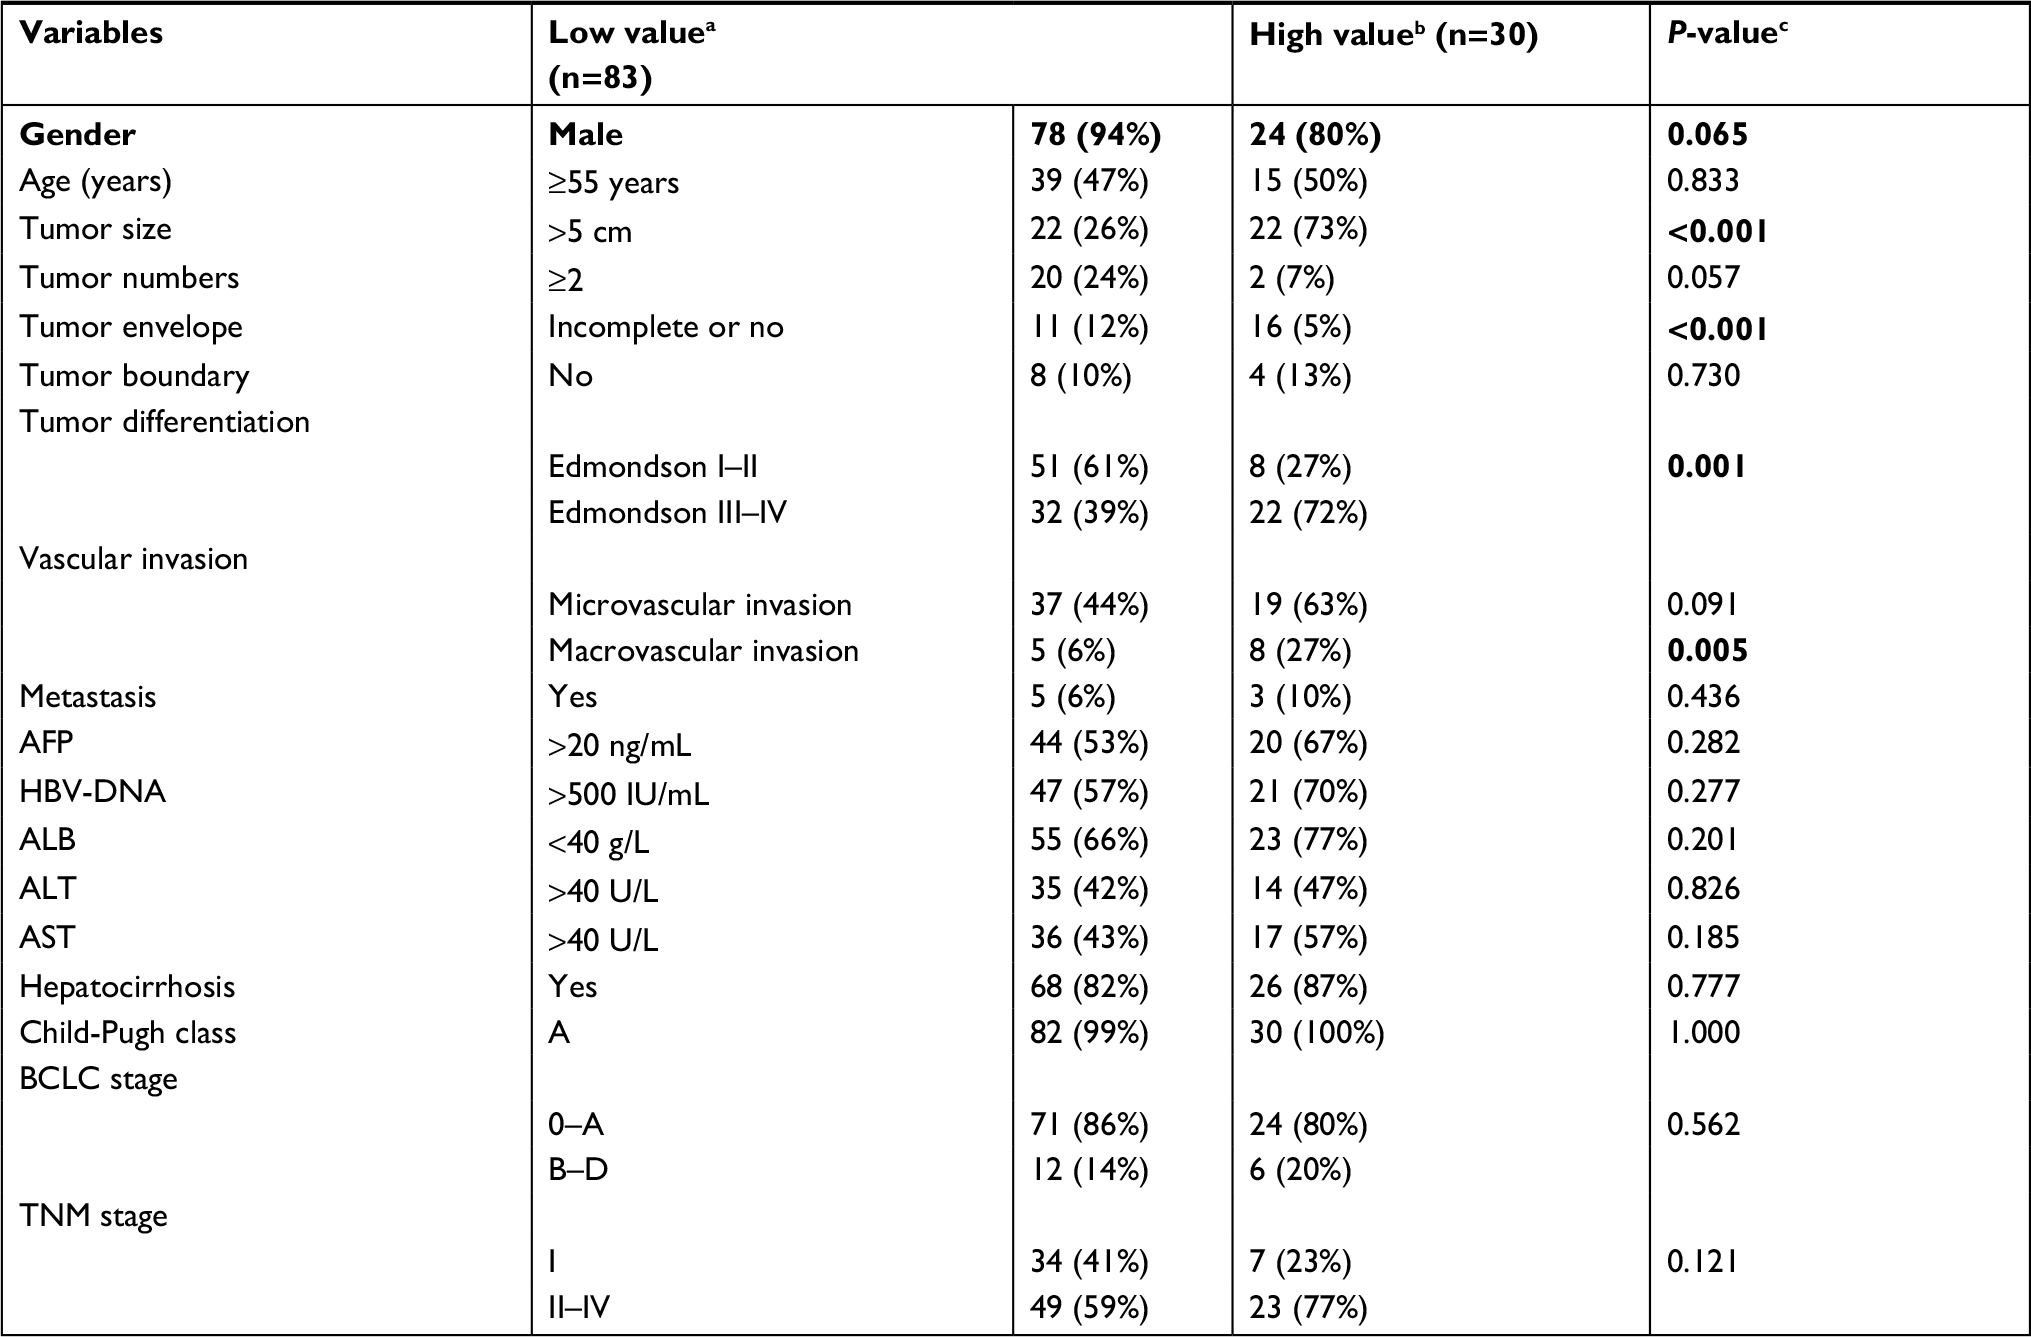 | Table 3 Comparison of clinical variables between HCC patients with low and high prognostic values in Fujian cohort Notes: a,bPatients with low prognostic and high prognostic values, respectively. cP-values were calculated by chi-squared test. P-values <0.05 were considered as significant and were highlighted in bold. Abbreviations: AFP, alpha-fetoprotein; ALB, albumin; ALT, alanine aminotransferase; AST, aspartate aminotransferase; BCLC stage, Barcelona Clinic Liver Cancer stage. |
Subgroup analysis of the prognostic evaluation model
Finally, we sought to evaluate whether the prognostic evaluation model can discriminate HCC patients with distinct prognosis under varied clinical conditions. Stratification analysis was performed using TCGA and Fujian cohort, for which detailed clinical information was available. In Fujian cohort, prognostic value showed significant association with overall survival in subtypes divided by TNM stage, degree of differentiation, and vascular invasion (all P<0.05, Figure 5A). Consistently, patients with higher prognostic value in TCGA dataset also showed poorer prognosis in all subtypes, regardless of their clinical conditions (all P<0.05, Figure 5B). These results further demonstrated that prognostic value could indeed serve as a strong prognosis indicator independent of the existing clinical classifications.23 In summary, the prognostic value calculated by the six-gene model could effectively indicate HCC prognosis under varied clinical conditions.
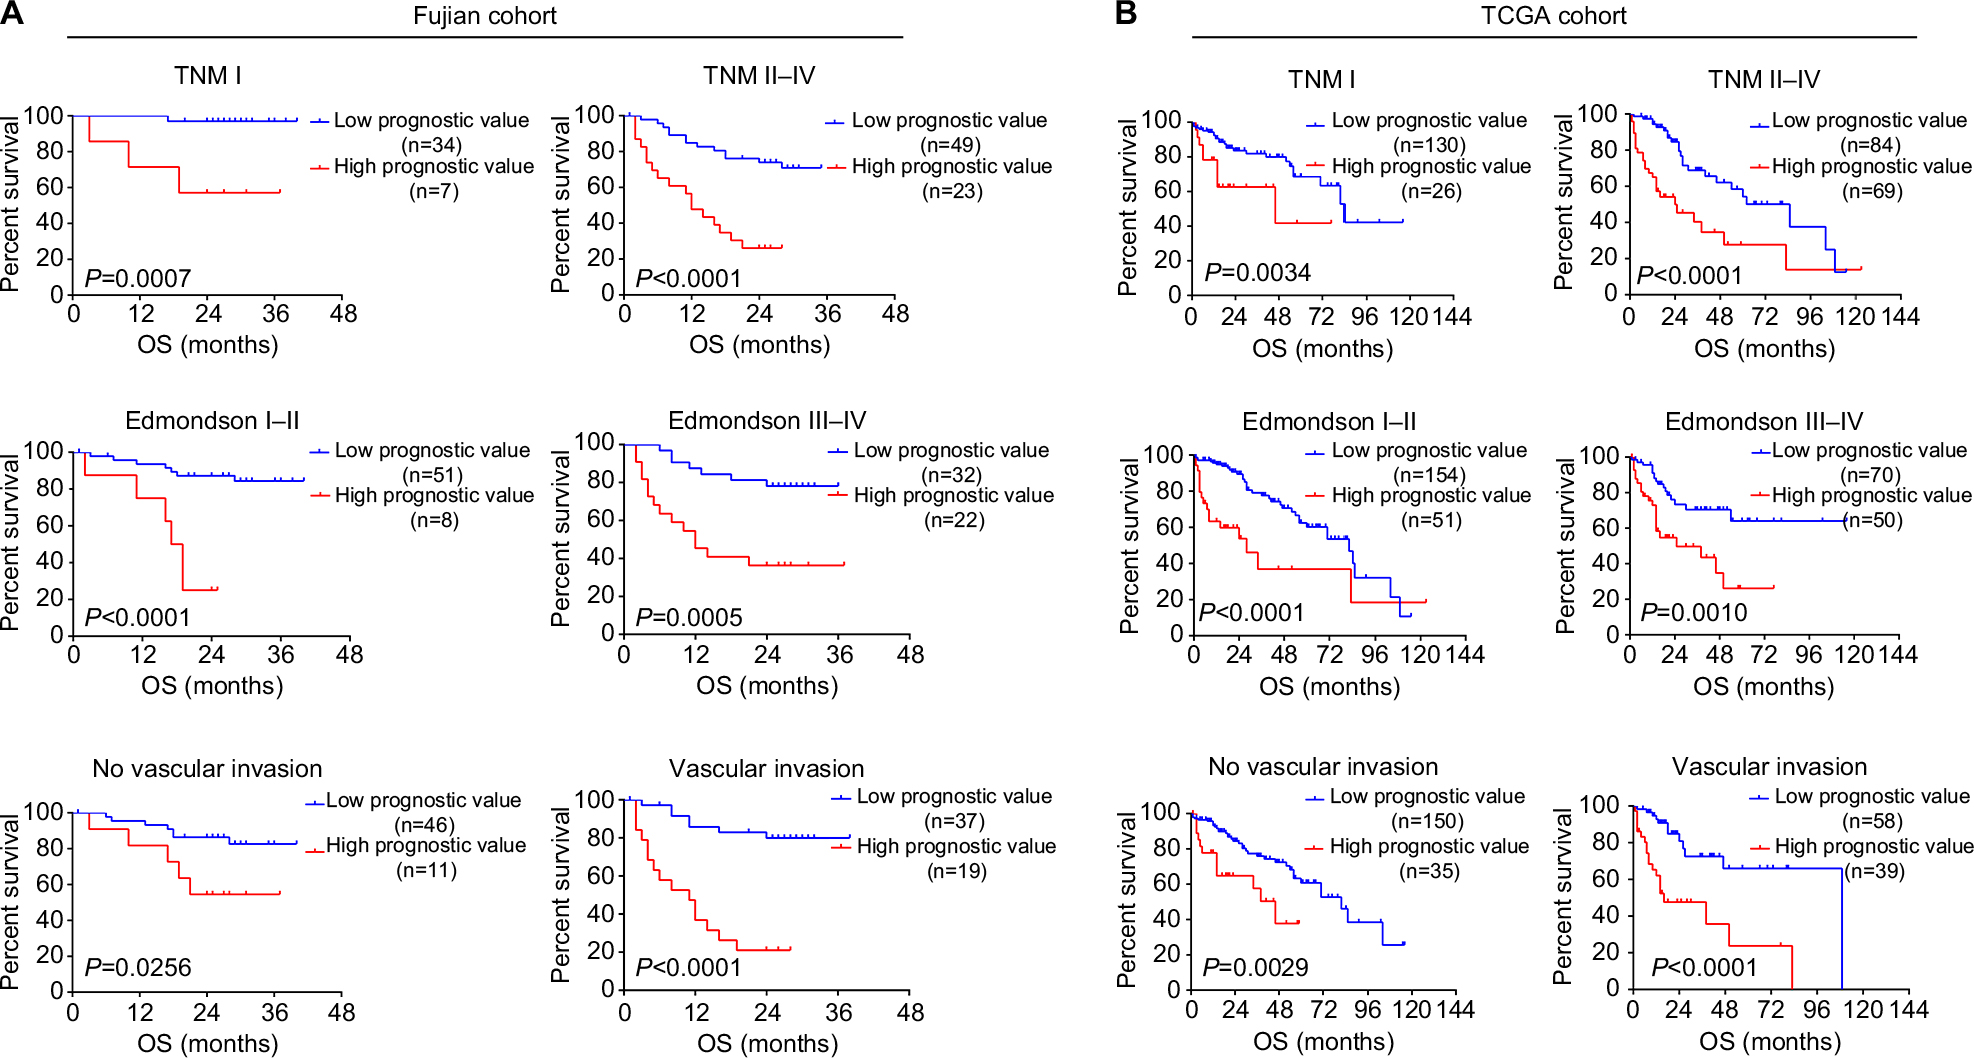 | Figure 5 Subgroup analysis of OS for patients with different levels of prognostic values. Notes: Kaplan–Meier curves for OS between HCC patients with high prognostic values and low prognostic values in (A) Fujian cohort and (B) TCGA cohort, according to different clinical features: TNM stages, Edmondson–Steiner tumor differentiation, and vascular invasion. Abbreviations: HCC, hepatocellular carcinoma; OS, overall survival; TCGA, The Cancer Genome Atlas. |
Discussion
Being one of the most heterogeneous cancers in humans, the prognosis evaluation of HCC often faces great difficulties.24 Identification of prognosis-associated subtypes was an important strategy to overcome tumor heterogeneity and thus could benefit clinical assessment and therapy selection. In this study, we identified two prognostic subtypes characterized by distinct expression features and clinical outcomes based on genome-wide expression profile of 371 HCC patients in TCGA cohort. In addition, we build a prognostic evaluation model which can not only discriminate HCC patients between different subtypes, but can also provide a good evaluation for patients’ prognosis. Moreover, the prognosis evaluation model has been validated in another two independent cohorts.
Notably, large numbers of genes concerning cell cycle, especially the mitotic phase, were significantly overexpressed in poor prognostic subtype. As the complex process regulating cell division, misregulation of cell cycle could contribute to uncontrolled cell proliferation, which was closely relevant to human cancers.25 Overexpression of cell cycle genes in poor prognostic subtypes indicated a more aggressive phenotype of their tumor, which was in consistence with their clinical features, such as more advanced stages, poorer differentiation, and more frequent macrovascular invasion. On the other hand, higher expression levels of multiple metabolism-associated pathways were observed in better prognosis subtype. Most of these metabolism pathways were related to physiologic hepatocyte metabolic functions, such as amino acid, fatty acid, drug metabolism process, etc. Previous studies suggested that downregulation of these physiologic hepatocyte metabolic pathways in HCC tissues could lead to suppression of hepatocyte metabolic functions.26 Relatively higher expression of these hepatocyte metabolic pathways in good prognostic subtype indicated a much more intact hepatocyte function and thus contributed to better clinical outcome.
The most representative genes of subtypes revealed by SAM and PAM analyses were used to build the prognostic evaluation model, and six genes (CA9, CXCL5, MMP12, SLC1A5, and G6PD) were included in the final model after variable selection. Intriguingly, all the six genes have been reported as key regulators in the process of tumor progression, and were critical components in regulation of tumor growth, metastasis, or invasion.27–32 The prognostic value evaluated by the model consisting these six genes can predict the survival of HCC patients well within all the three datasets included in our study. Noteworthy, this model showed superior performance compared to the widely used serum biomarker AFP in both TCGA cohort and Fujian cohort (both with available serum AFP testing results, Figure S4), indicating a valuable potential in future application including joint assessment. In addition, since the prognostic value served as an independent risk factor of HCC prognosis, its clinical utilization is not limited by patients’ clinical features.
Conclusion
We identified two prognostic molecular subtypes with distinct clinical outcomes and biological features among HCC patients. The prognosis evaluation model constructed archived consistent results among different cohorts and can be further applied for prediction of HCC outcomes in clinical setting. qPCR of these six genes could provide a simple and quick method for its clinical application. However, further prospective studies are still needed for the validation of its clinical implications.
Acknowledgments
This work was supported by the Scientific Foundation of Fujian Health and family planning Department (Grant No. 2018-1-92); the Startup Fund for scientific research, Fujian Medical University (Grant No. 2017XQ1165); the Scientific Foundation of Fuzhou Health Department (Grant No. 2017-S-wq38); the Science and Technology development project of central government guiding local government (Grant No.2017L3017); the National Natural Science Foundation of China (Grant No. 81602102; Grant No. 81672376); the Joint Funds for the Innovation of Science and Technology, Fujian province (Grant No. 2017Y9116).
Disclosure
The authors report no conflicts of interest in this work.
References
Torre LA, Bray F, Siegel RL, Ferlay J, Lortet-Tieulent J, Jemal A. Global cancer statistics, 2012. CA Cancer J Clin. 2015;65(2):87–108. | ||
Forner A, Reig M, Bruix J. Hepatocellular carcinoma. Lancet. 2018;391(10127):1301–1314. | ||
Maluccio M, Covey A. Recent progress in understanding, diagnosing, and treating hepatocellular carcinoma. CA Cancer J Clin. 2012;62(6):394–399. | ||
Gluer AM, Cocco N, Laurence JM, et al. Systematic review of actual 10-year survival following resection for hepatocellular carcinoma. HPB. 2012;14(5):285–290. | ||
Maida M, Orlando E, Cammà C, Cabibbo G. Staging systems of hepatocellular carcinoma: a review of literature. World J Gastroenterol. 2014;20(15):4141–4150. | ||
Marrero JA, Kudo M, Bronowicki JP. The challenge of prognosis and staging for hepatocellular carcinoma. Oncologist. 2010;15(Suppl 4):23–33. | ||
Toyoda H, Kumada T, Osaki Y, et al. Staging hepatocellular carcinoma by a novel scoring system (BALAD score) based on serum markers. Clin Gastroenterol Hepatol. 2006;4(12):1528–1536. | ||
Chapiro J, Geschwind JF. Hepatocellular carcinoma: have we finally found the ultimate staging system for HCC? Nat Rev Gastroenterol Hepatol. 2014;11(6):334–336. | ||
Yuan S, Wang J, Yang Y, et al. The Prediction of Clinical Outcome in Hepatocellular Carcinoma Based on a Six-Gene Metastasis Signature. Clin Cancer Res. 2017;23(1):289–297. | ||
Nault JC, De Reyniès A, Villanueva A, et al. A hepatocellular carcinoma 5-gene score associated with survival of patients after liver resection. Gastroenterology. 2013;145(1):176–187. | ||
Speir ML, Zweig AS, Rosenbloom KR, et al. The UCSC Genome Browser database: 2016 update. Nucleic Acids Res. 2016;44(D1):D717–D725. | ||
Villa E, Critelli R, Lei B, et al. Neoangiogenesis-related genes are hallmarks of fast-growing hepatocellular carcinomas and worst survival. Results from a prospective study. Gut. 2016;65(5):861–869. | ||
Chiang DY, Villanueva A, Hoshida Y, et al. Focal gains of VEGFA and molecular classification of hepatocellular carcinoma. Cancer Res. 2008;68(16):6779–6788. | ||
Mínguez B, Hoshida Y, Villanueva A, et al. Gene-expression signature of vascular invasion in hepatocellular carcinoma. J Hepatol. 2011;55(6):1325–1331. | ||
Lim HY, Sohn I, Deng S, et al. Prediction of disease-free survival in hepatocellular carcinoma by gene expression profiling. Ann Surg Oncol. 2013;20(12):3747–3753. | ||
Rousseeuw PJ. Silhouettes: A graphical aid to the interpretation and validation of cluster analysis. J Comput Appl Math. 1987;20(20):53–65. | ||
Tusher VG, Tibshirani R, Chu G. Significance analysis of microarrays applied to the ionizing radiation response. Proc Natl Acad Sci U S A. 2001;98(9):5116–5121. | ||
Tibshirani R, Hastie T, Narasimhan B, Chu G. Diagnosis of multiple cancer types by shrunken centroids of gene expression. Proc Natl Acad Sci U S A. 2002;99(10):6567–6572. | ||
Kamburov A, Stelzl U, Lehrach H, Herwig R. The ConsensusPathDB interaction database: 2013 update. Nucleic Acids Res. 2013;41(Database issue):D793–D800. | ||
Livak KJ, Schmittgen TD. Analysis of relative gene expression data using real-time quantitative PCR and the 2(-Delta Delta C(T)) Method. Methods. 2001;25(4):402–408. | ||
Kaplan EL, Meier P. Nonparametric Estimation from Incomplete Observations. J Am Stat Assoc. 1958;53(282):457–481. | ||
McHugh ML. Interrater reliability: the kappa statistic. Biochem Med. 2012;22(3):276–282. | ||
Zhou L, Rui JA, Wang SB, Chen SG, Qu Q. The significance of serum AFP cut-off values, 20 and 400 ng/mL in curatively resected patients with hepatocellular carcinoma and cirrhosis might be of difference. Hepatogastroenterology. 2012;59(115):840–843. | ||
Aravalli RN, Steer CJ, Cressman EN. Molecular mechanisms of hepatocellular carcinoma. Hepatology. 2008;48(6):2047–2063. | ||
Malumbres M, Barbacid M. Cell cycle, CDKs and cancer: a changing paradigm. Nat Rev Cancer. 2009;9(3):153–166. | ||
Nwosu ZC, Megger DA, Hammad S, et al. Identification of the Consistently Altered Metabolic Targets in Human Hepatocellular Carcinoma. Cell Mol Gastroenterol Hepatol. 2017;4(2):e301:303–323. | ||
McIntyre A, Patiar S, Wigfield S, et al. Carbonic anhydrase IX promotes tumor growth and necrosis in vivo and inhibition enhances anti-VEGF therapy. Clin Cancer Res. 2012;18(11):3100–3111. | ||
Zhou SL, Dai Z, Zhou ZJ, et al. Overexpression of CXCL5 mediates neutrophil infiltration and indicates poor prognosis for hepatocellular carcinoma. Hepatology. 2012;56(6):2242–2254. | ||
Hong X, Song R, Song H, et al. PTEN antagonises Tcl1/hnRNPK-mediated G6PD pre-mRNA splicing which contributes to hepatocarcinogenesis. Gut. 2014;63(10):1635–1647. | ||
Ng KT, Qi X, Kong KL, et al. Overexpression of matrix metalloproteinase-12 (MMP-12) correlates with poor prognosis of hepatocellular carcinoma. Eur J Cancer. 2011;47(15):2299–2305. | ||
Musa J, Aynaud MM, Mirabeau O, Delattre O, Grünewald TG. MYBL2 (B-Myb): a central regulator of cell proliferation, cell survival and differentiation involved in tumorigenesis. Cell Death Dis. 2017;8(6):e2895. | ||
Liu Y, Yang L, An H, et al. High expression of Solute Carrier Family 1, member 5 (SLC1A5) is associated with poor prognosis in clear-cell renal cell carcinoma. Sci Rep. 2015;5:16954. |
 © 2018 The Author(s). This work is published and licensed by Dove Medical Press Limited. The full terms of this license are available at https://www.dovepress.com/terms.php and incorporate the Creative Commons Attribution - Non Commercial (unported, v3.0) License.
By accessing the work you hereby accept the Terms. Non-commercial uses of the work are permitted without any further permission from Dove Medical Press Limited, provided the work is properly attributed. For permission for commercial use of this work, please see paragraphs 4.2 and 5 of our Terms.
© 2018 The Author(s). This work is published and licensed by Dove Medical Press Limited. The full terms of this license are available at https://www.dovepress.com/terms.php and incorporate the Creative Commons Attribution - Non Commercial (unported, v3.0) License.
By accessing the work you hereby accept the Terms. Non-commercial uses of the work are permitted without any further permission from Dove Medical Press Limited, provided the work is properly attributed. For permission for commercial use of this work, please see paragraphs 4.2 and 5 of our Terms.