")
Back to Journals » Clinical Epidemiology » Volume 12
Evaluating the Effectiveness of an Additional Risk Minimization Measure to Reduce the Risk of Prescribing Mirabegron to Patients with Severe Uncontrolled Hypertension in Four European Countries
Authors Heintjes EM , Bezemer ID, Prieto-Alhambra D, Smits E, Booth HP, Dedman D , He Y, Hoti F, Vehkala M, de Vogel S, Robinson NJ, Appenteng K, Penning-van Beest FJA
Received 19 December 2019
Accepted for publication 11 March 2020
Published 1 May 2020 Volume 2020:12 Pages 423—433
DOI https://doi.org/10.2147/CLEP.S242065
Checked for plagiarism Yes
Review by Single anonymous peer review
Peer reviewer comments 2
Editor who approved publication: Professor Vera Ehrenstein
Edith M Heintjes,1 Irene D Bezemer,1 Daniel Prieto-Alhambra,2,3 Elisabeth Smits,1 Helen P Booth,4 Daniel Dedman,4 Ying He,3 Fabian Hoti,5 Minna Vehkala,5 Stefan de Vogel,6 Noah Jamie Robinson,6 Kwame Appenteng,7 Fernie JA Penning-van Beest1
1PHARMO Institute for Drug Outcomes Research, Utrecht, the Netherlands; 2Idiap Jordi Gol Primary Care Research Institute and CIBERFes, Universitat Autonoma de Barcelona and Instituto de Salud Carlos III, Barcelona, Catalonia, Spain; 3Centre for Statistics in Medicine, NDORMS, University of Oxford, Oxford, England, UK; 4Clinical Practice Research Datalink (CPRD), London, UK; 5Statfinn - EPID Research, Espoo, Finland; 6Astellas Pharma Europe B.V., Leiden, Netherlands; 7Astellas Pharma Global Development, Inc., Northbrook, IL, USA
Correspondence: Edith M Heintjes
PHARMO Institute for Drug Outcomes Research, Van Deventerlaan 30-40, Utrecht, AE 3528, the Netherlands
Tel +31 30 7440 800
Email [email protected]
Background: Mirabegron, indicated for the treatment of overactive bladder, is contraindicated in patients with severe uncontrolled hypertension (systolic blood pressure ≥ 180 mm Hg and/or diastolic blood pressure ≥ 110 mm Hg). In September 2015, a Direct Healthcare Professional Communication (DHPC) letter was disseminated as an additional risk minimisation measure.
Purpose: To assess the effectiveness of the DHPC in reducing the proportions of patients with severe or non-severe uncontrolled hypertension at mirabegron initiation.
Methods: An observational multi-database cohort study was undertaken using routinely collected healthcare data (December 2012–December 2016) from the PHARMO Database Network (Netherlands), SIDIAP database (Spain), CPRD (United Kingdom, UK) and national healthcare registers and electronic medical records from Finland. DHPC effectiveness was evaluated using interrupted time series analyses comparing trends and changes in monthly proportions of severe or non-severe uncontrolled hypertensive mirabegron initiations relative to the timing of the DHPC dissemination.
Results: The study population comprised 52,078 patients. Prior to DHPC dissemination, across the four databases, 0.3– 1.3% had severe uncontrolled hypertension. Estimated absolute changes (EAC) in proportions of severe uncontrolled hypertension post-DHPC indicated a tendency towards a lower proportion in the Netherlands (EAC − 0.36%, p=0.053), unchanged proportions in Spain and the UK and a higher proportion in Finland (EAC +0.73%, p=0.016). For non-severe uncontrolled hypertension (13– 16% pre-DHPC), post-DHPC proportions tended to be lower in the Netherlands (EAC − 2.02%, p=0.038) and Spain (EAC − 1.04%, p=0.071), and unchanged in the UK and Finland.
Conclusion: Severe uncontrolled hypertension prior to mirabegron initiation was uncommon in these four European countries even before DHPC dissemination. This suggests that other risk minimisation communications (prior to the DHPC dissemination) had worked adequately with respect to minimising mirabegron use among patients with severe uncontrolled hypertension. No strong and consistent evidence of further risk minimisation after the DHPC dissemination was observed in this study.
Keywords: drug utilisation study, direct healthcare professional communication, risk minimization, interrupted time series analysis
Introduction
Mirabegron was introduced into the European market in 2012 for the treatment of overactive bladder. Although tolerability of mirabegron is generally acceptable with regard to side effects, including dry mouth, blurred vision, cognitive impairment and constipation,1,2 there have been concerns regarding a possible increase in blood pressure. This resulted in a contraindication in the product label of mirabegron3 for patients with severe uncontrolled high blood pressure (systolic ≥ 180 mm Hg and/or diastolic ≥ 110 mm Hg). In line with a request from the European Medicines Agency’s (EMA) Pharmacovigilance Risk Assessment Committee, a Direct Healthcare Professional Communication (DHPC) was disseminated on 7 September 2015 as a further risk minimisation activity. In accordance with the EMA Committee for Medicinal Products for Human Use guideline on good pharmacovigilance practices Module IX,4 an effectiveness evaluation of this risk minimisation activity was performed in the form of a retrospective database study in four European countries.
The primary objective of the study was to assess the effectiveness of the DHPC as a risk minimisation measure in the participating countries by quantifying the proportions of mirabegron initiations with documented uncontrolled hypertension (severe and non-severe) before and after DHPC dissemination. The secondary objective was to assess the frequency of blood pressure recordings before and during mirabegron treatment among patients with documented hypertension before and after DHPC dissemination. In addition, methodological considerations for evaluation of the effectiveness of risk minimisation activities are discussed.
Methods
The protocol for this study is available on the EU PAS Register under Number EUPAS15063.5
Data Sources
Healthcare records from the PHARMO Database Network in the Netherlands, the SIDIAP database in Spain, the CPRD in the United Kingdom and all inhabitants of the capital region (cities of Helsinki, Espoo and Vantaa) in Finland were used. In Finland, data sources included the nationwide electronic e-Prescription Register (drug exposure data), Care Register for Health Care (in- and out-patient hospital care data), Register of Primary Health Care Visits (primary care data), Population Register Centre (place of residence, migration information) and Causes of Death Registry (time of death).
Overactive bladder management primarily takes place in the primary care setting. General Practice (GP) records were used to collect hypertension and blood pressure information in all countries. Mirabegron use was based on GP prescriptions in the UK. In the Netherlands, Spain and Finland, mirabegron use was based on both GP prescribed and specialist prescribed mirabegron dispensed from outpatient pharmacies. Hereafter, both are referred to as “prescriptions”.
Study Design and Population
A multi-country post-authorisation safety study (PASS) was conducted,5 using an observational retrospective study design. Patients starting mirabegron use (ATC G04BD12) between 20 December 2012 (first authorisation) and 31 December 2016 (end of data availability) were included. The index date was defined as the start of mirabegron treatment, after at least 12 months of recorded database history without mirabegron use. Patients aged <18 years at index date were excluded. Patients were followed from 12 months before index date until the earliest of 1) end of mirabegron treatment (see below), 2) transfer out of the database (death or end of database follow-up/censoring) or 3) 31 December 2016.
Mirabegron Exposure
Prescriptions of mirabegron from index date until the end of database follow-up were converted into treatment episodes of uninterrupted use. The number and dose of tablets prescribed divided by the prescribed daily dose (or, if not available, the number of doses reflecting 1 defined daily dose of 50 mg (1 tablet)6) were used to determine the duration of a prescription. Gaps between prescriptions of more than half the duration of the prior prescription were considered interruptions of treatment, according to the method described by Catalan.7 The end date of total mirabegron treatment was defined as the end date of an episode after which no mirabegron exposure was observed for at least 12 months. For the secondary objective, all BP measurements up to the end of total mirabegron treatment were included. Patients who re-started mirabegron use after at least 12 months of non-use were included multiple times as independent initiations for both objectives.
Hypertension Status Definitions
Information on hypertension diagnosis, antihypertensive treatment and the last recorded BP during the 6 months before the index date was combined to assign patients to five hypertension statuses: 1) Severe uncontrolled hypertension: systolic BP (SBP) ≥180 mm Hg and/or diastolic BP (DBP) ≥ 110 mm Hg, 2) non-severe uncontrolled hypertension: 140 ≤ SBP <180 mm Hg and/or 90 ≤ DBP <110 mm Hg, 3) controlled hypertension: SBP <140 mm Hg and DBP < 90 mm Hg during treatment for hypertension, 4) normal BP: SBP <140 mm Hg and DBP < 90 mm Hg in the absence of treatment for hypertension, or no BP measurements and no diagnosis or treatment for hypertension, and 5) unconfirmed hypertension status: diagnosis or treatment for hypertension but no BP value, or a single measurement indicating elevated DBP and/or SBP in the absence of a diagnosis or treatment for hypertension.
For severe and non-severe uncontrolled hypertension, confirmation was needed by a second measurement in the same range, or a diagnosis or treatment for hypertension. In the absence of both a BP value and diagnosis of hypertension, the use of at least two classes of antihypertensive drugs was required to qualify as antihypertensive treatment.
The reference values for hypertension were based on the European product information,3 local guidelines8–10 and instructions for use11 and were the same across participating countries.
Study Endpoints
The primary endpoint was the change in the proportion of patients with severe uncontrolled hypertension among patients initiated on mirabegron from pre- to post-DHPC dissemination. The proportion with non-severe uncontrolled hypertension was included as a separate outcome in order to provide additional context. Secondary endpoints were the change in frequency of blood pressure recordings at initiation and during mirabegron treatment relative to DHPC dissemination.
Statistical Analysis
All data were structured to a study-specific common data model in order to apply identical SAS analytical programs across databases. All analyses were done using SAS version 9.4 under Windows (SAS Institute Inc., Cary, NC, USA).
To estimate absolute changes in the proportion of patients with severe and non-severe uncontrolled hypertension after the dissemination of the DHPC, an interrupted time series (ITS) analysis was conducted.12,13 A segmented regression model analysed monthly proportions of severe and non-severe uncontrolled hypertension pre-DHPC and post-DHPC. The pre-DHPC period spanned from the first month in which counts of mirabegron users allowed estimation of the proportions per blood pressure status, up to the intervention month (September 2015). September 2015 was excluded from the analysis. The post-DHPC period ended at the end of data availability in December 2016 (Figure 1).
Three statistical models were fit to the data. Model one was the most extensive and included the change in level of the proportion from before to after DHPC dissemination, a trend (i.e. a slope indicating increase or decrease over time), and a change in trend after DHPC. Model two included only the change in level and an unchanged trend. Model three included only the change in level, but no trend. The best-fitting model was chosen based on the lowest AIC (Akaike Information Criterion), BIC (Bayesian Information Criterion) and statistical significance of the variables. The Durbin-Watson statistic was used to assess potential autocorrelation influencing the precision of the estimates.14 Predicted proportions were calculated based on estimates from the best fit model. Pre-DHPC predicted values were projected in the post-DHPC period to produce counterfactual values (assuming no change in level and trend had occurred). The estimated absolute change (EAC) was calculated mid-period post-DHPC as the difference between counterfactual projected values and predicted values based on the best fit model.14,15 The observed monthly proportions, together with predicted proportions and counterfactual proportions are represented graphically for both severe and non-severe hypertension (Figure 2).
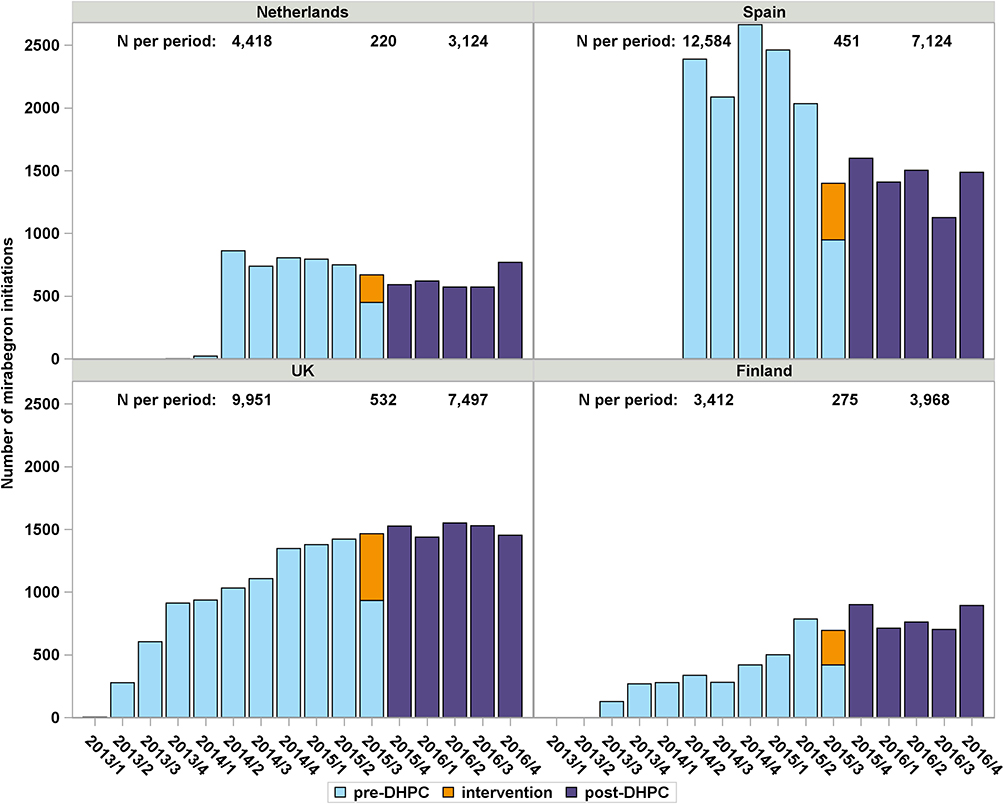 |
Figure 1 Number of mirabegron initiations per quarter year between January 2013 and December 2016 per country. Total number of initiations are shown for the pre-DHPC period, the DHPC intervention month (September 2015), and for the post-DHPC period. |
Rates of BP measurements per person-quarter (3 month period) during mirabegron use were compared descriptively pre- and post-DHPC, overall and separately for patients with documented hypertension (controlled or uncontrolled).
Results
Of 55,716 mirabegron users across all countries, 4% had insufficient database history prior to mirabegron initiation to be included in the study, leaving 53,559: 7762 from the Netherlands (276 (3%) excluded), 20,159 from Spain (38 (0.2%) excluded), 17,980 from the UK (1684 (9%) excluded) and 7655 from Finland (159 (2%) excluded). In each country, a small proportion of the patients were included with multiple treatment initiations: 108 (1.4%) in the Netherlands, 363 (1.8%) in Spain, 323 (1.8%) in the UK and 205 (2.7%) in Finland.
In Finland and the UK, uptake of mirabegron started in 2013, soon after market authorisation, and numbers of patients initiating treatment increased gradually up to the fourth quarter of 2015, after which uptake levelled off (Figure 1). In the Netherlands and Spain, uptake started only in 2014 after reimbursement was approved; numbers initiating treatment were relatively high and constant for the first year, and then slightly decreased until the fourth quarter of 2015, after which numbers levelled off.
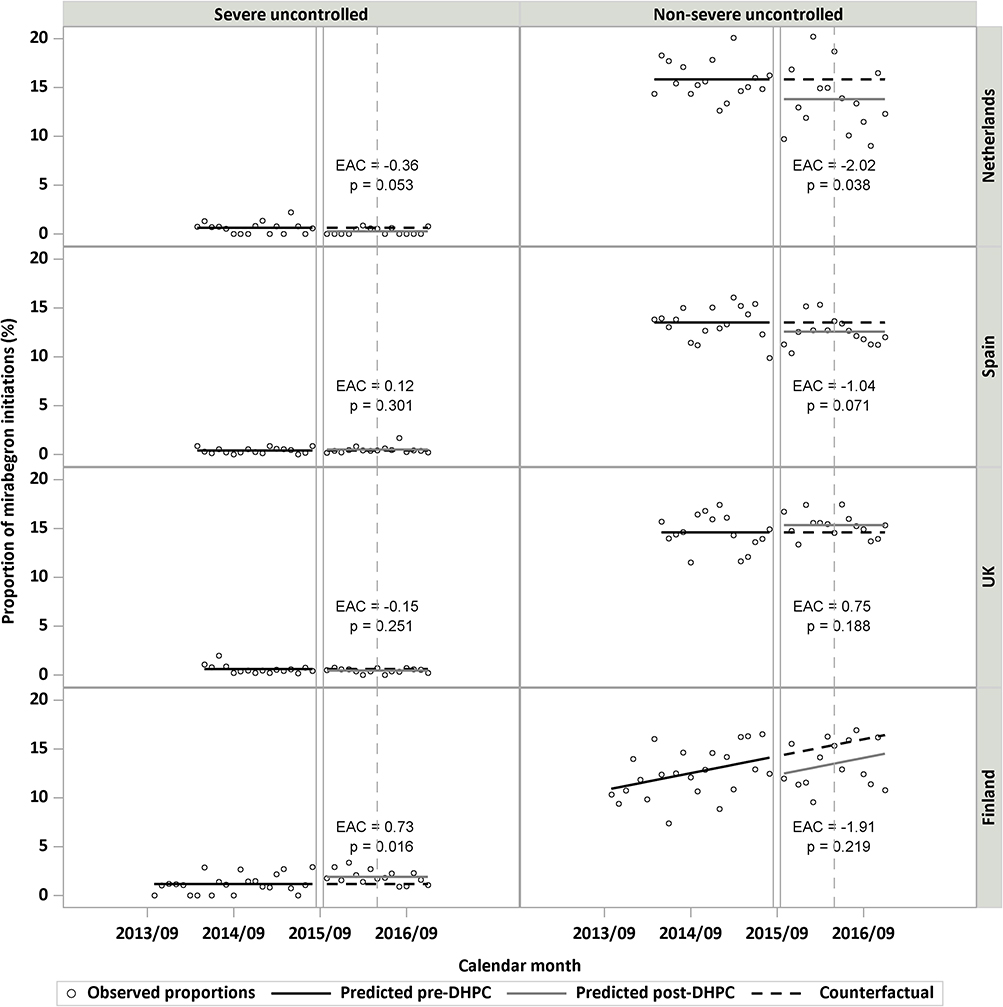 |
Figure 2 Observed, predicted and counterfactual proportions of patients with severe or non-severe uncontrolled hypertension at mirabegron initiation, by country. EAC = Estimated absolute change, i.e. projected counterfactual proportion – predicted proportion based on the best fit model at mid-point of post-DPHC period (denoted with dashed vertical lines). The DHPC intervention month is denoted with solid vertical lines. |
Patients starting mirabegron in the intervention month of September 2015 were excluded from the analyses (220 in the Netherlands, 451 in Spain, 532 in the UK and 275 in Finland), leaving 52,078 patients.
Patient characteristics (Table 1) did not differ appreciably between the pre- and post-DHPC periods within each country, but tended to vary across countries. Mean age varied from 66 years in the Netherlands to 71 in Finland. Patients in Finland had more cardiovascular comorbidities.
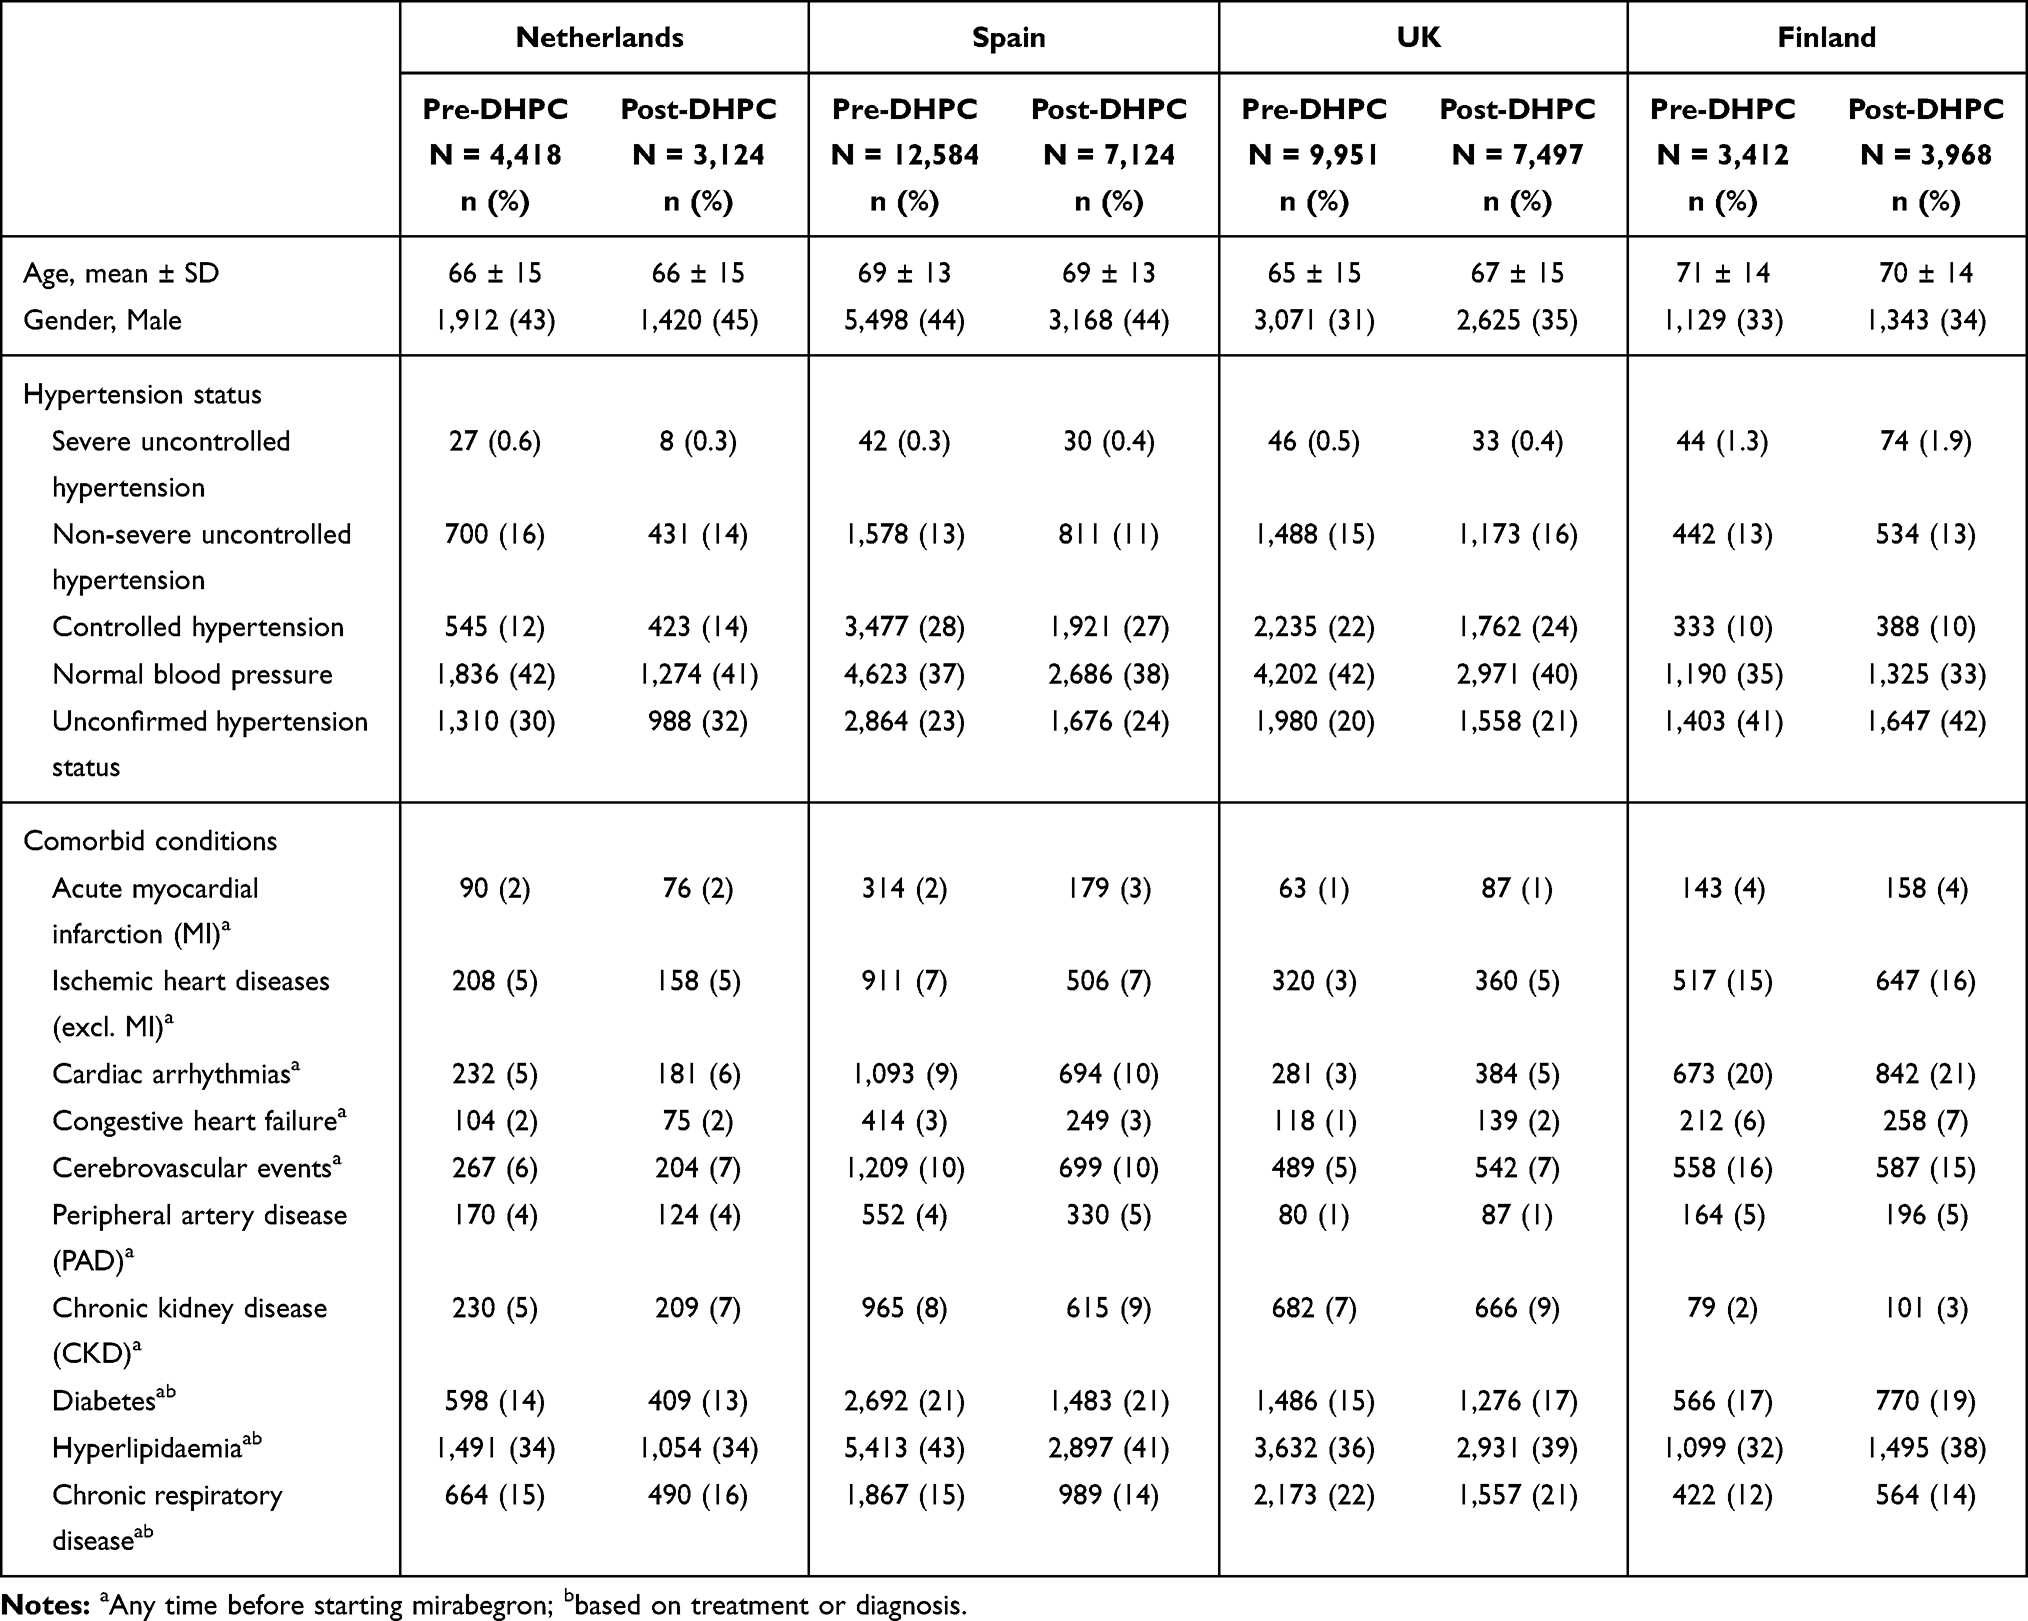 |
Table 1 Patient Characteristics |
Analyses of characteristics stratified by hypertension status are available in Supplemental Table 1 online; the main findings are summarized below. In all countries, the normotensive patients were on average 12–14 years younger than hypertensive patients. The proportion of men was around 35% in the UK and Finland, irrespective of hypertension status. In the Netherlands and Spain, the proportion of men was approximately 35% among normotensive patients and 50% among hypertensive patients. In all countries, diabetes was less common among normotensive patients (5–10%) than among hypertensive patients with documented blood pressure (approximately 25–35%) or among hypertensive patients without documented BP (10–20%). Similarly, cardiovascular comorbidities were more frequent among hypertensive patients than normotensive patients.
Interrupted Time Series Analysis
No autocorrelation was detected in any of the models assessing changes over time in the proportion of patients with severe or non-severe uncontrolled hypertension. The proportion of patients with severe uncontrolled hypertension was low in all databases, both before and after DHPC dissemination (Table 2). In some months, there were no patients with severe uncontrolled hypertension among mirabegron initiations (Figure 2). The best fit model was that without time trends (model three) in all countries. In the Netherlands, there was a tendency towards a lower proportion of patients with severe uncontrolled hypertension post-DHPC (0.61% pre-DHPC, EAC: −0.36% (p=0.053)). In Spain and the UK, pre- and post-DHPC proportions with severe uncontrolled hypertension were similar. In Finland, there was a small increase in the proportion of patients with severe uncontrolled hypertension (1.29% pre-DHPC, EAC: +0.73% (p=0.016)).
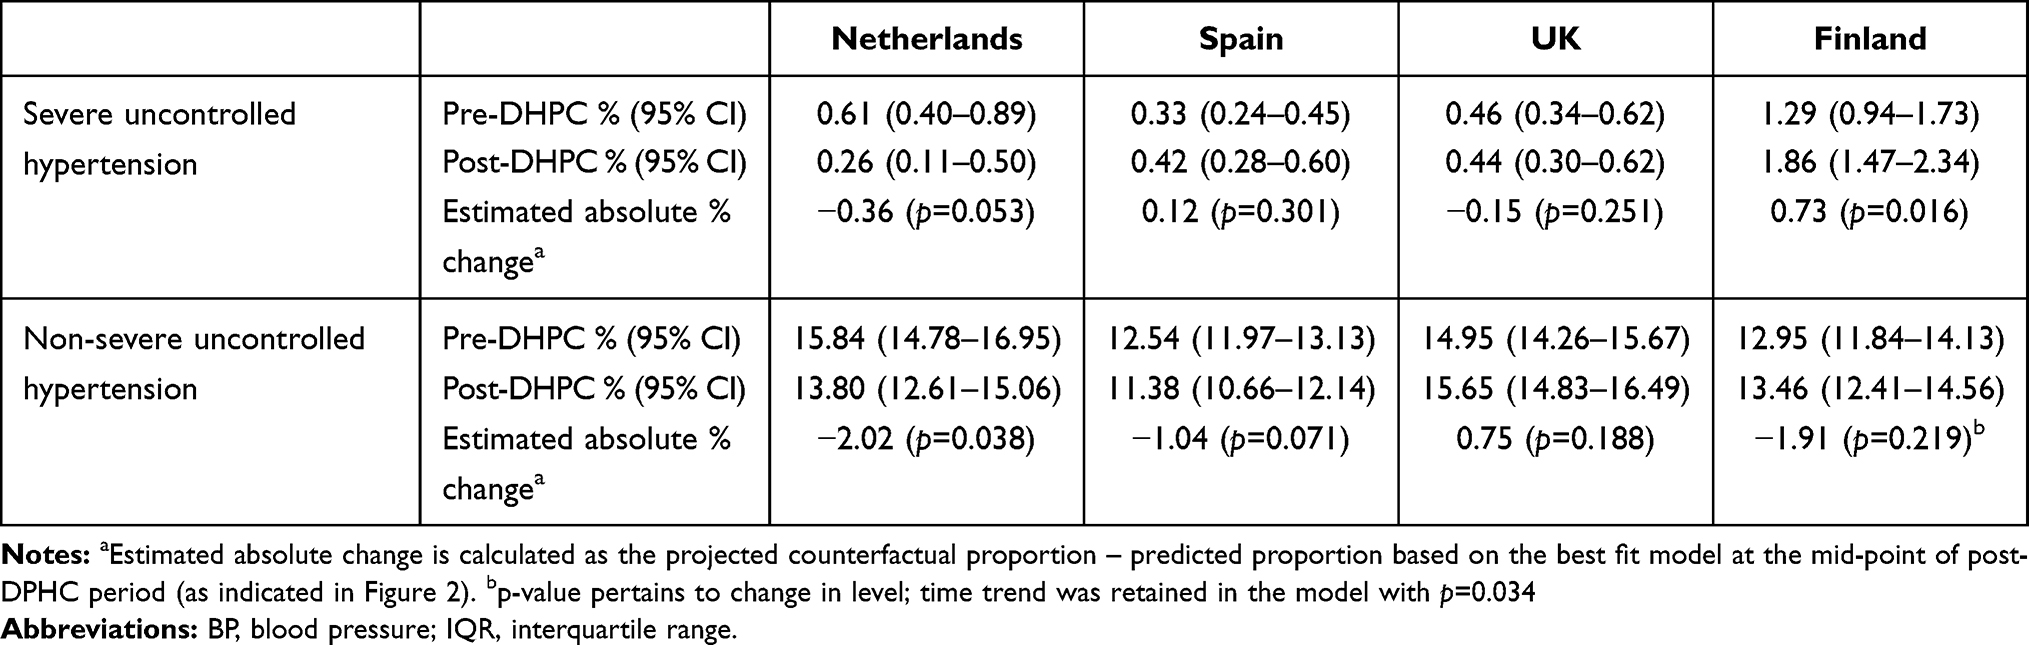 |
Table 2 Proportion of Mirabegron Initiations with Severe and Non-Severe Uncontrolled Hypertension Relative to DHPC Dissemination |
There were larger proportions of patients with non-severe uncontrolled hypertension. A slightly lower proportion of patients with non-severe uncontrolled hypertension was observed post-DHPC in the Netherlands (15.84% pre-DHPC, EAC: −2.02 (p=0.038)). No trends over time were observed in the proportion of non-severe uncontrolled hypertension in the Netherlands, Spain or UK (model three provided the best fit, Table 2 and Figure 2). In Spain, a tendency towards a decrease in the proportion was observed post-DHPC dissemination (12.54% pre-DHPC, EAC: −1.04% (p=0.071)). In the UK, no substantial change was observed. A trend of 0.14% increase per month (p=0.034) was observed in the Finnish data, which persisted after the intervention (model two). This was off-set by a small overall decrease in the proportion of non-severe uncontrolled hypertension post-DHPC (EAC: −1.91% (p=0.219), see Figure 2).
Blood Pressure Monitoring
The proportions of the study population with recorded BP measurements were similar pre- and post-DHPC dissemination in all databases: 40% and 39% in the Netherlands, 57% and 55% in Spain, 57% and 60% in the UK, and 33% and 34% in Finland (Table 3). By definition, all patients with documented hypertension (controlled or uncontrolled, excluding unconfirmed status) had a recorded BP measurement prior to index date. Pre-DHPC, person-time for calculation of BP measurement rates was censored in September 2015. During mirabegron treatment, the frequency of BP measurements was greater among the population with documented hypertension than in the overall study population; no clinically relevant change was observed after DHPC dissemination.
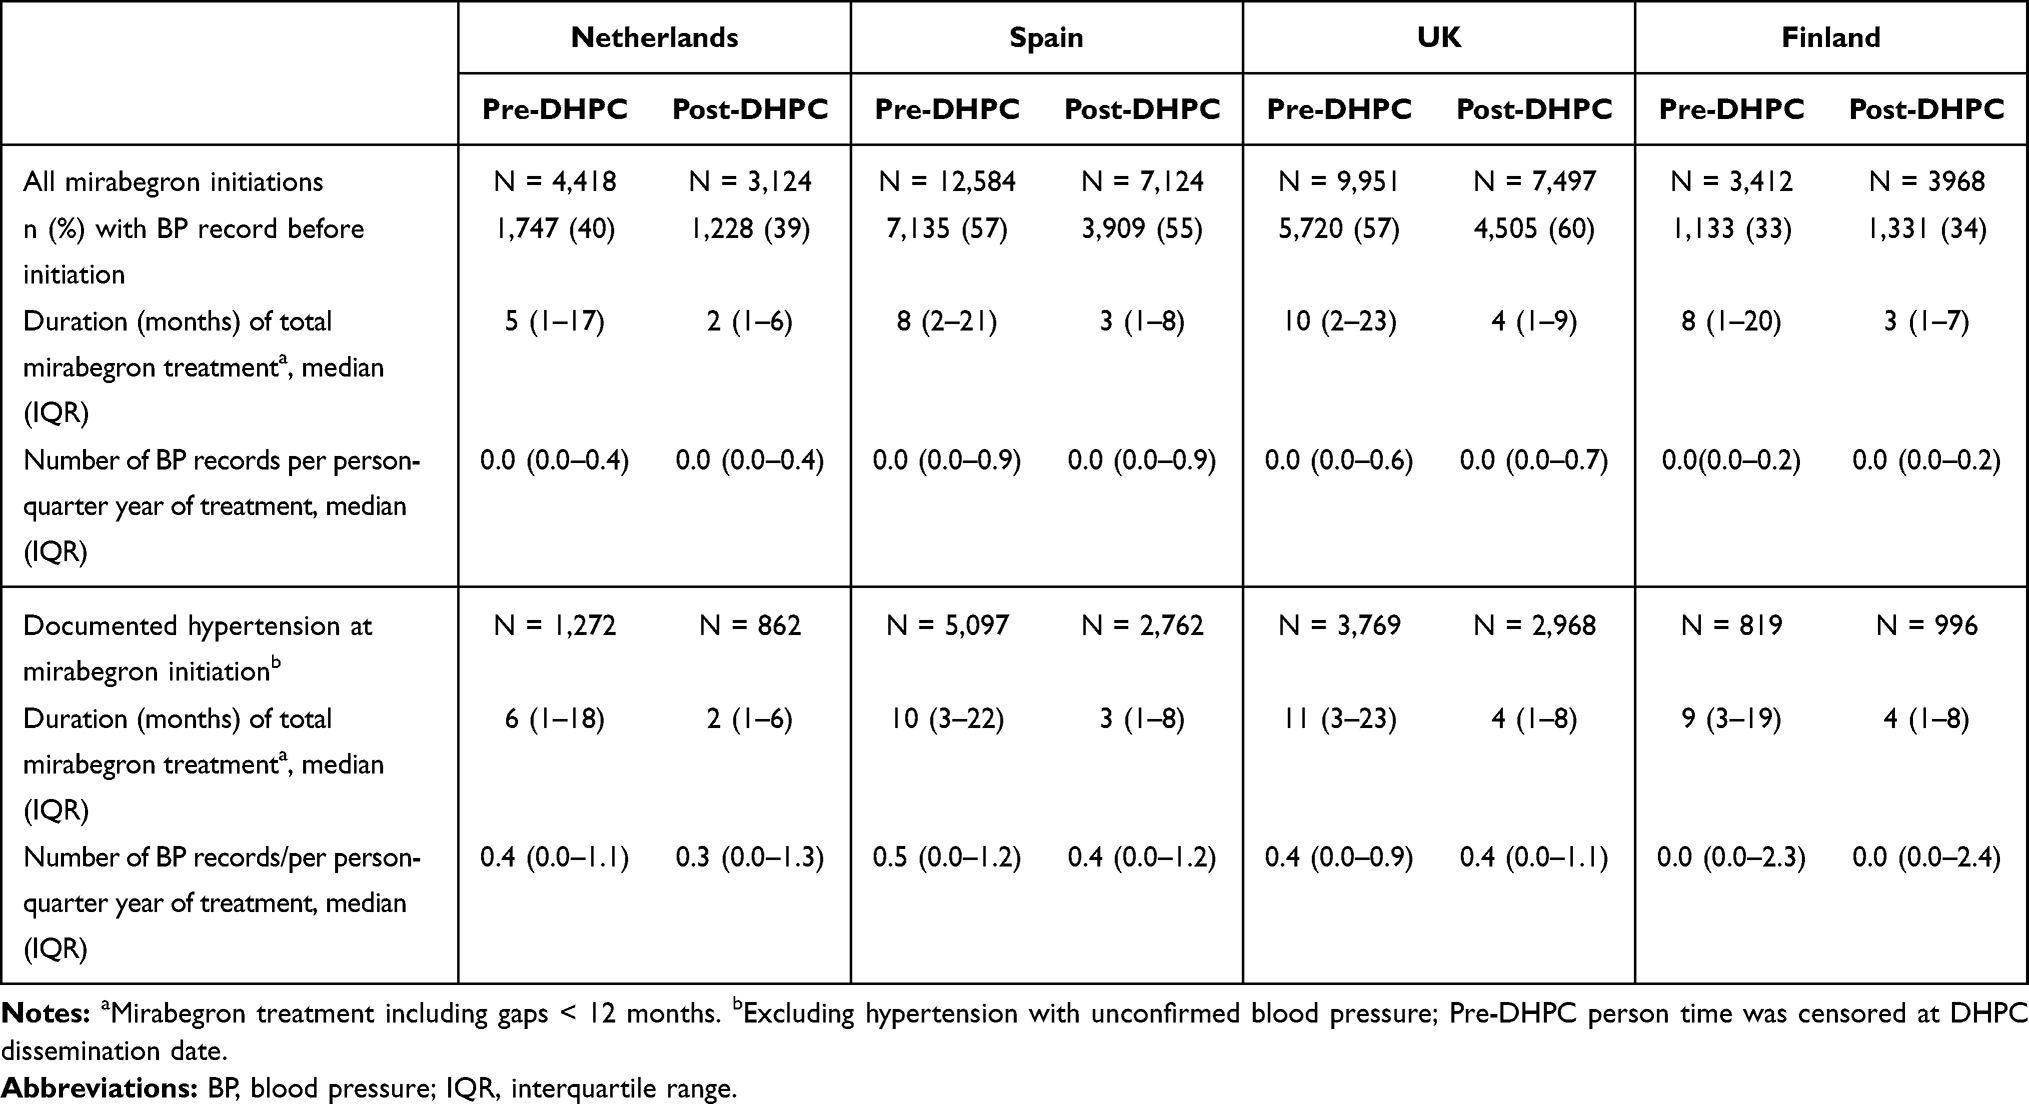 |
Table 3 Frequency of Blood Pressure Recordings Before and During Mirabegron Treatment |
Discussion
The proportion of patients with severe uncontrolled hypertension initiated on mirabegron was low in all countries even before DHPC dissemination (0.33% - 1.29%). This was reassuring and may reflect the impact of the contra-indication specified in the summary of product characteristics (SmPC) since the launch of mirabegron. However, in the context of this study, these low proportions did not allow for substantial additional reductions (given the resulting floor effect). Nevertheless, in the Netherlands, a small non-significant absolute reduction was observed after DHPC dissemination (−0.36%; p=0.053). In Finland, there was a small increase in the proportion (+0.73%, p=0.016) despite reiterating the contra-indication in the DHPC.
Pre-DHPC proportions for non-severe uncontrolled hypertension were considerably larger (13% - 16%) than those for severe uncontrolled hypertension. Reductions post-DHPC dissemination were observed in the Netherlands (−2.02%, p=0.038) and to a lesser extent Spain (−1.04%, p=0.071). In Finland, a small trend towards more non-severe uncontrolled hypertension persisted after DHPC dissemination, but this was somewhat counter-balanced by a drop in the level directly after DHPC dissemination.
With regard to the secondary endpoint of BP monitoring, we observed no increase post-DHPC in the rate of screening for severe uncontrolled hypertension prior to initiation of mirabegron, nor did we observe increased monitoring of BP during mirabegron treatment.
Data for the Vantaa region in Finland only became available after the initial study report was posted,5 but conclusions remained unchanged.
No comparable published data are available to provide context for the results of this study. In this study, we faced multiple challenges. First, we needed to identify data sources across Europe in which mirabegron was widely used, BP readings were comprehensively captured and researchers were permitted to access the records. We identified four data sources, all of which were included in the final study.
Secondly, the ITS method using segmented regression analysis is a tool recognised for its ability to assess changes associated with health-care policies or risk minimisation measures, but it requires at least 10 data points prior to and after the intervention.14 The limited time between market authorisation of mirabegron and the timing of the DHPC therefore necessitated the use of monthly (rather than longer) time intervals. Limited sample sizes per month increased variability and thus uncertainty around the parameter estimates in the segmented regression models, limiting the power to detect changes.16 Interestingly, we did not observe changes in the UK and Spain, the databases with the larger sample sizes.
Thirdly, incomplete BP recordings in general practice may have led to information bias. Generally, patients with more healthcare encounters and/or chronic diseases are more likely to have their BP measured and recorded.17–20 The incomplete information on blood pressure values in the electronic healthcare records in our study was consistent with other reports.21–24 All four countries included in this study have guidelines recommending regular blood pressure measurements for chronic diseases such as diabetes and cardiovascular disease.9,10,22,25 The Netherlands,26 the UK27 and Spain,28 but not Finland, use monitoring of risk factors such as BP as indicators to monitor the quality of care for chronic diseases. This is consistent with the observed higher proportion of patients without recorded blood pressure measurements in Finland. The 40–60% lower proportion of diabetes patients among patients with unconfirmed hypertension status compared to those with documented hypertension (Supplemental Table 1) is also consistent with more frequent BP recording among patients with chronic disease. Among normotensive patients or patients without chronic diseases, BP measurements may not be assessed as often, or may simply be recorded in inaccessible plain text fields in the electronic health records, rather than accessible fields used for the purpose of assessing the quality of care. In this study, patients without recorded BP, hypertension diagnosis or antihypertensive treatment were therefore assumed to be normotensive. This may have led to the potential misclassification of patients with unconfirmed hypertension to the group of normotensive patients. This does not impact our study findings, as these are based on patients with documented hypertension.
Fourthly, in order to detect a change in BP monitoring intensity during treatment, regular check-ups are required, but the duration of treatment is often limited. More than 50% of patients have been reported to have stopped treatment after 1 month29 or after the first prescription30 (i.e. non-persistence), and after 1 year the supplied amount of mirabegron has been reported to cover <60% of the period.29 Alleviation of symptoms is a factor in non-persistence with treatment for overactive bladder, and intermittent treatment is often observed.29,30 Therefore, we allowed mirabegron treatment to contain gaps of up to 12 months, with the aim of ensuring that duration of treatment was long enough to allow comparison of quarterly BP monitoring rates before and after DHPC dissemination. Multiple post-hoc sensitivity analyses with different periods of follow-up, including as short as 1 month, were performed to assess the impact on results, but none of the analyses yielded a difference in BP monitoring rates before and after the DHPC.5
Fifthly, up to March 2015, reimbursement of mirabegron in Finland was limited to patients who did not tolerate anticholinergic drugs. The time between March and September 2015 was too short to allow sensitivity analyses to assess if potential changes in patient characteristics since then may have impacted any conclusions.
Finally, because of the floor effect for the primary outcome of severe uncontrolled hypertension, and our approach to extend analyses to non-severe uncontrolled hypertension, our analysis did not only evaluate the outcome for which the additional risk minimisation measure was intended, and therefore conclusions related to this extended analysis need to be interpreted with caution. The floor effect for severe uncontrolled hypertension does raise the question whether studies to assess the effectiveness of risk minimisation measures should require certain conditions to be met (such as a minimum frequency of a contra-indication), before committing to ITS analyses. Power calculation methods for ITS analyses have only become available after finalisation of our study.16 However, these require estimates of the cumulative incidence of the outcome in the population being studied, which may only become available during execution of the study, as was the case in our study, or via a feasibility study.
Despite these uncertainties, many of which are common in studies using routinely collected healthcare data, we were able to incorporate large patient cohorts from four different countries into a study that offered the opportunity to evaluate the impact of the DHPC. The use of a common data model, and common programs ensuring identical analyses in each of the databases, made results across countries more comparable. The similarities in recorded population characteristics in the different countries were reassuring.
Conclusion
The use of mirabegron by patients with severe uncontrolled hypertension was uncommon in our study even pre-DHPC dissemination, as reflected by the low prevalence in the population. This suggests that other risk minimisation communications (prior to the DHPC dissemination), such as the SmPC, may have generally worked with respect to minimising this particular potential risk. No strong or consistent evidence of further risk minimisation after the DHPC dissemination was observed in this study. Also, no evidence of increased monitoring of blood pressure in hypertensive patients was observed post-DHPC dissemination.
Abbreviations
AIC, Akaike Information Criterion; BIC, Bayesian Information Criterion; BP, Blood pressure; DBP, Diastolic blood pressure; DHPC, Direct Healthcare Professional Communication; EAC, Estimated absolute change; EMA, European Medicines Agency; GP, General Practice; SBP, Systolic blood pressure; SD, Standard deviation; SmPC, Summary of product characteristics; UK, United Kingdom.
Data Sharing Statement
The data used for this study were used under license for the current study, and so are not publicly available. The data can however be made available from each of the contributing database partners, upon reasonable request and with permission obtained through required ethics applications and applications to each data holder.
Ethics and Consent Statement
No ethics approval is required for use of anonymized data from the PHARMO Database Network. Scientific approval was obtained from the SIDIAP Scientific Committee and ethical approval was granted by CEIC Idiap Jordi Gol (reference number P17/019). CPRD obtains annual research ethics approval from the UK’s Health Research Authority (HRA) Research Ethics Committee (REC) (East Midlands – Derby, REC reference number 05/MRE04/87) for observational studies using CPRD data for public health research. In Finland, the study protocol was approved by the Coordinating Ethical Review Board of Helsinki University Hospital (Dnro HUS/618/2017). Patient informed consent was not required in any database as only anonymised retrospective data were used for this study.
Acknowledgments
The authors would like to thank all healthcare providers and patients contributing information to the PHARMO Database Network, the CPRD and SIDIAP. In Finland, the following national registers contributed data to the study: the electronic e-Prescription Register, Care Register for Health Care, Register of Primary Health Care Visits, Population Register Centre and Causes of Death Registry, and the cities of Helsinki, Espoo and Vantaa as well as the Hospital District of Helsinki and Uusimaa (HUS).
Funding
This post-authorisation safety study was funded by Astellas Pharma, the market authorisation holder of mirabegron. Astellas Pharma was involved in all stages of this study from protocol development to submission of the manuscript.
Disclosure
Edith M. Heintjes, Irene D. Bezemer, Elisabeth Smits and Fernie J.A. Penning-van Beest performed this work as employees of the PHARMO Institute for Drug Outcomes Research. This independent research institute performs financially supported studies for government and related healthcare authorities and pharmaceutical companies. Daniel Prieto-Alhambra leads the Pharmaco- and Device Epidemiology research group at the Centre for Statistics in Medicine, Oxford University. Daniel Prieto-Alhambra also reports that Janssen, on behalf of IMI-funded EHDEN and EMIF consortiums, and Synapse Management Partners have supported training programmes organised by DPA’s department and open for external participants. This group has received speaker fees and consultancy fees from Amgen and UCB, and research grants from Amgen, UCB, Les Laboratories Servier, Novartis, and Astellas. Ying (Helen) He is a postdoctoral research fellow at the Pharmaco- and Device Epidemiology research group at the Centre for Statistics in Medicine, Oxford University. Minna Vehkala and Fabian Hoti are employees of Statfinn – EPID Research, which performs commissioned pharmacoepidemiological studies; and thus their employees have been and currently are working in collaboration with several pharmaceutical companies. Daniel Dedman and Helen P. Booth are full time employees of CPRD, which provides contract research services for government and related healthcare authorities, and the pharmaceutical industry, including Astellas Pharma. Stefan de Vogel, Noah Jamie Robinson, and Kwame Appenteng are employees of Astellas. The authors report no other conflicts of interest in this work.
References
1. Staskin D, Herschorn S, Fialkov J, LM T, Walsh T, Schermer CR. A prospective, double-blind, randomized, two-period crossover, multicenter study to evaluate tolerability and patient preference between mirabegron and tolterodine in patients with overactive bladder (PREFER study). Int Urogynecol J. 2018;29(2):273–283. doi:10.1007/s00192-017-3377-5
2. Sicras-Mainar A, Navarro-Artieda R, Ruiz-Torrejon A, Saez M, Coll-de Tuero G, Sanchez L. [A retrospective, observational and multicentre study on patients with hyperactive bladder on treatment with mirabegron and oxybutinine under usual clinical practice conditions]. Semergen. 2017;43(4):277–288. doi:10.1016/j.semerg.2016.05.006
3. Meves SH, Hummel T, Endres HG, et al. Effectiveness of antiplatelet therapy in atherosclerotic disease: comparing the ASA low-response prevalence in CVD, CAD and PAD. J Thromb Thrombolysis. 2014;37(2):190–201. doi:10.1007/s11239-013-0919-7
4. Guideline on Good Pharmacovigilance Practices (GVP) - Module IX – Signal Management (Rev 1). Vol. 2017. European Medicines Agency and Heads of Medicines Agencies; 2017.
5. Drug utilization study of mirabegron (Betmiga®) using real-world healthcare databases from the Netherlands. EU PAS Register Number 15063. Spain, UK and Finland. 2017. Available from: http://www.encepp.eu/encepp/viewResource.htm?id=29595.
6. WHO Collaborating Centre for Drug Statistics Methodology. ATC/DDD index. Available from: https://www.whocc.no/atc_ddd_index/.
7. Catalan V, Lelorier J. Predictors of long-term persistence on statins in a subsidized clinical population. Value Health. 2000;3(6):417–426. doi:10.1046/j.1524-4733.2000.36006.x
8. Thomsen TL, Heintjes EM, Penning-van Beest FJA, Christensen TE, Herings RMC. Fewer treatment changes with premixed insulin analogues compared to premixed human insulin – a real-life treatment pattern analysis of patients with type 2 diabetes in the Netherlands. Value Health. 132010.
9. Heintjes EM, Thomsen TL, Penning-van Beest FJA, Christensen TE, Herings RMC. Glycaemic control and insulin utilisation in patients with type 2 diabetes initiated on a long-acting insulin analogue in a Dutch real-life setting. Value Health. 2010;132010:A55.
10. Bartelink ME, Elsman BH, Oostindjer Aet al,. NHG-Standaard Cardiovascular risicomanagement(Tweede herziening). Huisarts Wet. 2012;55(1):15.
11. Agency EM. Summary of Product Characteristics Betmiga; 2012.
12. Kontopantelis E, Doran T, Springate DA, Buchan I, Reeves D. Regression based quasi-experimental approach when randomisation is not an option: interrupted time series analysis. BMJ. 2015;350:h2750. doi:10.1136/bmj.h2750
13. Hawley S, Leal J, Delmestri A, et al. Anti-osteoporosis medication prescriptions and incidence of subsequent fracture among primary hip fracture patients in England and Wales: an interrupted time-series analysis. J Bone Miner Res. 2016;31(11):2008–2015. doi:10.1002/jbmr.v31.11
14. Wagner AK, Soumerai SB, Zhang F, Ross-Degnan D. Segmented regression analysis of interrupted time series studies in medication use research. J Clin Pharm Ther. 2002;27(4):299–309. doi:10.1046/j.1365-2710.2002.00430.x
15. Zhang F, Wagner AK, Soumerai SB, Ross-Degnan D. Methods for estimating confidence intervals in interrupted time series analyses of health interventions. J Clin Epidemiol. 2009;62(2):143–148. doi:10.1016/j.jclinepi.2008.08.007
16. Hawley S, MS A, Berencsi K, Judge A, Prieto-Alhambra D. Sample size and power considerations for ordinary least squares interrupted time series analysis: a simulation study. Clin Epidemiol. 2019;11(197–205):197–205. doi:10.2147/CLEP
17. Kilpelainen K, Tuomi-Nikula A, Thelen J, et al. Health indicators in Europe: availability and data needs. Eur J Public Health. 2012;22(5):716–721. doi:10.1093/eurpub/ckr195
18. Marston L, Carpenter JR, Walters KR, Morris RW, Nazareth I, Petersen I. Issues in multiple imputation of missing data for large general practice clinical databases. Pharmacoepidemiol Drug Saf. 2010;19(6):618–626. doi:10.1002/pds.v19:6
19. Phelan M, Bhavsar NA, Goldstein BA. Illustrating informed presence bias in electronic health records data: how patient interactions with a health system can impact inference. EGEMS (Washington, DC). 2017;5(1):22.
20. Stevens SL, McManus RJ, Stevens RJ. Current practice of usual clinic blood pressure measurement in people with and without diabetes: a survey and prospective ‘mystery shopper’ study in UK primary care. BMJ Open. 2018;8(4):e020589. doi:10.1136/bmjopen-2017-020589
21. Luymes CH, de Ruijter W, Poortvliet RK, et al. Change in calculated cardiovascular risk due to guideline revision: a cross-sectional study in the Netherlands. Eur J Gen Pract. 2015;21(4):217–223. doi:10.3109/13814788.2015.1064389
22. Rosell-Murphy M, Rodriguez-Blanco T, Moran J, et al. Variability in screening prevention activities in primary care in Spain: a multilevel analysis. BMC Public Health. 2015;15(1):473. doi:10.1186/s12889-015-1767-5
23. Peng M, Chen G, Kaplan GG, et al. Methods of defining hypertension in electronic medical records: validation against national survey data. J Public Health (Oxf). 2016;38(3):e392–e399. doi:10.1093/pubmed/fdv155
24. Suija K, Kivisto K, Sarria-Santamera A, et al. Challenges of audit of care on clinical quality indicators for hypertension and type 2 diabetes across four European countries. Fam Pract. 2015;32(1):69–74. doi:10.1093/fampra/cmu078
25. NICE Quality and Outcomes Framework indicator. The National Institute for Health and Care Excellence (NICE). Available from: https://www.nice.org.uk/standards-and-indicators/qofindicators?categories=&page=3.
26. Sidorenkov G, Voorham J, de Zeeuw D, Haaijer-Ruskamp FM, Denig P. Do treatment quality indicators predict cardiovascular outcomes in patients with diabetes? PLoS One. 2013;8(10):e78821. doi:10.1371/journal.pone.0078821
27. Wilson A. Building primary care in a changing Europe: case studies [Internet]. 2015(Observatory Studies Series, No. 40.). UK. Available from: https://www.ncbi.nlm.nih.gov/books/NBK459014/.
28. Dedeu T, Bolibar B, Gené J, Pareja C, Violan C. Building primary care in a changing Europe: case studies [Internet]. 2015(Observatory Studies Series, No. 40.). Spain. Available from: https://www.ncbi.nlm.nih.gov/books/NBK459029/.
29. Yeowell G, Smith P, Nazir J, Hakimi Z, Siddiqui E, Fatoye F. Real-world persistence and adherence to oral antimuscarinics and mirabegron in patients with overactive bladder (OAB): a systematic literature review. BMJ Open. 2018;8(11):e021889. doi:10.1136/bmjopen-2018-021889
30. Margulis AV, Linder M, Arana A, et al. Patterns of use of antimuscarinic drugs to treat overactive bladder in Denmark, Sweden, and the United Kingdom. PLoS One. 2018;13(9):e0204456. doi:10.1371/journal.pone.0204456
 © 2020 The Author(s). This work is published and licensed by Dove Medical Press Limited. The full terms of this license are available at https://www.dovepress.com/terms.php and incorporate the Creative Commons Attribution - Non Commercial (unported, v3.0) License.
By accessing the work you hereby accept the Terms. Non-commercial uses of the work are permitted without any further permission from Dove Medical Press Limited, provided the work is properly attributed. For permission for commercial use of this work, please see paragraphs 4.2 and 5 of our Terms.
© 2020 The Author(s). This work is published and licensed by Dove Medical Press Limited. The full terms of this license are available at https://www.dovepress.com/terms.php and incorporate the Creative Commons Attribution - Non Commercial (unported, v3.0) License.
By accessing the work you hereby accept the Terms. Non-commercial uses of the work are permitted without any further permission from Dove Medical Press Limited, provided the work is properly attributed. For permission for commercial use of this work, please see paragraphs 4.2 and 5 of our Terms.