")
Back to Journals » OncoTargets and Therapy » Volume 13
Evaluating Solid Lung Adenocarcinoma Anaplastic Lymphoma Kinase Gene Rearrangement Using Noninvasive Radiomics Biomarkers
Authors Ma DN , Gao XY, Dan YB, Zhang AN, Wang WJ, Yang G , Zhu HZ
Received 11 April 2020
Accepted for publication 15 June 2020
Published 16 July 2020 Volume 2020:13 Pages 6927—6935
DOI https://doi.org/10.2147/OTT.S257798
Checked for plagiarism Yes
Review by Single anonymous peer review
Peer reviewer comments 2
Editor who approved publication: Dr Federico Perche
De-Ning Ma,1,2,* Xin-Yi Gao,2,3,* Yi-Bo Dan,4,* An-Ni Zhang,2,3 Wei-Jun Wang,2,3 Guang Yang,4 Hong-Zhou Zhu2,3
1Department of Colorectal Surgery, Cancer Hospital of the University of Chinese Academy of Sciences (Zhejiang Cancer Hospital), Hangzhou 310022, Zhejiang Province, People’s Republic of China; 2Institute of Cancer and Basic Medicine (ICBM), Chinese Academy of Sciences, Hangzhou 310022, Zhejiang Province, People’s Republic of China; 3Department of Radiology, Cancer Hospital of the University of Chinese Academy of Sciences (Zhejiang Cancer Hospital), Hangzhou 310022, Zhejiang Province, People’s Republic of China; 4Department of Physics, Shanghai Key Laboratory of Magnetic Resonance, Shanghai 200062, People’s Republic of China
*These authors contributed equally to this work
Correspondence: Hong-Zhou Zhu
Cancer Hospital of the University of Chinese Academy of Sciences (Zhejiang Cancer Hospital), 1# East Banshan Road, Hangzhou City, Zhejiang Province 310022, People’s Republic of China
Tel/ Fax +86 571-88122222
Email [email protected]
Guang Yang
Department of Physics, Shanghai Key Laboratory of Magnetic Resonance, 3663# North Zhongshan Road, Shanghai 200062, People’s Republic of China
Tel/ Fax +86 21-62233873
Email [email protected]
Purpose: To develop a radiogenomics classifier to assess anaplastic lymphoma kinase (ALK) gene rearrangement status in pretreated solid lung adenocarcinoma noninvasively.
Materials and Methods: This study consisted of 140 consecutive pretreated solid lung adenocarcinoma patients with complete enhanced CT scans who were tested for both EGFR mutations and ALK status. Pre-contrast CT and standard post-contrast CT radiogenomics machine learning classifiers were designed as two separate classifiers. In each classifier, dataset was randomly split into training and independent testing group on a 7:3 ratio, accordingly subjected to a 5-fold cross-validation. After normalization, best feature subsets were selected by Pearson correlation coefficient (PCC) and analysis of variance (ANOVA) or recursive feature elimination (RFE), whereupon a radiomics classifier was built with support vector machine (SVM). The discriminating performance was assessed with the area under receiver-operating characteristic curve (AUC), accuracy, sensitivity, specificity, positive predictive value (PPV), and negative predictive value (NPV).
Results: In classifier one, 98 cases were selected as training data set, 42 cases as independent testing data set. In classifier two, 87 cases were selected as training data set, 37 cases as independent testing data set. Both classifiers extracted 851 radiomics features. The top 25 pre-contrast features and top 19 post-contrast features were selected to build optimal ALK+ radiogenomics classifiers accordingly. The accuracies, AUCs, sensitivity, specificity, PPV, and NPV of pre-contrast CT classifier were 78.57%, 80.10% (CI: 0.6538– 0.9222), 71.43%, 82.14%, 66.67%, and 85.19%, respectively. Those results of standard post-contrast CT classifier were 81.08%, 82.85% (CI: 0.6630– 0.9567), 76.92%, 83.33%, 71.43%, and 86.96%.
Conclusion: Solid lung adenocarcinoma ALK+ radiogenomics classifier of standard post-contrast CT radiomics biomarkers produced superior performance compared with that of pre-contrast one, suggesting that post-contrast CT radiomics should be recommended in the context of solid lung adenocarcinoma radiogenomics AI. Standard post-contrast CT machine learning radiogenomics classifier could help precisely identify solid adenocarcinoma ALK rearrangement status, which may act as a pragmatic and cost-efficient substitute for traditional invasive ALK status test.
Keywords: radiogenomics, SVM, non-small cell lung cancer, anaplastic lymphoma kinase, epidermal growth factor receptor
Corrigendum for this paper has been published.
Introduction
Lung cancer is one of the leading causes of cancer-related death worldwide, among which approximately 85–90%1 of cases are non-small cell lung cancer (NSCLC). Lung adenocarcinomas are marked with distinct genomic changes that are correlated with clinically relevant molecular subtypes.2 Nowadays, the treatment of advanced NSCLC including adenocarcinoma has shifted into determining oncogenic driver mutation subtypes.3 Epidermal growth factor receptor (EGFR) mutations and anaplastic lymphoma kinase (ALK) rearrangement are the two most targeting “druggable” oncogenic driver mutation subtypes in NSCLC.4 ALK+ NSCLC, though it accounts for only 2–7% of NSCLC,5,6 expresses a sensitive responsiveness to ALK inhibitors such as ceritinib, crizotinib, lorlatinib,7 and brigatinib.8 ALK targeted therapies have been developed and subsequently continuously evolved for more than ten years since the discovery of ALK rearrangement in NSCLC, boosting achievement in median progression free survival (PFS),9 overall response rate (ORR),10 overall survival (OS),11 and individual precision medicine.7
To determine eligible pretreated adenocarcinoma patients for ALK targeted therapy, it is crucial to address both pragmatic and cost-efficient assessment of ALK status. Fluorescence in situ hybridization (FISH) and next-generation sequencing (NGS) are recognized as the “gold standard” for ALK gene test.12 Immunohistochemistry (IHC) serves as a widely-used surrogate to FISH or molecular method. Other methods include quantitative reverse transcription-PCR, RNA scope, etc. Traditional invasive gene testing was recognized as the one and only effective method to identify those ALK positive patients. The incapability to obtain overall information about highly heterogeneous lung cancer preoperatively remains a major limitation of traditional gene testing based on invasive local puncture sample. Besides, the broad employment of NGS in routine clinical setting is hampered by its relatively time consuming, invasive nature, as well as complicated processes.12 All these limitations may enormously restrict the practicability of individual precision medicine.
In clinical practice, computed tomography (CT) scanning is the most easy-to-handle approach to diagnose and evaluate pretreated lung cancer. Radiomics is an emerging field that involves the use of high-throughput computing to extract a large number of quantitative features from medical imaging data.13 Recently, radiomics research interest in NSCLC including adenocarcinoma has been growing, involving survival prediction,14,15 distant metastasis prediction,16 local control and radiation pneumonitis,17 histologic subtypes classification,18 targeted therapy response phenotype,19 etc. The attempts to define the association between imaging textures (CT, for example) and cancer genomic phenotypes have accelerated the development of “radiogenomics”. By extracting high throughout of CT series, radiogenomics allows the noninvasive diagnosis of tumor gene mutations in NSCLC EGFR mutation prediction,20 prediction of pathological stage in NSCLC using machine learning21 or deep learning22 and NSCLC multi-subtype classifications.23
Whilst several previous studies have demonstrated certain radiological characteristics associated with NSCLC ALK+ and built a diagnostic model24 based on radiological characteristics and clinical factors, the role of CT based radiogenomics machine learning in ALK+ solid lung adenocarcinoma remains to be explored. Therefore, we hypothesized that lung adenocarcinoma ALK status differences and relevant phenotype discriminations are mirrored in radiomics features. Thus, radiogenomics machine learning of standard enhanced CT scans, which combines 3D radiomics features, blood supply distinction, and entire tumor burden information, can help to identify solid lung adenocarcinoma anaplastic lymphoma kinase gene rearrangement status.
Materials and Methods
Figure 1 demonstrates the flowchart of this study.
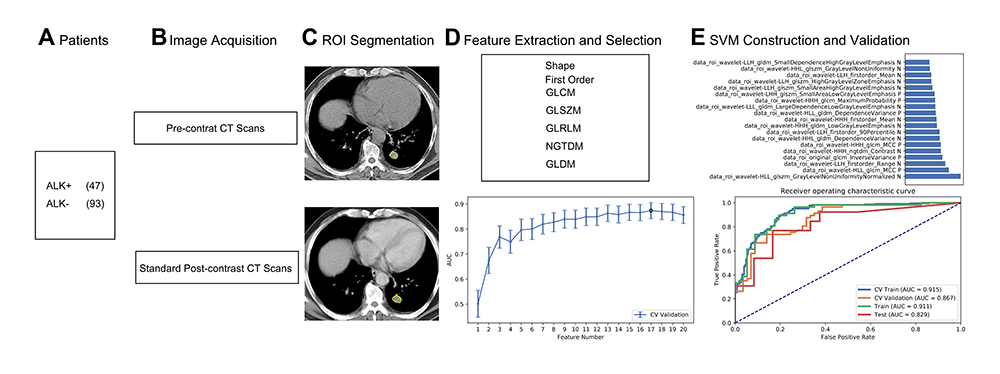 |
Figure 1 Flowchart of this study. (A) Patients. (B) Image Acquisition. (C) ROI Segmentation. (D) Feature Extraction and Selection. (E) SVM Construction and Validation. |
Ethical Approval
This study was conducted in accordance with the Declaration of Helsinki. This retrospective single center analysis was approved by the local ethics committee of Zhejiang Cancer Hospital (IRB-2019-142). Written informed consent for pre- and post-contrast enhanced CT series were obtained from all patients.
Patients
We retrospectively reviewed all pretreated solid lung adenocarcinoma patients whose ALK and EGFR status were analyzed and who underwent pre- and post-contrast CT from September 2015 to September 2018. Accordingly, forty-seven ALK+ patients were identified as the study group. Meanwhile, pretreated solid adenocarcinoma patients with positive EGFR mutations (n=44) and none mutation (n=49) were randomly selected from local database on a 1:1:1 ratio as contrast group. In total, 140 cases were initially gathered (53 men and 87 women; mean age, 54.19 years; range, 23–80 years) according to the following criteria: 1) pathologically confirmed adenocarcinoma; 2) presence of solid lesion on pretreatment CT; 3) ALK rearrangement was diagnosed by IHC or NGS technologies; EGFR mutation was tested by amplification refractory mutation system (ARMs). 4) Less than one-month interval between CT exams and gene alternation analysis. 5) No compound cancer history. In classifier two, cases with inconsistency between pre- and post-contrast slice thickness were further excluded. Clinical characteristics including sex, age, histopathology, staging, and smoking history were recorded. Clinical features between ALK+ group and ALK- group were analyzed using SPSS 18.0 for windows (SPSS Inc); the Pearson χ2 test or Fisher’s exact test was used to compare qualitative variables; and quantitative variables were analyzed by the t-test or Pearson’s correlation test.
Image Acquisition
All patients underwent both pre- and standard iodine enhanced CT scans when they were initially admitted to our institution before any treatment. CT exams were performed either on a 16-detector CT scanner or on a 64-detector CT scanner (Sensation 16; SOMATOM Definition Flash 64; Siemens Medical Solutions, Forchheim, Germany). For the 16-detector scanner, the parameters were 120 kV and 100 effective mA. For the 64-detector scanner, the parameters were 120 kV and 110 effective mA. Dose modulation was used in both scanners. Images were reconstructed with a section thickness of 5 mm and a gap of 1 mm. Post-contrast scanning started 38–48 s after intravenous administration 100 mL of loversol injection (Optiray, Guerbet, Villepinte, France) at a rate of 2.8 mL/sec by using a power injector.
Image Pre-Processing and Segmentation
Every lesion was segmented manually slice by slice by two radiologists (reader 1: X.Y.G. with 5 years experience; reader 2: A.N.Z. with 5 years experience) using ITK-SNAP (http://www.itksnap.org), and then scrutinized by a radiology professor (H.Z.Z, with 26 years work experience). We further tested intra- and inter-observer reproducibility according to Wu et al.25 Accordingly, we initially chose 25 lesions and lay an ICC greater than 0.75 as satisfying reproducibility agreement.
Machine Learning Process
In order to be potentially clinically effective, we designed classifiers on pre-contrast CT features (classifier 1) and standard post-contrast enhanced CT features (classifier 2).
In each classifier, radiomics features were extracted from each ROI with Pyradiomics (http://pyradiomics.readthedocs.io/en/latest/index.html). Classes of features included Shape, First Order, Gray Level Co-occurrence Matrix, Gray Level Size Zone Matrix, Gray Level Run Length Matrix, Neighboring Gray Tone Difference Matrix and Gray Level Dependence Matrix. We then applied normalization and standardization on the feature matrix. For each feature vector, we calculated the L2 norm and divided by it. Then the feature vector was mapped to a unit vector. Since the dimension of feature space was high, we compared the similarity of each feature pair. According to a previous study,26 if the Pearson correlation coefficient (PCC) value of the feature pair was larger than 0.86, we randomly removed one of them. After this process, the dimension of the feature space was reduced and each feature was independent to each other. Before building the model, we tried analysis of variance (ANOVA) and recursive feature elimination (RFE) separately to select features. Finally, we picked the best-behaved feature selection method by comparing the results between the two methods. ANOVA is a common method to explore the significant features corresponding to the labels. F-value was calculated to evaluate the relationship between features and the labels. We sorted features according to the corresponding F-value and selected a specific number of features to build the model. The goal of RFE is to select features based on a classifier by recursively considering smaller set of the features. We used support vector machine (SVM) as the machine learning classifier and applied synthetic minority oversampling technique (SMOTE) algorithm to balance between data groups. The kernel function has the ability to map the features into a higher dimension to search the hyper-plane for separating the cases with different labels. Here we used the linear kernel function because it was easier to explain the coefficients of the features for the final model. To prove the performance of the model, we applied cross-validation with 5-folder on the data set. The performance of the model was evaluated using receiver operating characteristic (ROC) curve analysis. The area under the ROC curve (AUC) was calculated for quantification. The accuracy, sensitivity, specificity, positive predictive value (PPV), and negative predictive value (NPV) were also calculated at a cutoff value that maximized the value of the Yorden index. We also boosted estimation 1000 times and applied paired t-test to give the 95% confidence interval. All these processes were implemented with FeAture Explorer (FAE, v0.2.5, https://github.com/salan668/FAE) on Python (3.6.8, https://www.python.org/).
Results
Clinical and Imaging Data
Table 1 demonstrates the clinical characteristics of ALK+ adenocarcinoma group and ALK- adenocarcinoma group. In classifier two, 3 ALK+ patients and 13 ALK- patients (6 EGFR+, 7 negative) were excluded due to inconsistency between pre- and post-contrast slice thickness. All the inter- and intra-observer reproducibility of lesions’ segmentation reached a satisfying standard. Hence, the rest of the ROIs were drawn by the first radiologist. Figure 2 demonstrates an example of ALK+ patients with pre- and standard post-contrast CT scans.
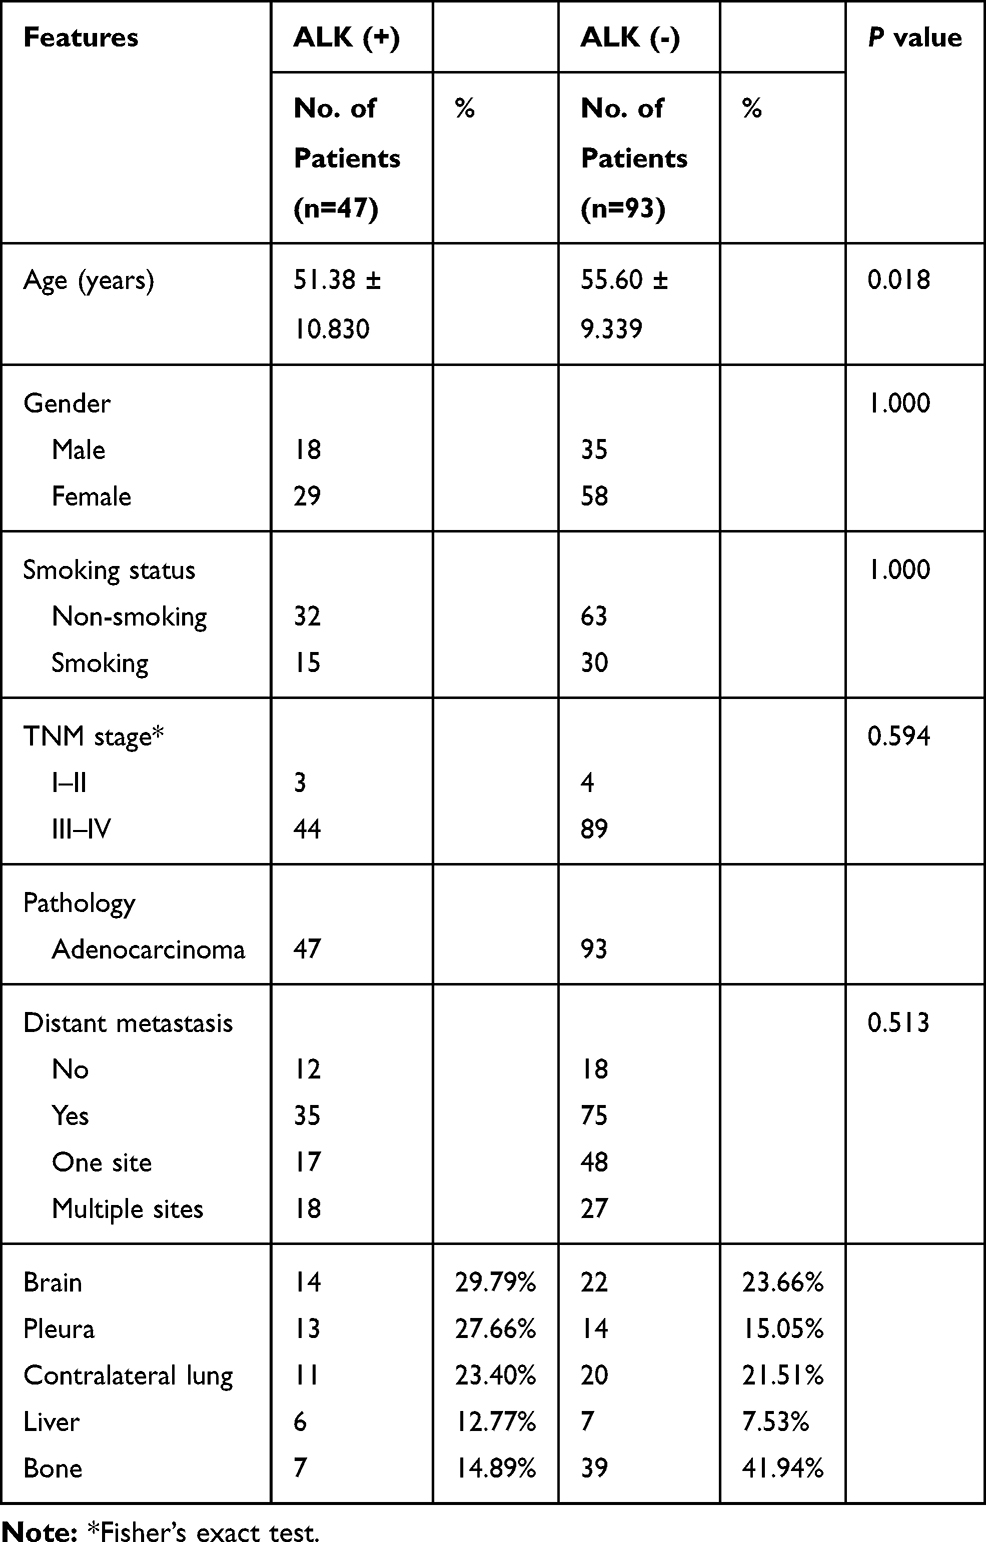 |
Table 1 Clinical Characteristics of the ALK (+) and ALK (-) Patients |
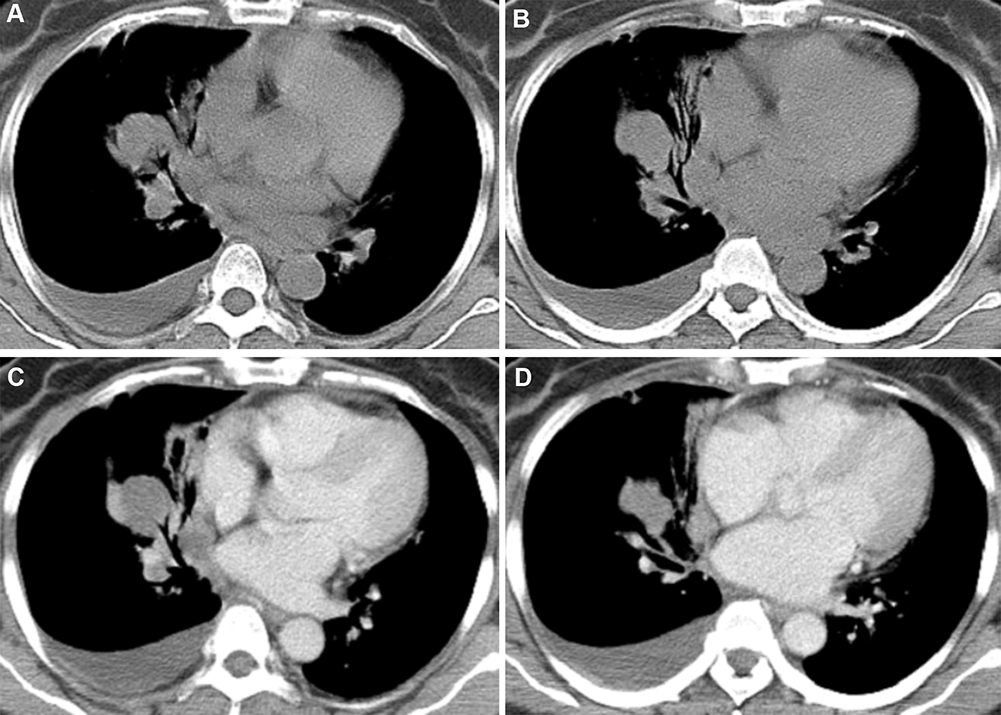 |
Figure 2 CT images obtained in a 49-year old woman with ALK rearrangement solid lung adenocarcinoma. Transverse mediastinal window, 5 mm slice thickness. (A and B) Pre-contrast scans. (C and D) Standard post-contrast scans. |
Classifier 1: Pre-Contrast CT Radiogenomics Classifier
During this process, only features extracted from pre-contrast CT were analyzed. One hundred and forty cases were randomly split into training data set (n=98), and independent testing data set (n=42) on a 7:3 ratio. The top 25 features were chosen by ANOVA across a total of 851 features. Figure 3B demonstrates the OSE feature selection method. In this classifier, the pre-contrast CT radiogenomics classifier provided a diagnostic accuracy of 78.57%. The AUC was 85.90% in the training cohort, 80.10% in the validation cohort, and 80.10% (95% CI: 0.6538–0.9222) in the test cohort with 71.43% sensibility, 82.14% specificity, 66.67% PPV, and 85.19% NPV (Table 2). Figure 3A demonstrates the ROC curve of classifier 1. Figure 3C demonstrates the contribution of selected features in classifier 1.
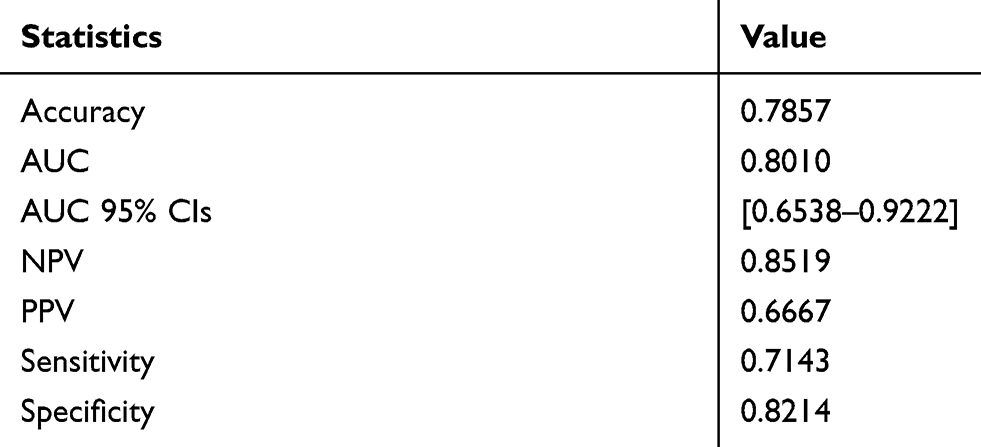 |
Table 2 Diagnostic Efficiency of Classifier 1 |
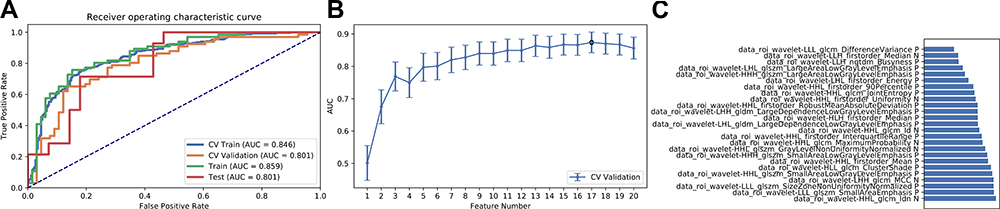 |
Figure 3 Results of classifier 1. (A) The receiver-operating characteristic curve of classifier 1. (B) Selection of optimal features using ANOVA. (C) Contribution of selected radiomics features of classifier 1. |
Classifier 2: Post-Contrast CT Radiogenomics Classifier
During this process, only features extracted from post-contrast CT were analyzed. One hundred and twenty-four cases were randomly split into training data set (n=87), and independent t-testing data set (n=37) on a 7:3 ratio. The top 19 features were chosen by RFE across a total of 851 features. Figure 4B demonstrates the OSE feature selection method. In this classifier, the pre-contrast CT radiogenomics classifier provided a diagnostic accuracy of 81.08%. The AUC was 91.10% in the training cohort, 82.85% in the validation cohort, and 82.90% (95% CI: 0.6630–0.9567) in the test cohort with 76.92% sensibility, 83.33% specificity, 71.43% PPV, and 86.96% NPV (Table 3). Figure 4A demonstrates the ROC curve of classifier 2. Figure 4C demonstrates the contribution of selected features in classifier 2.
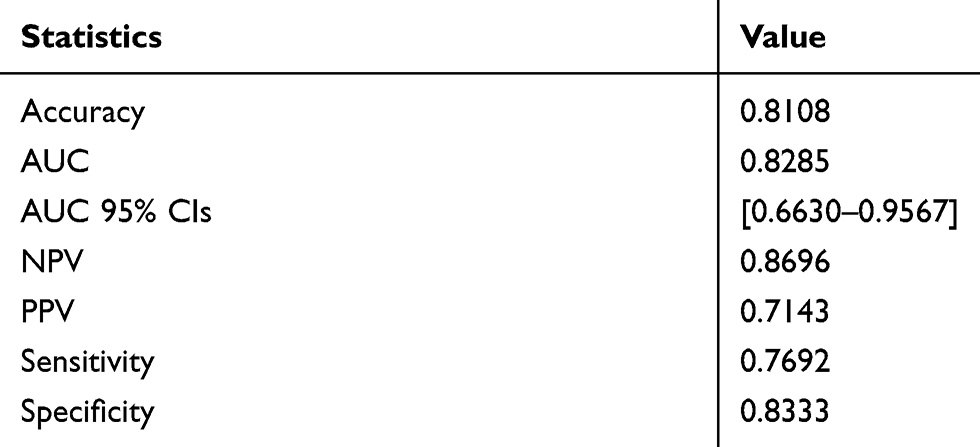 |
Table 3 Diagnostic Efficiency of Classifier 2 |
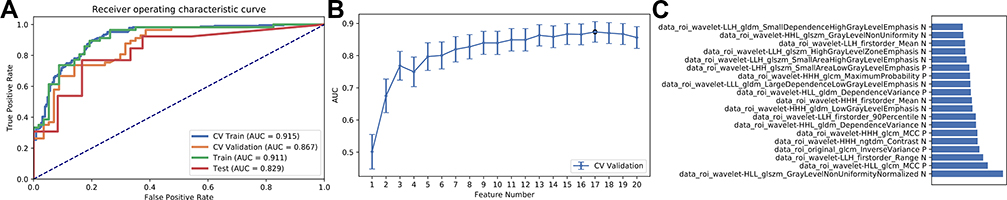 |
Figure 4 Results of classifier 2. (A) The receiver-operating characteristic curve of classifier 2. (B) Selection of optimal features using RFE. (C) Contribution of selected radiomics features of classifier 2. |
Discussion
Highlighted by therapeutic advances in ALK inhibitors, assessing personalized ALK status effectively and accurately is of significant importance. However, in clinical practice, the availability of attainable and sufficient ALK status test is sometimes challenging. In this study, a radiogenomics machine learning classifier built with 19 selected standard post-contrast CT radiomics feature to assess ALK+ status in pretreated solid lung adenocarcinoma showed the best diagnostic performance, compared with that of pre-contrast CT classifier. Therefore, the standard post-contrast CT machine learning radiogenomics classifier could help precisely and non-invasively identify solid lung adenocarcinoma ALK rearrangement status, which may act as a pragmatic and cost-efficient substitute for traditional invasive ALK status test.
Generally, there are three major oncogenic driver mutation subtypes of lung adenocarcinoma, namely the most common and widely assessed epidermal growth factor receptor (EGFR), ALK and Kirsten rat sarcoma viral oncogene homolog (KRAS). ALK+ cases represent a small but significant adenocarcinoma subgroup, because it makes up to 30% in the nonsmoking EGFR- NSCLC population.24 Notably, among all oncogenic driver mutation subtypes, only ALK+ and EGFR+ cases reacted to specific targeted drugs approved by both FDA27,28 and CFDA strikingly. The latest guideline29 suggested that EGFR and ALK gene status must be tested in lung cancer. ALK fusions typically occur independently from EGFR mutations,30 making it important to distinguish ALK+ cases from EGFR+ cases. Hence, in this study, we enrolled both EGFR+ cases and ALK- EGFR- oncogenic driver mutation cases in the contrast cohort.2 It is widely recognized that ALK+ adenocarcinomas are usually solid nodules or masses,2 pure ground glass nodules are scarce31 and have distinct radiological characteristics. Besides, conventional percutaneous transthoracic needle biopsy for pure ground glass nodules has certain limitations32 and was not highly recommended in our institution. Thus, we focused on solid lung adenocarcinoma lesions in this study.
In contrast to overall cases, ALK+ patients are typically younger, and present a non-smoking (defined as those who smoked less than 100 cigarettes in their lifetime33) or relatively light smoking history.34 Consistent with previous studies, ALK+ patients were significantly younger compared with ALK- patients in our study. However, smoking history and female gender were not significantly distinguishable. Most patients in our ALK+ study group had distant metastasis. Common metastatic sites in our ALK+ study group were brain, pleura, contralateral lung, liver, and bone.
In clinical practice, IHC serves as a practical method to detect ALK status. Generally, only samples with equivocal IHC patterns were further handled with the “gold standard” FISH or NGS methods. In our research, all the patients underwent IHC to test ALK status, only four patients with not high positive ALK expression were further diagnosed with ALK+ by NGS test. In addition to obtaining traditional tissue, recently, several minimally invasive cytological-based approaches have been adopted35 including samples from fine-needle aspiration,36 pleural effusion, bronchial brushing, etc. However, multiple obstacles such as relatively high cost, invasive risks, limited evaluation of whole lesion area as well as limited sensitivity cytological samples37 hamper the widespread identification of ALK+ adenocarcinoma patients. Radiogenomics addresses the need for a noninvasive measurement to distinguish patients with ALK+ adenocarcinoma who should undergo ALK targeted therapy. In addition, this radiogenomics analysis adequately involved 3D radiomics features, blood supply distinction and entire tumor burden information. Besides, clinical CT series are more accessible since most patients tend to be clinically diagnosed by CT scanning firstly.
Recent ALK+ NSCLC radiology studies mainly focused on subjective traditional radiological characteristics analysis38 based on naked eyes or on quantitative parameters drained from dual-energy spectral computed tomography (DESCT).39 Kim et al24 built an ALK+ predictive model yielding an AUC value of 0.832, combining multi-modality radiological characteristics and clinical factors. Recently, Ruan et al reported a best AUC value of 0.873, combining several 18F-FDG PET/CT parameters.37 Only a limited, small amount of readable imaging features were evaluated and utilized in recent conventional studies, leaving a huge amount of precious image information which could be potentially helpful to diagnose ALK+ status, untouched. By combining both various radiomics features of CT and novel machine learning, this study mined the conventional but practical CT image data to the utmost extent. This preliminary study outperformed previous studies by reaching comparatively precise adenocarcinoma ALK+ status diagnosis automatically, meanwhile objectively.
Lately, a handful of radiogenomics studies on lung cancer involved contrast CT images: Tu et al20 built an integrated EGFR+ NSCLC model (training cohort AUC/validation cohort AUC = 0.798/0.818) with pre-contrast CT radiomics, clinical and morphological data, which outperformed a clinical model. Zhao et al developed a deep learning system based on 3D convolutional neural network (CNN) to predict EGFR+ in pulmonary adenocarcinoma and achieved an AUC of 75%.22 He et al40 suggested that early contrast enhancement within 25 s affected the ability to diagnose lung nodules, lung cancer, and that non-contrast CT images showed better diagnostic performance. However, in clinical practice, a 25 second delay, which could be too early for lung lesion enhancement to show up, is not the standard timing for lung contrast enhancement. Kakino et al41 claimed that contrast enhancement in the delayed phase (120 s) of CT image for NSCLC patients affected some of the radiomics features and the variability of radiomics features, compared with non-contrast CT images. Of note, the performance of this radiogenomics classier was improved by replacing pre-contrast CT images with clinical standard post 38–48 s contrast CT images. One possible reason for this could be that the contrast enhancement during a proper time window may bring forward additional information that could be utilized by AI, suggesting that proper post-contrast CT radiomics should be recommended in the context of future NSCLC radiogenomics AI approaches.
In this study, two different scanners from the same manufacturer were adopted. A previous study42 evaluated NSCLC images from 100 CT scanners (including different manufacturers) at 35 clinics and found the radiomics varieties, which can be significantly reduced by image normalization and standardization,43 were relatively small. Hence, before analysis, we applied standardization and normalization to all the matrices. According to a recent NSCLC EGFR radiomics study, compared with thick CT slice (5 mm), thin slice (1 mm) achieved the best prediction value, independently of convolution kernels.44 In this retrospective study, nevertheless, in view of image standardization among each scan and avoiding interpolation, all CT images carried equal slice thickness of 5 mm.
In conclusion, this preliminary radiogenomics machine learning suggested: 1) solid lung adenocarcinoma ALK+ radiogenomics classifier of standard post-contrast CT radiomics biomarkers produced superior performance compared with that of pre-contrast one, suggesting that post-contrast CT radiomics should be recommended in the context of lung adenocarcinoma radiogenomics AI. 2) Standard post-contrast CT machine learning radiogenomics classifier could help to precisely identify solid lung adenocarcinoma ALK rearrangement status, which may act as a pragmatic and cost-efficient substitute for traditional invasive ALK status testing.
This study is limited by relatively small sample size, which cannot reflect the overall ALK+ adenocarcinoma population. Additionally, selection bias is inevitable due to its retrospective nature. Also, only three leading categories of adenocarcinoma were involved in this study; some rare genomic categories with low prevalence rate were not included. Therefore, a further prospective multicenter whole-genome adenocarcinoma radiogenomics study is called for to validate our current results.
Abbreviations
ALK, anaplastic lymphoma kinase; PCC, Pearson correlation coefficient; ANOVA, analysis of variance; RFE, recursive feature elimination; SVM, support vector machine; AUC, area under receiver-operating characteristic curve; PPV, positive predictive value; NPV, negative predictive value; NSCLC, non-small cell lung cancer; EGFR, epidermal growth factor receptor; PFS, progression free survival; ORR, overall response rate; OS, overall survival; NGS, next-generation sequencing; IHC, immunohistochemistry; SMOTE, synthetic minority oversampling technique; KRAS, Kirsten rat sarcoma viral oncogene homolog; DESCT, dual-energy spectral computed tomography; CNN, convolutional neural network.
Disclosure
The authors declared no conflicts of interest.
References
1. Bray F, Ferlay J, Soerjomataram I, Siegel RL, Torre LA, Jemal A. Global cancer statistics 2018: GLOBOCAN estimates of incidence and mortality worldwide for 36 cancers in 185 countries. CA Cancer J Clin. 2018;68(6):394–424.
2. Choi CM, Kim MY, Hwang HJ, Lee JB, Kim WS. Advanced adenocarcinoma of the lung: comparison of CT characteristics of patients with anaplastic lymphoma kinase gene rearrangement and those with epidermal growth factor receptor mutation. Radiology. 2015;275(1):272–279. doi:10.1148/radiol.14140848
3. Hoang T, Myung SK, Pham TT, Park B. Efficacy of crizotinib, ceritinib, and alectinib in ALK-positive non-small cell lung cancer treatment: a meta-analysis of clinical trials. Cancers. 2020;12(3):526. doi:10.3390/cancers12030526
4. Minguet J, Smith KH, Bramlage P. Targeted therapies for treatment of non-small cell lung cancer–recent advances and future perspectives. Int J Cancer. 2016;138(11):2549–2561. doi:10.1002/ijc.29915
5. Tian HX, Zhang XC, Yang JJ, et al. Clinical characteristics and sequence complexity of anaplastic lymphoma kinase gene fusions in Chinese lung cancer patients. Lung Cancer. 2017;114:90–95. doi:10.1016/j.lungcan.2017.11.001
6. Bendaly E, Dalal AA, Culver K, et al. Treatment patterns and early outcomes of ALK-positive non-small cell lung cancer patients receiving ceritinib: a chart review study. Adv Ther. 2017;34(5):1145–1156. doi:10.1007/s12325-017-0527-6
7. Thai AA, Solomon BJ. Treatment of ALK-positive nonsmall cell lung cancer: recent advances. Curr Opin Oncol. 2018;30(2):84–91. doi:10.1097/CCO.0000000000000431
8. Ng TL, Narasimhan N, Gupta N, Venkatakrishnan K, Kerstein D, Camidge DR. Early-onset pulmonary events associated with brigatinib use in advanced non-small cell lung cancer. J Thorac Oncol. 2020. doi:10.1016/j.jtho.2020.02.011
9. Fan J, Fong T, Xia Z, Zhang J, Luo P. The efficacy and safety of ALK inhibitors in the treatment of ALK-positive non-small cell lung cancer: a network meta-analysis. Cancer Med. 2018;7(10):4993–5005. doi:10.1002/cam4.1768
10. Solomon BJ, Mok T. First-line crizotinib in ALK-positive lung cancer. N Engl J Med. 2015;372(8):782.
11. Li G, Dai WR, Shao FC. Effect of ALK-inhibitors in the treatment of non-small cell lung cancer: a systematic review and meta-analysis. Eur Rev Med Pharmacol Sci. 2017;21(15):3496–3503.
12. Liu Y, Wu S, Shi X, Liang Z, Zeng X. ALK detection in lung cancer: identification of atypical and cryptic ALK rearrangements using an optimal algorithm. J Cancer Res Clin Oncol. 2020;146(5):1307–1320. doi:10.1007/s00432-020-03166-1
13. Gillies RJ, Kinahan PE, Hricak H. Radiomics: images are more than pictures, they are data. Radiology. 2016;278(2):563–577. doi:10.1148/radiol.2015151169
14. Yang L, Yang J, Zhou X, et al. Development of a radiomics nomogram based on the 2D and 3D CT features to predict the survival of non-small cell lung cancer patients. Eur Radiol. 2019;29(5):2196–2206. doi:10.1007/s00330-018-5770-y
15. Li H, Galperin-Aizenberg M, Pryma D, Simone CB, Fan Y. Unsupervised machine learning of radiomic features for predicting treatment response and overall survival of early stage non-small cell lung cancer patients treated with stereotactic body radiation therapy. Radiat Oncol. 2018;129(2):218–226. doi:10.1016/j.radonc.2018.06.025
16. Dou TH, Coroller TP, van Griethuysen JJM, Mak RH, Aerts HJWL. Peritumoral radiomics features predict distant metastasis in locally advanced NSCLC. PLoS One. 2018;13(11):e0206108. doi:10.1371/journal.pone.0206108
17. Luo Y, McShan DL, Matuszak MM, et al. A multiobjective Bayesian networks approach for joint prediction of tumor local control and radiation pneumonitis in nonsmall-cell lung cancer (NSCLC) for response-adapted radiotherapy. Med Phys. 2018;45(8):3980–3995. doi:10.1002/mp.13029
18. Zhu X, Dong D, Chen Z, et al. Radiomic signature as a diagnostic factor for histologic subtype classification of non-small cell lung cancer. Eur Radiol. 2018;28(7):2772–2778. doi:10.1007/s00330-017-5221-1
19. Aerts HJ, Grossmann P, Tan Y, et al. Defining a radiomic response phenotype: a pilot study using targeted therapy in NSCLC. Sci Rep. 2016;6:33860. doi:10.1038/srep33860
20. Tu W, Sun G, Fan L, et al. Radiomics signature: A potential and incremental predictor for EGFR mutation status in NSCLC patients, comparison with CT morphology. Lung Cancer. 2019;132:28–35. doi:10.1016/j.lungcan.2019.03.025
21. Yu L, Tao G, Zhu L, et al. Prediction of pathologic stage in non-small cell lung cancer using machine learning algorithm based on CT image feature analysis. BMC Cancer. 2019;19(1):464. doi:10.1186/s12885-019-5646-9
22. Zhao W, Yang J, Ni B, et al. Toward automatic prediction of EGFR mutation status in pulmonary adenocarcinoma with 3D deep learning. Cancer Med. 2019;8(7):3532–3543. doi:10.1002/cam4.2233
23. Liu J, Cui J, Liu F, Yuan Y, Guo F, Zhang G. Multi-subtype classification model for non-small cell lung cancer based on radiomics: SLS model. Med Phys. 2019;46(7):3091–3100. doi:10.1002/mp.13551
24. Kim TJ, Lee CT, Jheon SH, Park JS, Chung JH. Radiologic characteristics of surgically resected non-small cell lung cancer With ALK rearrangement or EGFR mutations. Ann Thorac Surg. 2016;101(2):473–480. doi:10.1016/j.athoracsur.2015.07.062
25. Wu S, Zheng J, Li Y, et al. A radiomics nomogram for the preoperative prediction of lymph node metastasis in bladder cancer. Clin Cancer Res. 2017;23(22):6904–6911. doi:10.1158/1078-0432.CCR-17-1510
26. Liu Z, Li Z, Qu J, et al. Radiomics of multiparametric MRI for pretreatment prediction of pathologic complete response to neoadjuvant chemotherapy in breast cancer: a multicenter study. Clin Cancer Res. 2019;25(12):3538–3547. doi:10.1158/1078-0432.CCR-18-3190
27. Malik SM, Maher VE, Bijwaard KE, et al. U.S. Food and Drug Administration approval: crizotinib for treatment of advanced or metastatic non-small cell lung cancer that is anaplastic lymphoma kinase positive. Clin Cancer Res. 2014;20(8):2029–2034. doi:10.1158/1078-0432.CCR-13-3077
28. Kazandjian D, Blumenthal GM, Yuan W, He K, Keegan P, Pazdur R. FDA approval of gefitinib for the treatment of patients with metastatic EGFR mutation-positive non-small cell lung cancer. Clin Cancer Res. 2016;22(6):1307–1312. doi:10.1158/1078-0432.CCR-15-2266
29. Ettinger DS, Wood DE, Aggarwal C, et al. NCCN guidelines insights: non-small cell lung cancer, version 1.2020. J Natl Compr Canc Netw. 2019;17(12):1464–1472. doi:10.6004/jnccn.2019.0059
30. Zhou JY, Zheng J, Yu ZF, et al. Comparative analysis of clinicoradiologic characteristics of lung adenocarcinomas with ALK rearrangements or EGFR mutations. Eur Radiol. 2015;25(5):1257–1266. doi:10.1007/s00330-014-3516-z
31. Fukui T, Yatabe Y, Kobayashi Y, et al. Clinicoradiologic characteristics of patients with lung adenocarcinoma harboring EML4-ALK fusion oncogene. Lung Cancer. 2012;77(2):319–325. doi:10.1016/j.lungcan.2012.03.013
32. Lee SM, Park CM, Lee KH, Bahn YE, Kim JI, Goo JM. C-arm cone-beam CT-guided percutaneous transthoracic needle biopsy of lung nodules: clinical experience in 1108 patients. Radiology. 2014;271(1):291–300. doi:10.1148/radiol.13131265
33. Saito S, Espinoza-Mercado F, Liu H, Sata N, Cui X, Soukiasian HJ. Current status of research and treatment for non-small cell lung cancer in never-smoking females. Cancer Biol Ther. 2017;18(6):359–368. doi:10.1080/15384047.2017.1323580
34. Rodig SJ, Mino-Kenudson M, Dacic S, et al. Unique clinicopathologic features characterize ALK-rearranged lung adenocarcinoma in the western population. Clin Cancer Res. 2009;15(16):5216–5223. doi:10.1158/1078-0432.CCR-09-0802
35. Zito Marino F, Rossi G, Brunelli M, et al. Diagnosis of anaplastic lymphoma kinase rearrangement in cytological samples through a fluorescence in situ hybridization-based assay: cytological smears versus cell blocks. Cancer Cytopathol. 2017;125(5):303–312. doi:10.1002/cncy.21835
36. Lindeman NI, Cagle PT, Aisner DL, et al. Updated Molecular Testing Guideline for the Selection of Lung Cancer Patients for Treatment With Targeted Tyrosine Kinase Inhibitors: guideline From the College of American Pathologists, the International Association for the Study of Lung Cancer, and the Association for Molecular Pathology. J Mol Diagn. 2018;20(2):129–159. doi:10.1016/j.jmoldx.2017.11.004
37. Ruan M, Liu L, Wang L, et al. Correlation between combining F-FDG PET/CT metabolic parameters and other clinical features and ALK or ROS1 fusion in patients with non-small-cell lung cancer. Eur J Nucl Med Mol Imaging. 2020;47(5):1183–1197. doi:10.1007/s00259-019-04652-6
38. Rizzo S, Petrella F, Buscarino V, et al. CT radiogenomic characterization of EGFR, K-RAS, and ALK mutations in non-small cell lung cancer. Eur Radiol. 2016;26(1):32–42. doi:10.1007/s00330-015-3814-0
39. Li M, Zhang L, Tang W, et al. EGFRQuantitative features of dual-energy spectral computed tomography for solid lung adenocarcinoma with and mutations, and rearrangement: a preliminary study. Transl Lung Cancer Res. 2019;8(4):401–412. doi:10.21037/tlcr.2019.08.13
40. He L, Huang Y, Ma Z, Liang C, Liang C, Liu Z. Effects of contrast-enhancement, reconstruction slice thickness and convolution kernel on the diagnostic performance of radiomics signature in solitary pulmonary nodule. Sci Rep. 2016;6:34921. doi:10.1038/srep34921
41. Kakino R, Nakamura M, Mitsuyoshi T, et al. Comparison of radiomic features in diagnostic CT images with and without contrast enhancement in the delayed phase for NSCLC patients. Phys Med. 2020;69:176–182. doi:10.1016/j.ejmp.2019.12.019
42. Ger RB, Zhou S, Chi PM, et al. Comprehensive investigation on controlling for CT imaging variabilities in radiomics studies. Sci Rep. 2018;8(1):13047. doi:10.1038/s41598-018-31509-z
43. Park S, Lee SM, Do KH, et al. Deep learning algorithm for reducing CT slice thickness: effect on reproducibility of radiomic features in lung cancer. Korean J Radiol. 2019;20(10):1431–1440. doi:10.3348/kjr.2019.0212
44. Li Y, Lu L, Xiao M, et al. CT slice thickness and convolution kernel affect performance of a radiomic model for predicting EGFR status in non-small cell lung cancer: a preliminary study. Sci Rep. 2018;8(1):17913. doi:10.1038/s41598-018-36421-0
 © 2020 The Author(s). This work is published and licensed by Dove Medical Press Limited. The full terms of this license are available at https://www.dovepress.com/terms.php and incorporate the Creative Commons Attribution - Non Commercial (unported, v3.0) License.
By accessing the work you hereby accept the Terms. Non-commercial uses of the work are permitted without any further permission from Dove Medical Press Limited, provided the work is properly attributed. For permission for commercial use of this work, please see paragraphs 4.2 and 5 of our Terms.
© 2020 The Author(s). This work is published and licensed by Dove Medical Press Limited. The full terms of this license are available at https://www.dovepress.com/terms.php and incorporate the Creative Commons Attribution - Non Commercial (unported, v3.0) License.
By accessing the work you hereby accept the Terms. Non-commercial uses of the work are permitted without any further permission from Dove Medical Press Limited, provided the work is properly attributed. For permission for commercial use of this work, please see paragraphs 4.2 and 5 of our Terms.