")
Back to Journals » International Journal of Nephrology and Renovascular Disease » Volume 12
Ethnic prevalence of anemia and predictors of anemia among chronic kidney disease patients at a tertiary hospital in Johannesburg, South Africa
Authors Nalado AM , Mahlangu JN , Waziri B , Duarte R , Paget G, Olorunfemi G , Naicker S
Received 15 July 2018
Accepted for publication 13 October 2018
Published 18 February 2019 Volume 2019:12 Pages 19—32
DOI https://doi.org/10.2147/IJNRD.S179802
Checked for plagiarism Yes
Review by Single anonymous peer review
Peer reviewer comments 3
Editor who approved publication: Professor Pravin Singhal
Aishatu Mohammed Nalado,1,2 Johnny N Mahlangu,3 Bala Waziri,1 Raquel Duarte,1 Graham Paget,1 Gbenga Olorunfemi,4 Saraladevi Naicker1
1Department of Internal Medicine, School of Clinical Medicine, Faculty of Health Science, University of the Witwatersrand, Johannesburg, South Africa; 2Department of Internal Medicine, College of Health Sciences, Bayero University, Kano, Nigeria; 3School of Pathology, Faculty of Health Sciences, University of the Witwatersrand, Johannesburg, South Africa; 4Division of Epidemiology and Biostatistics, School of Public Health, University of the Witwatersrand, Johannesburg, South Africa
Introduction: Anemia is a complication of chronic kidney disease (CKD) that can greatly impact on its prognosis. However, the risk factors for anemia, including the influence of ethnicity, are not well established among the CKD population in Johannesburg.
Methods: This was a cross-sectional study of 353 adult CKD patients attending the renal outpatient clinic of the Charlotte Maxeke Johannesburg Academic Hospital (Johannesburg, South Africa) from June 1, 2016 to December 30, 2016. Sociodemographic and clinical characteristics were obtained using a proforma. Blood samples were collected for serum electrolytes and hematological parameters. Predictors of low hemoglobin and iron deficiency anemia (IDA) were evaluated using multivariable binary logistic regression.
Results: The mean age and prevalence of anemia among the CKD participants were 55.3±15.0 years and 43.18% (95% CI: 38.1%–48.4%), respectively. Blacks had the highest prevalence of anemia (46.9%), while Indians/Asians had the lowest (18.2%). Although the odds of anemia was 3.8-fold higher (odds ratio =3.8, P-value =0.059) among CKD stage V participants as compared to CKD stage I, the relationship between anemia and stages of CKD was non-linear. Diabetes mellitus (odds ratio =2.31, P-value =0.005) had a strong association with anemia among the CKD participants.
Conclusion: Almost half of the CKD participants were anemic, and the odds of anemia did not increase linearly with increasing severity of CKD. There was a marked ethnic disparity in anemia prevalence. Our study highlights the need for risk-based management of anemia among CKD patients.
Keywords: chronic kidney disease, hemoglobin, risk factors, iron deficiency anemia, ethnicity, Johannesburg, South Africa, kidney stage
Introduction
Anemia is a major cause of morbidity and mortality among chronic kidney disease (CKD) patients.1 It is defined as a low level of hemoglobin (Hb), <12 g/dL in females and <13 g/dL in males among CKD patients.2 About 75% of CKD patients were reported3 to be anemic in low- and middle-income countries (LMICs), as compared to a lower anemia prevalence of 22.2% among CKD patients in high-income countries.3 Anemia occurs early in the course of kidney disease and may worsen and become intractable with declining kidney function.1–4
Although the development of anemia in CKD patients is mainly due to an absolute or relative deficiency of erythropoietin, other possible causes of anemia include blood loss, decreased half-life of red blood cells, iron deficiency, inflammation, nutritional deficiency (due to an inadequate diet and defective iron absorption), and accumulation of uremic toxins that inhibit erythropoiesis.4,5 Iron deficiency anemia (IDA) is also a major cause of anemia in CKD. Several causes of IDA in CKD patients include blood loss (from frequent laboratory testing, occult gastrointestinal bleeding, access bleeding), decreased duodenal iron absorption (resulting from inflammation), interference with iron absorption (resulting from medications such as gastric acid inhibitors, phosphate binders).6
Some of the adverse clinical outcomes of anemia in CKD patients include sleep disturbance, exercise intolerance, and increased mortality.7 Hence, some studies have shown that early identification and prompt treatment of anemia through near normalization of hemoglobin and iron levels in CKD patients is associated with slower progression to end-stage kidney disease, and reduced cardiovascular morbidity and mortality as reported in the Cardiovascular Risk Reduction by Early Treatment with Epoietin Beta (CREATE) trial.8,9
Anemia in CKD patients is the product of a complex interplay between patient-specific attributes, CKD stage, treatment modalities, socioeconomic and environmental factors. Therefore, it is being advocated that individualized risk-based management of anemia in CKD patients should be promoted because of the multiple factors responsible for the evolution of anemia in them.10
Oral iron is usually preferred because of its convenience and low cost. However, its utility is often limited by gastrointestinal side effects, poor absorption, and low efficacy in CKD.11,12
South Africa is a multiethnic country with about 80% of the population being black and most of them likely to be of low socioeconomic status (SES). Annual household income for blacks stood at an average of 92,893 rands (about 7,000 US dollars) compared with 444,446 rands (29,000 US dollars) for whites, according to the Statistics South Africa’s Living Condition Survey. Furthermore, the median monthly earnings of white (R9,500), Indian/Asian (R6,000), mixed race (R2,652), and black (R2,167) South Africans showed a marked ethnic disparity in SES.13–16 Hence, socioeconomic circumstances among CKD patients may impact on the prevalence and outcomes of anemia in them.17,18 However, little is currently known of the interactions of various predictors of anemia among the different ethnic groups of CKD patients who are yet to commence dialysis in South Africa. Therefore, we aimed to assess the overall and ethnic prevalence of IDA, CKD stage-specific prevalence and possible predictors of anemia among the predialysis CKD patients in Johannesburg.17,18
Patients and methods
This cross-sectional study was conducted on 353 pre-dialysis CKD patients from June 1 to December 31, 2016. The study population comprised patients attending the renal outpatient clinic of Charlotte Maxeke Academic Hospital, Johannesburg. All consecutively consenting pre-dialysis CKD participants (>18 years of age) were recruited into the study. Patients with active bleeding (such as upper gastrointestinal bleeding), infection, inflammation, blood transfusion within 3 months of enrolment, on oral iron therapy (within 2 weeks of enrolment), treatment with erythropoietin stimulating agents (ESAs) within 4 weeks of enrolment, active malignancy, human immunodeficiency virus infection, use of immunosuppressive drugs, and patients with known hemoglobinopathies were excluded from the study.
Sociodemographic characteristics were obtained using a proforma. Employment status and educational level were used as proxy for SES in this study.19 In addition, weight, height, and blood pressure were measured using a stadiometer and mercury sphygmomanometer, respectively. Hypertension was defined as two or more blood pressure readings >140/90 mmHg as defined by JNC 7.20 Blood samples were collected for serum electrolytes and hematological parameters. Biochemical iron status, serum iron, total iron-binding capacity (TIBC), and serum ferritin were measured. Serum iron was determined by ferrozine calometric method, TIBC by colorimetric chromazurol dye binding method using ADVIA 1800 (Siemen Medical Solutions Diagnostic, Tarrytown, NY, USA), and serum ferritin was determined by using two-site chemiluminescent immunometric assay by IMMULITE®2000 system (Siemens Medical Solutions Diagnostics). Transferrin saturation was calculated by the formula: serum iron/TIBC ×100. Complete blood counts were obtained after processing the blood samples using Siemens ADVIA 2120, Technion H3 RTX, and RTC system analyzer (Siemens Medical Solutions Diagnostics).
Participants were classified as anemic based on a hemoglobin level of <13 g/dL in men and <12 g/dL in women. Mild anemia was defined as Hb >11 g/dL, moderate as Hb of 9–11 g/dL, and severe anemia as Hb of <9 g/dL.21 We defined iron deficiency as serum ferritin <100 µg/L or ferritin 100–300 µg/L and transferrin saturation (TSAT) <20%.17 Glomerular filtration rate (GFR) was determined by the Chronic Kidney Disease Epidemiology Collaboration equation for eGFR;22 stage I, eGFR >90 mL/min; stage II, eGFR 60–89 mL/min; stage III, eGFR 30–59 mL/min; stage IV, eGFR 15–29 mL/min; and stage V, eGFR <15 mL/min.
Ethical approval for the study was obtained from the Human Research Ethics Committee of the University of the Witwatersrand (ethics certificate number: M150929). All the participants provided written informed consent.
Statistical analysis
Normally distributed continuous variables were presented as mean ± SD, while non-normally distributed continuous variables were presented as median (interquartile range). Categorical variables were presented as numbers, percentages, and charts. The prevalence of anemia (with 95% CI) among the CKD participants and by sociodemographic factors was estimated. All these were stratified by the four ethnic groups (blacks, whites, mixed race group, and Indians/Asians).
Sociodemographic and clinical parameters were compared between anemic and non-anemic patients using Pearson’s chi-square and Student’s t-test as appropriate.
The relationship between anemia status and the stages of CKD was determined using Pearson’s chi-squared test (Fisher’s exact test was used when the expected cells were less than 5). Furthermore, the difference in mean levels of hematological parameters by stage of CKD was compared using ANOVA. Post hoc Bonferroni pairwise test was conducted to determine where the statistically significant difference lies. This analysis was conducted for each ethnic group. Univariable logistic regression was conducted for all the explanatory variables with anemia status as the outcome of interest. Variables with P-value <0.2 were added in the backward elimination method to arrive at the final univariable and multivariable model, respectively of the predictors of anemia. CKD stage and ethnicity were the primary explanatory variables. However, age, gender, and history of diabetes mellitus (DM) were added to the model because they were selected a priori. Crude and adjusted ORs and 95% CI were obtained from the multivariable model. Post regression diagnostics was conducted using the Hosmer–Lemeshow goodness of fit test, and the discriminatory value of the model for predicting anemia status in the CKD participants was determined based on the area under the curve of the receiver operator characteristics (ROC) curve. Two-tailed test of hypothesis was assumed. The statistically significant level was set at 95% CI (or P-value <0.05). Data were analyzed using Stata version 14 (StataCorp LP, College Station, TX, USA).
Results
Of the 379 eligible participants, 26 declined to participate in the study; 353 were therefore enrolled into the study. The mean age of the participants was 55.3±15.0 years. The majority of participants were blacks (n=258/353, 73.1%), followed by whites (n=52/353, 14.7%), Indians/Asians (n=22/353, 6.2%), and mixed race (n=21/353, 6.0%).
The overall prevalence of anemia was 43.1% (95% CI: 38.1%–48.4%; Figure 1). The Indian/Asian population had the lowest prevalence of anemia, while the blacks had the highest. Prevalence of anemia among blacks, mixed race, whites, and Indian/Asians was: 46.9% (95% CI: 40.8–53.0), 45% (95% CI: 23.8–68.2), 34.6% (95% CI: 22.7–48.9), and 18.2% (95% CI: 6.4–41.9), respectively. Furthermore, the prevalence of IDA among blacks, whites, mixed race, and Indians/Asians was 35.3% (95% CI: 29.6%–41.3%), 23.1% (95% CI: 13.3%–36.9%), 14.3% (95% CI: 4.2%–38.7%), and 9.1% (95% CI: 2.0%–3.3%), respectively.
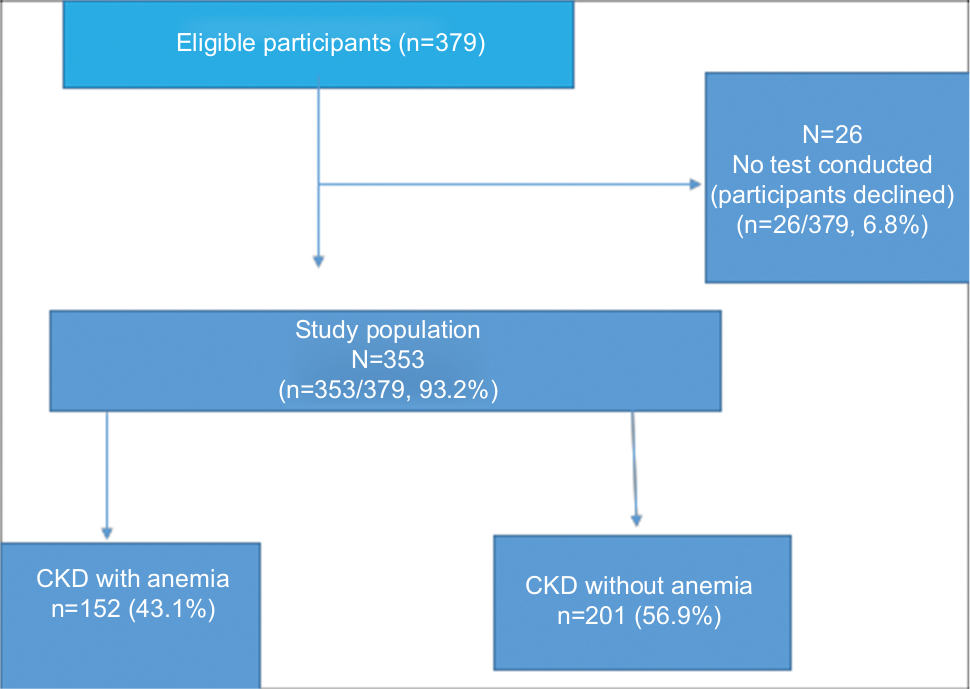 | Figure 1 Flowchart of the participants. |
The majority (79.0%) of the participants were in late stages of CKD (stages III–V) (Table 1). About 44.6% (91/204) of hypertensive participants were anemic while 40.4% (38/94) of diabetic participants were anemic (Figure 2). The mean C-reactive protein (CRP) level of the anemic participants was higher than that of non-anemic patients (33.6±4.32 vs 14.80±1.7, P-value <0.001).
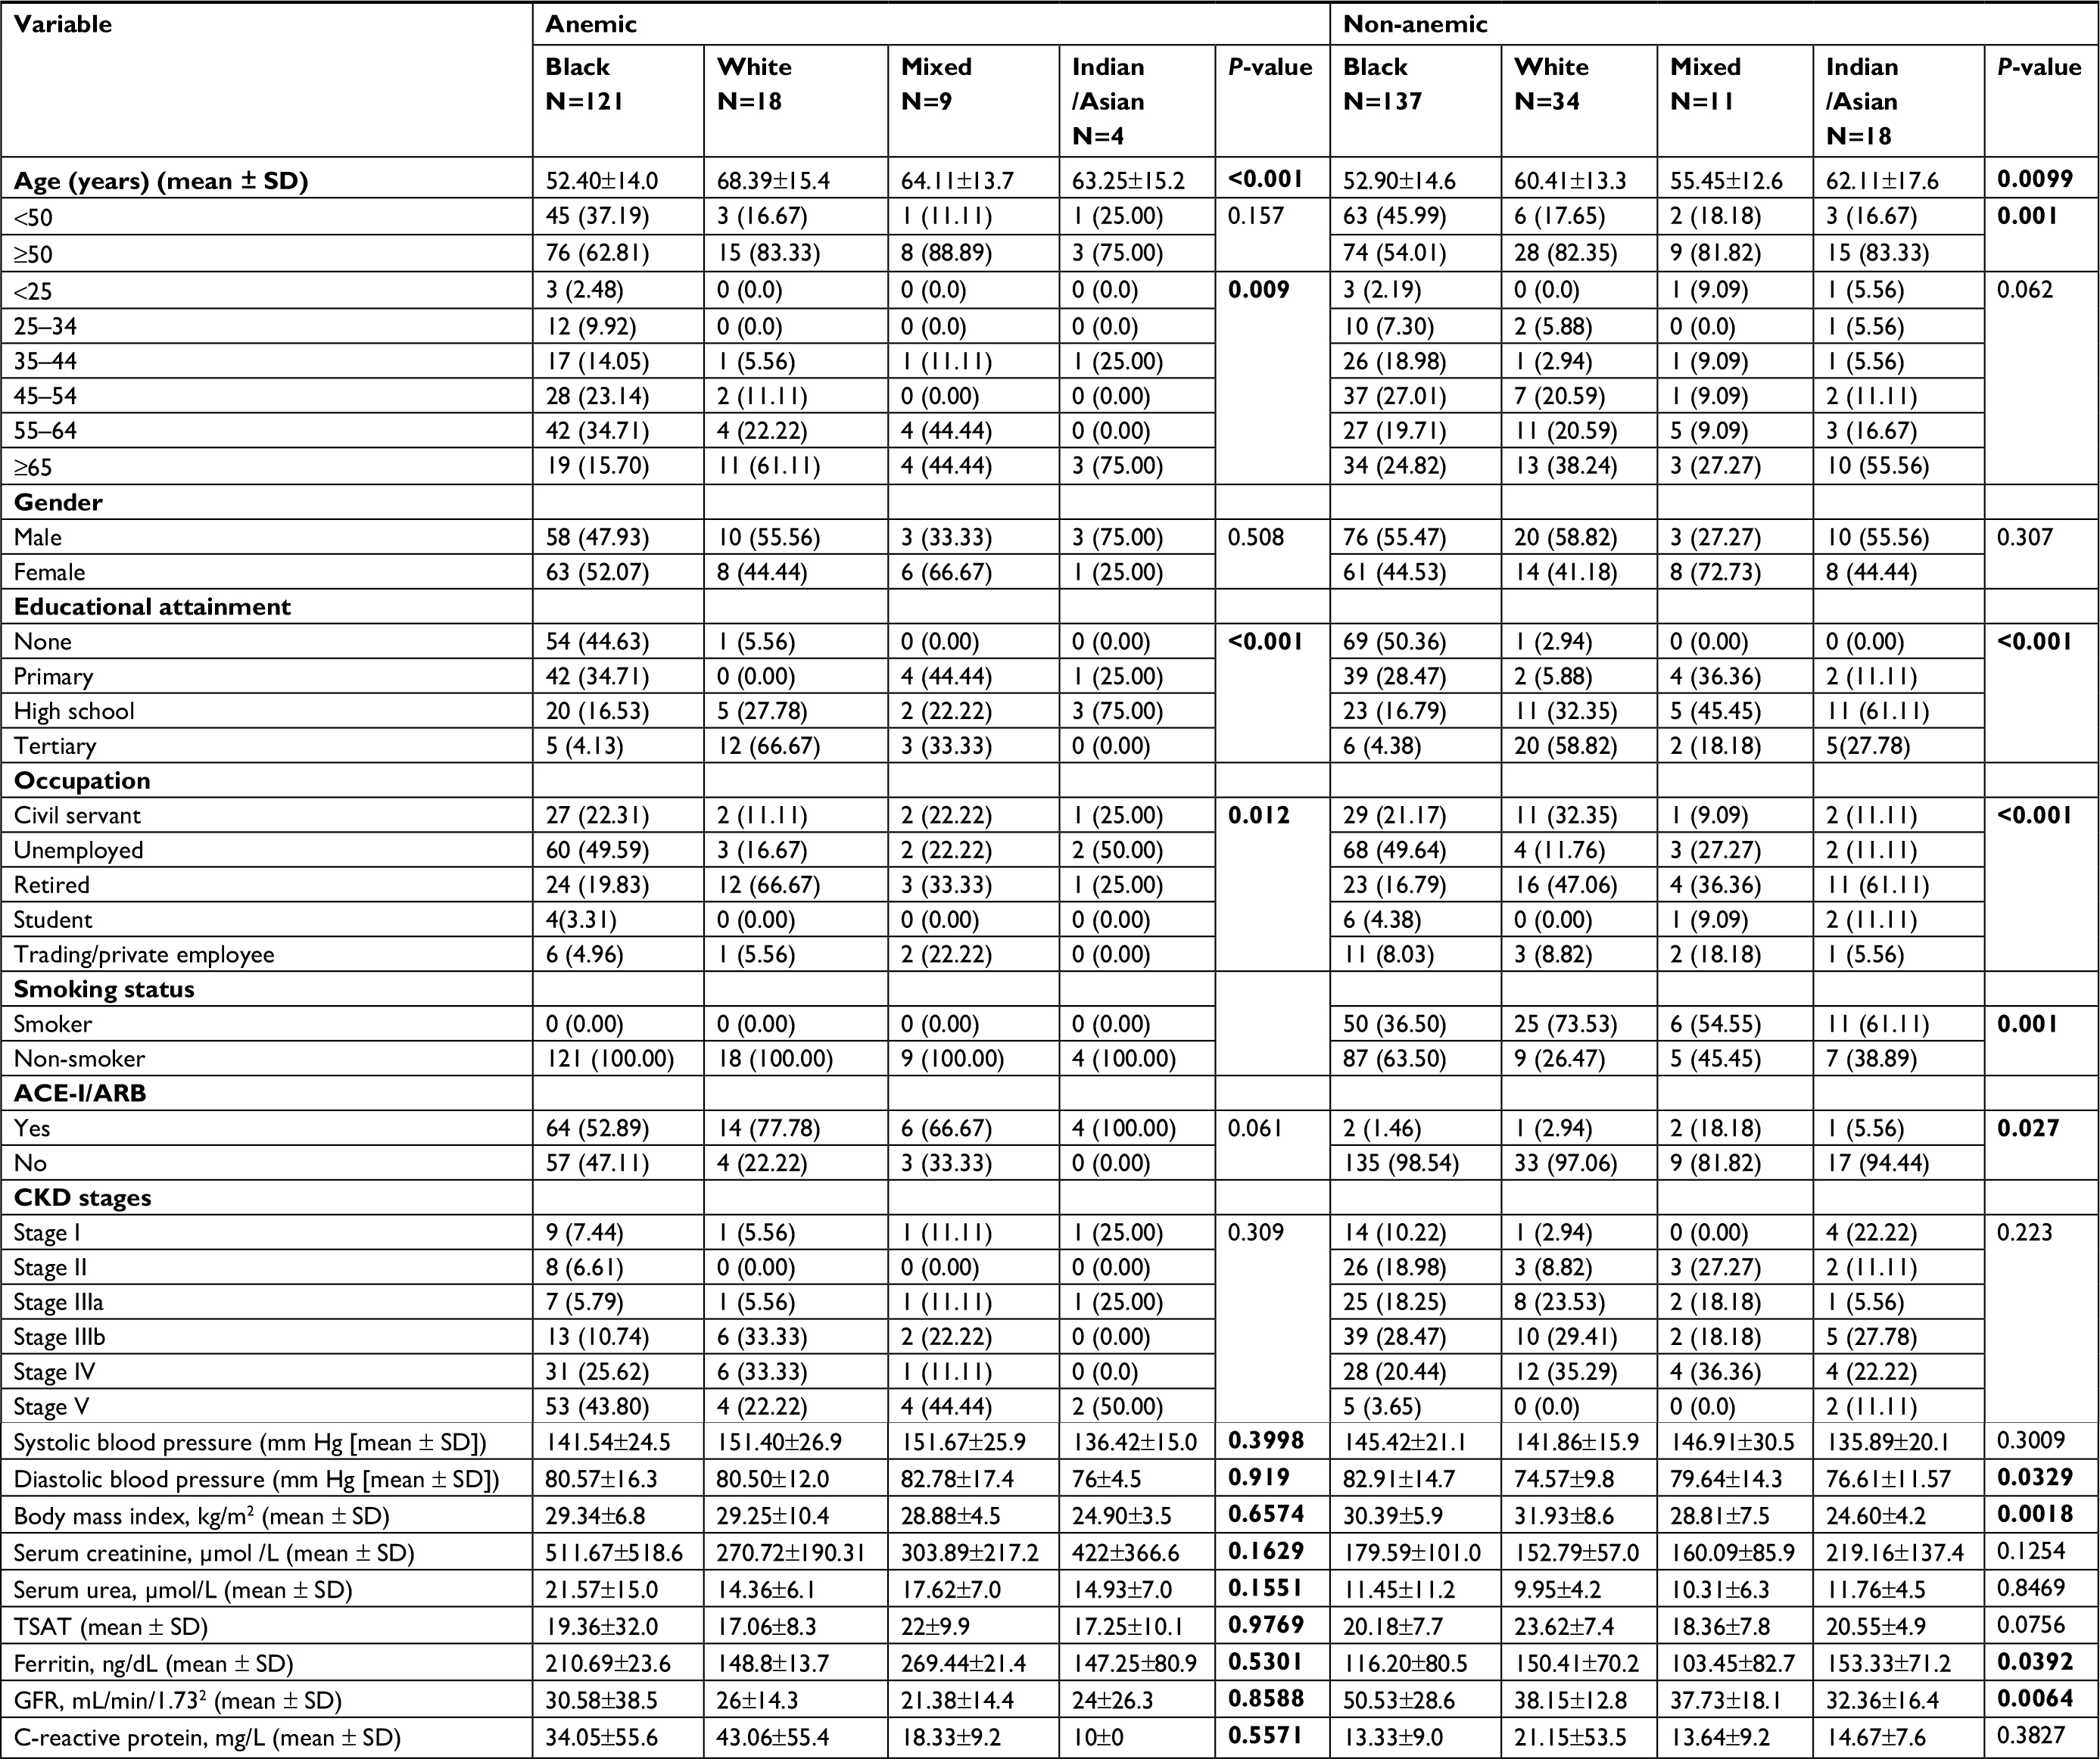 | Table 1 Sociodemographic and clinical characteristics of the study population by anemia status Notes: Data shown as n (%) unless otherwise specified. Bold P-values were statistically significant. Abbreviations: ACE-I, angiotensin-converting enzyme inhibitor use; ARB, angiotensin receptor blocker; CKD, chronic kidney disease; GFR, glomerular filtration rate; IQR, interquartile range; TSAT, transferrin saturation. |
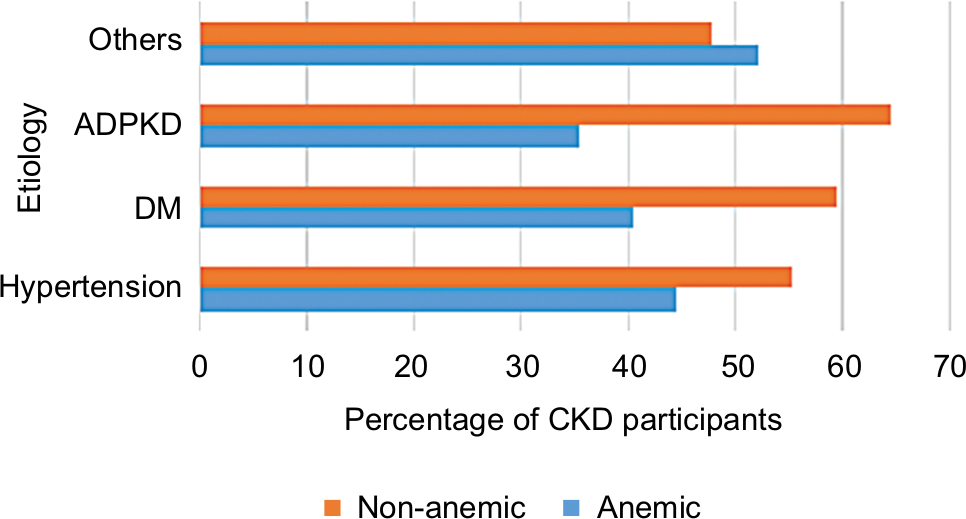 | Figure 2 The etiology of CKD by anemic status. Abbreviations: ADPKD, autosomal dominant polycystic kidney disease; CKD, chronic kidney disease; DM, diabetes mellitus. |
There were no significant ethnic differences in the clinical characteristics among the anemic participants. However, blacks had the lowest mean age at recruitment (52.40±14.0 years, P-value <0.001; Table 1). None of the 92 smokers in the cohort had anemia (Table 1).
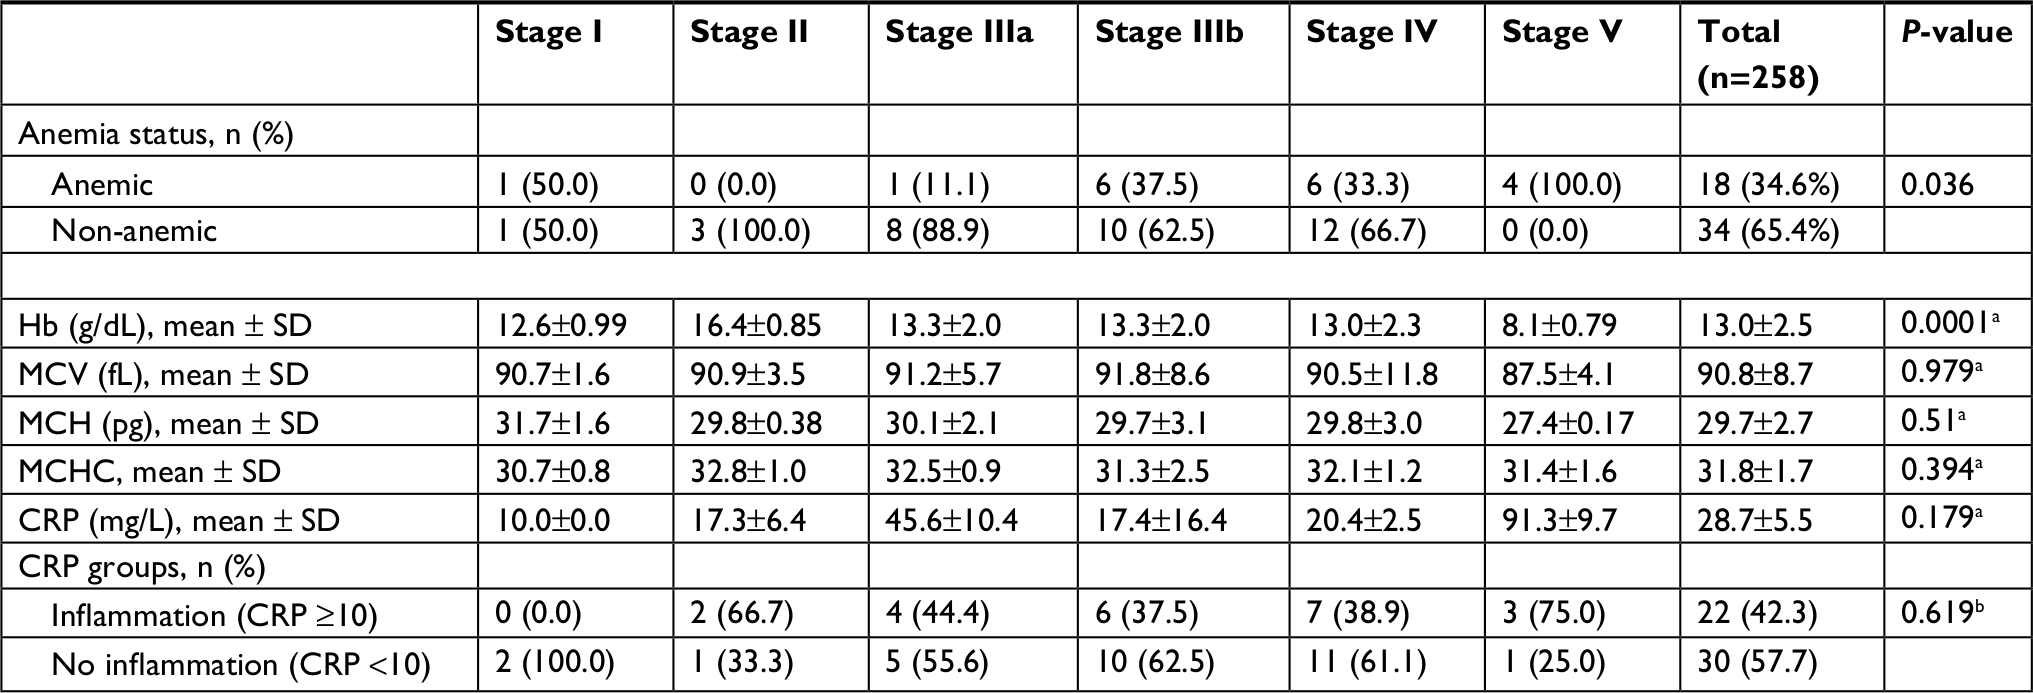
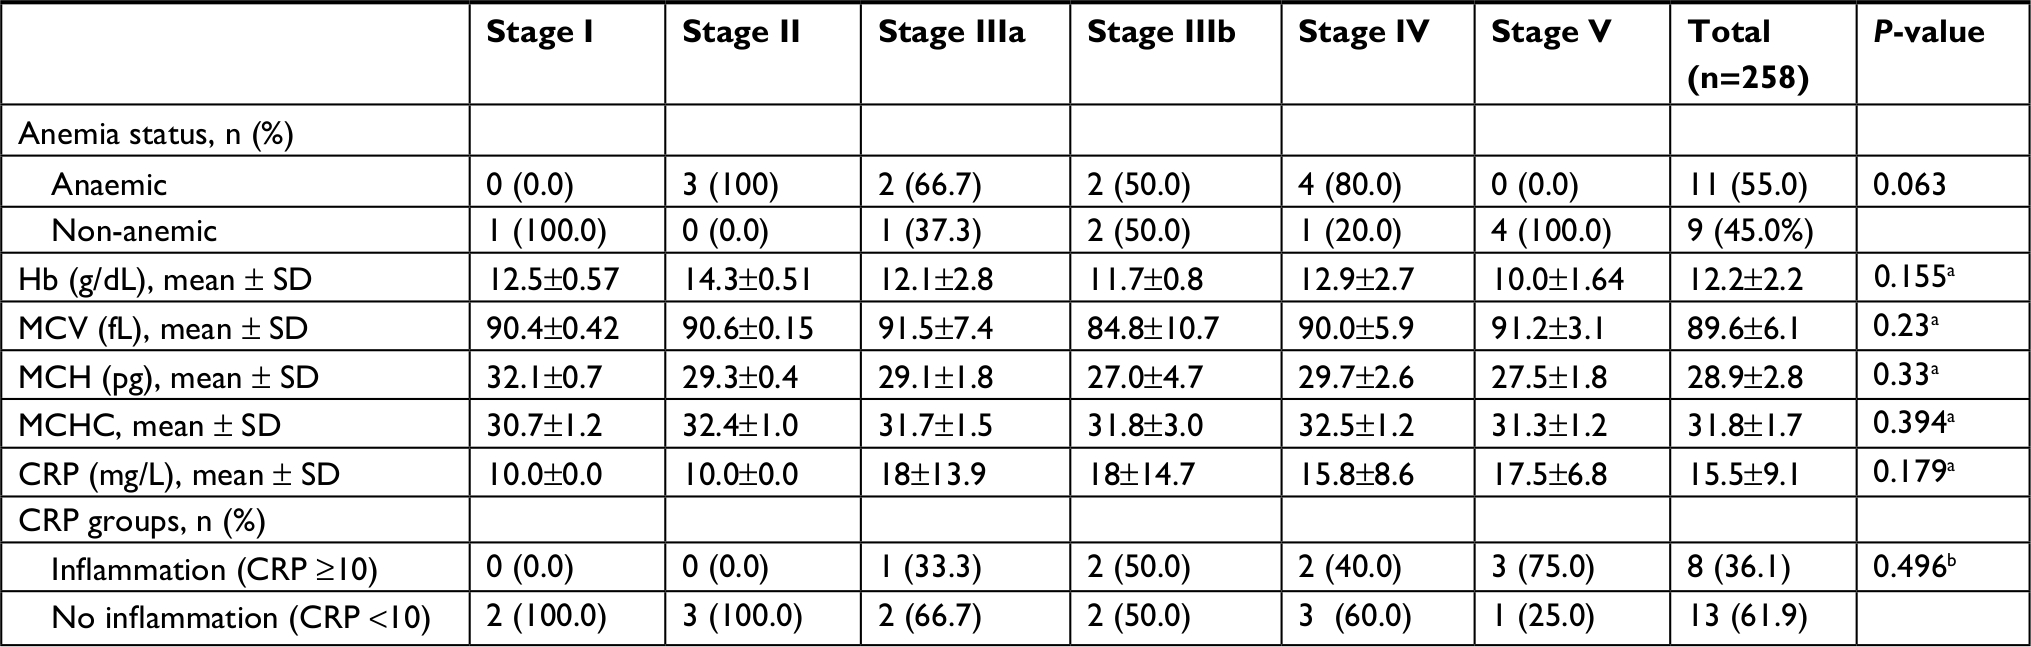
Table 2 shows that there was a statistically significant association between the stages of CKD and anemia status (P-value <0.001). The proportion of participants with anemia decreased from 39.1% in CKD stage I to 21.9% in stage IIIa, and then increased to 91.4% among stage V black participants. There was a statistically significant difference in the mean levels of Hb, mean corpuscular hemoglobin, and mean corpuscular volume (MCV) across the stages of CKD (Table 2).
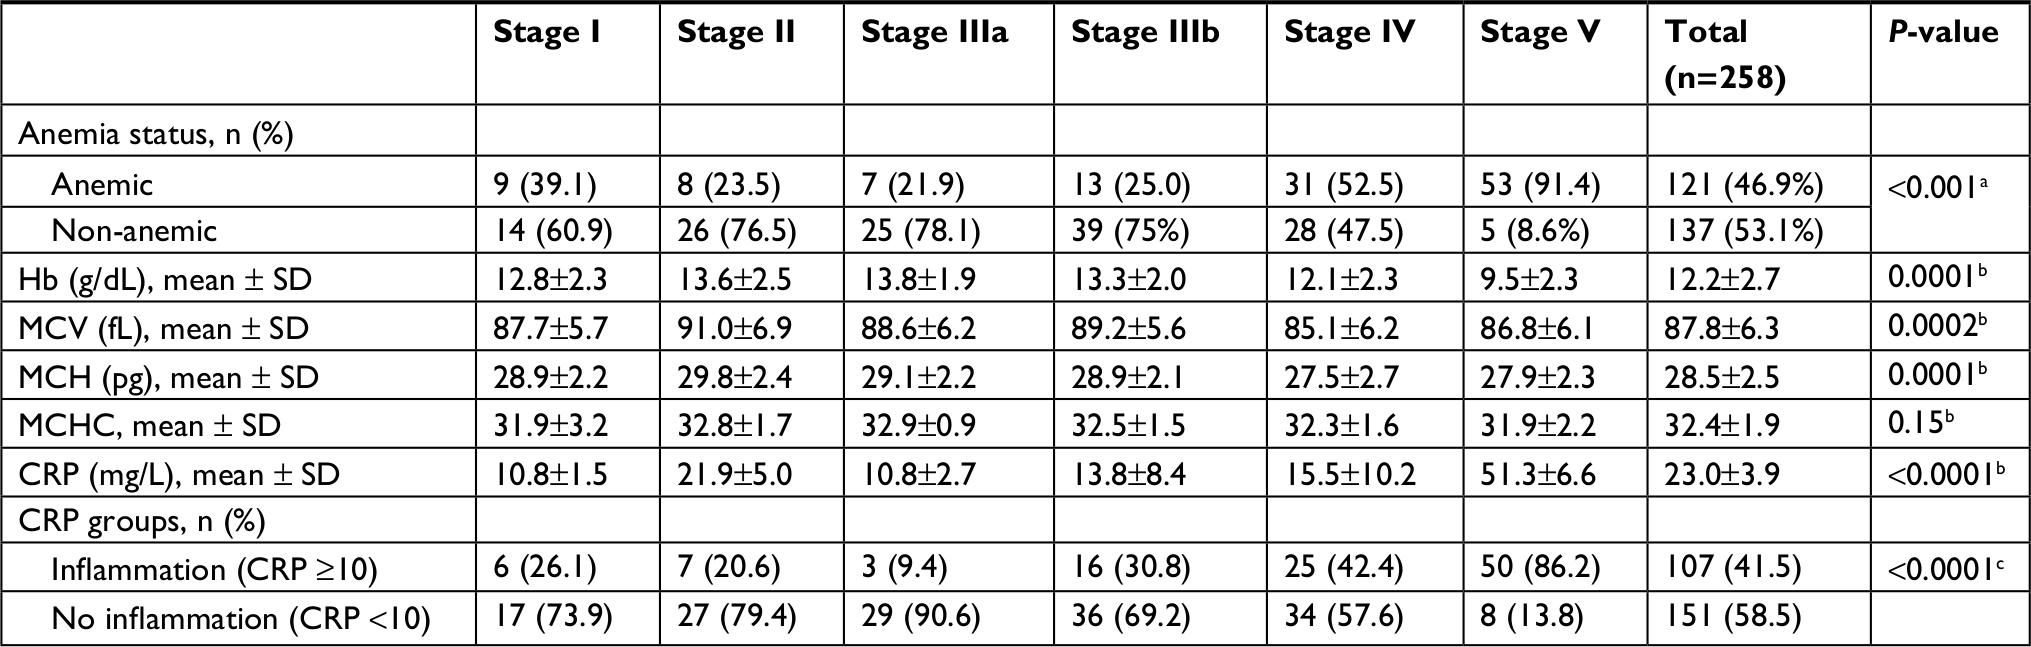 | Table 2 Distribution of anemia and its parameters among different stages of chronic kidney disease in black South Africans Notes: aPearson’s chi-squared test; bANOVA; cFisher’s exact test. Abbreviations: CRP, C-reactive protein; MCH, mean corpuscular hemoglobin; MCHC, mean corpuscular hemoglobin concentration; MCV, mean corpuscular volume. |
The mean CRP fluctuated between 10±1.5 and 21.9±5.0 mg/L between stage I and stage IIIa and increased from 13 mg/L in stage IIIb to 51.3 mg/L in stage V (P-value <0.0001). Furthermore, the prevalence of inflammation decreased from stage I (26.1%) to stage III (9.4%) and subsequently increased, reaching the highest levels in stage V (86.2%) (Table 2). The post hoc Bonferroni analysis is shown in Table 3.
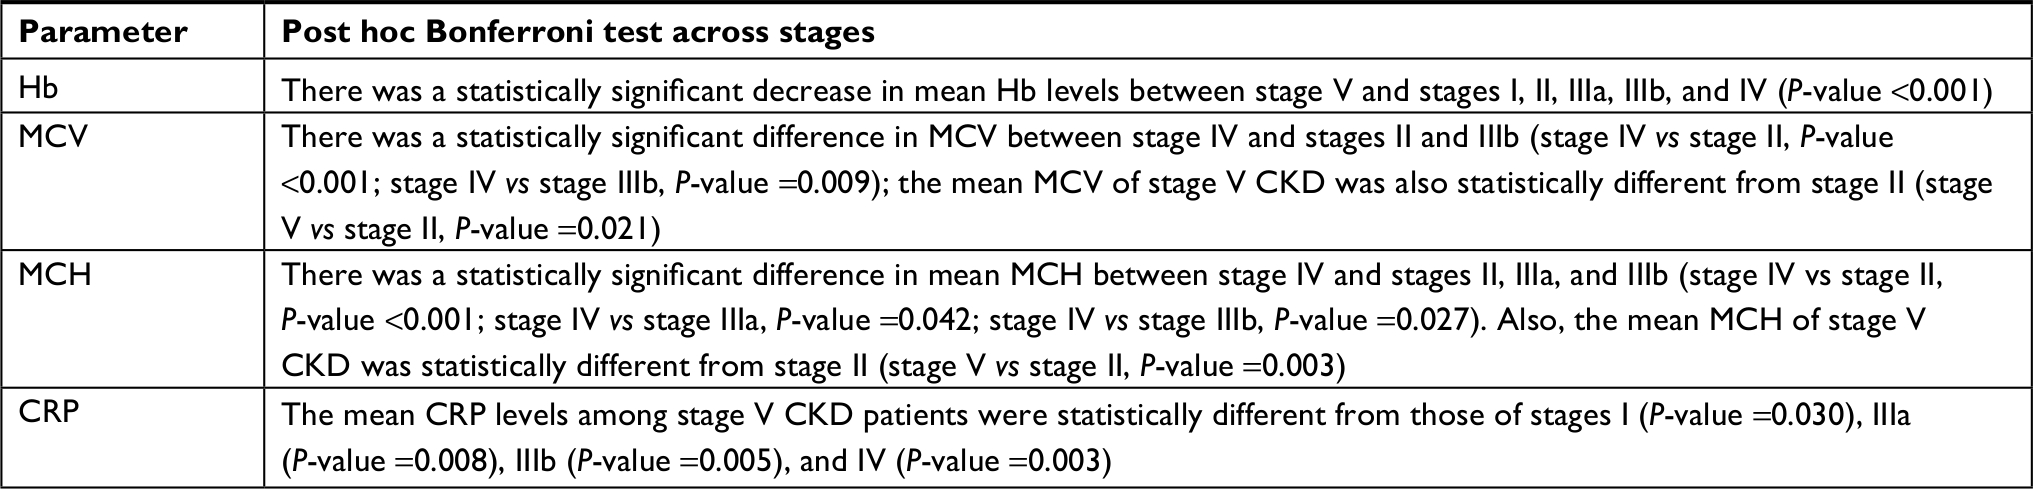 | Table 3 Post hoc Bonferroni pairwise test of distribution of anemia and its parameters among different stages of CKD in black South Africans Abbreviations: CKD, chronic kidney disease; CRP, C-reactive protein; MCH, mean corpuscular hemoglobin; MCV, mean corpuscular volume. |
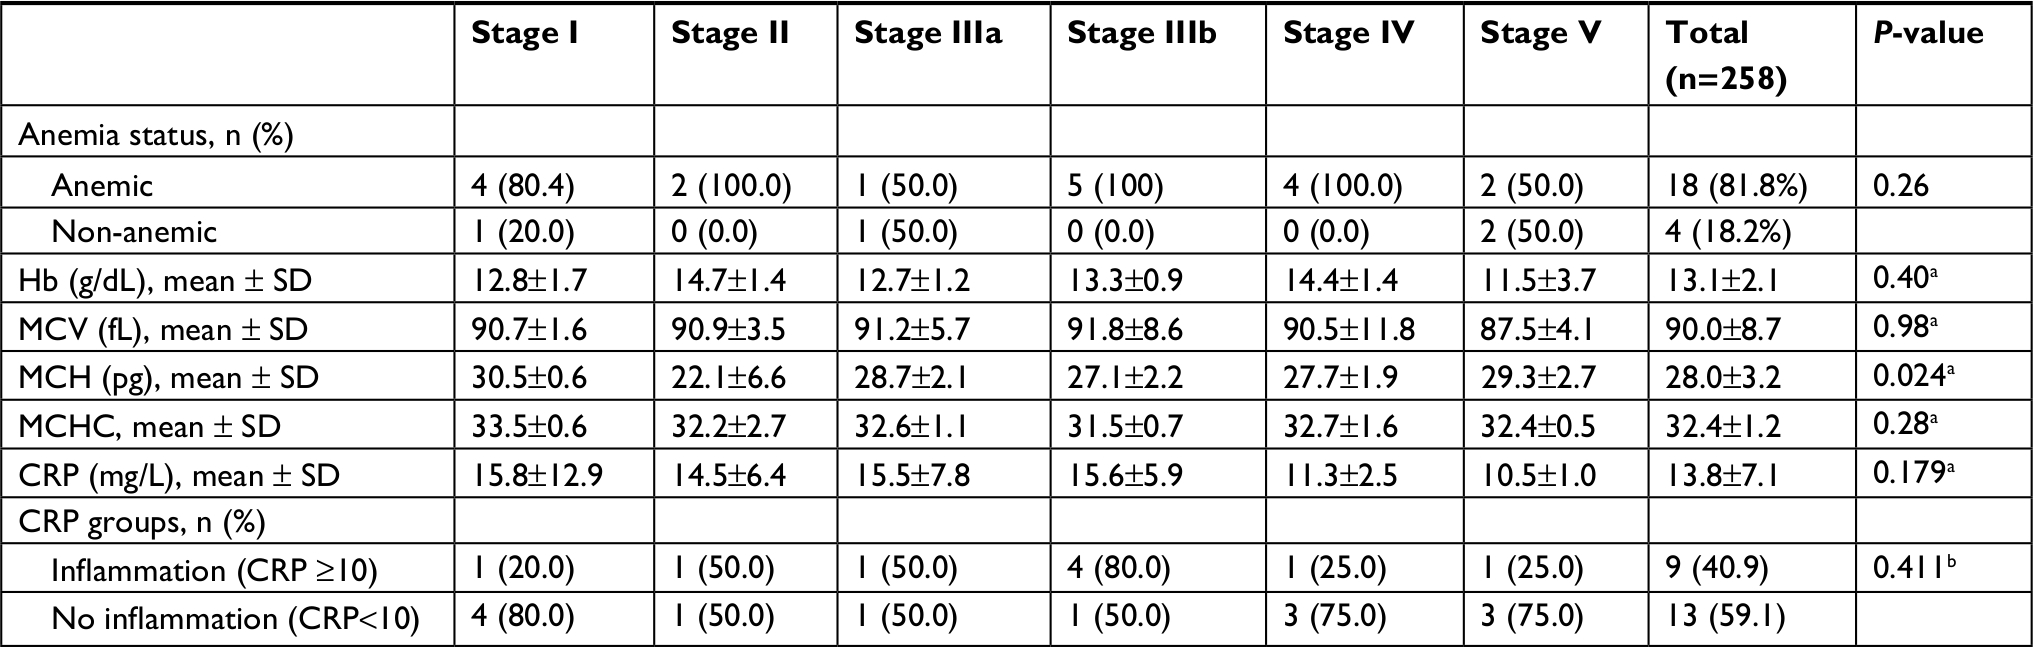
Among the white ethnic group, Hb levels were statistically different across the stages of CKD (P-value <0.0001; Table 4). However, there was no statistically significant difference in the parameters among the stages in the mixed and Indian/Asian races (Tables S1 and S2).
 | Table 4 Distribution of anemia and its parameters among different stages of chronic kidney disease in white South Africans Notes: aANOVA; bFisher’s exact test; cPearson’s chi-squared text. Abbreviations: CRP, C-reactive protein; MCH, mean corpuscular hemoglobin; MCHC, mean corpuscular hemoglobin concentration; MCV, mean corpuscular volume. |
Furthermore, there was a positive correlation between hemoglobin levels and eGFR (r=0.334, P-value <0.0001). There was also a positive correlation between Hb level and eGFR across the ethnic groups (Table S3).
Globally, there was a J-shaped relationship between CKD stage and the odds of anemia as shown in Figure 3. Thus, the odds of anemia decreased from 1.0 in stage I to 0.17 at stage III and subsequently increased abruptly from stage IV (adj odds ratio [OR]: 0.66) to stage V (adj OR: 3.83). Furthermore, there was an 83% less likely chance of anemia among stage III participants as compared to stage I participants (adj OR: 0.17, 95% CI: 0.05–0.54, P-value =0.003), while stage V participants had a 3.8-fold increased odds of anemia as compared to stage I participants after correcting for confounding variables (Table 5). In addition, CKD participants with DM had a twofold increased odds of developing anemia as compared to those without DM. However, history of hypertension did not impact on the odds of anemia among the participants. There was no statistically significant difference in the odds of anemia by gender (P-value =0.388). There was a 96% lesser odds of anemia among the Indian/Asian as compared to the blacks (Table 5).
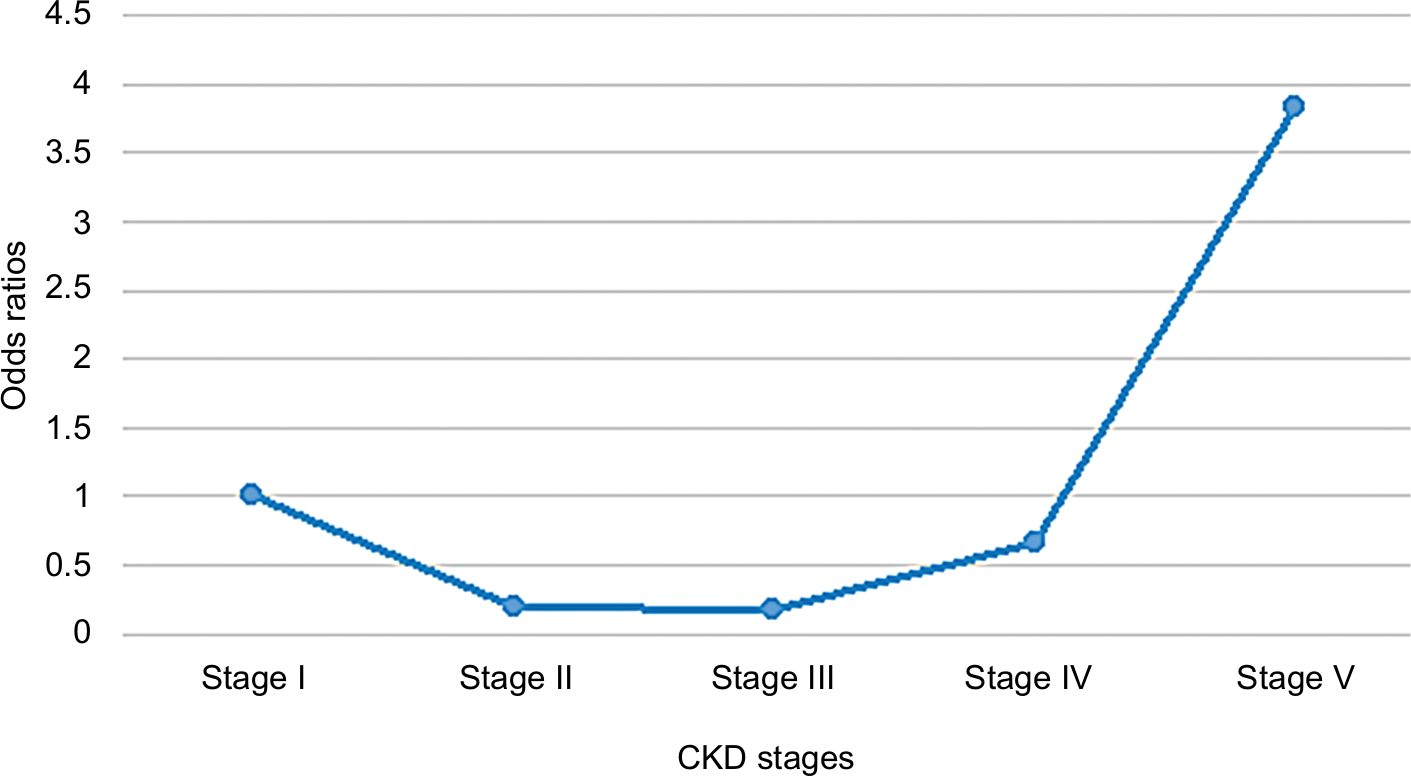 | Figure 3 Odds ratios of anemia by CKD stage. |
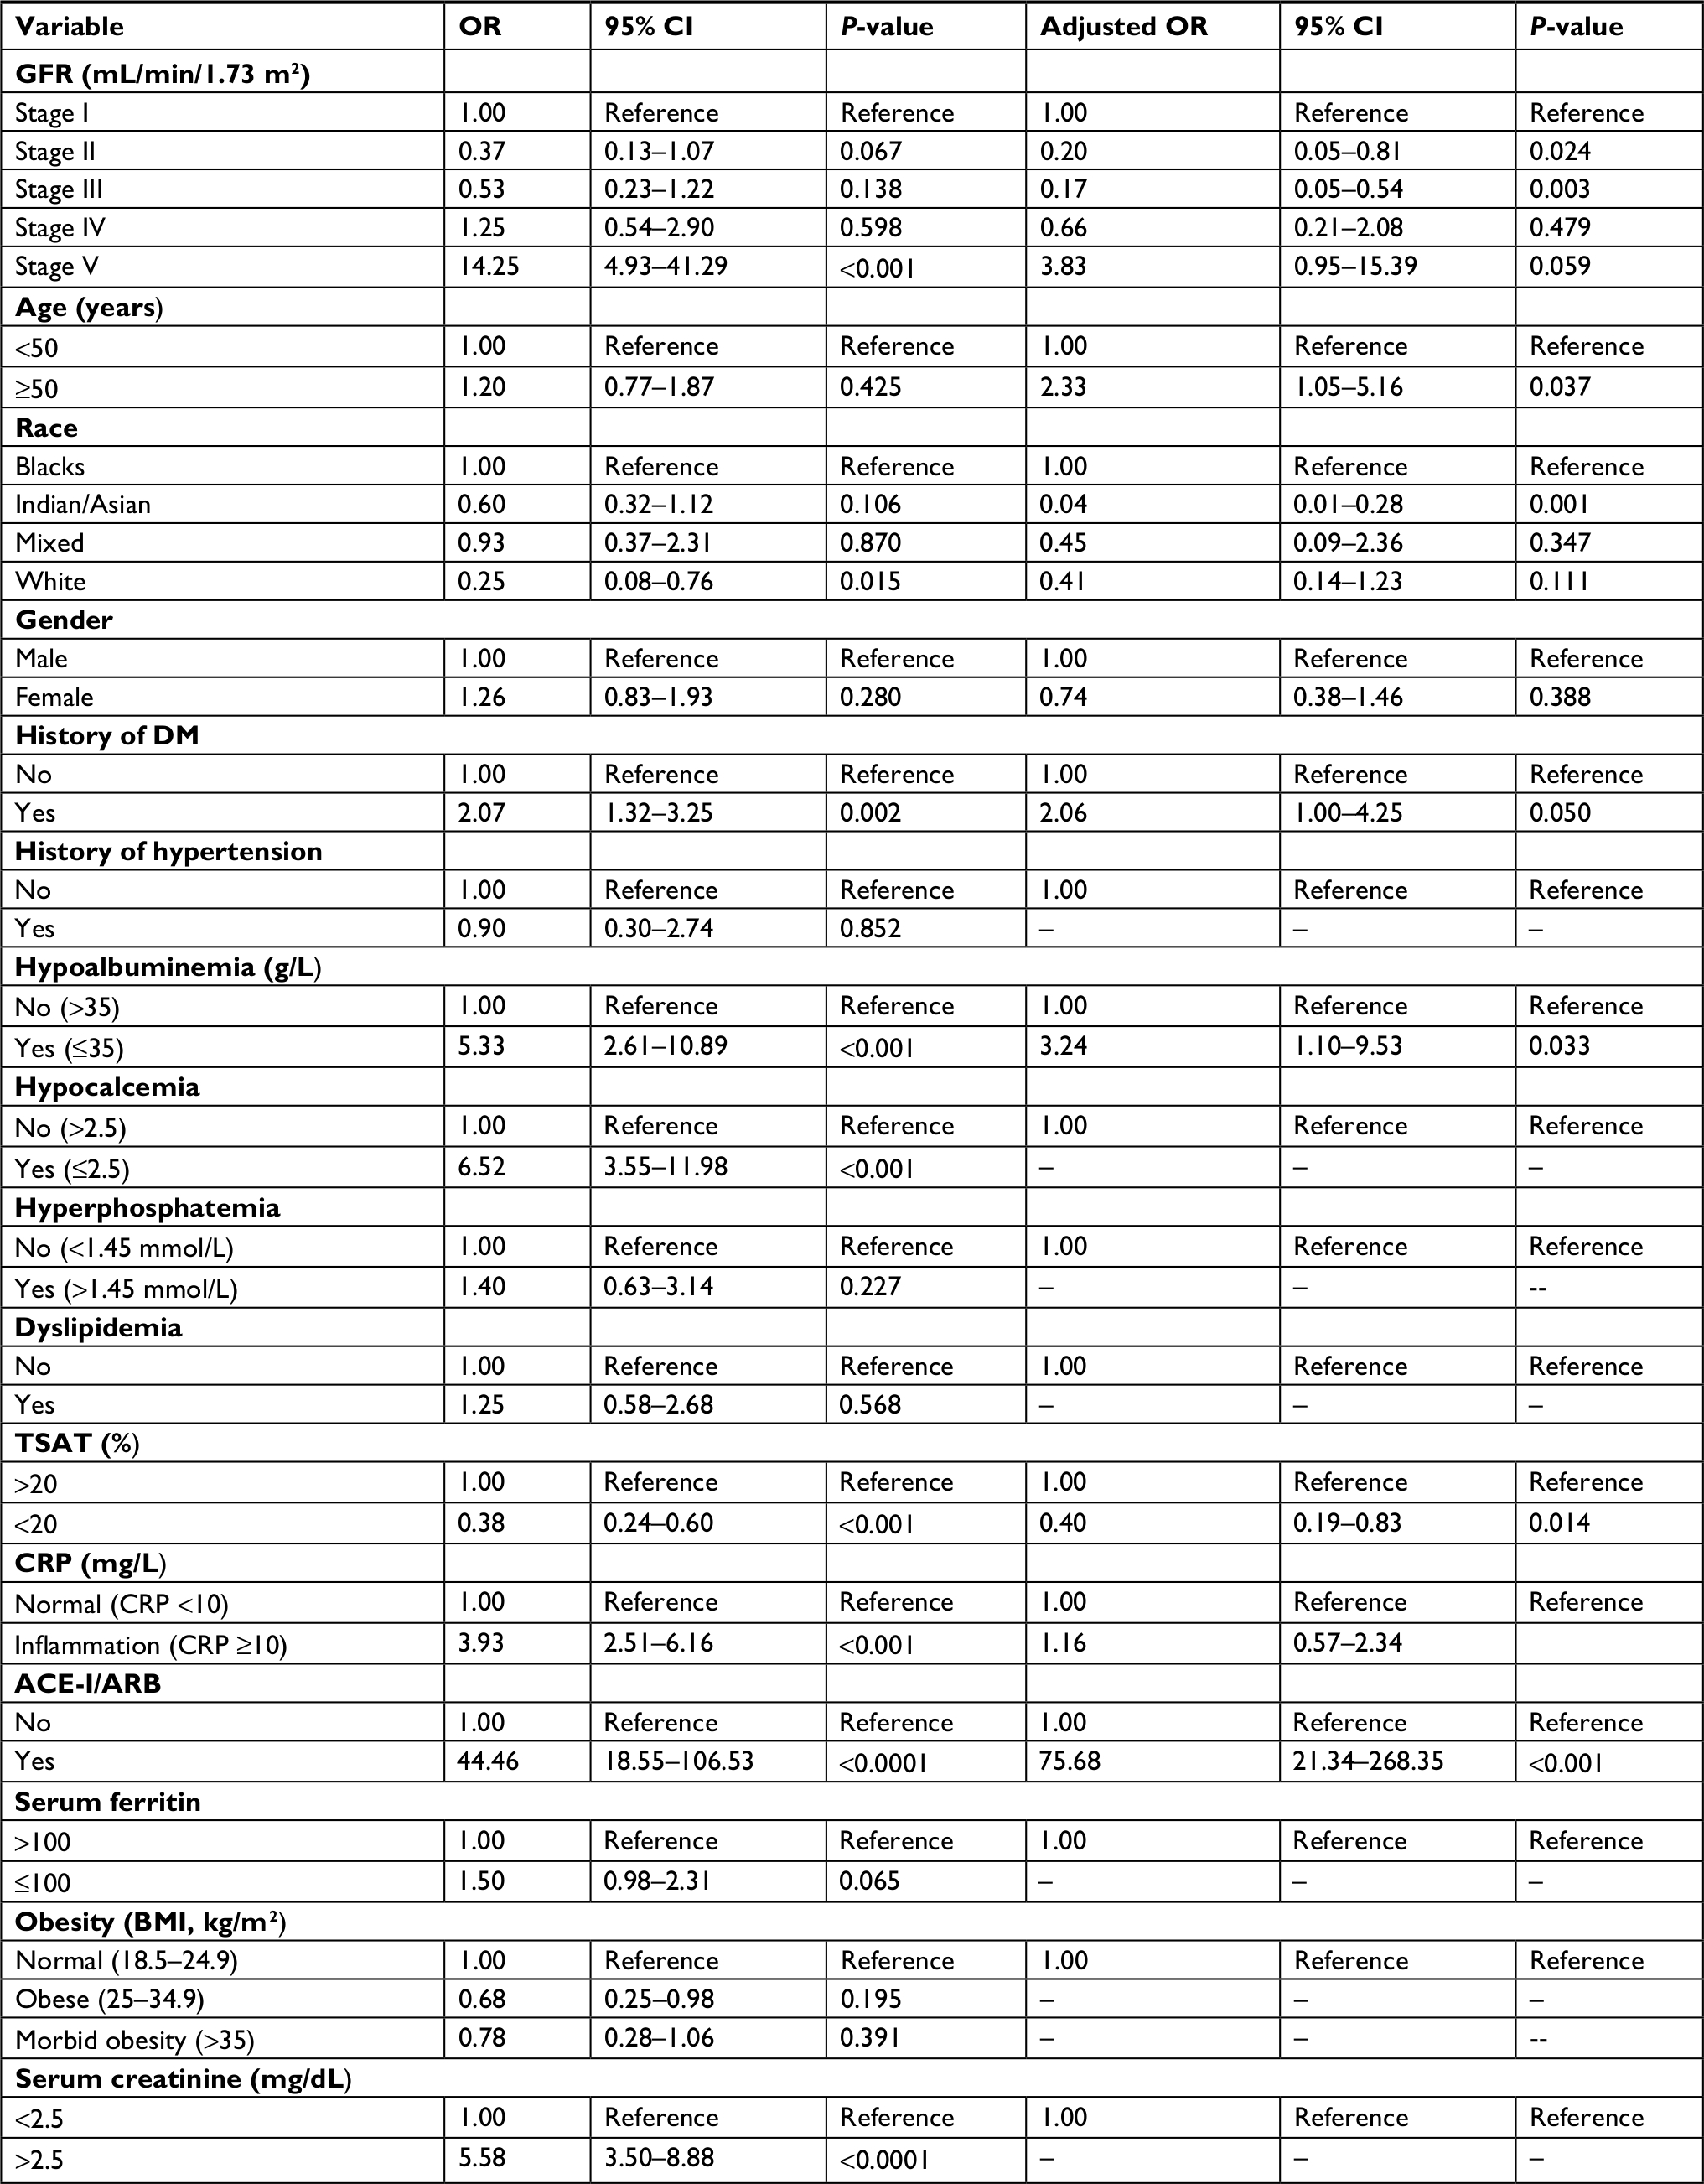 | Table 5 Predictors of anemia among chronic kidney disease patients Notes: Multivariable model corrected for stage of the disease, age, gender, history of DM, hypoalbuminemia, ACE-I/ARB use. Hosmer–Lemeshow chi-square =204.89 and its P-value =0.9939. Abbreviations: ACE-I, angiotensin-converting enzyme inhibitor use; ARB, angiotensin receptor blocker; BMI, body mass index; CRP, C-reactive protein; DM, diabetes mellitus; GFR, glomerular filtration rate; OR, odds ratio; TSAT, transferrin saturation. |
Although there was a fivefold increased odds of anemia among participants with inflammation (as defined by CRP levels) on univariable analysis, this relationship did not reach statistical significance after correcting for confounders in the multivariable model. Patients with hypoalbuminaemia had a threefold increased odds for anemia while those with lower TSAT were less likely to develop anemia (Table 5).
Based on the Hosmer–Lemeshow goodness of fit test (P-value =0.9939), the final model shows that the model fitted the data. Also, the area under the ROC curve of the final model was 86%, which showed that the final model highly discriminated anemia among the participants.
Discussion
Anemia is a major complication of CKD. It is also a risk factor for cardiovascular disease among CKD patients.23 While some studies from South Africa reported the prevalence of anemia in the healthy population,24 the prevalence of anemia in South African CKD patients is largely unknown. In this present study involving a multiethnic CKD population, almost half (43.18%, 95% CI: 38.1%–48.4%) of the study participants had anemia. As expected, our study showed a higher anemia prevalence as compared to the prevalence of 12.5% that was reported among the adult South African population.24 This prevalence of anemia is lower than previous reports from most LMICs that reported a prevalence of 75%–79% among CKD patients.25–28 A slightly higher anemia prevalence of 58.5% was reported among patients with CKD stages III–V in Catalonia.21,29 Furthermore, our study showed that the prevalence of anemia among South African CKD patients was twofold to threefold higher than the prevalence of anemia among CKD patients in the UK and the USA.30,31
In Singapore, a lower prevalence of anemia (35.4%) was reported among CKD patients by Lau et al,32 while in Nepal, similar to our study, a prevalence of 47.5% was reported.33 Geographical location (altitude), lifestyle, racial and genetic make-up may have played significant roles in the observed variations in the prevalence of anemia among our cohort of CKD patients as compared to CKD patients from other regions. The relatively lower prevalence of anemia among CKD patients in Johannesburg as compared to other LMICs may be related to the relatively increased level of access to health care services among CKD patients in South Africa. South African CKD patients have access to free medical care as compared to the majority of CKD patients from other developing countries that pay out of pocket for their medical services. The aforementioned suggest the need for global advocacy to design policies that will reduce the cost and burden of CKD on patients and their relatives. This can impact positively on prognostic factors such as anemia and thereby improve outcomes.
There was a marked ethnic variation in the prevalence of anemia in our study population with the black and mixed ethnic groups having a similarly high prevalence (45%–47%), while the whites and Indians/Asians had lower prevalence (18%–35%). This ethnic disparity in prevalence of anemia may be related to the general SES and dietary patterns of the ethnic groups. SES has been shown to be a predictor of nutritional status in several studies.34,35 Pathways through which SES may be associated with nutritional status include income, education, and occupation.36 Some studies conducted in developing counties are in agreement with our findings that low SES is associated with high prevalence of anaemia.37–39 Most of these studies were conducted in developing countries with limited sample size and were not on CKD patients. Our study revealed that almost half of our black cohort had low levels of education. The low educational attainment can be a proxy for low SES among them. The blacks are generally of a lower socioeconomic class mainly because of the deprivation that was suffered during the apartheid era. Moreover, the Indian/Asians’ vegetarian lifestyle might increase the rate of anemia among them, which was not a finding in this study; possible explanation could be that most of them may not be on strict vegetarian diet.17,40 Our observation also showed that tailored management may be necessary. Thus, in addition to routine CKD care, nutritional support may be more frequently indicated among the blacks and mixed-race South Africans as compared to the whites and Indian/Asians.
Although about four-fifths of our cohort of CKD patients had advanced CKD, almost half of the anemic patients had mild anemia. A similar predominance of mild anemia among CKD patients was also reported in other studies.28,41 In contrast to studies from both high-income countries and LMICs, the prevalence of anemia in our cohort did not increase linearly with increasing stages of CKD. Furthermore, we surprisingly found that the odds of anemia were lowest among stages II and III but higher among stages I and V CKD. A study conducted in the Kingdom of Saudi Arabia showed a similar prevalence pattern of anemia among pre-dialysis patients according to the stages of CKD with a prevalence of 42%, 33%, 48%, 71%, and 82%, respectively, among stages I–V CKD participants.28 The J-shaped pattern of the prevalence of inflammation among CKD stages was similar to the pattern of anemia across stages of CKD in this study, as there was a decreasing prevalence of inflammation (26.1%) in stage I to a nadir of 9.4% in stage III, followed by an abrupt rise in indicators of inflammation up till stage V (86.6%) among the majority of black participants. Furthermore, we found on univariable analysis that there was a fivefold increased odds of anemia among participants with inflammation. This may suggest a link between inflammation and anemia among CKD participants. From the foregoing, although the link between anemia and inflammation across CKD stages is poorly understood, our study further suggests that inflammatory processes may play a role in the development of anemia among CKD patients (and possibly across the stages of CKD) as shown in other studies.42,43
In the present study, the increased odds of anemia in CKD stage V is consistent with the findings from previous studies.27,28,44 For example, Lau et al have shown that in comparison with patients with CKD stage I, stage V CKD patients are more likely to develop anemia (OR 16.8).32
Anemia is believed to traditionally worsen with progressive decline in kidney function, as it is believed that erythropoietin production decreases as kidney function worsens.45 A few hypotheses may be proposed to partly explain the J-shaped pattern of anemia risk among varying stages of CKD patients as observed in our study participants. There may be some unrecognized perturbations that are responsible for this initial improvement in hemoglobin levels as kidney disease worsens from stage I to stage III before the eventual decline in hemoglobin concentrations from stage III to stage V. First, the initial inflammatory process in early stages of CKD may cause hyperstimulation of erythropoietin that then produces higher levels of hemoglobin.4,46 This mechanism may not be sustained with continuing deterioration of kidney function during the later stages of CKD, and hepcidin pathways and hypoxia inducible factors may play a role in this mechanism. Second, there might be aggressive management of anemia in the early stages of the disease, or patients may respond to the anemia treatment modalities (such as oral iron therapy and ESA) that are employed in the early stages of the disease, especially at stages I and II. Thus, patients may not respond properly to similar modalities of treatment at the later stages of the disease. Such intractable anemic states at the later stages may be related to poor nutritional status or there may be the need to employ parenteral erythropoietin therapy that may not be readily available for use at earlier stages. Thus, there may be the need to closely monitor anemia in all CKD patients as the disease progresses. Another hypothesis for the pattern of anemia progression with stages of kidney failure may be that there may be some unrecognized mechanisms that support hemoglobin concentration in stages II and III of CKD disease. All the aforementioned hypotheses still need further evaluation. Thus, CKD staging alone may not be wholly appropriate for screening or determination of the risk and severity of anemia among CKD patients.
GFR, gender, ethnicity, iron therapy, and other comorbidities such as DM were identified as risk factors of anemia among CKD patients by other researchers.32,47,48 However, some differences were observed in our study. Contrary to previous studies,31,48 we did not find a significant association between gender and development of anemia (P-value =0.6). McClellan et al found that female patients had higher odds of developing anemia.31 Similarly, Fishbane et al78 reported lower rates of IDA among adult men (57.8%–58.8%) as compared to women (69.9%–72.8%) with CKD stages III–V in the National Health and Nutrition Examination Survey (NHANESII [1988–1994] and 1999–2004 surveys).31,49
Our study tends to support the reports of previous researchers3,50 that increasing age is an independent risk factor for anemia among CKD patients, as we found that patients who were older than 50 years have double the risk of anemia as compared to younger patients. Thus, the process of aging may greatly contribute to poor outcomes of anemia in CKD patients. Older patients with anemia may also have intractable forms of anemia and should therefore be managed more intensively.
Consistent with previous studies, CKD patients with DM had a threefold increased risk of anemia (P=0.007).51,52 Thus, a high index of suspicion for anemia should be instituted among diabetic CKD patients to improve the outcomes in them. There is evidence that anemia is more severe and occurs at an earlier stage of kidney disease in patients with diabetes compared with non-diabetic patients;53,54 some studies suggest that renal abnormalities, possibly interstitial fibrosis may play a role in the pathophysiology of anemia in diabetes.53,55 Less well-known causes of anemia in diabetes may include interrelated mechanisms, such as ultrafiltration, proteinuria, chronic inflammation, damage of interstitial kidney tissue, autonomic nephropathy, uremic toxins, renin-angiotensin system, increased tubular sodium reabsorption, and disorders of erythrocytes have all been implicated in the pathogenic mechanism of anemia in diabetic patients.56–58 In this present study, smoking was not a predictor of anemia, but it was associated with increase in hemoglobin levels; this finding is in agreement with previous studies.59–61 Possible explanation for this finding is that cigarette smoking causes an upward shift of the hemoglobin distribution curve, which reduces the utility of hemoglobin levels to detect anemia; hence, it causes increased hemoglobin concentration, that is likely mediated by exposure to carbon monoxide.60 Furthermore, hypoalbuminemia was associated with anemia in our study, which is in agreement with the results of earlier studies in CKD and hemodialysis patients.62,63 Low serum albumin is used as a marker of inflammation, and the relationship between anemia and inflammation, and malnutrition was shown in several studies.64,65
Similar to previous studies, other predictors of anemia in our study participants include TSAT and hypocalcemia.8,66 In this study, hypocalcemia was a predictor of anemia among our cohort of CKD participants. This finding is in agreement with other researchers.67,68 Several mechanisms have been postulated to explain this observed relationship. For example, hyperphosphatemia in CKD can cause a decrease in vitamin D synthesis, which will result in hypocalcaemia, and elevated parathyroid hormone level (PTH).67,69,70 Elevated PTH, in turn, has been shown to directly inhibit erythropoiesis, induce hemolysis, and cause bone marrow fibrosis in CKD.71–73 Although serum PTH levels were not ascertained in our study, the mechanism underlying serum phosphorous, calcium, and anemia in CKD is still unclear.
In this study angiotensin-converting enzyme inhibitors (ACEIs), and angiotensin receptor blockers (ARBs) predicted anemia; this finding is in agreement with previous studies.74–76 The mechanism of action of ACEI and ARBs and their effect on hemoglobin levels in patients with kidney disease is still not well established. Possible mechanisms include interference with production of erythropoietin,75 modulation of multiple factors interacting with erythroid marrow progenitor;77 another mechanism may be that angiotensin 2 may increase the proliferation of erythroid progenitors, but not the progenitor of other cell lines, and ARB completely abolishes this effect. All these observations may suggest a possible inhibitory effect of these medications on the bone marrow.75,77 Further research is required to establish the exact mechanism of action of these medications.
In conclusion, we found that almost half of CKD participants were anemic which confirms that anemia is a leading comorbidity among CKD patients in Johannesburg. Also, the risk of anemia did not increase linearly with increasing degrees of renal deterioration, as was previously observed by other workers. Thus, CKD staging alone may not be appropriate for screening and monitoring of anemia. In addition, DM and calcium levels were strong predictors of anemia among CKD patients. Our study therefore highlights the need for personalized risk-based prevention and treatment strategies for anemia among CKD patients in low resource settings like ours. The relationship between the severity of kidney deterioration and anemia still needs further evaluation.
This study is not without limitations. Firstly, the cross-sectional design of the study limits us from being able to demonstrate causality between anemia and stages of CKD. As only one set of hemoglobin results was determined, trends and fluctuations in hemoglobin could not be monitored. Secondly, our study may not be generalizable to South African CKD patients, since the study was conducted in an urban setting of South Africa. Thirdly, we did not evaluate serum folate and vitamin B12 levels of our participants which might give more insight on the the nutritional status of the participants. Furthermore, vitamin D and PTHs were not evaluated in this study. Drug history of chronic use of non-steroidal anti-inflammatory drugs (NSAIDs) was not elicited. However, CKD patients in the hospital are generally counseled to avoid NSAIDs, since it can further worsen kidney function. Patients on oral iron and ESA therapy were excluded this study, which could affect the true prevalence of anemia in the studied population. Thus, we were unable to adequately stratify our patients by nutritional status. Despite these limitations, this study has contributed to the existing evidence on the prevalence of anemia across CKD stages in pre-dialysis CKD patients.
Acknowledgment
We would like to acknowledge the participants for participating in our study.
Disclosure
The authors report no conflicts of interest in this work.
References
Remuzzi G, Benigni A, Remuzzi A. Mechanisms of progression and regression of renal lesions of chronic nephropathies and diabetes. J Clin Invest. 2006;116(2):288–296. | ||
Ruggenenti P, Schieppati A, Remuzzi G. Progression, remission, regression of chronic renal diseases. Lancet. 2001;357(9268):1601–1608. | ||
Dmitrieva O, de Lusignan S, Macdougall IC, et al. Association of anaemia in primary care patients with chronic kidney disease: cross sectional study of quality improvement in chronic kidney disease (QICKD) trial data. BMC Nephrol. 2013;14:24. | ||
Lim VS, DeGowin RL, Zavala D, et al. Recombinant human erythropoietin treatment in pre-dialysis patients. A double-blind placebo-controlled trial. Ann Intern Med. 1989;110(2):108–114. | ||
Kausz AT, Khan SS, Abichandani R, et al. Management of patients with chronic renal insufficiency in the Northeastern United States. J Am Soc Nephrol. 2001;12(7):1501–1507. | ||
Bahrainwala J, Berns JS. Diagnosis of iron-deficiency anemia in chronic kidney disease. Semin Nephrol. 2016;36(2):94–98. | ||
Babitt JL, Lin HY. Mechanisms of anemia in CKD. J Am Soc Nephrol. 2012;23(10):1631–1634. | ||
Lorenz L, Arand J, Büchner K, et al. Reticulocyte haemoglobin content as a marker of iron deficiency. Arch Dis Child Fetal Neonatal Ed. 2015;100(3):F198–F202. | ||
Drüeke TB, Locatelli F, Clyne N, et al; CREATE Investigators. Normalization of hemoglobin level in patients with chronic kidney disease and anemia. N Engl J Med. 2006;355(20):2071–2084. | ||
Hsu CY, McCulloch CE, Curhan GC. Epidemiology of anemia associated with chronic renal insufficiency among adults in the United States: results from the Third National Health and Nutrition Examination Survey. J Am Soc Nephrol. 2002;13(2):504–510. | ||
Macdougall IC, Bock AH, Carrera F, et al; FIND-CKD Study Investigators. FIND-CKD: a randomized trial of intravenous ferric carboxymaltose versus oral iron in patients with chronic kidney disease and iron deficiency anaemia. Nephrol Dial Transplant. 2014;29(11):2075–2084. | ||
Rozen-Zvi B, Gafter-Gvili A, Paul M, Leibovici L, Shpilberg O, Gafter U. Intravenous versus oral iron supplementation for the treatment of anemia in CKD: systematic review and meta-analysis. Am J Kidney Dis. 2008;52(5):897–906. | ||
Leibbrandt M, Woolard I, Finn A, Argen J. Trends in South African income distribution and poverty since the fall of apartheid. 2010. Available from: https://www.oecd-ilibrary.org/social-issues-migration-health/trends-in-south-african-income-distribution-and-poverty-since-the-fall-of-apartheid_5kmms0t7p1ms-en. Accessed January 14, 2019. | ||
Jensen AR. The g Factor: The Science of Mental Ability. Westport, CT: Praeger; 1998. | ||
Williams DR. Race, socioeconomic status, and health. The added effects of racism and discrimination. Ann N Y Acad Sci. 1999;896(1):173–188. | ||
Woolard I. An Overview of Poverty and Inequality in South Africa. Unpublished briefing paper. Pretoria: HSRC; 2002. | ||
Yeo TJ, Yeo PS, Ching-Chiew Wong R, et al. Iron deficiency in a multi-ethnic Asian population with and without heart failure: prevalence, clinical correlates, functional significance and prognosis. Eur J Heart Fail. 2014;16(10):1125–1132. | ||
Pilis W, Stec K, Zych M, Pilis A. Health benefits and risk associated with adopting a vegetarian diet. Rocz Panstw Zakl Hig. 2014; 65(1):9–14. | ||
Egbujie BA. Relationship between socio-economic status and cardiovascular disease in black South Africans living in a rural and an urban community [thesis]. Cape Town: University of the Western Cape; 2012. | ||
Chobanian AV, Bakris GL, Black HR, et al. The seventh report of the joint national committee on prevention, detection, evaluation, and treatment of high blood pressure: the JNC 7 report. JAMA. 2003;289(19):2560–2571. | ||
Martínez-Castelao A, Górriz JL, Portolés JM, et al. Baseline characteristics of patients with chronic kidney disease stage 3 and stage 4 in Spain: the MERENA observational cohort study. BMC Nephrol. 2011;12:53. | ||
O’Callaghan CA, Shine B, Lasserson DS. Chronic kidney disease: a large-scale population-based study of the effects of introducing the CKD-EPI formula for eGFR reporting. BMJ Open. 2011;1(2):e000308. | ||
Valderrabano F, Golper T, Muirhead N, Ritz E, Levin A. Chronic kidney disease: why is current management uncoordinated and suboptimal? Nephrol Dial Trans. 2001;16(Suppl 7):61–64. | ||
Visser J, Herselman M, Janicker Visser MH. Anaemia in South Africa: the past, the present and the future. South Afr J Clin Nutr. 2013;26(4):166–167. | ||
Chinwuba Ijoma IU, Ijoma U. High prevalence of anemia in predialysis patients in Enugu, Nigeria. Nephrol Rev. 2010;2(14):5. | ||
Kaze FF, Kengne AP, Mambap AT, Halle MP, Mbanya D, Ashuntantang G. Anemia in patients on chronic hemodialysis in Cameroon: prevalence, characteristics and management in low resources setting. Afr Health Sci. 2015;15(1):253–260. | ||
Salman M, Khan AH, Adnan AS, et al. Prevalence and management of anemia in pre-dialysis Malaysian patients: a hospital-based study. Rev Assoc Méd Bras (1992). 2016;62(8):742–747. | ||
Shaheen FA, Souqiyyeh MZ, Al-Attar BA, et al. Prevalence of anemia in predialysis chronic kidney disease patients. Saudi J Kidney Dis Transpl. 2011;22(3):456–463. | ||
Cases-Amenós A, Martínez-Castelao A, Fort-Ros J, et al; Investigadores del Estudio Micenas I. Prevalence of anaemia and its clinical management in patients with stages 3-5 chronic kidney disease not on dialysis in Catalonia: MICENAS I study. Nefrologia. 2014;34(2):189–198. | ||
Bhimma R, Adhikari M, Asharam K, Connolly C. The spectrum of chronic kidney disease (stages 2–5) in KwaZulu-Natal, South Africa. Pediatr Nephrol. 2008;23(10):1841–1846. | ||
McClellan W, Aronoff SL, Bolton WK, et al. The prevalence of anemia in patients with chronic kidney disease. Curr Med Res Opin. 2004;20(9):1501–1510. | ||
Lau BC, Ong KY, Yap CW, Vathsala A, How P. Predictors of anemia in a multi-ethnic chronic kidney disease population: a case-control study. Springerplus. 2015;4:233. | ||
Poudel BBK, Bhart J. Prevalence and association of anaemia with CKD: a hospital based cross sectional study from Nepal. Biomed Res. 2012;1:1–5. | ||
Charlton KE, Rose D. Prevalence of household food poverty in South Africa: results from a large, nationally representative survey. Public Health Nutr. 2002;5(3):383–389. | ||
Wang Y. Cross-national comparison of childhood obesity: the epidemic and the relationship between obesity and socioeconomic status. Int J Epidemiol. 2001;30(5):1129–1136. | ||
Kimani-Murage EW, Kahn K, Pettifor JM, et al. The prevalence of stunting, overweight and obesity, and metabolic disease risk in rural South African children. BMC Public Health. 2010;10(1):158. | ||
Thankachan P, Muthayya S, Walczyk T, Kurpad AV, Hurrell RF. An analysis of the etiology of anemia and iron deficiency in young women of low socioeconomic status in Bangalore, India. Food Nutr Bull. 2007;28(3):328–336. | ||
Issaragrisil S, Kaufman DW, Anderson TE, et al. An association of aplastic anaemia in Thailand with low socioeconomic status. Aplastic Anemia Study Group. Br J Haematol. 1995;91(1):80–84. | ||
Animasahun BA, Temiye EO, Ogunkunle OO, Izuora AN, Njokanma OF. The influence of socioeconomic status on the hemoglobin level and anthropometry of sickle cell anemia patients in steady state at the Lagos University Teaching Hospital. Niger J Clin Pract. 2011;14(4):422–427. | ||
Mahajani K, Bhatnagar V. Comparative study of prevalence of anaemia in vegetarian and non vegetarian women of Udaipur City, Rajasthan. J Nutr Food Sci. 2015;S3:001. | ||
Meremo Aj MY, Matobogolo BM. Prevalence and predictors of anemia among patients presenting with kidney disease at the University of Dodoma Hospital in central Tanzania. Tanzania J Health Res. 2017;19(3):1–7. | ||
Lukaszyk E, Lukaszyk M, Koc-Zorawska E, Bodzenta-Lukaszyk A, Malyszko J. GDF-15, iron, and inflammation in early chronic kidney disease among elderly patients. Int Urol Nephrol. 2016;48(6):839–844. | ||
Michel Chonchol GL, Montagnana M, et al. Association of inflammation with anaemia in patients with chronic kidney disease not requiring chronic dialysis. Nephrol Dial Transplant. 2008;23(9):2879–2883. | ||
Mudiyammanavara RN Dhananjaya PE, Agarwal R. Cross-sectional study of anaemia in chronic kidney disease. Indian Journal of Basic and Applied Medical Research. 2015;4(2):414–9. | ||
Moore E, Bellomo R. Erythropoietin (EPO) in acute kidney injury. Ann Intensive Care. 2011;1(1):3. | ||
Silverberg DS, Wexler D, Iaina A, Schwartz D. The correction of anemia in patients with the combination of chronic kidney disease and congestive heart failure may prevent progression of both conditions. Clin Exp Nephrol. 2009;13(2):101–106. | ||
Stauffer ME, Fan T. Prevalence of anemia in chronic kidney disease in the United States. PLoS One. 2014;9(1):e84943. | ||
Kim JK, Baker LA, Seirawan H, Crimmins EM. Prevalence of oral health problems in U.S. adults, NHANES 1999–2004: exploring differences by age, education, and race/ethnicity. Spec Care Dentist. 2012;32(6):234–241. | ||
McFarlane SI, Chen SC, Whaley-Connell AT, et al; Kidney Early Evaluation Program Investigators. Prevalence and associations of anemia of CKD: Kidney Early Evaluation Program (KEEP) and National Health and Nutrition Examination Survey (NHANES) 1999–2004. Am J Kidney Dis. 2008;51(4 Suppl 2):S46–S55. | ||
Astor BC, Muntner P, Levin A, Eustace JA, Coresh J. Association of kidney function with anemia: the Third National Health and Nutrition Examination Survey (1988–1994). Arch Intern Med. 2002;162(12):1401–1408. | ||
Al-Khoury S, Afzali B, Shah N, Covic A, Thomas S, Goldsmith DJ. Anaemia in diabetic patients with chronic kidney disease-prevalence and predictors. Diabetologia. 2006;49(6):1183–1189. | ||
El-Achkar TM, Ohmit SE, McCullough PA, et al. Higher prevalence of anemia with diabetes mellitus in moderate kidney insufficiency: the Kidney Early Evaluation Program. Kidney Int. 2005;67(4):1483–1488. | ||
Deray G, Heurtier A, Grimaldi A, Launay Vacher V, Isnard Bagnis C. Anemia and diabetes. Am J Nephrol. 2004;24(5):522–526. | ||
McClellan WM, Flanders WD, Langston RD, Jurkovitz C, Presley R. Anemia and renal insufficiency are independent risk factors for death among patients with congestive heart failure admitted to community hospitals: a population-based study. J Am Soc Nephrol. 2002;13(7):1928–1936. | ||
Bosman DR, Winkler AS, Marsden JT, Macdougall IC, Watkins PJ. Anemia with erythropoietin deficiency occurs early in diabetic nephropathy. Diabetes Care. 2001;24(3):495–499. | ||
Pappa M, Dounousi E, Katopodis K. Pathophysiological mechanisms of anemia in diabetic nephropathy. Arch Hell Med. 2013;30(5):555–565. | ||
Mohanram A, Zhang Z, Shahinfar S, Keane WF, Brenner BM, Toto RD. Anemia and end-stage renal disease in patients with type 2 diabetes and nephropathy. Kidney Int. 2004;66(3):1131–1138. | ||
Keith DS, Nichols GA, Gullion CM, Brown JB, Smith DH. Longitudinal follow-up and outcomes among a population with chronic kidney disease in a large managed care organization. Arch Intern Med. 2004;164(6):659–663. | ||
Nordenberg D, Yip R, Binkin NJ. The effect of cigarette smoking on hemoglobin levels and anemia screening. JAMA. 1990;264(12):1556–1559. | ||
Shah B, Nepal A, Agrawal M, Sinha A. The effects of cigarette smoking on hemoglobin levels compared between smokers and non-smokers. Sunsari Tech Coll J. 2012;1(1):42–44. | ||
Tirlapur VG, Gicheru K, Charalambous BM, Evans PJ, Mir MA. Packed cell volume, haemoglobin, and oxygen saturation changes in healthy smokers and non-smokers. Thorax. 1983;38(10):785–787. | ||
Kaysen GA. Association between inflammation and malnutrition as risk factors of cardiovascular disease. Blood Purif. 2006;24(1):51–55. | ||
de Mutsert R, Grootendorst DC, Indemans F, et al. Association between serum albumin and mortality in dialysis patients is partly explained by inflammation, and not by malnutrition. J Ren Nutr. 2009;19(2):127–135. | ||
Selim G, Stojceva-Taneva O, Sikole A, et al. Association between haemoglobin level and all-cause mortality in haemodialysis patients: the link with inflammation and malnutrition. Prilozi. 2007;28(1):81–95. | ||
Qureshi AR, Alvestrand A, Divino-Filho JC, et al. Inflammation, malnutrition, and cardiac disease as predictors of mortality in hemodialysis patients. J Am Soc Nephrol. 2002;13(Suppl 1):S28–S36. | ||
Eguchi A, Tsuchiya K, Tsukada M, Nitta K. [Clinical usefulness of reticulocyte hemoglobin equivalent (RET-He) in patients at the pre-dialysis stage and in patients on peritoneal dialysis]. Nihon Jinzo Gakkai Shi. 2010;52(2):132–140. Japanese. | ||
Boronat M, Santana Á, Bosch E, Lorenzo D, Riaño M, García-Cantón C. Relationship between anemia and serum concentrations of calcium and phosphorus in advanced non-dialysis-dependent chronic kidney disease. Nephron. 2017;135(2):97–104. | ||
Tran L, Batech M, Rhee CM, et al. Serum phosphorus and association with anemia among a large diverse population with and without chronic kidney disease. Nephrol Dial Transplant. 2016;31(4):636–645. | ||
Ix JH, de Boer IH, Peralta CA, et al. Serum phosphorus concentrations and arterial stiffness among individuals with normal kidney function to moderate kidney disease in MESA. Clin J Am Soc Nephrol. 2009;4(3):609–615. | ||
Palmer SC, Hayen A, Macaskill P, et al. Serum levels of phosphorus, parathyroid hormone, and calcium and risks of death and cardiovascular disease in individuals with chronic kidney disease: a systematic review and meta-analysis. JAMA. 2011;305(11):1119–1127. | ||
Bogin E, Massry SG, Levi J, Djaldeti M, Bristol G, Smith J. Effect of parathyroid hormone on osmotic fragility of human erythrocytes. J Clin Invest. 1982;69(4):1017–1025. | ||
Rao DS, Shih M-Shu, Mohini R. Effect of serum parathyroid hormone and bone marrow fibrosis on the response to erythropoietin in uremia. New Engl J Med. 1993;328(3):171–175. | ||
Meytes D, Bogin E, Ma A, Dukes PP, Massry SG. Effect of parathyroid hormone on erythropoiesis. J Clin Invest. 1981;67(5):1263–1269. | ||
Pratt MC, Lewis-Barned NJ, Walker RJ, Bailey RR, Shand BI, Livesey J. Effect of angiotensin converting enzyme inhibitors on erythropoietin concentrations in healthy volunteers. Br J Clin Pharmacol. 1992;34(4):363–365. | ||
Ajmal A, Gessert CE, Johnson BP, Renier CM, Palcher JA. Effect of angiotensin converting enzyme inhibitors and angiotensin receptor blockers on hemoglobin levels. BMC Res Notes. 2013;6:443. | ||
Kamper AL, Nielsen OJ. Effect of enalapril on haemoglobin and serum erythropoietin in patients with chronic nephropathy. Scand J Clin Lab Invest. 1990;50(6):611–618. | ||
Mrug M, Stopka T, Julian BA, Prchal JF, Prchal JT. Angiotensin II stimulates proliferation of normal early erythroid progenitors. J Clin Invest. 1997;100(9):2310–2314. | ||
Fishbane S, Pollack S, Feldman HI, Joffe MM. Iron indices in chronic kidney disease in the National Health and Nutritional Examination Survey 1988–2004. Clinical Journal of the American Society of Nephrology. 2009;4(1):57–61. |
Supplementary materials
 | Table S1 Distribution of anemia and its parameters among different stages of chronic kidney disease in mixed race South Africans Notes: aANOVA; bFisher’s exact test; cPearson’s chi-squared test. Abbreviations: CRP, C-reactive protein; MCH, mean corpuscular hemoglobin; MCHC, mean corpuscular hemoglobin concentration; MCV, mean corpuscular volume. |
 | Table S2 Distribution of anemia and its parameters among different stages of chronic kidney disease in Indian/Asian South Africans Note: aANOVA; bFisher’s exact test; cPearson’s chi-squared test. Abbreviations: CRP, C-reactive protein; MCH, mean corpuscular hemoglobin; MCHC, mean corpuscular hemoglobin concentration; MCV, mean corpuscular volume. |
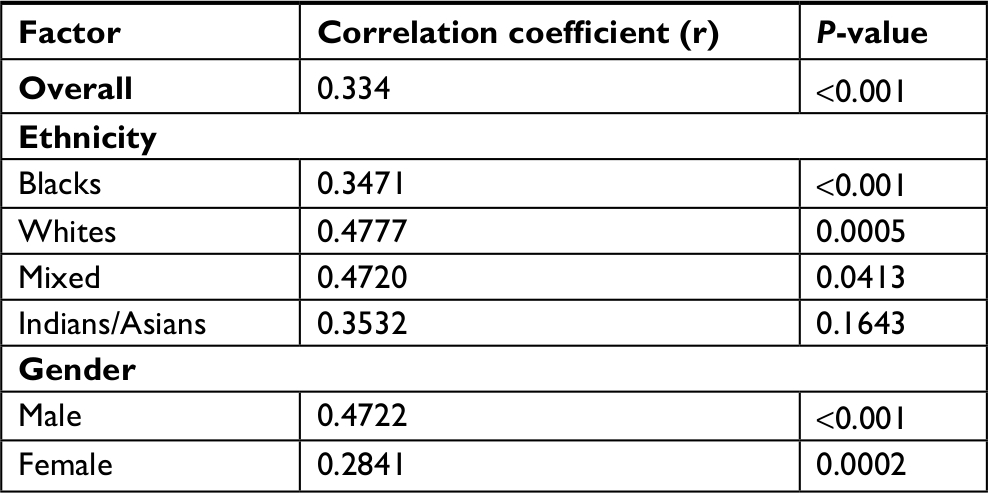 | Table S3 Correlation between hemoglobin levels and glomerular filtration rates among chronic kidney disease patients in Johannesburg by ethnicity and gender |
 © 2019 The Author(s). This work is published and licensed by Dove Medical Press Limited. The full terms of this license are available at https://www.dovepress.com/terms.php and incorporate the Creative Commons Attribution - Non Commercial (unported, v3.0) License.
By accessing the work you hereby accept the Terms. Non-commercial uses of the work are permitted without any further permission from Dove Medical Press Limited, provided the work is properly attributed. For permission for commercial use of this work, please see paragraphs 4.2 and 5 of our Terms.
© 2019 The Author(s). This work is published and licensed by Dove Medical Press Limited. The full terms of this license are available at https://www.dovepress.com/terms.php and incorporate the Creative Commons Attribution - Non Commercial (unported, v3.0) License.
By accessing the work you hereby accept the Terms. Non-commercial uses of the work are permitted without any further permission from Dove Medical Press Limited, provided the work is properly attributed. For permission for commercial use of this work, please see paragraphs 4.2 and 5 of our Terms.